Article

Evaluation of GPM IMERG V05B and TRMM 3B42V7 Precipitation Products over High Mountainous Tributaries in Lhasa with Dense Rain Gauges

1
State Key Laboratory of Hydrology-Water Resources and Hydraulic Engineering, Hohai University, Nanjing 210098, China
2
College of Hydrology and Water Resources, Hohai University, Nanjing 210098, China
*
Author to whom correspondence should be addressed.
Remote Sens. 2019, 11(18), 2080; https://doi.org/10.3390/rs11182080
Submission received: 6 August 2019 / Revised: 2 September 2019 / Accepted: 3 September 2019 / Published: 5 September 2019
(This article belongs to the Special Issue Satellite Derived Global Atmosphere Product Validation/Evaluation)

Abstract

:
In most Asian high mountain areas, ground-based observations of precipitation are sparse. It is urgent to assess and apply satellite precipitation products (SPPs). In recent years, relatively dense rain gauges have been established in five tributaries in Lhasa. Therefore, based on high-density rain gauges, two SPPs (GPM IMERG V05B, TRMM 3B42V7) were evaluated at the grid, region, and time scales with different statistical indices in the five tributaries. Besides, the dependence of SPPs performances on the precipitation intensities, elevation, and slope was investigated. The results indicate that: (1) both 3B42V7 and IMERG showed similarly low correlation with rain gauges at daily scale and high correlation at monthly scale, but 3B42V7 tended to suffer from systematic overestimation of monthly precipitation; (2) IMERG product outperformed 3B42V7 except for obvious overestimation of trace precipitation (0.1~1 mm day−1) and underestimation of torrential precipitation (>50 mm day−1); (3) the precipitation over the five tributaries showed significant spatial variability with difference of characteristic values (e.g., average daily precipitation) more than 20% in some IMERG grids and most 3B42V7 grids; (4) elevation had an obvious effect on the accuracy of 3B42V7 and IMERG, and the accuracy of the two SPPs decreased significantly with the increase of elevation.

1. Introduction

Precipitation plays an important role in hydrological and meteorological applications [1]. The change of precipitation in mountainous areas directly affects the development of local agriculture and ecological environment [2,3]. Moreover, the heavy precipitation events in mountainous areas often form flash floods [4]. Therefore, high-precision precipitation information in mountainous areas is of great significance to the sustainable development of local agriculture, the protection of the ecological environment, and the scientific decision of water affairs [5]. Rain gauge observation could provide a relatively accurate method for point-based precipitation measurement. However, gauges in mountainous regions are often sparse, uneven, and sometimes not available [2,6,7]. Thus, in the applications that need high spatiotemporal resolution precipitation data, such as flood disaster forecasts, gauge data are often not sufficient [8,9].
In recent decades, satellite precipitation products (SPPs) provide an alternative to gauge-based precipitation estimates [10,11,12,13]. A series of relatively high spatiotemporal resolutions SPPs, such as Precipitation Estimation from Remotely Sensed Information using Artificial Neural Networks (PERSIANN) [14], National Oceanic and Atmospheric Administration/Climate Prediction Center (NOAA/CPC) morphing technique (CMORPH) [15,16], Tropical Rainfall Measuring Mission (TRMM) Multi-satellite Precipitation Analysis (TMPA) [17] and so on, are widely used in previous studies. Among them, TMPA 3B42V7 precipitation product is superior to other products, especially in estimating extreme precipitation events in several areas around the world [18,19,20]. The TMPA Version-7 offers quasi-global coverage (50°N–50°S) precipitation estimates at a high spatial resolution of 0.25°×0.25° and temporal resolution of 3 hours [21]. Global Precipitation Measurement (GPM) mission, as the successor of TRMM, was launched in February 2014. Compared with TRMM, the abilities of GPM to detect trace precipitation and solid precipitation are improved by carrying spaceborne dual-frequency precipitation radar [22]. Furthermore, the GPM Core Observatory carrying a conical scanning multichannel microwave imager offers a wider measurement range [23]. The newly released IMERG further expands quasi-global coverage from 50°N–50°S to 60°N–60°S and provides precipitation estimates with a finer spatial resolution of 0.1°×0.1° and temporal resolution of 30 minutes [24].
The performance of these SPPs in hydrological applications varies from region to region because errors of different products depend significantly on the retrieval algorithms, instrument characteristics, orbit geometry, atmospheric conditions, and topography conditions (plain or mountainous) [3,25,26,27]. To date, several studies have been evaluated comparing IMERG and TMPA precipitation products with reference to the gauge observations in different topographic or climatic regions. Most of the studies showed that the performances of IMERG products are generally better than TMPA in several regions, such as in Iran [28], Mainland China [29], Far-East Asia [30], the upper Mekong River basin [31], Titicaca, Poopó, Desaguadero, and Salar system (TDPS) watershed of Bolivian [32], and India [33]. Beria et al. [33] discovered that IMERG outperforms 3B42V7, and the accuracy of 3B42V7 declines obviously with the elevation increasing compared to IMERG in India. However, in some mountainous areas with varied topography, no obvious advantages have been discovered in IMERG, or the 3B42V7 even outperforms IMERG, such as in Hexi region located in the northeastern Tibetan Plateau [34], the Chindwin River basin in Myanmar [1], the wet Amazon region, and the La Plata watersheds of Bolivian [32]. Frédéric et al. [32] revealed that over the La Plata river watershed, 3B42V7 highly outperforms IMERG during the wet season, and precipitation estimates from IMERG are more influenced by local relief than 3B42V7. The topography is a well-known factor influencing SPPs, and usually, SPPs are more biased in mountainous regions than in relatively flat regions [35,36,37].
Over the Tibetan Plateau, errors of SPPs in precipitation estimation are unavoidable due to the indirect measurement, lack of high-quality microwave data, and accurate algorithms in areas distinguished by unique height, complex topography, cold land temperatures, covered in snow and ice [2,38]. Over the Tibetan Plateau, Tang et al. [39] showed that GPM dual-frequency precipitation radar data solve the problem of precipitation overestimates in some grids with high elevation compared with the TRMM precipitation radar data; Zhang et al. [40] concluded that IMERG is superior to 3B42V7 on multiple timescales; Ma et al. [41] found that IMERG displays appreciably lower errors and better correlations than 3B42V7, but the probability of detection (POD) of IMERG is lower than 3B42V7 in region of elevation above 4200m; Xu et al. [42] revealed that assessment indices, such as relative bias (BIAS) and root mean square error (RMSE), from 3B42V7, are obviously related to the variation of topography but similar correlations are not found in IMERG, and 3B42V7 performs better than IMERG in low-elevation regions.
However, SPPs evaluations are limited due to sparse rain gauges on the whole Tibetan Plateau [40,41,42]. Few studies have concentrated on the evaluation of 3B42V7 and IMERG products in a mountain valley or inside a pixel to show whether a pixel value represents the overall situation of the domain. In this study, we focused on five tributaries in Lhasa, which are typical plateau mountain regions [43]. High-density rain gauges in the five tributaries can provide special resources for ground validation and evaluation of SPPs. The purpose of this study was to cross-evaluate the performance of precipitation estimates from TMPA 3B42V7 and IMERG Final run V05B precipitation products, against gauge observations, over high mountainous tributaries in Lhasa. First, IMERG and 3B42V7 were evaluated and compared at the grid, region, and time scales. Second, the effects of precipitation intensity, elevation, and slope on the accuracy of 3B42V7 and IMERG were compared and analyzed. Our results would help algorithm developers further improve the precipitation retrieval algorithms of IMERG and 3B42V7.

2. Materials and Methods
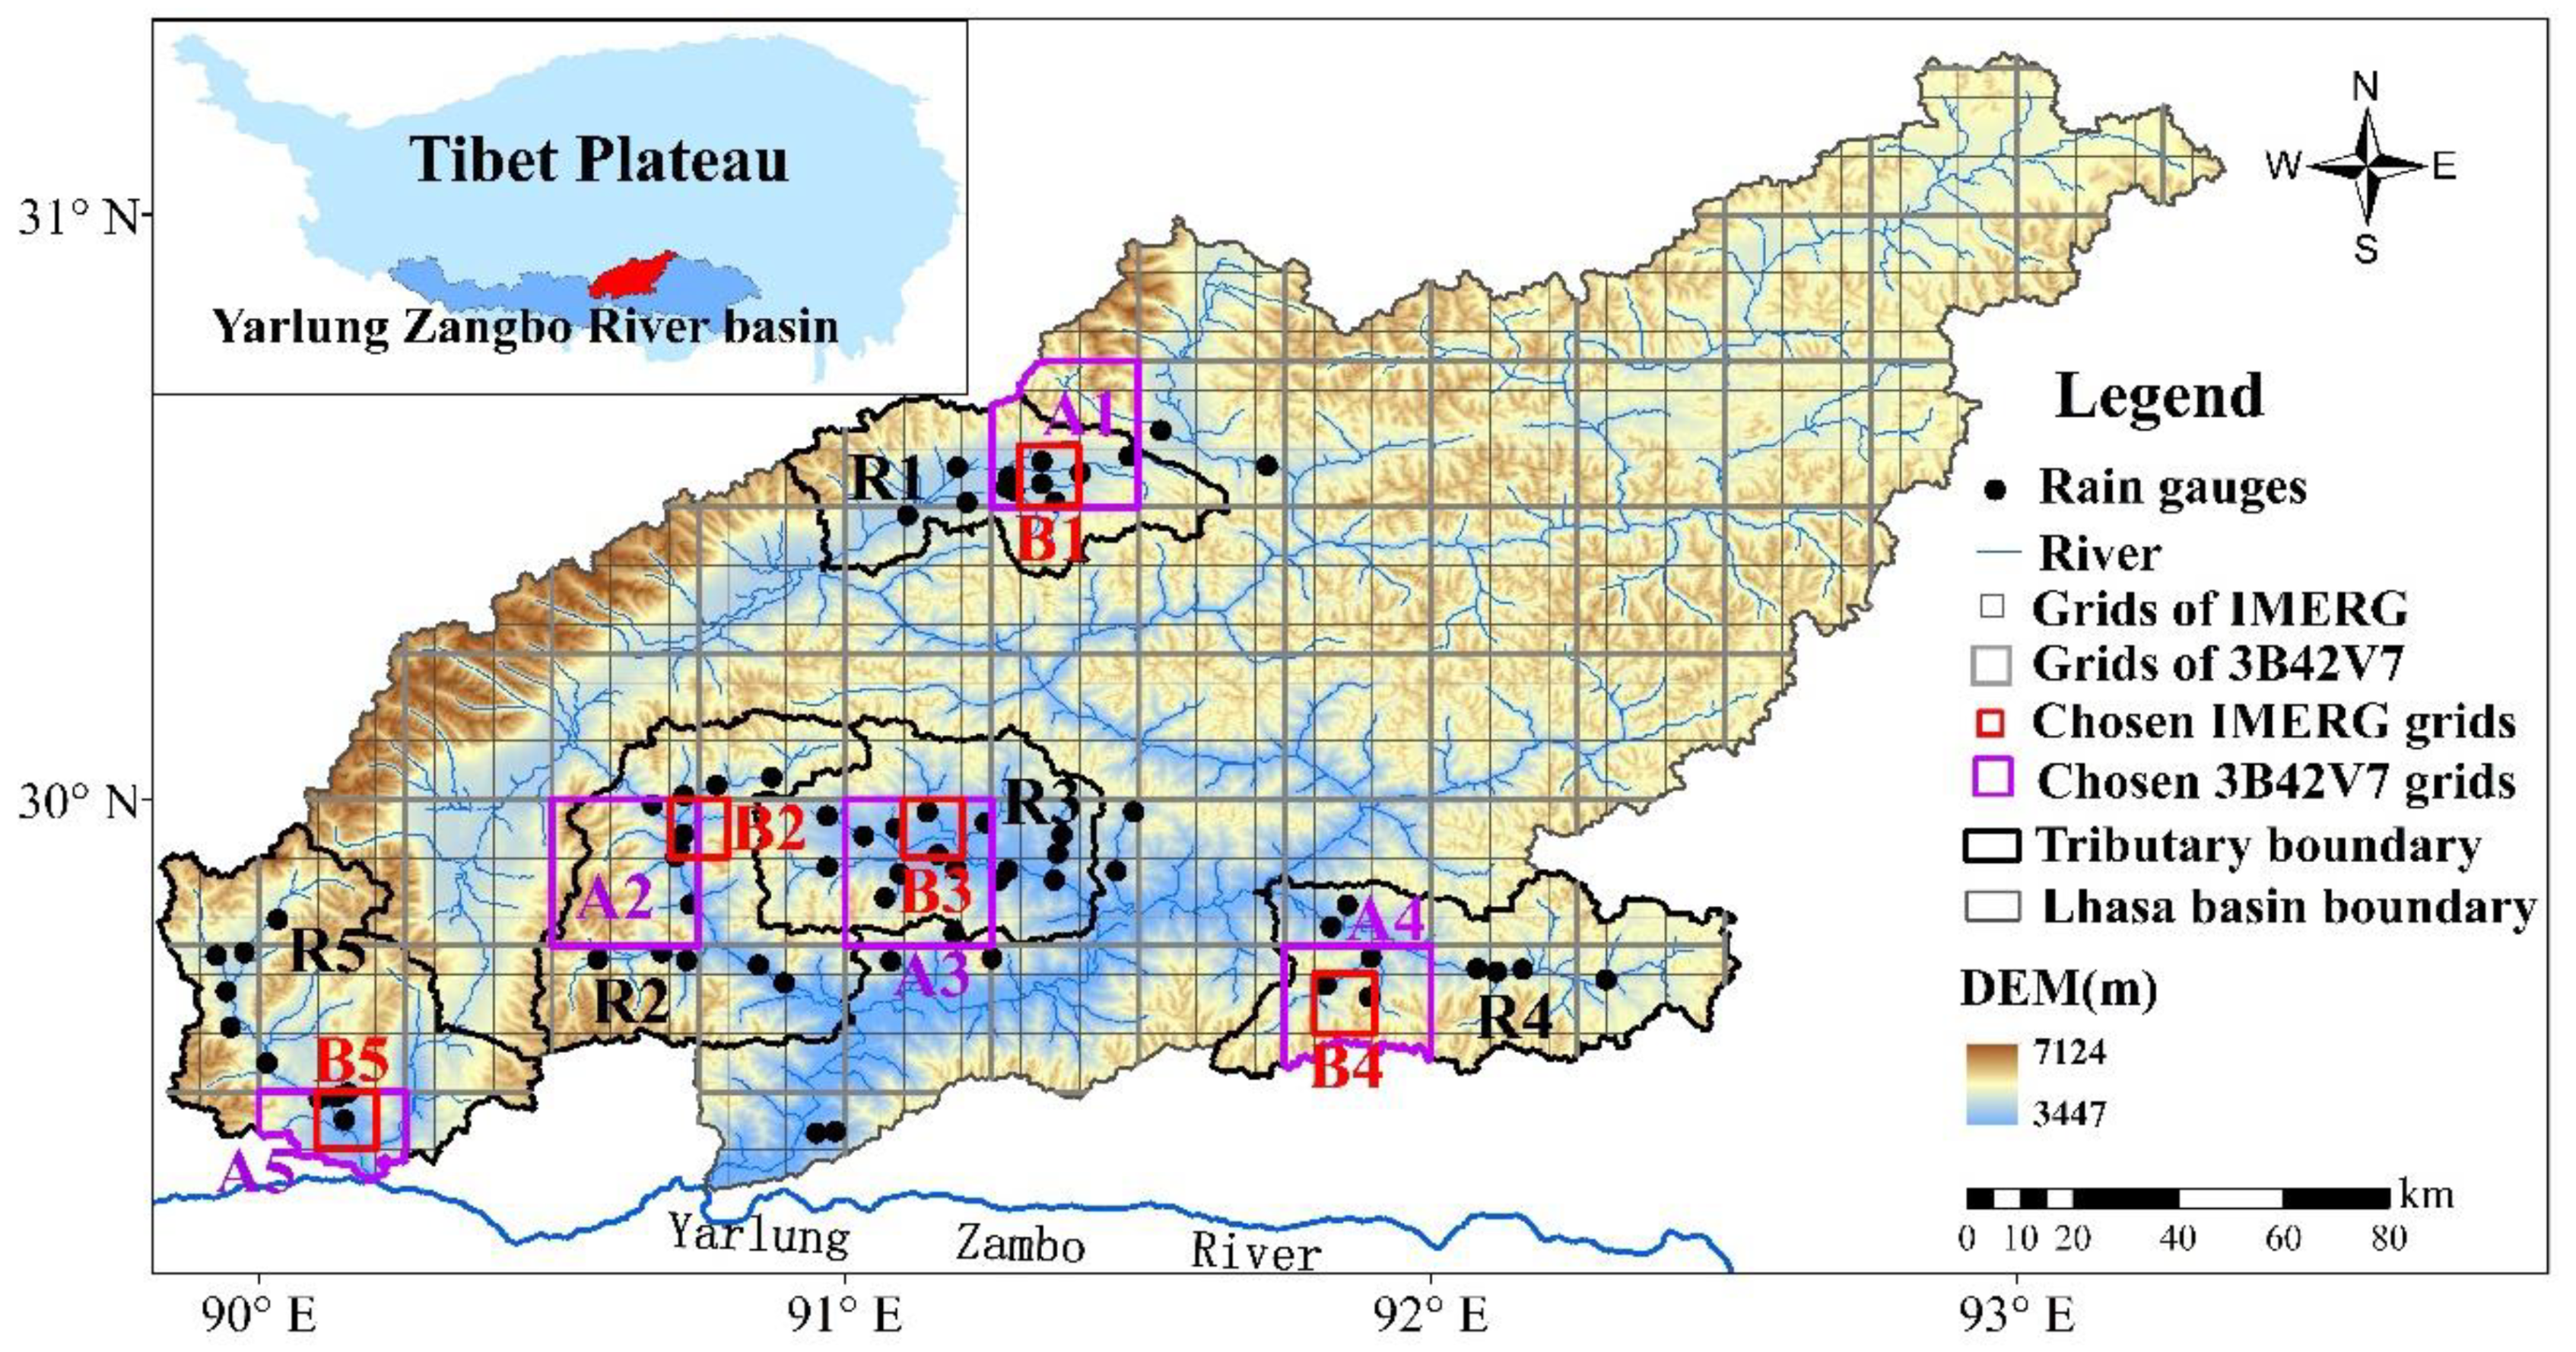
2.1. Study Area

This study was conducted in five tributaries (respectively, named as R1, R2, R3, R4, and R5) located in the south of the Tibetan Plateau (Figure 1). R1, R2, R3, R4 are tributaries of the Lhasa River and R5 named Nimumaqu River is a tributary of the Yarlung Zangbo River. The study area is of high elevation, and the topography varies greatly.
The Lhasa River is a major branch of the Yarlung Zangbo River, originates from the southern foot of the Nyaiqentanglha Mountain [44]. The river is about 568 km long, and its drainage area is 32,588 km2 [44]. The topography is characterized by the transition from riverbeds to valley slopes. The basin has a typical continental plateau semi-arid frigid climate regime with a mean annual temperature of about 5.3 °C and the mean annual precipitation of about 500 mm [45]. The intra-annual distribution of precipitation is extremely uneven, with more than 85% of the annual precipitation distributed between June and September [43,46,47].
The Nimumaqu River originating from the Qiongmugangfeng in the Nimu county, Lhasa city, is an important tributary of the Yarlung Zangbo River. The river is about 83 km long with an area of 2378 km2 and flows into the Yarlung Zangbo River in the south Luomai village.

2.2. Data

2.2.1. Ground Data

Six-hourly precipitation data of 67 rain gauges were obtained from the Bureau of Hydrological and Water Resources of Tibet Autonomous Region (Figure 1). Among these rain gauges, 11 rain gauges are distributed in R1, 13 rain gauges in R2, 15 rain gauges in R3, 9 rain gauges in R4, and 10 rain gauges in R5. It is significant to emphasize that the rain gauge network used in this paper is not included in the Global Precipitation Climatology Center (GPCC) network [40]. To ensure the high-quality of the rain gauge data, we applied a strict data quality control procedure that includes an internal consistency check and an extreme value check, developed by Shen and Xiong [48]. Considering that IMERG Final Run V05B precipitation product has been released since March 12th, 2014, and snowfall causes erroneous records in rain gauges, especially when snowfall accounts for a large proportion of precipitation [49], the evaluation period was determined to be warm seasons (from April 1st to September 30th) from 2014 to 2017.

2.2.2. Satellite Precipitation Products

In this study, two types of satellite precipitation products, namely, the post-real-time version 7 TMPA 3B42 three-hourly precipitation product (hereafter 3B42V7) and Final Run V05B IMERG 30-minutes precipitation product, named as “3IMERGHH” (hereafter IMERG), during the period of April 1st to September 30th, 2014–2017 were acquired from the National Aeronautics and Space Administration (NASA) website (http://pmm.nasa.gov). More detail information of 3B42V7 and IMERG is obtainable in [21,24]. Before accumulating the dataset to daily and monthly precipitation, both 3B42V7 and IMERG were converted from UTC 0 to UTC 8 to unify the time with the study area [34]. Besides, we only accumulated 30-minutes IMERG data set to six-hourly precipitation to evaluate IMERG at six-hourly scale. For 3B42V7, we could not accumulate three-hourly 3B42V7 data set to six-hourly precipitation without interpolation because the local time is ahead of world coordinated time by 8 hours, i.e., not an integral multiple of 3 hours, and interpolation will inevitably introduce errors. Thus, the same thing was not done for 3B42V7.

2.3. Method

2.3.1. Scale Handling of Rain Gauges and Pixels and Classification of Precipitation Events

In this study, the different spatial resolutions of the 3B42V7 and IMERG products (0.25° and 0.1°) was ignored, and a method of point-to-pixel evaluation between the rain gauge and gridded satellite data were adopted. The precipitation data from each satellite precipitation product (SPP) were extracted according to the locations of gauges to generate pairings of satellite-gauge data for cross-evaluation.
Five 3B42V7 grids (namely A1, A2, A3, A4, and A5) and five IMERG grids (namely B1, B2, B3, B4, and B5) were chosen from five tributaries to analyze whether the pixel values of 3B42V7 and IMERG could represent the overall situation of their corresponding grid boxes. Each chosen 3B42V7 grid should contain at least three rain gauges, and each chosen IMERG grid should contain at least two rain gauges. Besides, rain gauges distributed in each chosen IMERG grid were also distributed respectively in the same 3B42V7 grid. Based on the above conditions, we tried to choose the grid that contains the most gauges. We used rain gauges in the grid of B1, B2, B3, B4, and B5 to evaluate and compare the accuracy of IMERG and 3B42V7 at the grid-scale. Characteristic values during the period of April 1st to September 30th, 2014–2017, such as the number of precipitation days, average precipitation in precipitation days, and average daily precipitation, were analyzed. The chosen grids are shown in Figure 1.
We divided daily precipitations into four categories (with five ranks). Light precipitation, defined as 0.1~10 mm day−1; moderate precipitation, defined as 10~25 mm day−1; heavy precipitation, defined as 25~50 mm day−1; torrential precipitation, defined as daily precipitation greater than 50 mm. Besides, the trace precipitation of 0.1~1 mm day−1 was separated from light precipitation. Wang et al. [50] also used a similar classification of daily precipitations.
Then, the study adopted the method of linear regression to analyze the influence of topographic features on the accuracy of SPPs, and set significance level at 0.05. The equation and regression coefficient were tested, and the value of p ≤ 0.05 was considered statistically significant [51,52].

2.3.2. Statistical Metrics for Evaluating Satellite Precipitation Products

Four continuous statistical indices were used as follows to cross-evaluate 3B42V7 and IMERG precipitation estimates. The Pearson correlation coefficient (CC) reflects the consistency between SPP and gauge observations. The RMSE measures the deviation between the SPP and gauge observations. The mean absolute error (MBE) simply describes the average difference between the SPP and gauge observations. The BIAS indicates the systematic bias of SPP.
Besides, four categorical statistical indices were adopted as follows to assess the ability of SPP in describing precipitation/no precipitation events. The POD is the ratio of precipitation occurrences correctly detected to the total number of observed precipitation events. The false alarm ratio (FAR) is the ratio of precipitation occurrences falsely alarmed to the total number of detected precipitation events. The frequency bias index (FBI) indicates whether the dataset tends to overestimate (FBI>1) or underestimate (FBI<1) precipitation events. Equitable threat score (ETS) shows comprehensive prediction capability of SPP. Table 1 presents the formulas and perfect values of these metrics, and there are more details obtainable in [35,53]. Besides, precipitation of 0.1 mm day−1 was selected as the threshold of the precipitation event.
The probability distribution functions in both precipitation occurrence (PDFc) and precipitation volume (PDFv) under different precipitation-rate ranks were used to provide details about the frequency of precipitation events [54]. PDFc is the percentage of the number of detected events under a specific precipitation-rate rank, while PDFv is the percentage of accumulative precipitation accordingly. These metrics were widely used in previous studies to evaluate SPPs [40,42,54,55,56].

3. Results

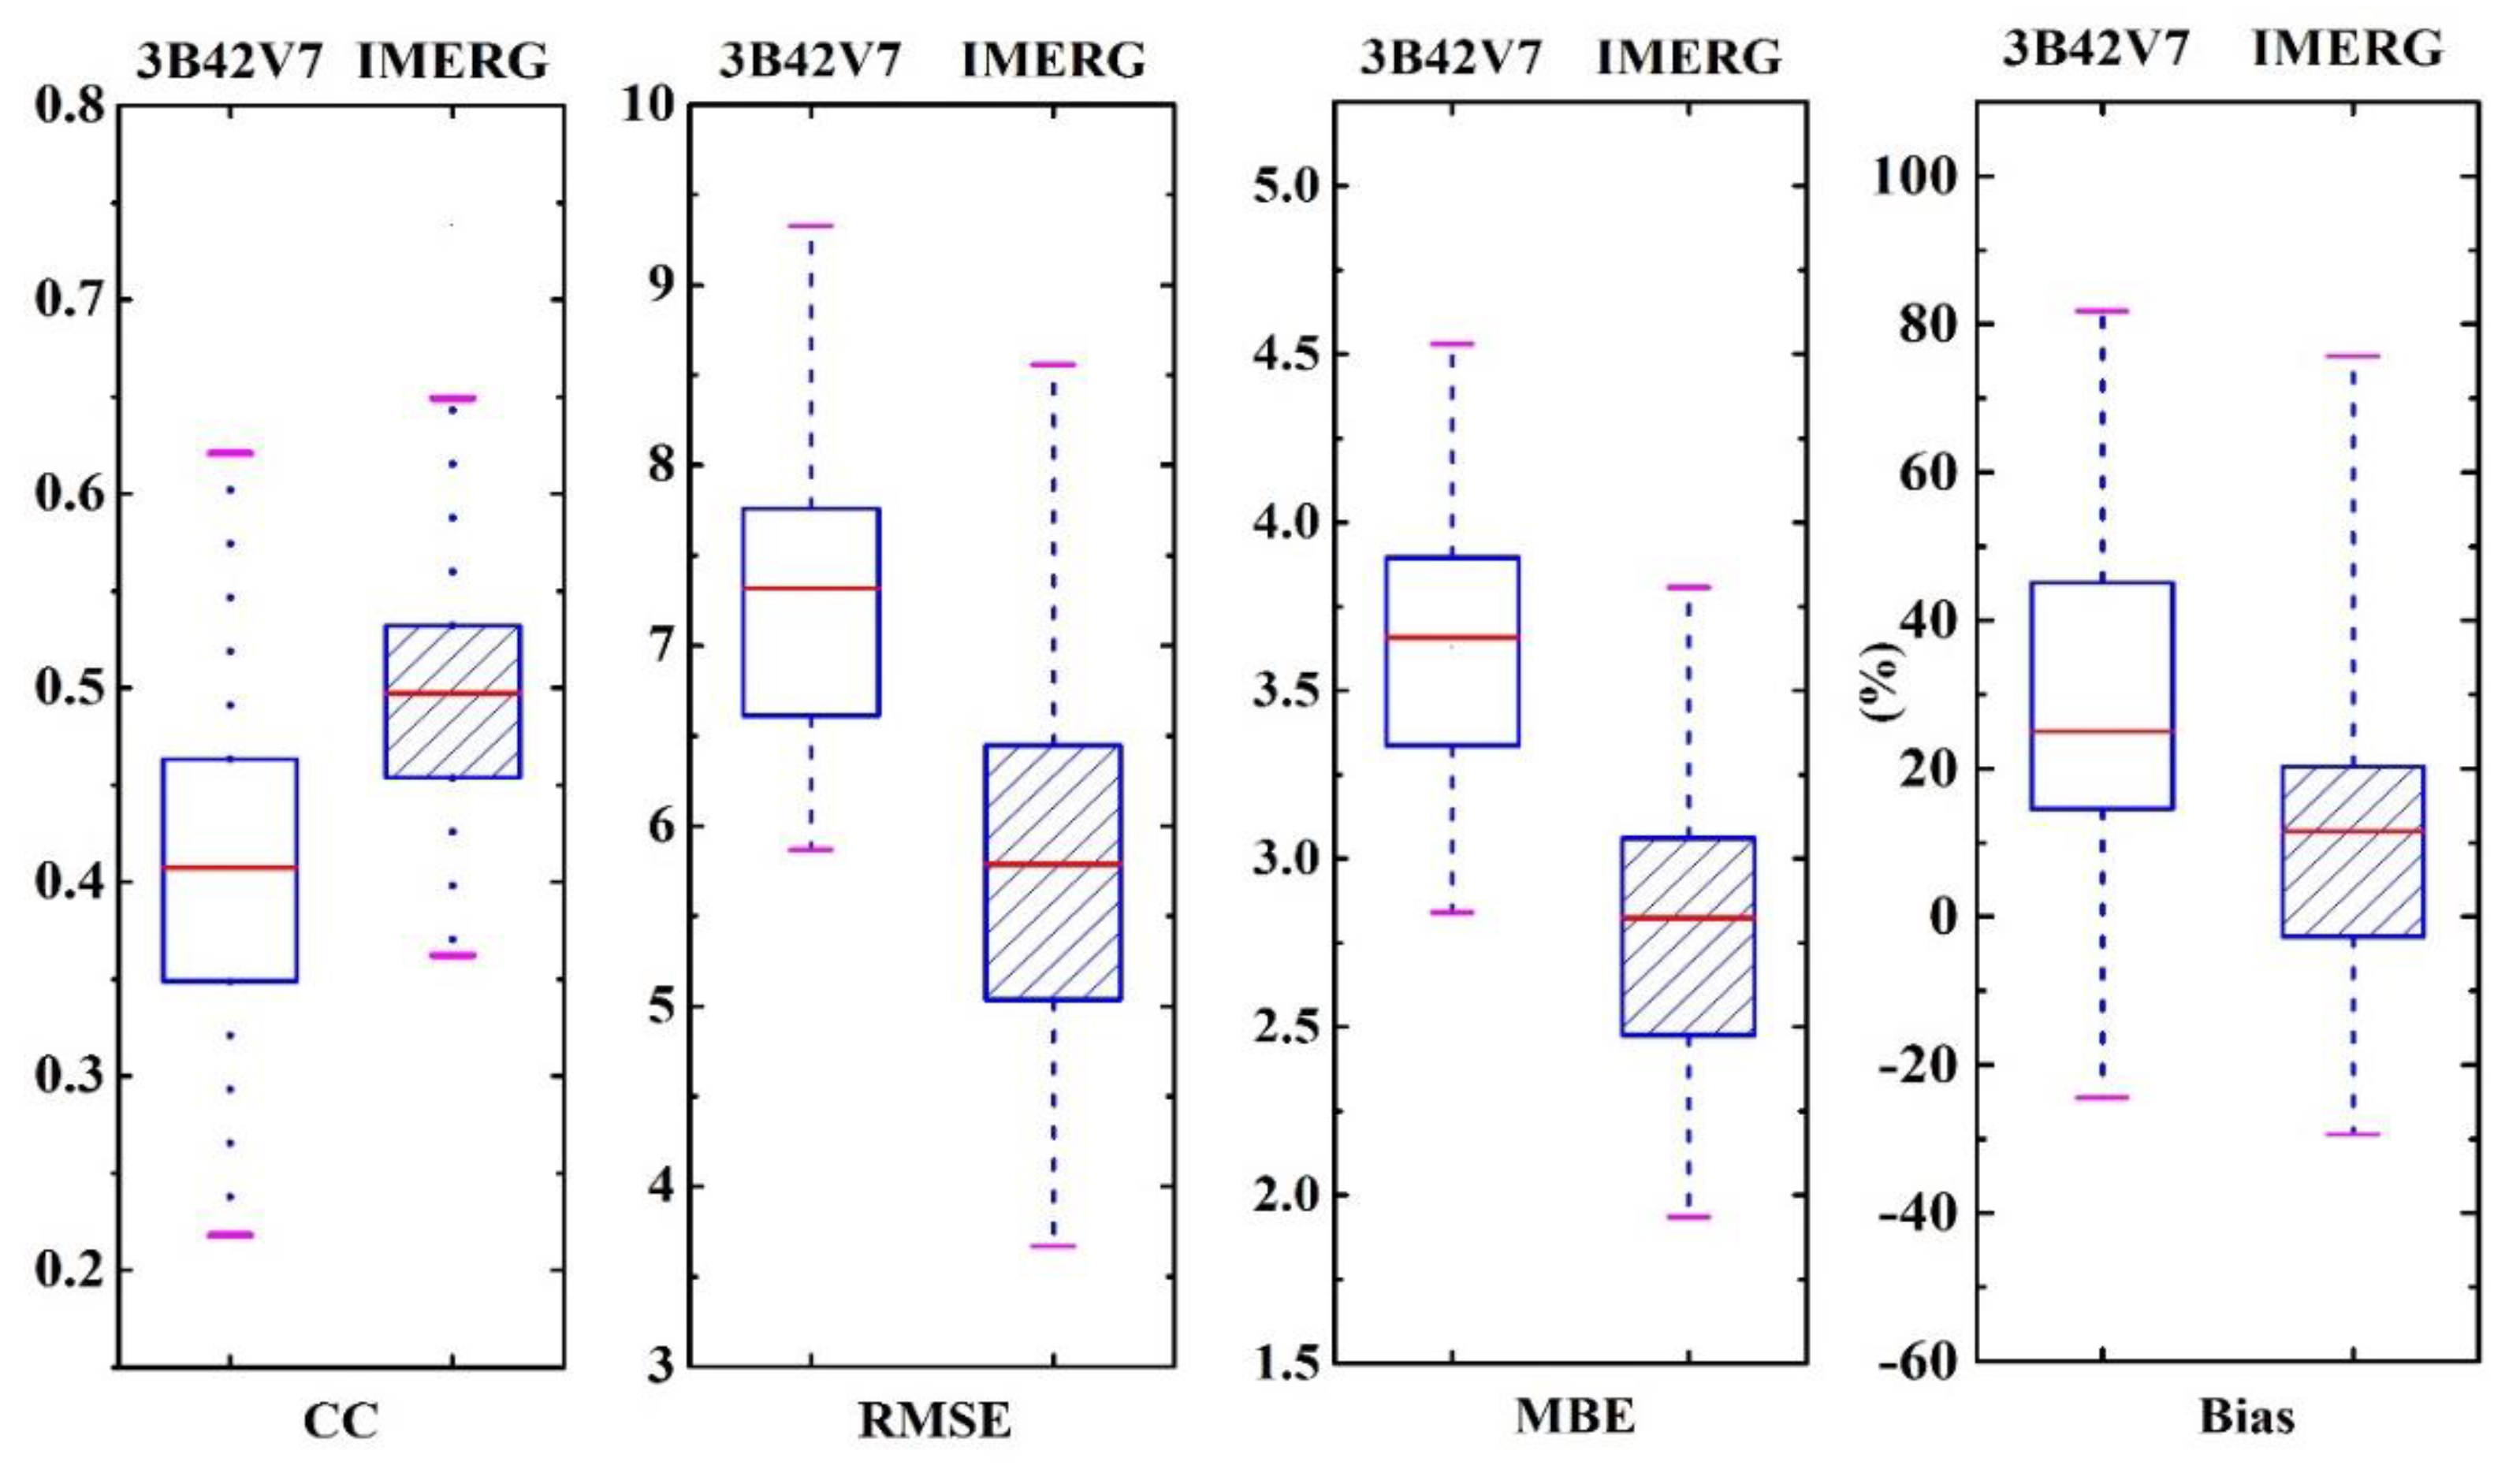
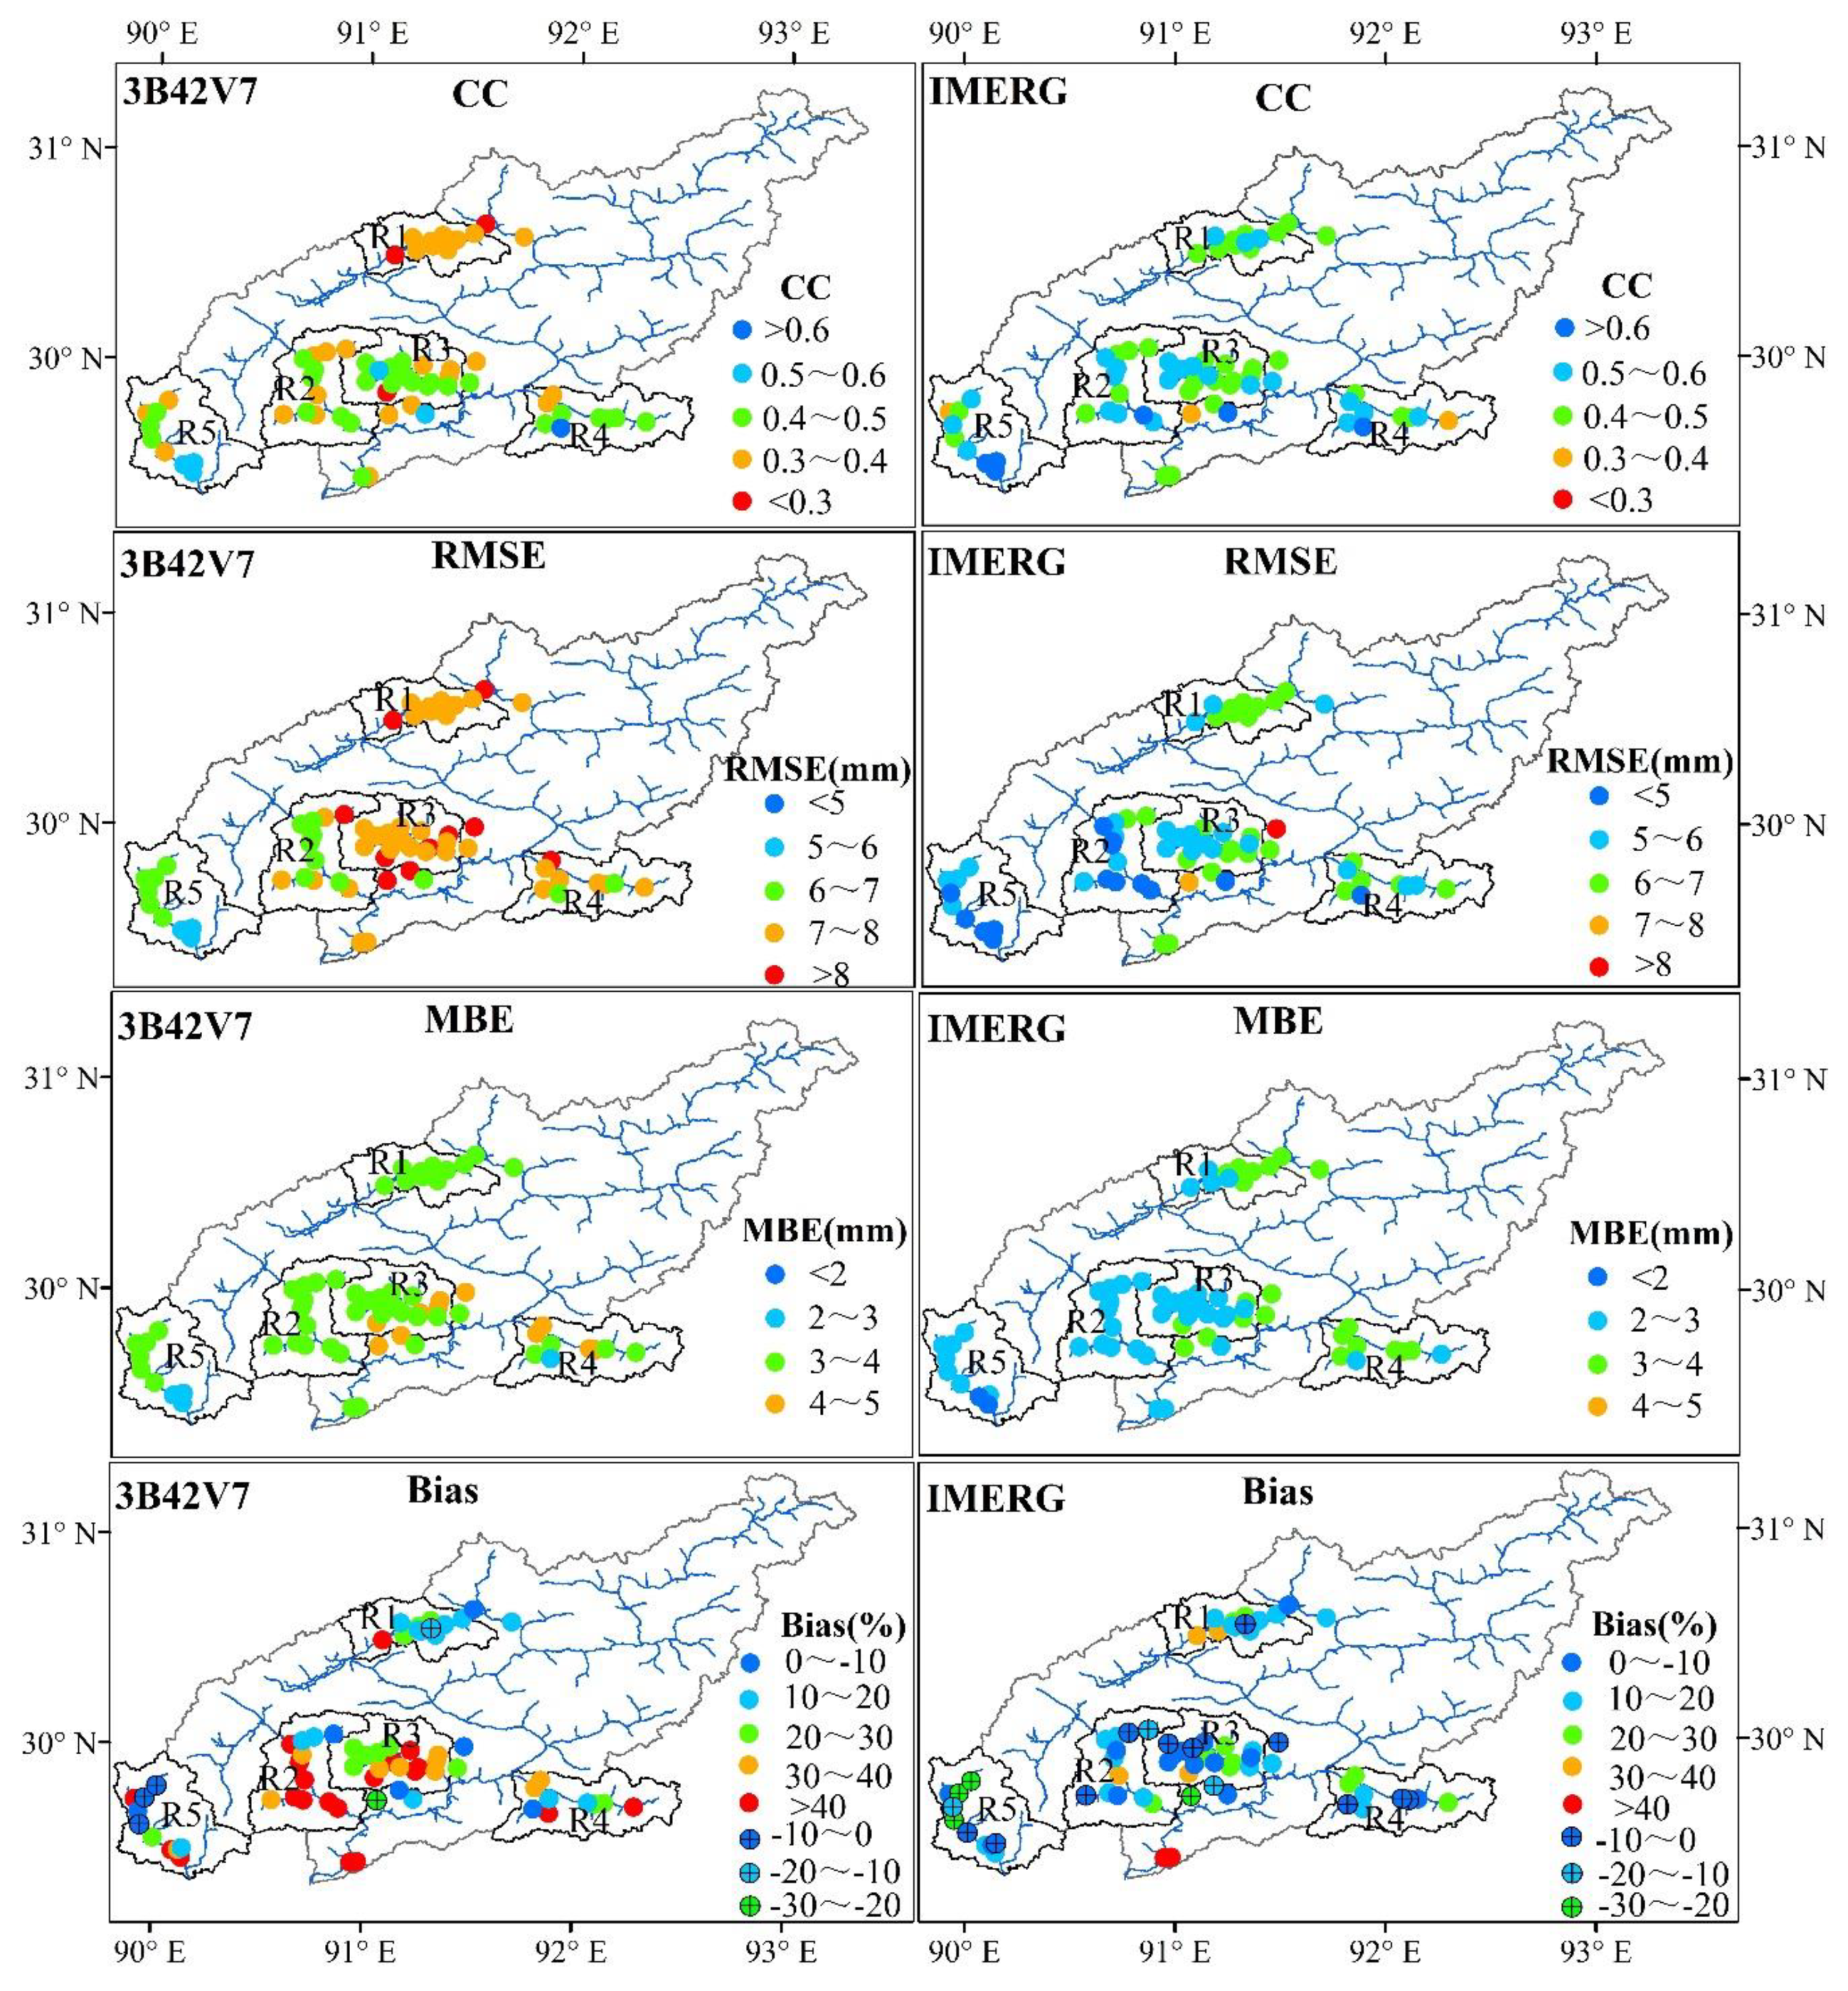
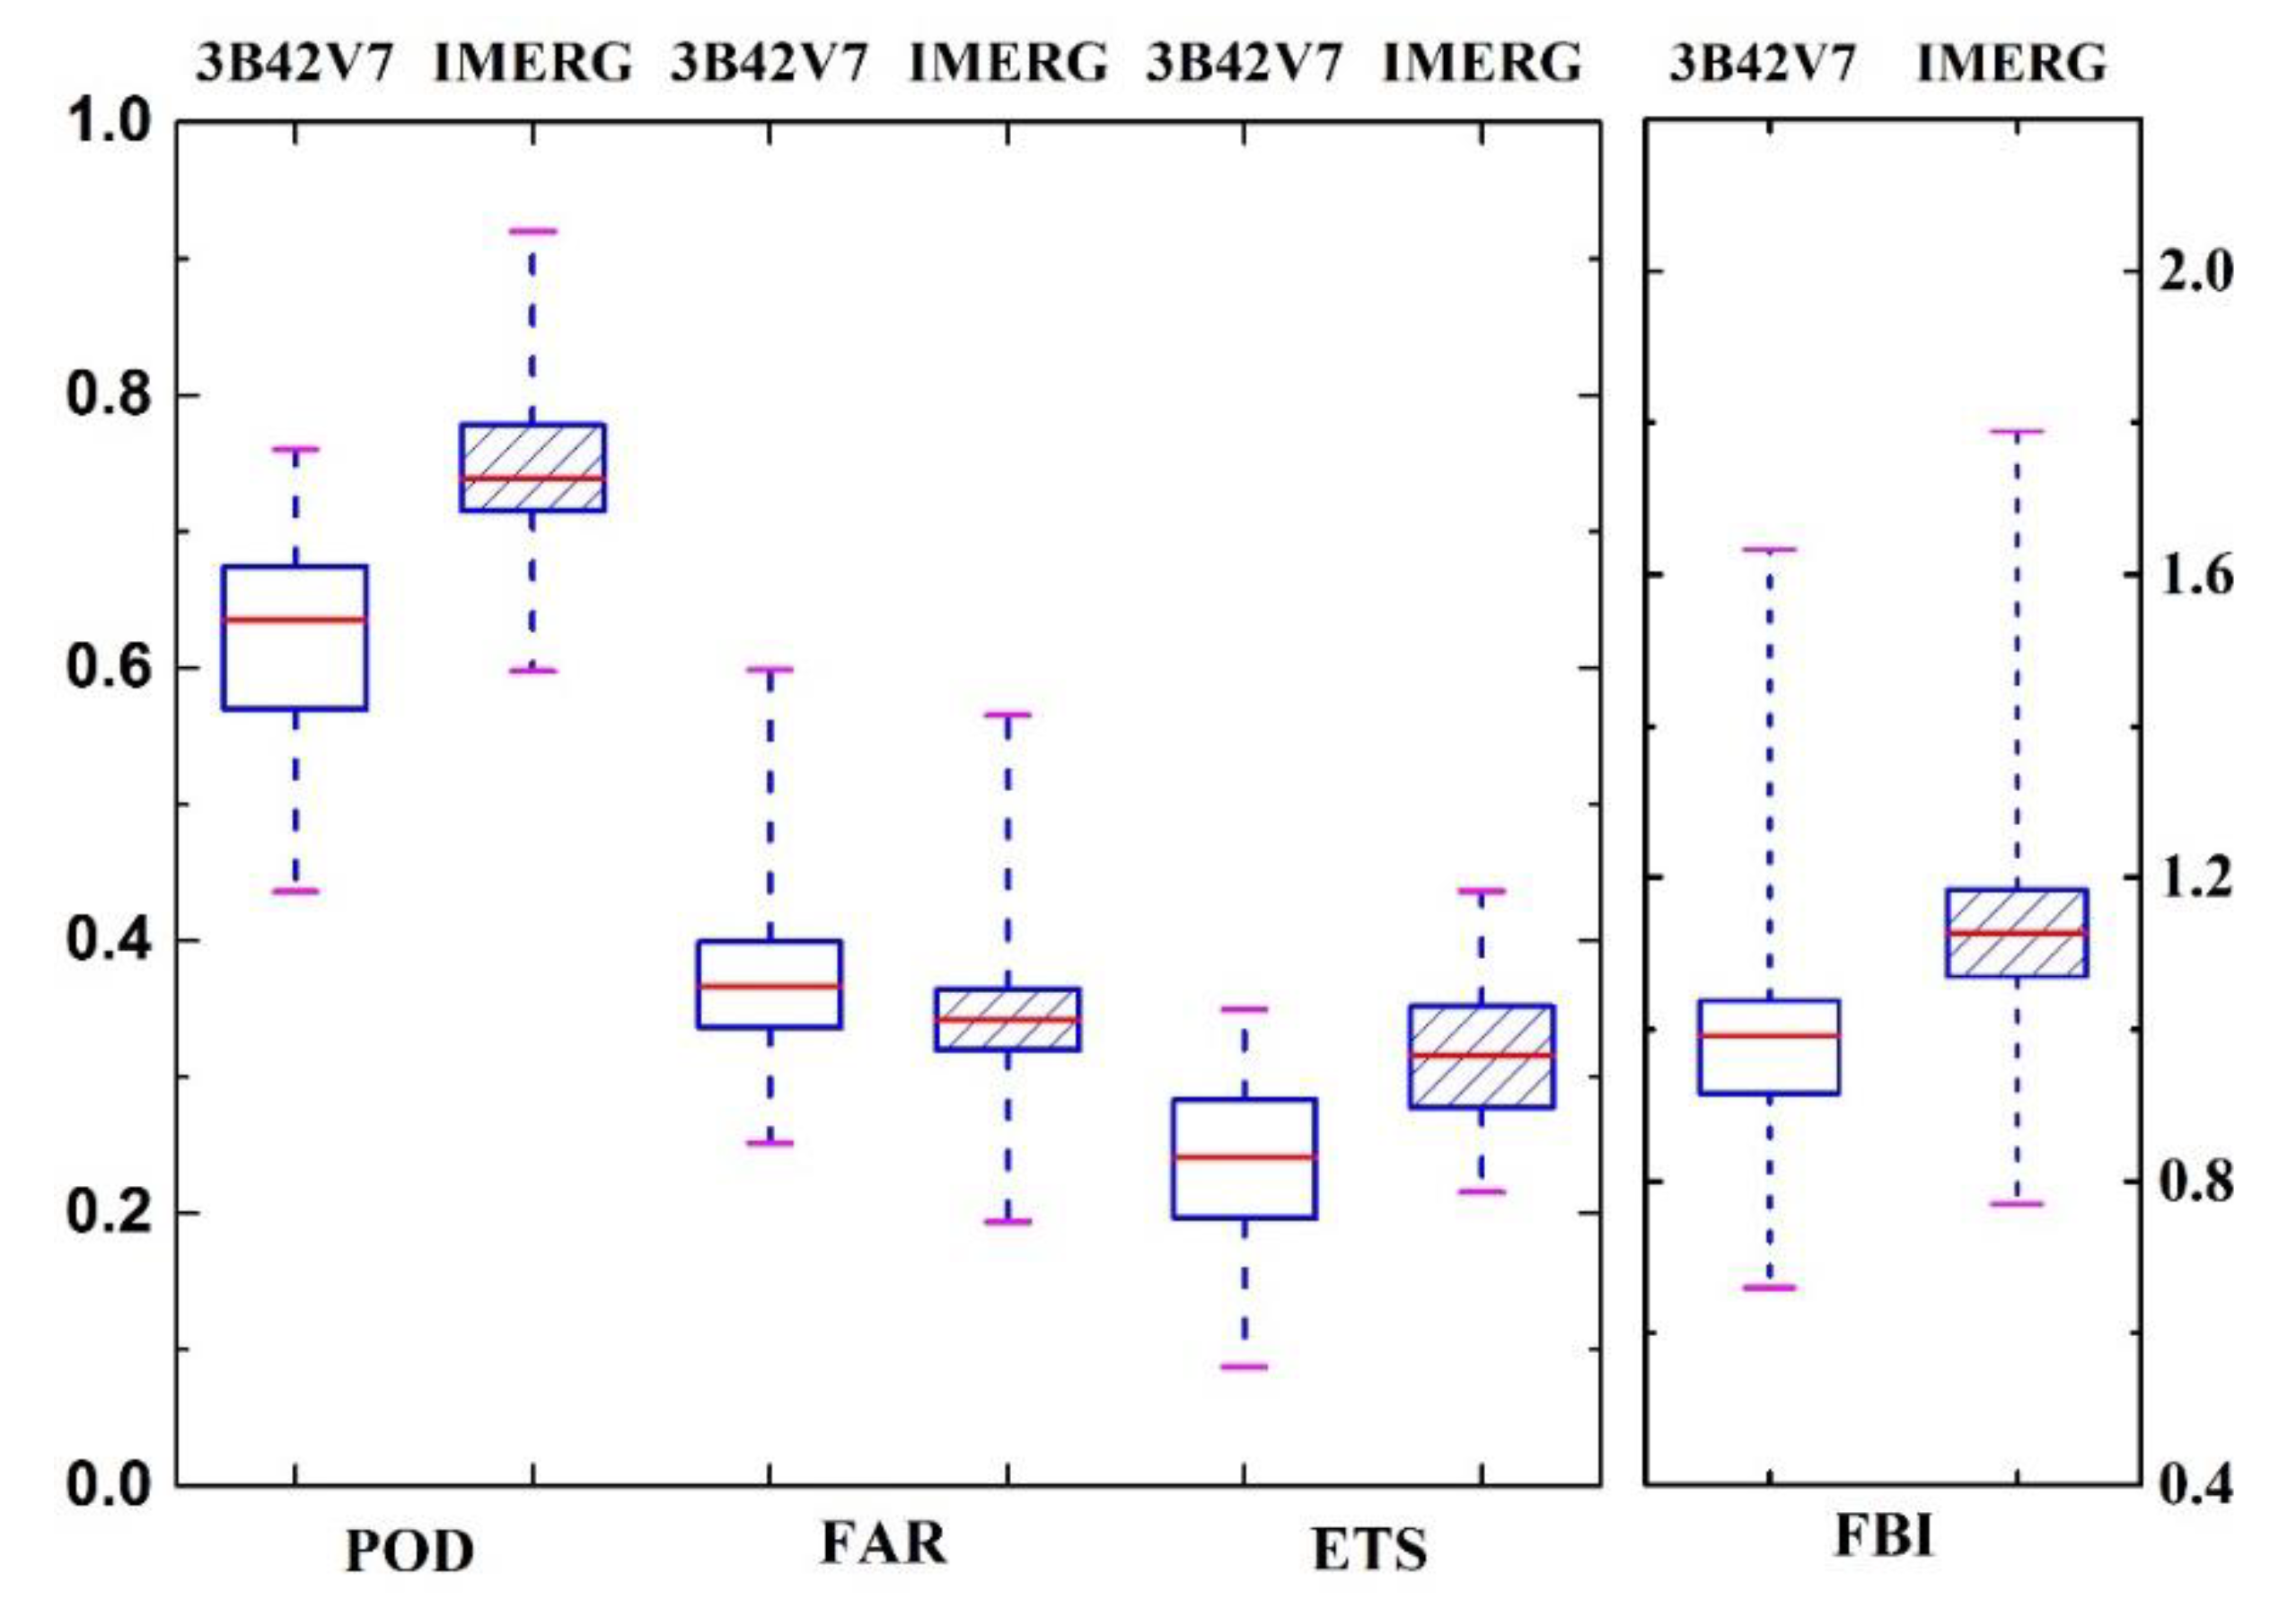
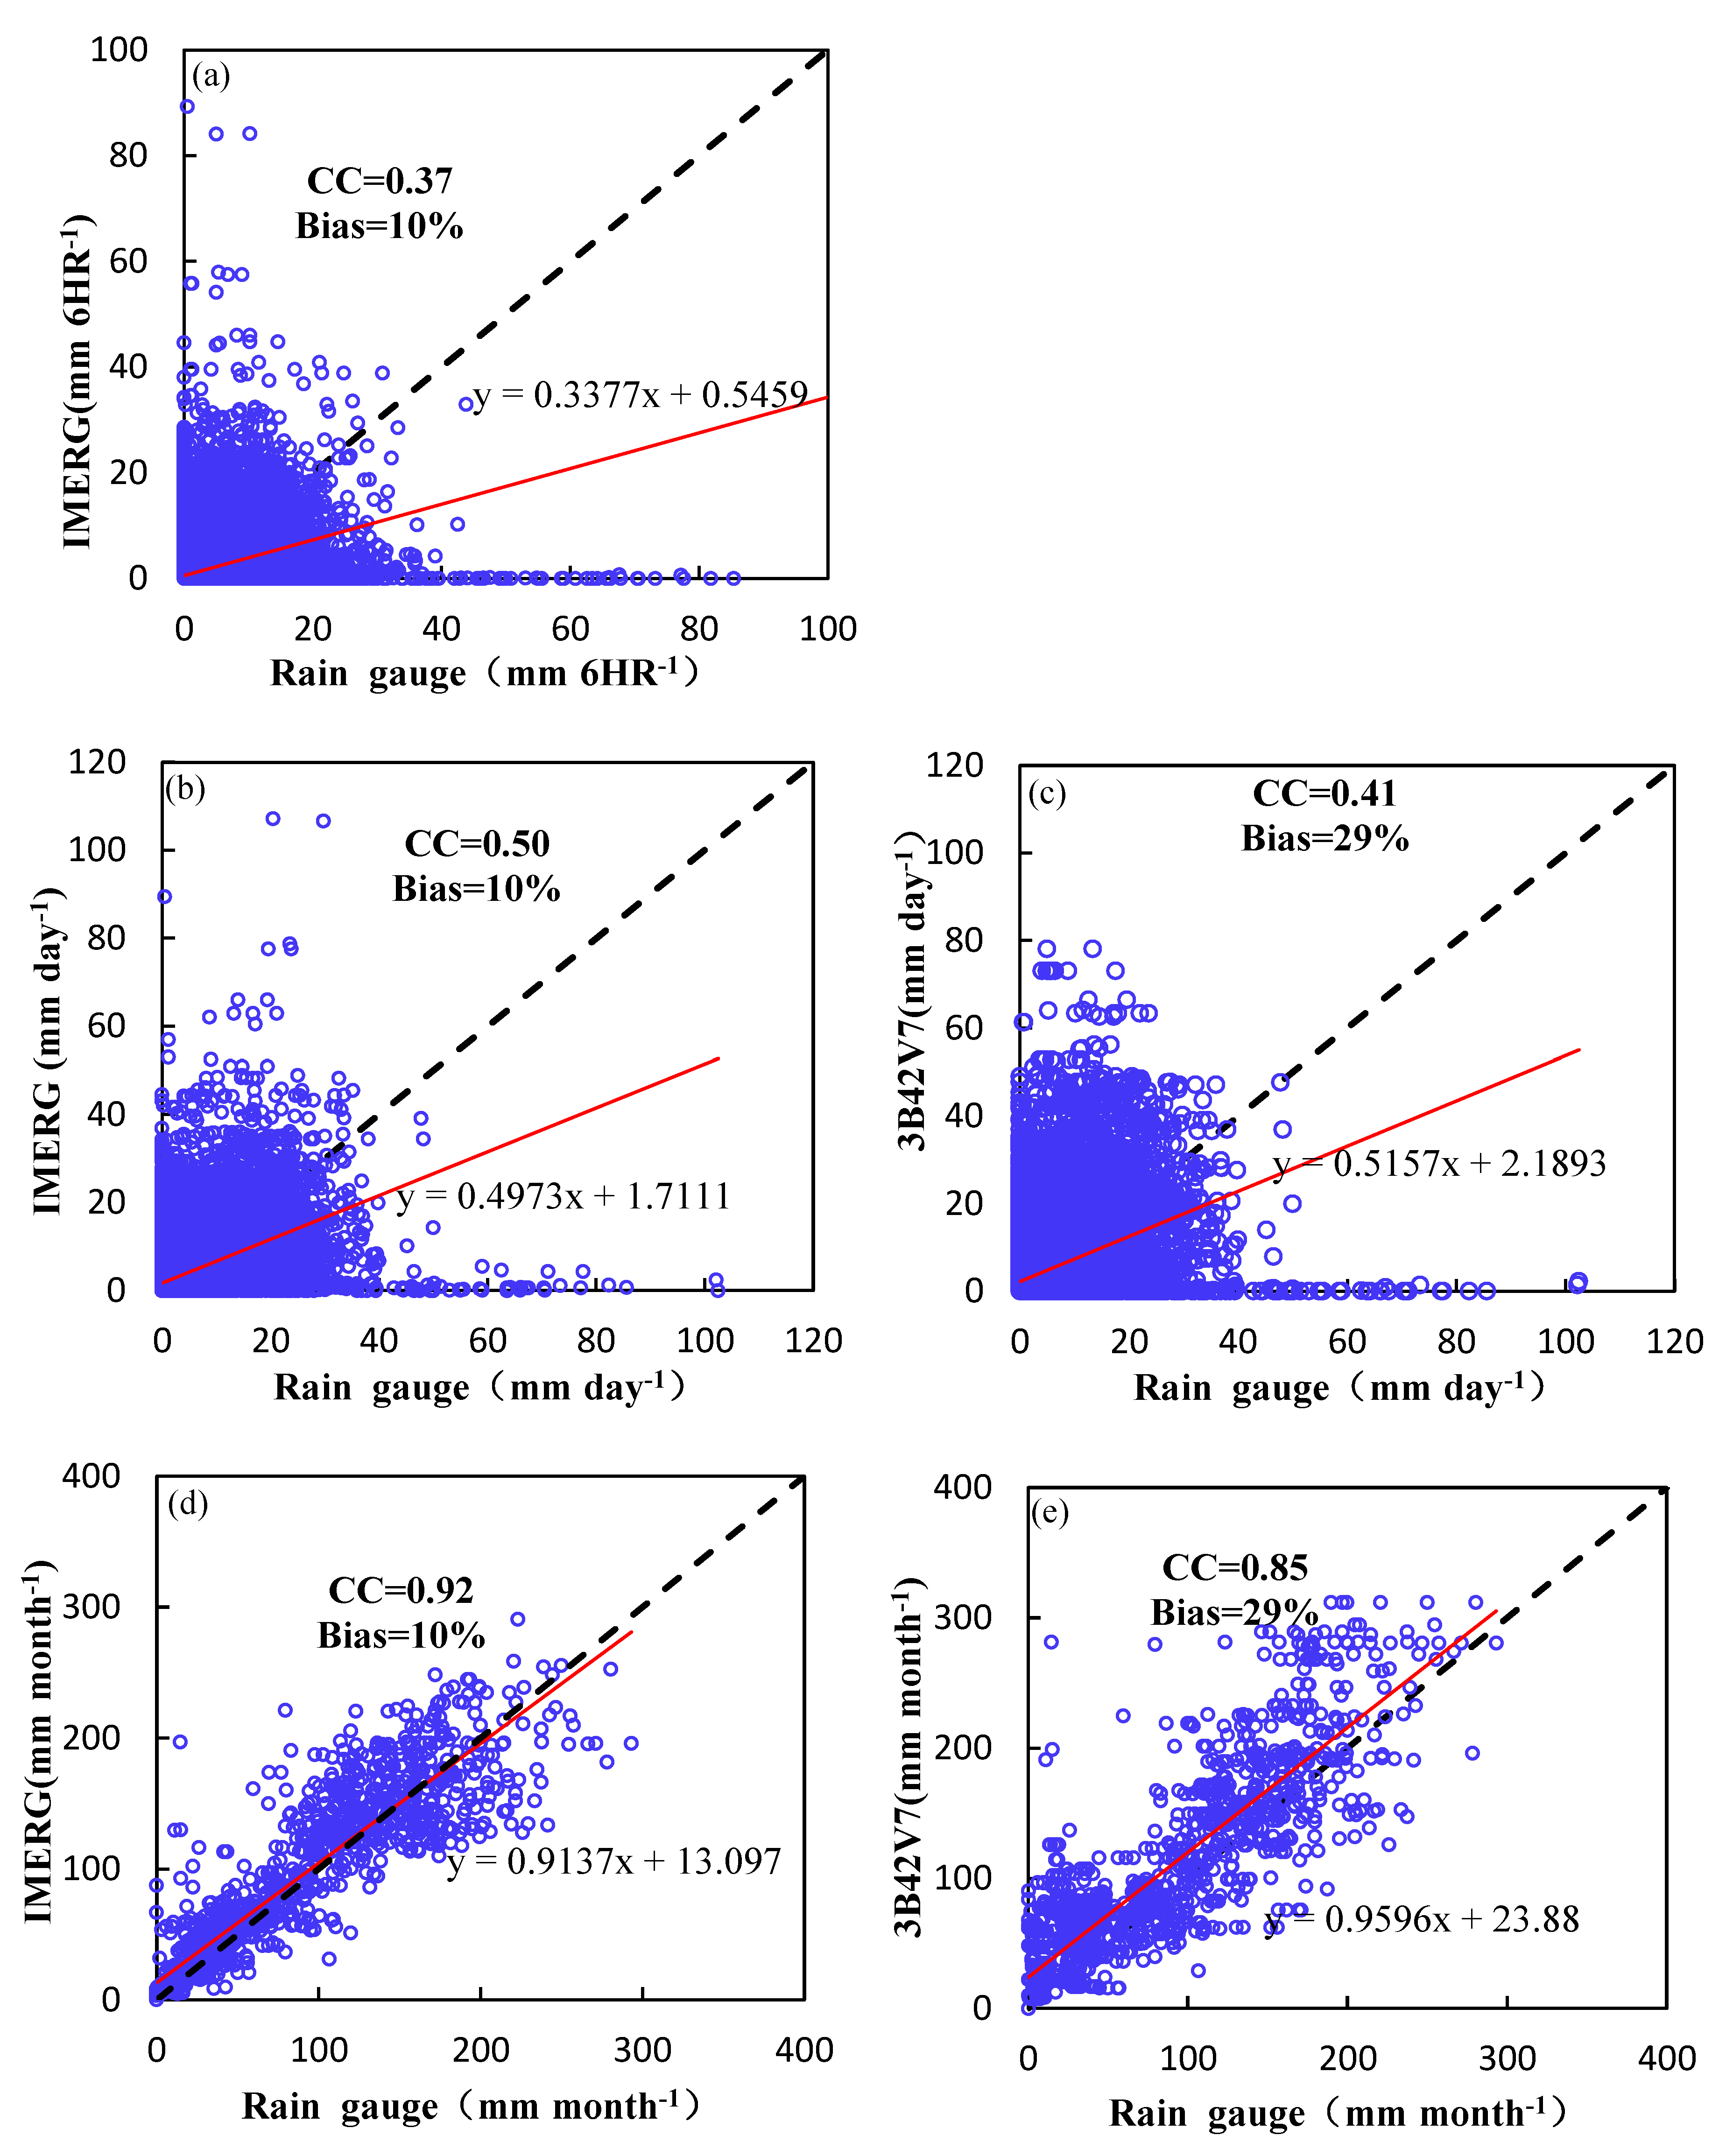
3.1. Evaluation of IMERG and 3B42V7 at Grid Scale

Table 2 and Table 3 were calculated to separately analyze whether the pixel values of 3B42V7 and IMERG could represent the overall situation of their corresponding grid boxes. Table 3 was also used to evaluate and compare the accuracy of 3B42V7 and IMERG at grid scale. Compared with the average of the characteristic values of gauges in these grids, the numbers of precipitation days detected by 3B42V7 were closer to the gauge measured values. However, the average precipitations in precipitation days from 3B42V7 data were larger than those from rain gauge data in every grid, and the similar situation was observed further in comparison of average daily precipitation. However, IMERG overestimated precipitation days. For average precipitations in precipitation days and average daily precipitation, estimates from IMERG were closer to the gauge values. On the whole, the detection accuracy of 3B42V7 for precipitation days was higher than that of IMERG, while the IMERG was more accurate in detecting average daily precipitation.
In Table 2 and Table 3, we could see that the characteristic values of gauges were quite different in both IMERG and 3B42V7 grids. As for average precipitation in precipitation days, the differences were more than 20% in the grids A1, A3, and B1. Meanwhile, the differences in average daily precipitation were up to 20% in the grids of A1, A2, A3, A5, B1, B3, and B5. Moreover, in the grids of A1 and B1, the differences in average daily precipitation were even more than 30%. The characteristic values were different greatly in most 3B42V7 grids and some IMERG grids.

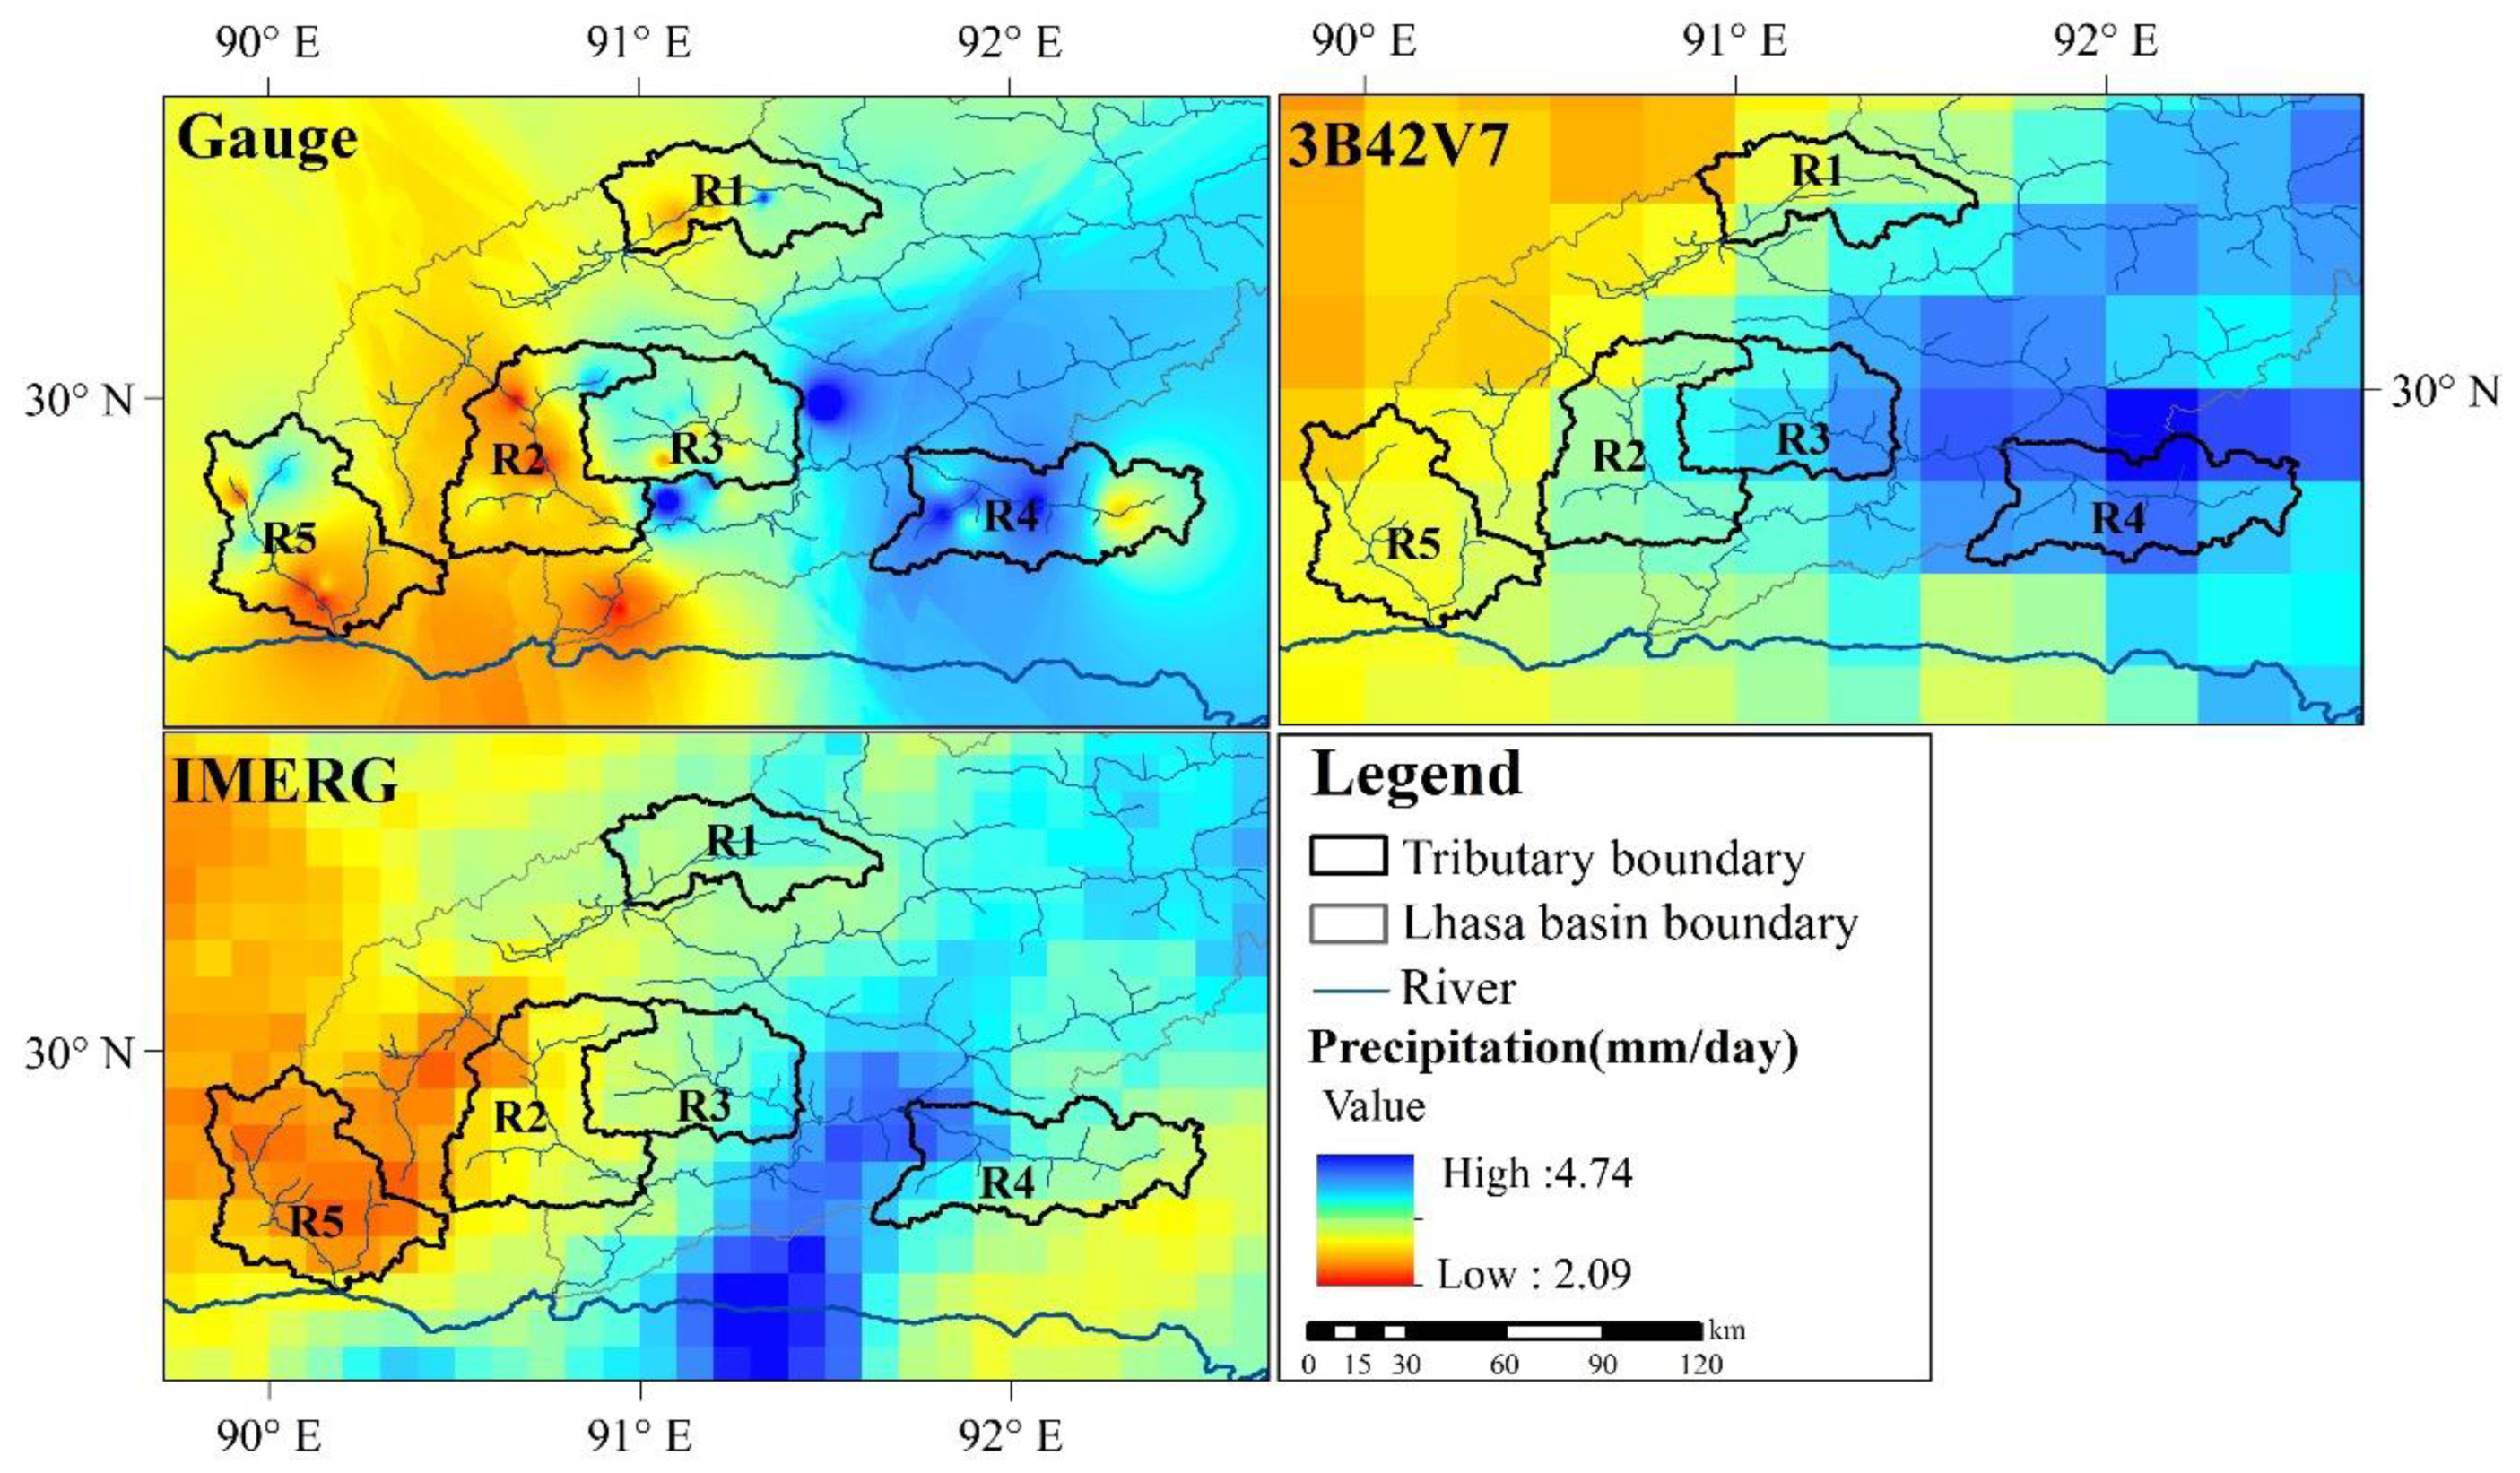
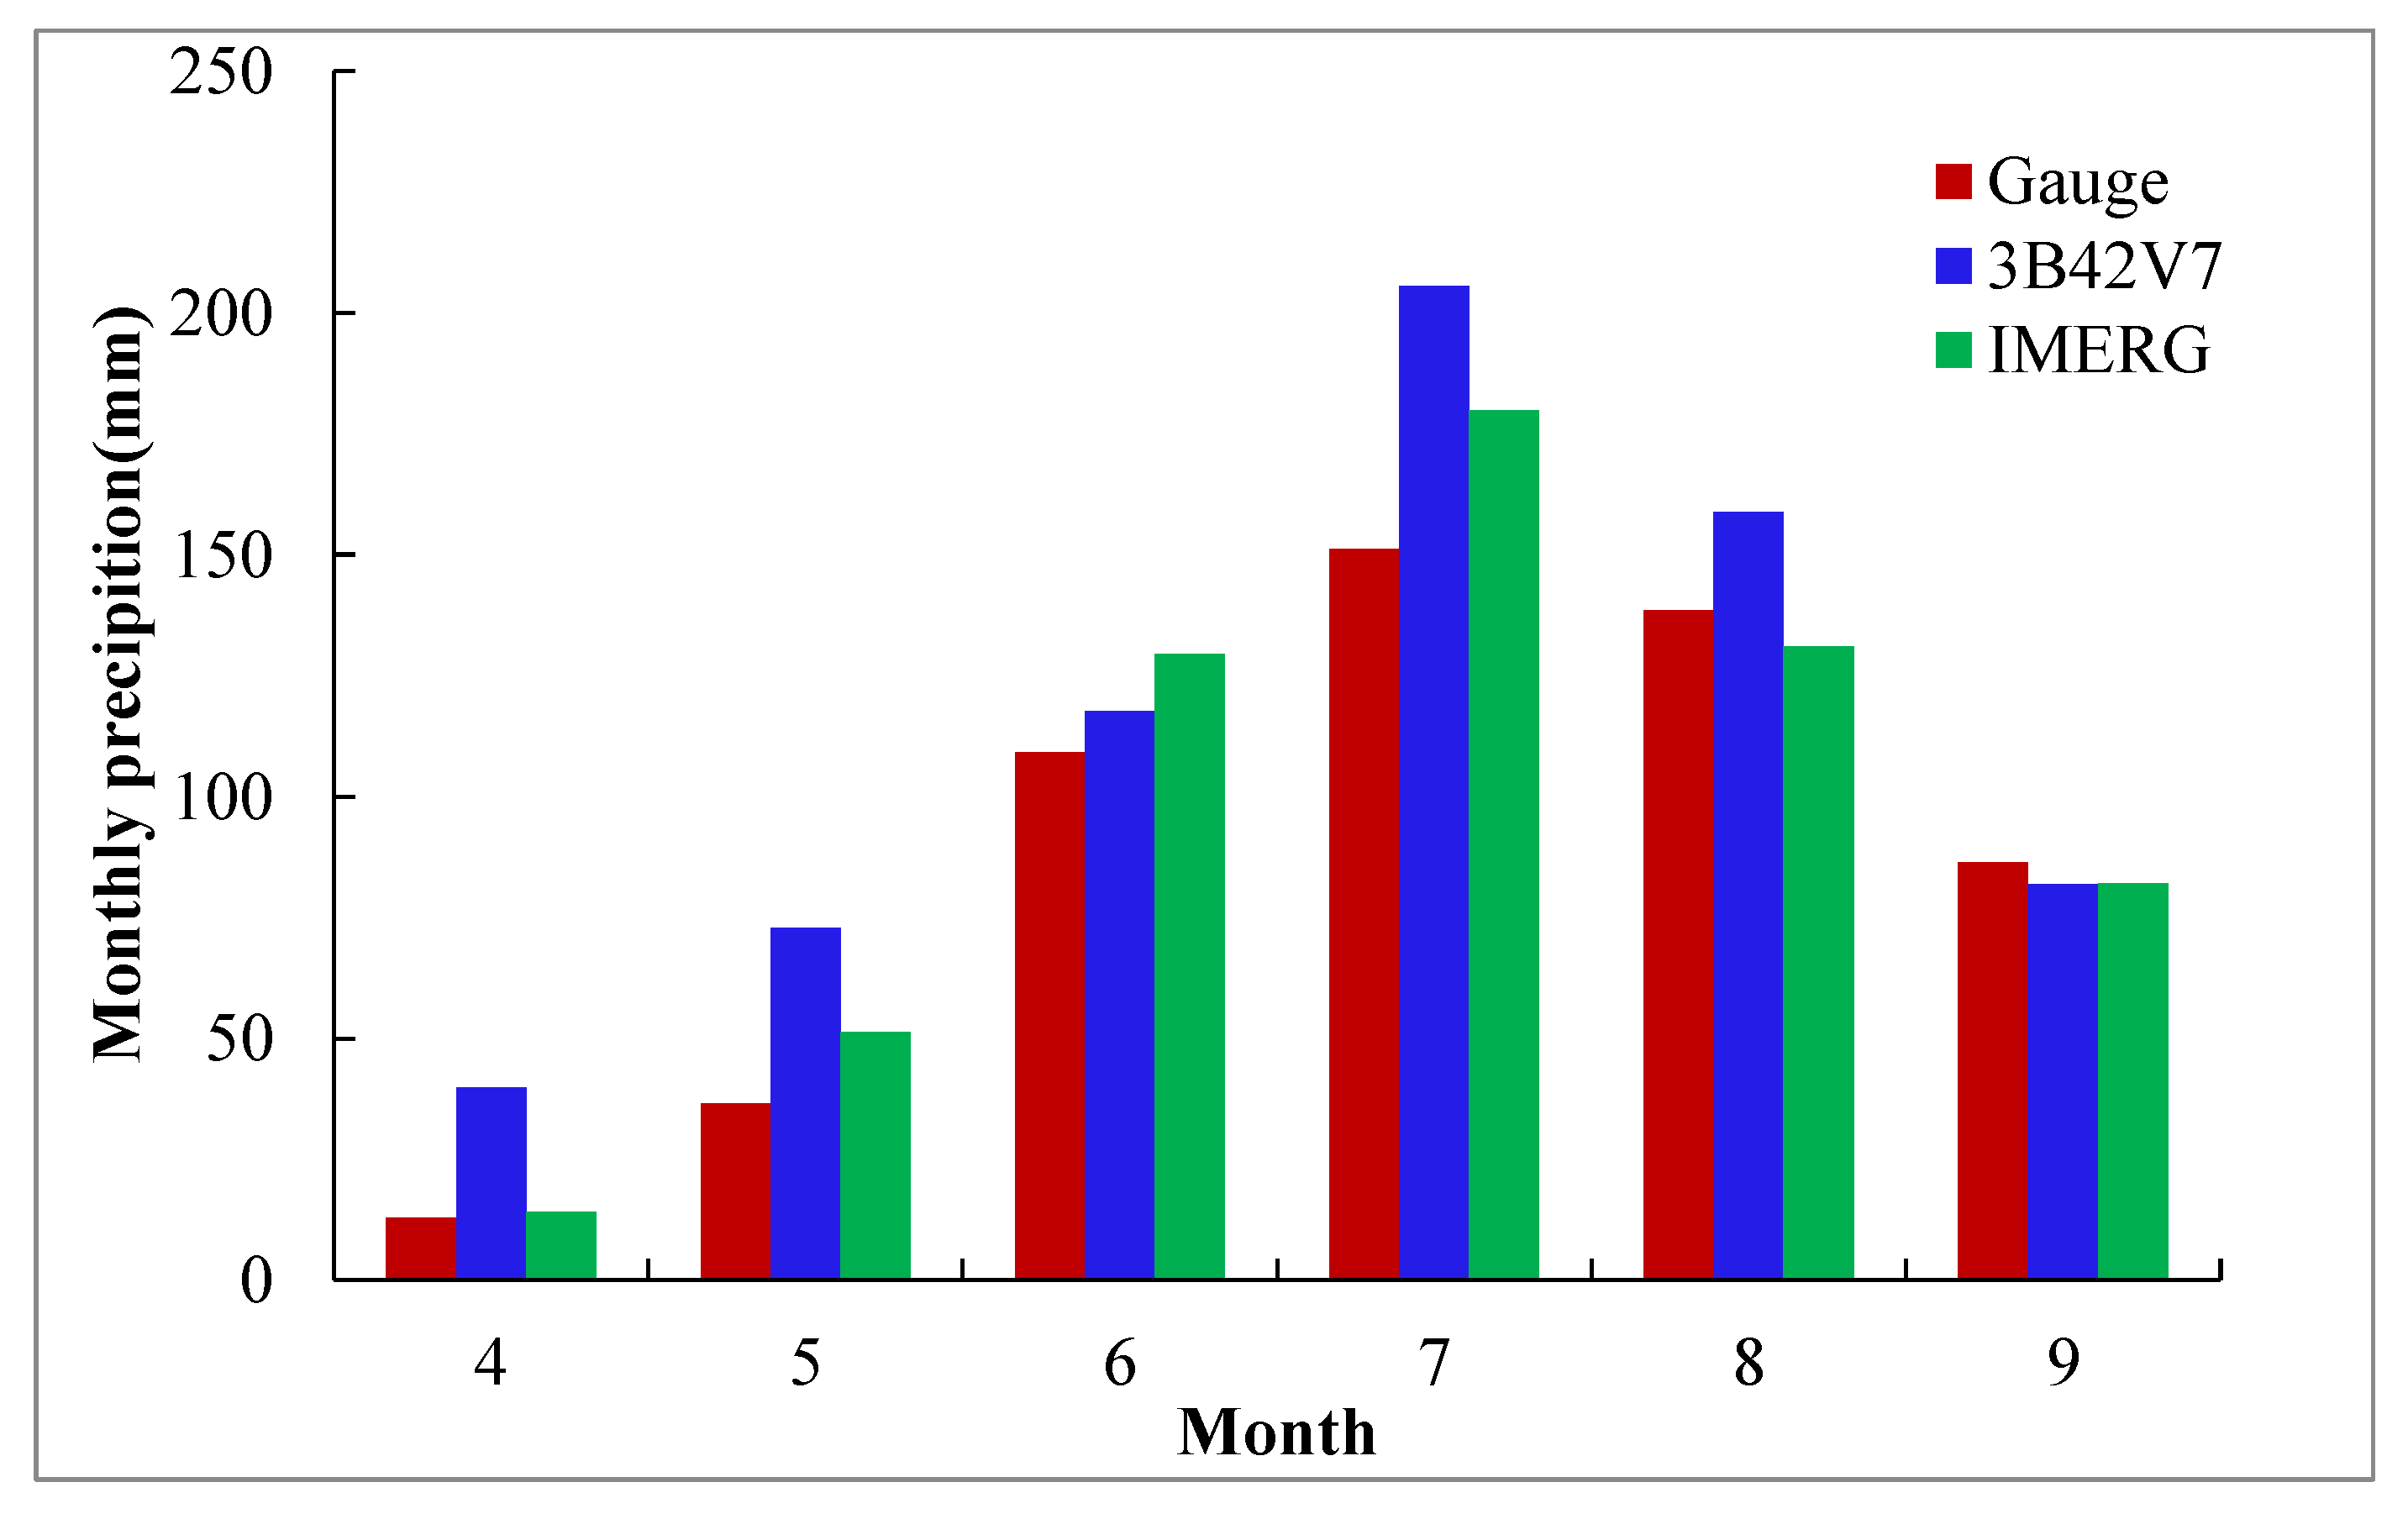
3.2. Evaluation of IMERG and 3B42V7 at Region Scale

Spatial distribution of average daily precipitation from rain gauges, 3B42V7, and IMERG, respectively, during warm seasons from 2014 to 2017 (Figure 2), was used to analyze spatial performances of 3B42V7 and IMERG over the five tributaries. The spatial distribution of rain gauge data was interpolated by Inverse Distance Weighting (IDW) technique, and its power was two. It could be seen from the distribution of gauge precipitation that the spatial difference of precipitation in different areas was large. Region of R4 received the most precipitation, while the region of R2 and R5 received the least precipitation. The median precipitation (about 2.40~3.60 mm day−1) was observed in R1 and R3. Overall, good agreement existed between the SPPs and rain gauge estimates in terms of average daily precipitation. Both 3B42V7 and IMERG showed higher precipitation rates in R4 and lower precipitation rates in R5 and west of R2, but the high precipitation rates from 3B42V7 covered a larger area than that of the gauge observation and IMERG. At the region scale, 3B42V7 overestimated precipitation, and IMERG was closer to the gauge observation value. Besides, it was noteworthy that spatial distribution of average daily precipitation derived from IMERG showed more subtle spatial variations than 3B42V7.
Subsequently, CC, RMSE, MBE, and BIAS between satellite-based and rain gauge data were also examined and compared, which was calculated for every rain gauge and their nearest satellite pixel at daily scale during the study period. The results are shown in Figure 3. IMERG performed significantly better than 3B42V7 with higher CC values and lower RMSE, MBE, and Bias values. Figure 4 shows the spatial distribution of these continuous statistical indices. Both 3B42V7 and IMERG in R2, R3, R4, and R5 correlated with the rain gauge observations better than those in R1 with higher CC values, except that the values at very few gauges were abnormal. The RMSE values of both 3B42V7 and IMERG generally performed better in R2 and R5 than those in other regions. In terms of the MBE, both 3B42V7 and IMERG had smaller MBE values in R2 and R5, besides 3B42V7 also had smaller MBE values in R1. As for Bias, the positive and negative deviations of IMERG precipitation estimates were relatively balanced, while 3B42V7 showed positive deviation at most gauges. 3B42V7 showed minor bias in R1 and at some gauges in R5, while IMERG showed minor deviation in R2, R3, R4, and R5 except that the values at very few gauges were abnormal. In general, except Bias, other continuous statistical indices from 3B42V7 and IMERG had similar spatial trend variations. Also, once again, it was not hard to see that these indices of IMERG were better than 3B42V7.
Furthermore, a set of categorical statistical metrics at gauge locations in the five tributaries were used to evaluate the ability of IMERG and 3B42V7 in detecting the occurrence of precipitation at a daily scale (Figure 5). It showed that IMERG performed better than 3B42V7 with higher values of POD, lower values of FAR, and higher values of ETS except for slightly higher values of FBI. Thus, for the detection of precipitation frequency, IMERG was superior to 3B42V7 with smaller omission and false alarm of precipitation events except for overestimation of precipitation occurrences.

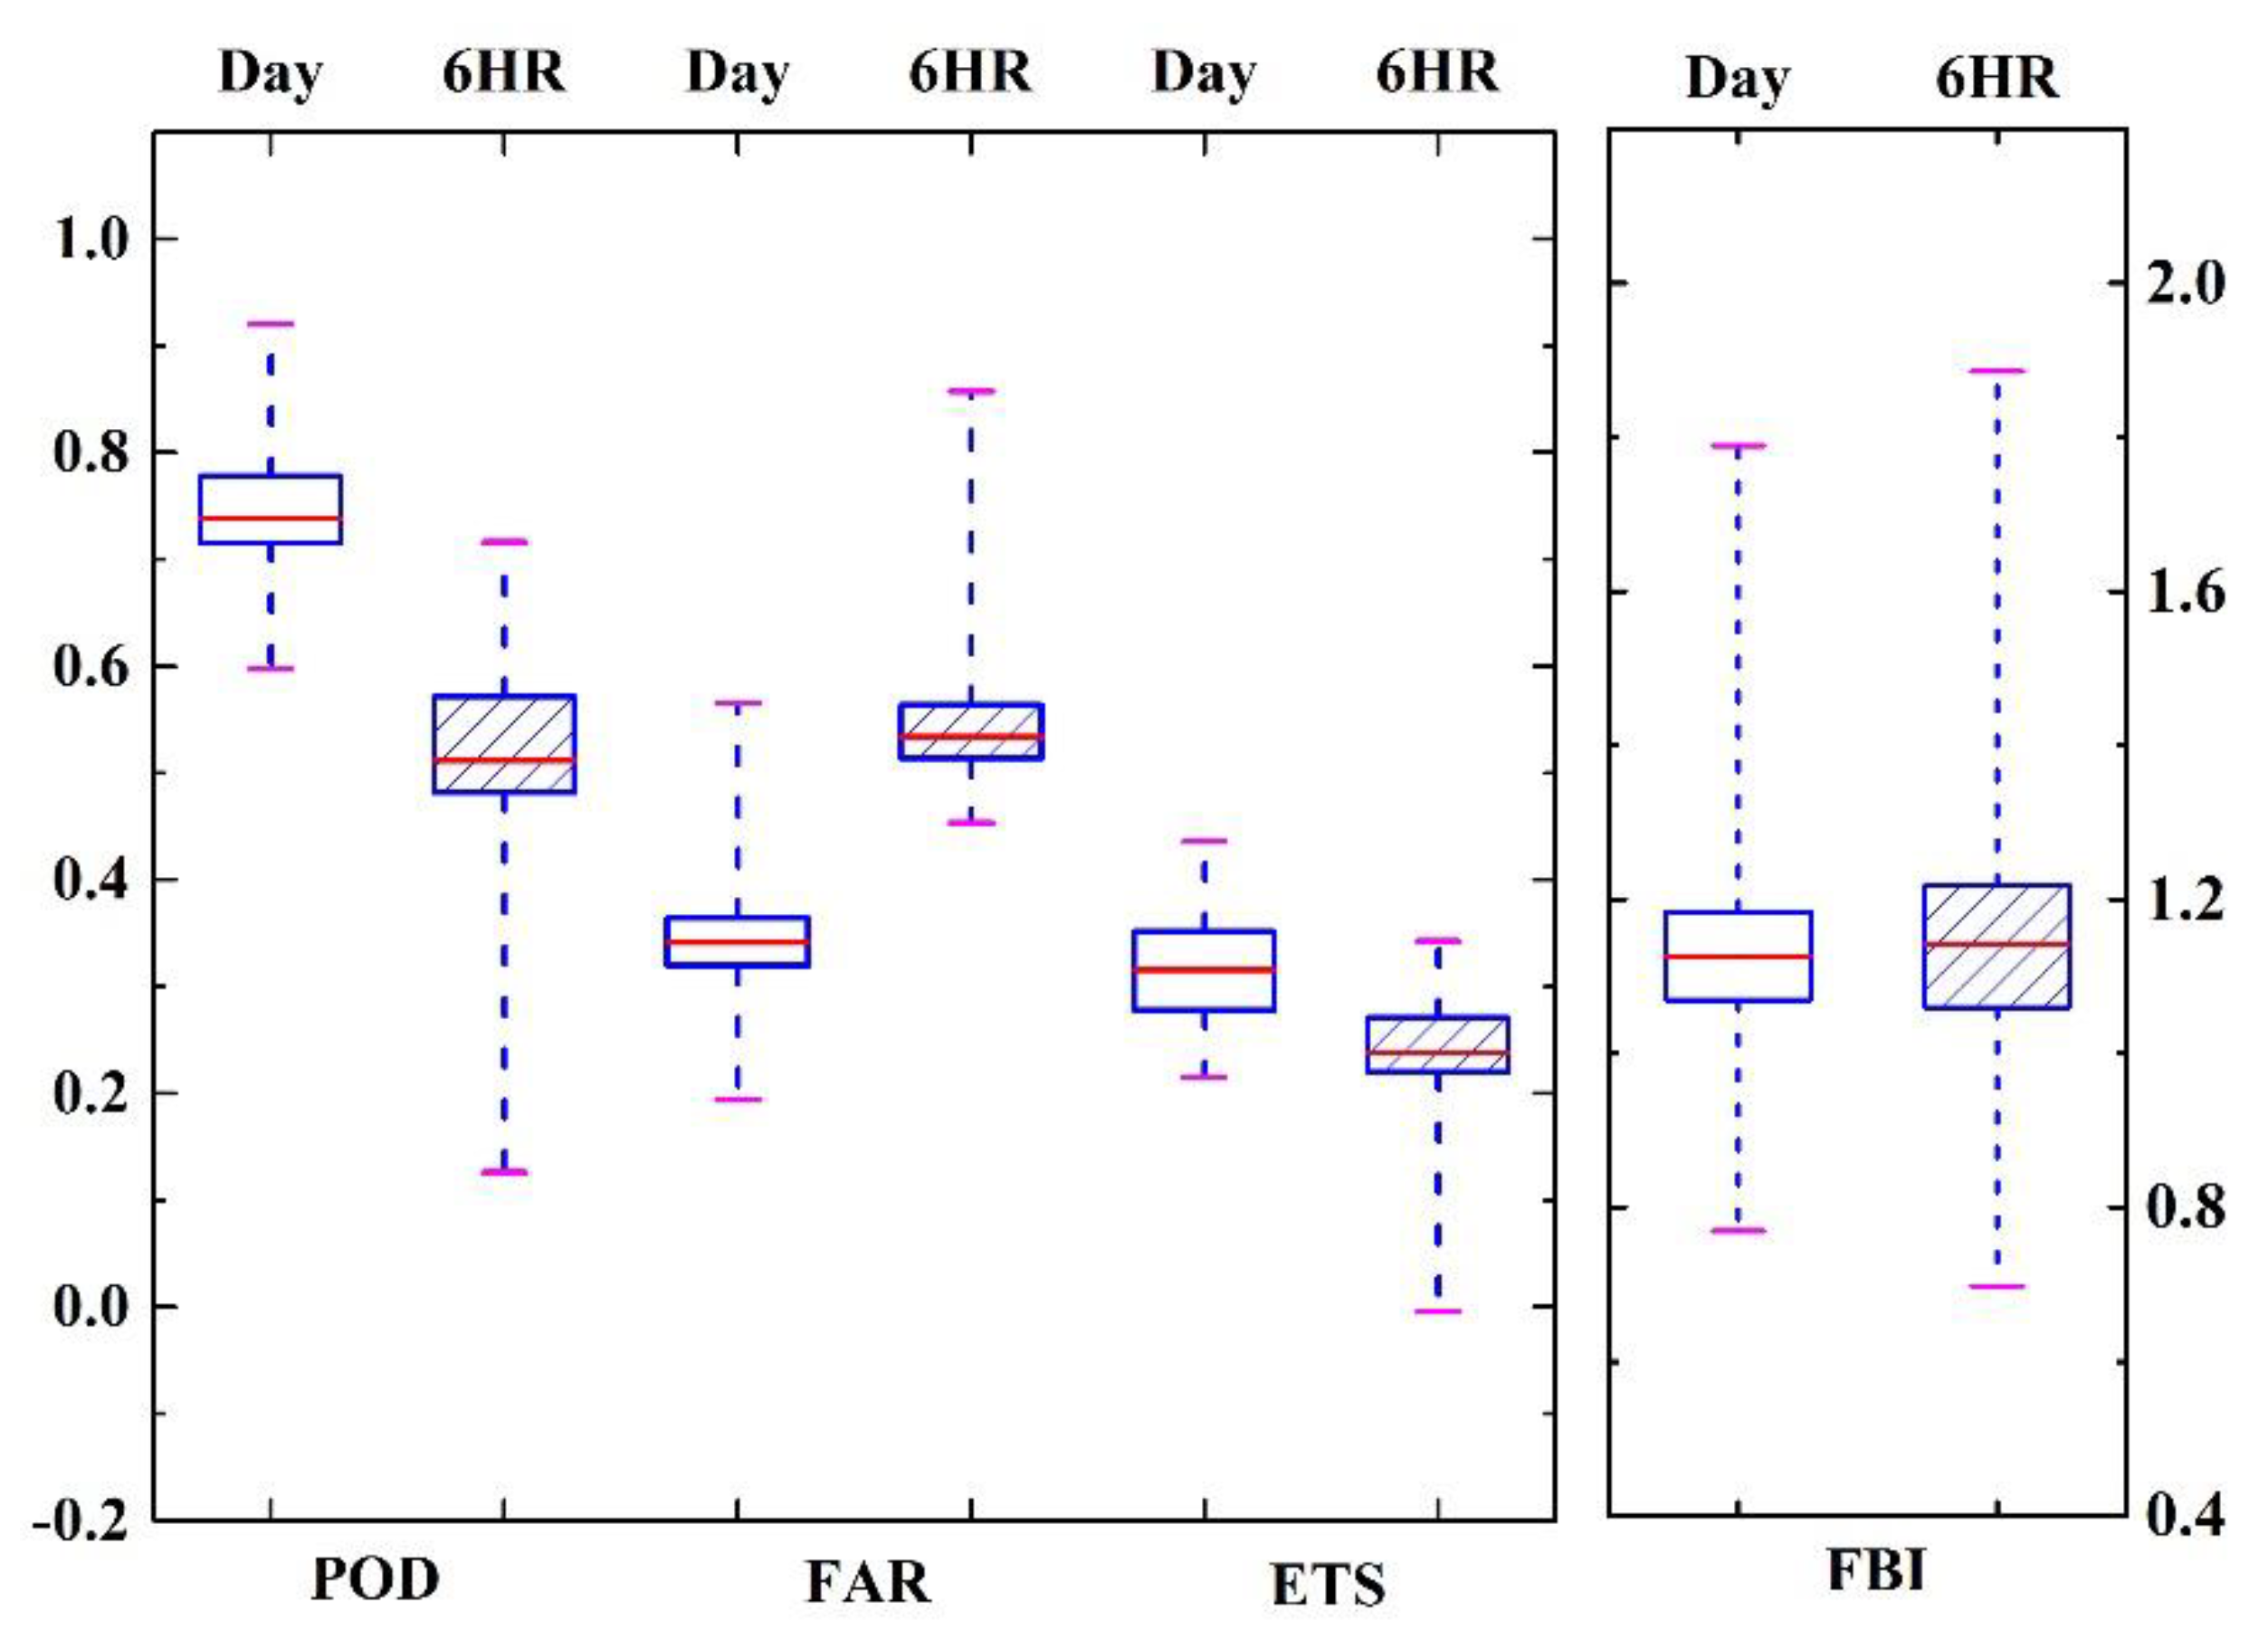
3.3. Evaluation of IMERG and 3B42V7 at Different Time Scale

At first, the variation of the accuracy of IMERG with time scale was compared and analyzed. Figure 6a,b,d are scatterplots of precipitation from IMERG and rain gauges at six-hourly, daily, and monthly scale. The correlation coefficient (CC) increased from 0.37 at six-hourly scale to 0.50 at daily scale and 0.92 at monthly scale. It was not difficult to find that the error of IMERG decreased with the increase of time scale. Categorical statistical metrics of IMERG at six-hourly and daily scales are shown in Figure 7. IMERG performed significantly better at daily scale than at six-hourly scale, with higher values of POD and ETC, lower values of FAR, lower values of FBI. Besides, the fluctuation range of statistical metrics value of IMERG at the daily scale was narrower than at six-hourly scale, which further indicated that the detection accuracy of IMERG at the daily scale changed little with the location of the gauges, and its regional changes were relatively stable. In a word, IMERG showed good accuracy at the monthly scale, followed by the daily scale and poor accuracy at six-hourly scale.
Then, the precision of 3B42V7 and IMERG at daily and monthly scales were compared and analyzed. Figure 6b–e show the inter-comparison of daily and monthly precipitation from all 67 rain gauges and the two SPPs at the corresponding grids collocated with rain gauges. At daily scale, compared with gauge data, 3B42V7 had a larger error with high relative biases (BIAS) and of 29% than IMERG with BIAS of 10%. Additionally, the consistency (CC) between two SPPs and rain gauges was comparable, with slight favor for IMERG (Figure 6b,c). On the monthly scale, IMERG showed good performance with higher CC value of 0.92, 3B42V7 also showed a relatively good correlation, with a CC value of 0.85 (Figure 6d,e). The accuracy of 3B42V7 and IMERG products at monthly scale was superior to that at daily scale. Meanwhile, IMERG performed better than 3B42V7 at daily and monthly scales.
The distribution of monthly precipitation, from gauges, 3B42V7, and IMERG, was summarized, as shown in Figure 8, to further elucidate the accuracy of 3B42V7 and IMERG. From the rain gauge data, we could see that April–September mean monthly precipitation of 2014–2017 in the five tributaries was concentrated in June, July, and August, and there was less precipitation in April and May. Both 3B42V7 and IMERG data described this distribution characteristic correctly, but the 3B42V7 tended to suffer from a systematic overestimation of monthly precipitation.

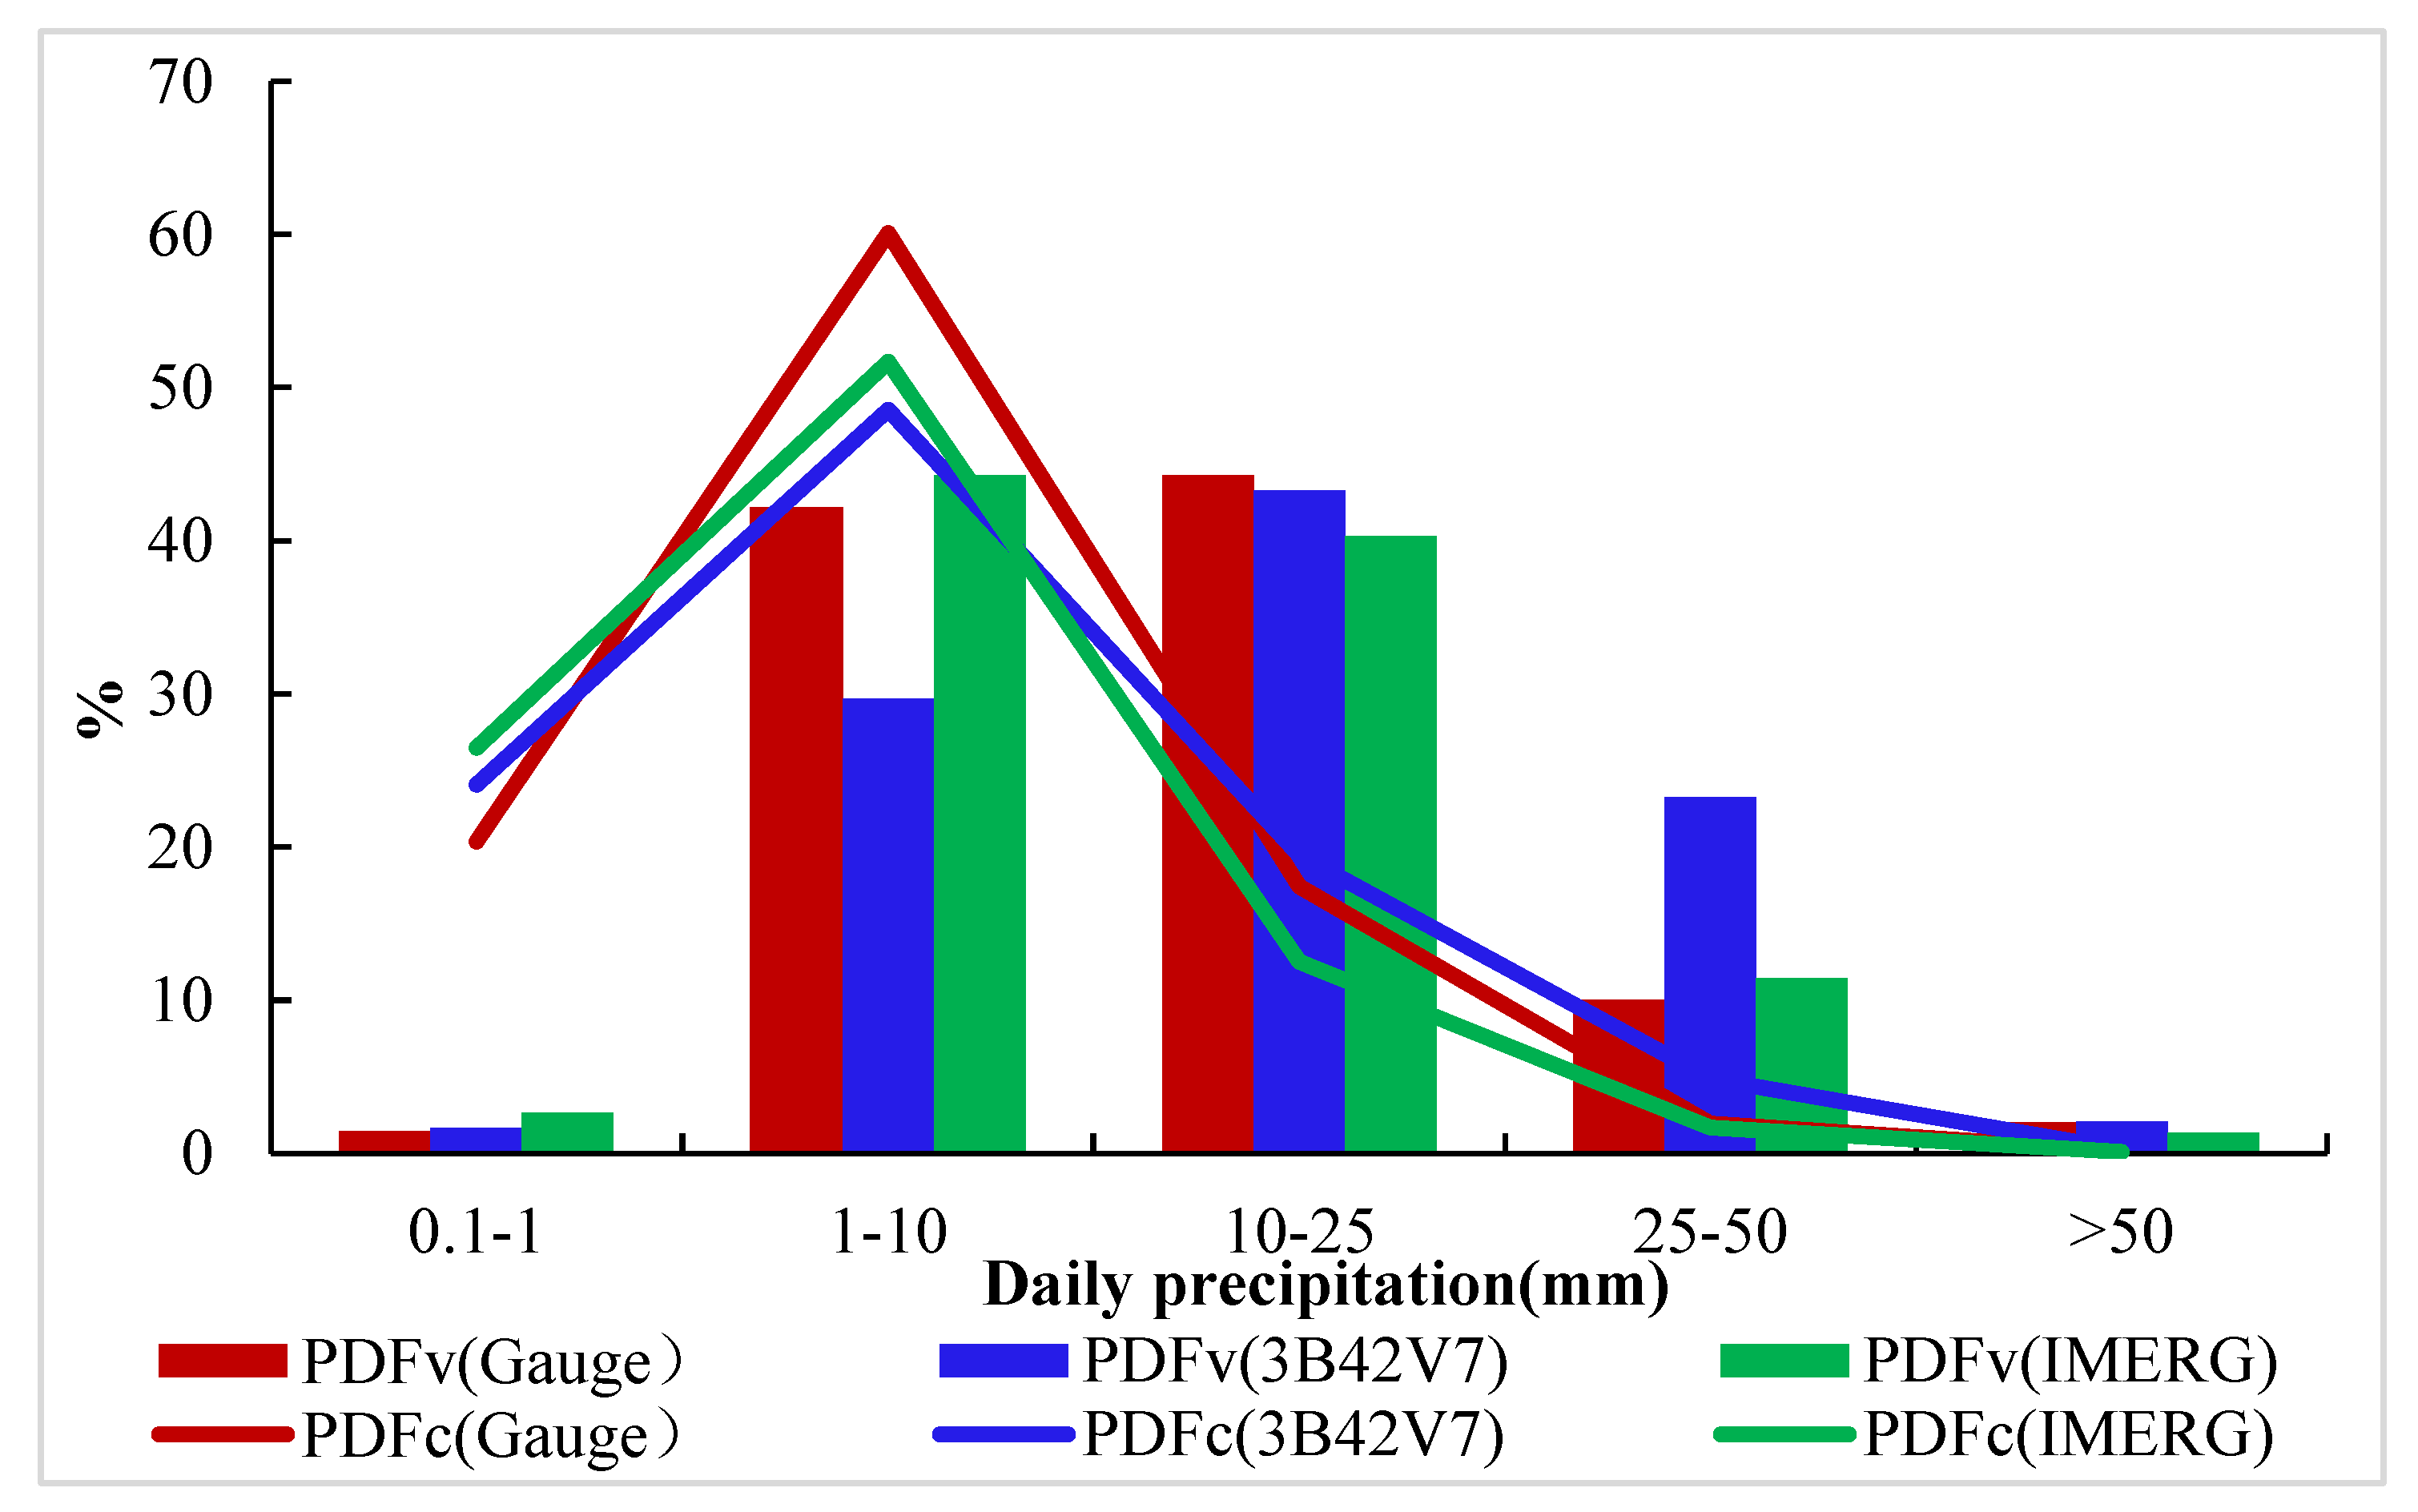
3.4. Evaluation of 3B42V7 and IMERG under Different Precipitation Intensity

Figure 9 inter-compares the PDFc and PDFv of the daily precipitation from the gauge measurements and the SPPs. In terms of PDFc and PDFv, IMERG was superior to 3B42V7 except for detection of extreme precipitation events (0~1 mm day−1 and >50 mm day−1). Both 3B42V7 and IMERG tended to overestimate the trace precipitation events, but the error of IMERG was greater than 3B42V7 in detecting trace precipitation and torrential precipitation. However, there was a bigger error of 3B42V7 in detecting heavy precipitation (25~50 mm day−1), and IMERG demonstrated better ability in capturing light precipitation events (1~10 mm day−1). When the precipitation rate was moderate (10~25 mm day−1), 3B42V7 performed slightly better than IMERG.

4. Discussion

The aforementioned analysis provided a quantitative comparison between 3B42V7 and IMERG with corresponding gauge data at different scales. The deficiencies and possible sources of errors may be related to the influence of different sensors, topography, precipitation patterns, and retrieval algorithms adopted in the precipitation estimates [57].
3B42V7 and IMERG had similarly high correlation with the gauge precipitation (mean CC values of 0.85 and 0.92 for 3B42V7 and IMERG, respectively) at monthly scale, but both SPPs showed low correlation with the gauge precipitation (mean CC values of 0.41 and 0.50 for 3B42V7 and IMERG, respectively) at daily scale (Figure 3). The main reason is that both 3B42V7 and IMERG provide precipitation estimates from multiple satellites via monthly gauge analyses [21,24]. The error might also be from the historical records from rain gauges. Besides, the five tributaries are typical plateau mountain area characterized by complex topography and strong convectional weather, which would still be challenging for 3B42V7 and IMERG to have relatively accurate precipitation estimates under current observation skills. On the one hand, it was found in this study that the characteristic values in a 3B42V7 or IMERG grid were different greatly (Table 2 and Table 3). Several studies have shown that the complex topography affects the circulation system of precipitation, resulting in a significant spatial difference of precipitation [58,59,60,61]. On the other hand, the passive microwave algorithms of SPPs rely mainly on scattering by ice, but the orographic precipitation might not produce enough ice aloft [62]. Therefore, complex topography and related warm rain process are a possible explanation for the underperformances of both SPPs over the five tributaries [36,41].
To further verify that the accuracy of IMERG and 3B42V7 is affected by terrain features, the variations of correlation coefficient (CC), relative bias (BIAS), probability of detection (POD), and equitable threat score (ETS) with increasing elevation and slope were investigated, as shown in Figure 10 and Figure 11. From Figure 10, we could see that the CC value of 3B42V7, BIAS value, POD value, and ETS value of both 3B42V7 and IMERG tended to decrease significantly as the elevation increased with a p-value less than 0.05 and relatively high correlation coefficient. It was clear that the accuracy of the two SPPs was significantly correlated with elevation. As a whole, the accuracy of 3B42V7 and IMERG decreased with the increase of elevation over the five tributaries, although the variation of BIAS value indicated that 3B42V7 and IMERG had gradually changed from overestimation to underestimation of precipitation as altitude increased. Figure 11 shows that there was no obvious correlation between these evaluation indices and slope. The possible reason for this is that most gauges located on slopes between 3 and 7 degrees made it hard to see how these evaluation indices varied with slope.
IMERG generally outperformed 3B42V7 in detecting precipitation in terms of CC, RMSE, MBE, BIAS, POD, FAR, and ETS, which is consistent with the findings of most previous studies over the Tibetan Plateau [40,41,42,62]. Figure 10 and Figure 11 again indicate the superiority of IMERG in detecting precipitation amount and comprehensive prediction capability of capturing daily precipitation events with higher CC, POD, and ETS and lower BIAS.
IMERG underestimated torrential precipitation (greater than 50 mm day−1). The result of this study is similar to some previous reports, such as the study in Malaysia [63], in a mountainous watershed in Myanmar [1], over high-elevation (>4500 m) regions of the Tibetan Plateau [42]. However, it was reported that IMERG has a relatively good detection accuracy for heavy precipitation events (> 50 mm day−1) in lower elevation (<3500 m) regions of the Tibetan Plateau [42]. Besides, over the upper Mekong River Basin, He et al. [31] showed that IMERG overestimates the amounts of torrential precipitation (greater than 50 mm day−1). Measuring surface precipitation is of cardinal significance, especially for the heavy precipitation events occurring in mountainous areas that are prone to causing floods.
Besides, both 3B42V7 and IMERG overestimated the occurrences and amounts of trace precipitation (0.1~1.0 mm day−1). It might be due to evaporation and the small and tiny raindrops that could not fall in the atmosphere profiles during the warm seasons. However, the error of IMERG in detecting trace precipitation was greater than 3B42V7 (Figure 8), which is different from the conclusion that IMERG has an advantage in capturing light precipitation events (less than 1.0 mm day−1) compared with 3B42V7 on the Tibetan Plateau [40]. The dual-frequency precipitation radar, carried by the GPM Core Observatory, has a higher sensitivity for capturing light precipitation rates than the precipitation radar onboard the TRMM satellite, providing a better ability of IMERG in detecting no-precipitation and light-precipitation events [23]. However, it was found in this study that IMERG did overestimate trace precipitation. Thus, the IMERG significantly overestimated the trace precipitation and underestimated torrential precipitation over the five tributaries, which requires exceptional attention from algorithm developers.
In this study, we only described that elevation and slope might affect the accuracy of 3B42V7 and IMERG, but the effect of topographic features are quite complex [64]. Therefore, further exploration of the errors in SPPs needs to continue.

5. Conclusions

This paper cross-evaluated 3B42V7 and IMERG over high mountainous tributaries in Lhasa. Based on a high-density network of rain gauges, our evaluation focused on examining the performance of 3B42V7 and IMERG products at the grid, region, and time scales. Furthermore, we have investigated the effect of precipitation intensity and topographical features on performances of both SPPs. The major conclusions are summarized as follows.
(1) Compared with the ground precipitation, both 3B42V7 and IMERG showed a similarly low level of correlation (mean CC values of 0.41 and 0.50 for 3B42V7 and IMERG, respectively) at daily scale. Elevation had a significant influence on the accuracy of 3B42V7 and IMERG in the five tributaries. The accuracy of 3B42V7 and IMERG decreased with the increase of elevation.
(2) IMERG performed better than 3B42V7 at daily and monthly scales. Both 3B42V7 and IMERG showed high correlation (mean CC values of 0.85 and 0.92 for 3B42V7 and IMERG, respectively) at monthly scale, but 3B42V7 tended to suffer from a systematic overestimation of monthly precipitation. Besides, IMERG performed better at a monthly scale, followed by daily scale and poor accuracy at six-hourly scale.
(3) At the grid cell, the 3B42V7 could better reflect the precipitation occurrences than IMERG, while the IMERG could better represent the average daily precipitation and the average daily precipitation in precipitation days. Besides, the precipitation in the five tributaries showed obvious spatial variability with a difference of characteristic values (average precipitation in precipitation days, and average daily precipitation) of rain gauges more than 20% in some IMERG grids and most 3B42V7 grids.
(4) IMERG overestimated trace precipitation and underestimated torrential precipitation. For light and heavy precipitation, the detection accuracy of IMERG was higher than 3B42V7, while for moderate precipitation, IMERG detection accuracy was slightly lower than 3B42V7.

Author Contributions

Conceptualization, S.W. and J.L.; methodology, S.W.; software, S.W. and X.Q.; data curation, S.W. and J.W.; writing—original draft preparation, S.W.; writing—review and editing, S.W. and J.Z.; visualization, X.Q. and J.W.; supervision, J.W. and J.L.; project administration, J.Z.; funding acquisition, J.L.

Funding

This research was funded by the National Natural Science Foundation of China (NSFC) (grants 91647108 and 91747203), and the Special Fund of the State Key Laboratory of Hydrology-Water Resources and Hydraulic Engineering (no 20185044312).

Acknowledgments

The authors would like to acknowledge Bureau of Hydrological and Water Resources of Tibet Autonomous Region for their support for this research and the TRMM and GPM research communities for making the data available to international users.

Conflicts of Interest

The authors declare no conflict of interest.

References

  1. Yuan, F.; Zhang, L.; Win, K.W.W.; Ren, L.; Zhao, C.; Zhu, Y.; Jiang, S.; Liu, Y. Assessment of GPM and TRMM multi-satellite precipitation products in streamflow simulations in a data sparse mountainous watershed in Myanmar. Remote Sens. 2017, 9, 302. [Google Scholar]
  2. Xia, T.; Wang, Z.; Zheng, H. Topography and Data Mining Based Methods for Improving Satellite Precipitation in Mountainous Areas of China. Atmosphere 2015, 6, 983–1005. [Google Scholar] [Green Version]
  3. Jiang, S.; Liu, S.; Ren, L.; Yong, B.; Zhang, L.; Wang, M.; Lu, Y.; He, Y. Hydrologic Evaluation of Six High Resolution Satellite Precipitation Products in Capturing Extreme Precipitation and Streamflow over a Medium-Sized Basin in China. Water 2017, 10, 25. [Google Scholar] [Green Version]
  4. Borga, M.; Anagnostou, E.N.; Blöschl, G.; Creutin, J. Flash Floods: Observations and analysis of hydro-meteorological controls. J. Hydrol. 2010, 394, 1–3. [Google Scholar]
  5. Germann, U.; Galli, G.; Boscacci, M.; Bolliger, M. Radar precipitation measurement in a mountainous region. Q. J. R. Meteorol. Soc. 2006, 132, 1669–1692. [Google Scholar]
  6. Steiner, M.; Smith, J.A.; Burges, S.J.; Alonso, C.V.; Darden, R.W. Effect of bias adjustment and rain gage data quality control on radar rainfall estimation. Water Resour. Res. 1999, 35, 2487–2503. [Google Scholar]
  7. Hrachowitz, M.; Weiler, M. Uncertainty of Precipitation Estimates Caused by Sparse Gauging Networks in a Small, Mountainous Watershed. J. Hydrol. Eng. 2011, 16, 460–471. [Google Scholar]
  8. Mei, Y.; Anagnostou, E.N.; Nikolopoulos, E.I.; Borga, M. Error Analysis of Satellite Precipitation Products in Mountainous Basins. J. Hydrometeorol. 2014, 15, 1778–1793. [Google Scholar]
  9. Yi, L.; Zhang, W.; Wang, K. Evaluation of heavy precipitation simulated by the WRF model using 4D-Var data assimilation with TRMM 3B42 and GPM IMERG over the Huaihe River basin China. Remote Sens. 2018, 10, 646. [Google Scholar]
  10. Tan, M.L.; Duan, Z. Assessment of GPM and TRMM Precipitation Products over Singapore. Remote Sens. 2017, 9, 720. [Google Scholar] [Green Version]
  11. Guo, R.; Liu, Y. Evaluation of satellite precipitation products with rain gauge data at different scales: Implications for hydrological applications. Water 2016, 8, 281. [Google Scholar]
  12. Ma, Z.; Zhou, L.; Yu, W.; Yang, Y.; Teng, H.; Shi, Z. Improving TMPA 3B43 V7 Data Sets Using Land-Surface Characteristics and Ground Observations on the Qinghai-Tibet Plateau. IEEE Geosci. Remote Sens. Lett. 2018, 15, 178–182. [Google Scholar]
  13. Janowiak, J.E.; Gruber, A.; Kondragunta, C.R.; Livezey, R.E.; Huffman, G.J. A Comparison of the NCEP-NCAR Reanalysis Precipitation and the GPCP Rain Gauge-Satellite Combined Dataset with Observational Error Considerations. J. Clim. 1998, 11, 2960–2979. [Google Scholar]
  14. Sorooshian, S.; Hsu, K.L.; Gao, X.; Gupta, H.V.; Braithwaite, D. Evaluation of PERSIANN system satellite-based estimates of tropical rainfall. Bull. Am. Meteorol. Soc. 2000, 81, 2035–2046. [Google Scholar]
  15. Joyce, R.J.; Janowiak, J.E.; Arkin, P.A.; Xie, P. CMORPH: A Method that Produces Global Precipitation Estimates from Passive Microwave and Infrared Data at High Spatial and Temporal Resolution. J. Hydrometeorol. 2004, 5, 487–503. [Google Scholar]
  16. Guo, J.; Zhai, P.; Wu, L.; Cribb, M.; Li, Z.; Ma, Z.; Wang, F.; Chu, D.; Wang, P.; Zhang, J. Diurnal variation and the influential factors of precipitation from surface and satellite measurements in Tibet. Int. J. Climatol. 2014, 34, 2940–2956. [Google Scholar]
  17. Simpson, J. The Tropical Rainfall Measuring Mission (TRMM). Meteorol. Atmos. Phys. 1988, 60, 19–36. [Google Scholar]
  18. Tong, K.; Su, F.; Yang, D.; Hao, Z. Evaluation of satellite precipitation retrievals and their potential utilities in hydrologic modeling over the Tibetan Plateau. J. Hydrol. 2014, 519, 423–437. [Google Scholar]
  19. Sohn, B.J.; Han, H.J.; Seo, E.K. Validation of Satellite-Based High-Resolution Rainfall Products over the Korean Peninsula Using Data from a Dense Rain Gauge Network. J. Appl. Meteorol. Climatol. 2010, 49, 701–714. [Google Scholar]
  20. Ringard, J.; Becker, M.; Seyler, F.; Linguet, L. Temporal and spatial assessment of four satellite rainfall estimates over French Guiana and north Brazil. Remote Sens. 2015, 7, 16441–16459. [Google Scholar]
  21. Huffman, G.J.; Bolvin, D.T.; Nelkin, E.J.; Wolff, D.B.; Adler, R.F.; Gu, G.; Hong, Y.; Bowman, K.P.; Stocker, E.F. The TRMM multisatellite precipitation analysis (TMPA): Quasi-global, multiyear, combined-sensor precipitation estimates at fine scales. J. Hydrometeorol. 2007, 8, 38–55. [Google Scholar]
  22. Chandrasekar, V.; Le, M. Evaluation of profile classification module of GPM-DPR algorithm after launch. In Proceedings of the IEEE International Geoscience and Remote Sensing Symposium (IGARSS), Milan, Italy, 26–31 July 2015; pp. 5174–5177. [Google Scholar]
  23. Hou, A.Y.; Kakar, R.K.; Neeck, S.; Azarbarzin, A.A.; Kummerow, C.D.; Kojima, M.; Oki, R.; Nakamura, K.; Iguchi, T. The global precipitation measurement mission. Bull. Am. Meteorol. Soc. 2014, 95, 701–722. [Google Scholar]
  24. Liu, Z.; Ostrenga, D.; Vollmer, B.; Deshong, B.; Macritchie, K.; Greene, M.; Kempler, S. Global precipitation measurement mission products and services at the NASA GES DISC. Bull. Am. Meteorol. Soc. 2017, 98, 437–444. [Google Scholar]
  25. Hussain, Y.; Satgé, F.; Hussain, M.B. Performance of CMORPH, TMPA, and PERSIANN rainfall datasets over plain, mountainous, and glacial regions of Pakistan. Theor. Appl. Climatol. 2018, 131, 1119–1132. [Google Scholar]
  26. Kim, J.P.; Jung, I.W.; Park, K.P.; Yoon, S.K.; Lee, D. Hydrological utility and uncertainty of multi-satellite precipitation products in the mountainous region of South Korea. Remote Sens. 2016, 8, 608. [Google Scholar]
  27. Bitew, M.M.; Gebremichael, M. Evaluation of satellite rainfall products through hydrologic simulation in a fully distributed hydrologic model. Water Resour. Res. 2011, 47. [Google Scholar] [CrossRef]
  28. Sharifi, E.; Steinacker, R.; Saghafian, B. Assessment of GPM-IMERG and Other Precipitation Products against Gauge Data under Different Topographic and Climatic Conditions in Iran: Preliminary Results. Remote Sens. 2016, 8, 135. [Google Scholar] [Green Version]
  29. Tang, G.; Ma, Y.; Di, L.; Zhong, L.; Yang, H. Evaluation of GPM Day-1 IMERG and TMPA Version-7 legacy products over Mainland China at multiple spatiotemporal scales. J. Hydrol. 2016, 533, 152–167. [Google Scholar]
  30. Kim, K.; Park, J.; Baik, J.; Choi, M. Evaluation of topographical and seasonal feature using GPM IMERG and TRMM 3B42 over Far-East Asia. Atmos. Res. 2017, 187, 95–105. [Google Scholar]
  31. He, Z.; Yang, L.; Tian, F.; Ni, G.; Hou, A.; Lu, H. Intercomparisons of Rainfall Estimates from TRMM and GPM Multisatellite Products over the Upper Mekong River Basin. J. Hydrometeorol. 2017, 18, 413–430. [Google Scholar]
  32. Frédéric, S.; Xavier, A.; Zolá, R.P.; Hussain, Y.; Timouk, F.; Garnier, J.; Bonnet, M.P. Comparative Assessments of the Latest GPM Mission’s Spatially Enhanced Satellite Rainfall Products over the Main Bolivian Watersheds. Remote Sens. 2017, 9, 369. [Google Scholar]
  33. Beria, H.; Nanda, T.; Bisht, D.S.; Chatterjee, C. Does the GPM mission improve the systematic error component in satellite rainfall estimates over TRMM? An evaluation at a pan-India scale. Hydrol. Earth Syst. Sci. 2017, 21, 6117–6134. [Google Scholar] [Green Version]
  34. Wang, X.; Ding, Y.; Zhao, C.; Wang, J. Similarities and improvements of GPM IMERG upon TRMM 3B42 precipitation product under complex topographic and climatic conditions over Hexi region, Northeastern Tibetan Plateau. Atmos. Res. 2019, 218, 347–363. [Google Scholar]
  35. Li, X.; Zhang, Q.; Xu, C.Y. Assessing the performance of satellite-based precipitation products and its dependence on topography over Poyang Lake basin. Theor. Appl. Climatol. 2014, 115, 713–729. [Google Scholar]
  36. Dinku, T.; Chidzambwa, S.; Ceccato, P.; Connor, S.J.; Ropelewski, C.F. Validation of high-resolution satellite rainfall products over complex terrain. Int. J. Remote Sens. 2008, 29, 4097–4110. [Google Scholar]
  37. Mauricio, Z.B.; Alexandra, N.; Christian, B.; Koen, V.; Lars, R. Temporal and spatial evaluation of satellite-based rainfall estimates across the complex topographical and climatic gradients of Chile. Hydrol. Earth Syst. Sci. 2017, 21, 1295–1320. [Google Scholar] [Green Version]
  38. Hong, Y.; Hsu, K.L.; Moradkhani, H.; Sorooshian, S. Uncertainty quantification of satellite precipitation estimation and Monte Carlo assessment of the error propagation into hydrologic response. Water Resour. Res. 2006, 42. [Google Scholar] [CrossRef] [Green Version]
  39. Tang, G.; Long, D.; Hong, Y.; Gao, J.; Wan, W. Documentation of multifactorial relationships between precipitation and topography of the Tibetan Plateau using spaceborne precipitation radars. Remote Sens. Environ. 2018, 208, 82–96. [Google Scholar]
  40. Zhang, S.; Wang, D.; Qin, Z.; Zheng, Y.; Guo, J. Assessment of the GPM and TRMM Precipitation Products Using the Rain Gauge Network over the Tibetan Plateau. J. Meteorol. Res. 2018, 32, 324–336. [Google Scholar]
  41. Ma, Y.; Tang, G.; Long, D.; Yong, B.; Zhong, L.; Wan, W.; Hong, Y. Similarity and error intercomparison of the GPM and its predecessor-TRMM multisatellite precipitation analysis using the best available hourly gauge network over the Tibetan Plateau. Remote Sens. 2016, 8, 569. [Google Scholar]
  42. Xu, R.; Tian, F.; Yang, L.; Hu, H.; Lu, H.; Hou, A. Ground validation of GPM IMERG and trmm 3B42V7 rainfall products over Southern Tibetan plateau based on a high-density rain gauge network. J. Geophys. Res. 2017, 122, 910–924. [Google Scholar]
  43. Xie, J.; Liu, J.; Du, M.; Kang, S.; Wang, K. Analysis of the Observation Results of Temperature and Precipitation over an Alpine Mountain, the Lhasa River Basin. Prog. Geogr. 2010, 28, 223–230. [Google Scholar]
  44. Ning, A.; Liu, T.C. Characteristics of isotope distribution of atmospheric precipitation in the lasa river area. J. Miner. Petrol. 2000, 65, 95–99. [Google Scholar]
  45. Liu, T. Hydrological characteristics of Yalungzangbo River. Acta Geogr. Sin. 1999, 54, 157–164. [Google Scholar]
  46. Lin, X.; Zhang, Y.; Yao, Z.; Gong, T.; Wang, H.; Chu, D.; Liu, L.; Zhang, F. The trend on runoff variations in the Lhasa River Basin. J. Geogr. Sci. 2008, 18, 95–106. [Google Scholar]
  47. Dai, F.; Lv, Z.; Liu, G. Assessing Soil Quality for Sustainable Cropland Management Based on Factor Analysis and Fuzzy Sets: A Case Study in the Lhasa River Valley, Tibetan Plateau. Sustainability 2018, 10, 3477. [Google Scholar]
  48. Shen, Y.; Xiong, A. Validation and comparison of a new gauge-based precipitation analysis over mainland China. Int. J. Climatol. 2016, 265, 252–265. [Google Scholar]
  49. Legates, D.R.; Willmott, C.J. Mean seasonal and spatial variability in gauge-corrected, global precipitation. Int. J. Climatol. 1990, 10, 111–127. [Google Scholar]
  50. Wang, Z.; Zhong, R.; Lai, C. Evaluation and hydrologic validation of TMPA satellite precipitation product downstream of the Pearl River Basin, China. Hydrol. Process. 2017, 31, 4169–4182. [Google Scholar]
  51. Mcclave, J.; Benson, P.G.; Sincich, T. Statistics for Business and Economics: Pearson New International Edition; Pearson Schweiz Ag: Zug, Switzerland, 2013; Volume 29, pp. 1823–1830. [Google Scholar]
  52. Lei, S. Assessment of local influence for f-test in linear regression model. J. Syst. Sci. Math. Sci. 1999, 12, 33–39. [Google Scholar]
  53. Ebert, E.E.; Janowiak, J.E.; Kidd, C. Comparison of near-real-time precipitation estimates from satellite observations and numerical models. Bull. Am. Meteorol. Soc. 2007, 88, 47–64. [Google Scholar]
  54. Zhe, L.; Yang, D.; Yang, H. Multi-scale evaluation of high-resolution multi-sensor blended global precipitation products over the Yangtze River. J. Hydrol. 2013, 500, 157–169. [Google Scholar]
  55. Kirstetter, P.E.; Hong, Y.; Gourley, J.J.; Schwaller, M.; Petersen, W.; Zhang, J. Comparison of TRMM 2A25 products, version 6 and version 7, with NOAA/NSSL ground radar-based national mosaic QPE. J. Hydrometeorol. 2013, 14, 661–669. [Google Scholar]
  56. Prat, O.P.; Nelson, B.R. Precipitation Contribution of Tropical Cyclones in the Southeastern United States from 1998 to 2009 Using TRMM Satellite Data. J. Clim. 2013, 26, 1047–1062. [Google Scholar]
  57. Beighley, E.; Ray, R.L.; He, Y.; Lee, H.; Schaller, L.; Andreadis, K.; Durand, M.; Alsdorf, D.; Shum, C.K. Comparing satellite derived precipitation datasets using the Hillslope River Routing (HRR) model in the Congo River Basin. Hydrol. Process. 2011, 25, 3216–3229. [Google Scholar]
  58. Whipple, K.X.; Gasparini, N.M. Tectonic control of topography, rainfall patterns, and erosion during rapid post-12 Ma uplift of the Bolivian Andes. Lithosphere 2014, 6, 251–268. [Google Scholar]
  59. Tapponnier, P.; Xu, Z.; Roger, F.; Meyer, B.; Arnaud, N.; Wittlinger, G.; Yang, J. Oblique stepwise rise and growth of the Tibet plateau. Science 2001, 294, 1671–1677. [Google Scholar]
  60. Champagnac, J.D.; Molnar, P.; Sue, C.; Herman, F. Tectonics, Climate, and Mountain Topography. J. Geophys. Res. Solid Earth 2012, 117. [Google Scholar] [CrossRef]
  61. Whipple, K.X.; Kirby, E.; Brocklehurst, S.H. Geomorphic limits to climate-induced increases in topographic relief. Nature 1999, 401, 39–43. [Google Scholar]
  62. Yuan, F.; Wang, B.; Shi, C.; Cui, W.; Zhao, C.; Liu, Y.; Ren, L.; Zhang, L.; Zhu, Y.; Chen, T.; et al. Evaluation of hydrological utility of IMERG Final run V05 and TMPA 3B42V7 satellite precipitation products in the Yellow River source region, China. J. Hydrol. 2018, 567, 596–711. [Google Scholar]
  63. Leong, M.; Santo, H. Comparison of GPM IMERG, TMPA 3B42 and PERSIANN-CDR satellite precipitation products over Malaysia. Atmos. Res. 2018, 202, 63–76. [Google Scholar]
  64. Villarini, G.; Krajewski, W.F. Review of the Different Sources of Uncertainty in Single Polarization Radar-Based Estimates of Rainfall. Surv. Geophys. 2010, 31, 107–129. [Google Scholar]
Figure 1. Location of the five tributaries in Lhasa and the distribution of rain gauges.
Remotesensing 11 02080 g001
Figure 2. Spatial distribution of average daily precipitation derived from rain gauges, 3B42V7, and IMERG over five tributaries and its peripheral regions, from April 1st to September 30th, 2014–2017.
Remotesensing 11 02080 g002
Figure 3. Boxplot of correlation coefficient (CC), root mean square error (RMSE), mean absolute error (MBE), and relative bias (BIAS) between satellite-based and rain gauge daily precipitation at 67 gauges, during the period of April 1st to September 30th, 2014–2017. Five lines from bottom to top for one box represent minimum value, 25th percentile, 50th percentile, 75th percentile, and maximum value, respectively.
Remotesensing 11 02080 g003
Figure 4. Spatial distribution of CC, RMSE, MBE, and BIAS between satellite-based and rain gauge daily precipitation over five tributaries during the period of April 1st to September 30th, 2014–2017.
Remotesensing 11 02080 g004
Figure 5. Boxplot of the detecting ability of precipitation occurrences of 3B42V7 and IMERG at 67 gauges. Five lines from bottom to top for one box represent minimum value, 25th percentile, 50th percentile, 75th percentile, and maximum value, respectively.
Remotesensing 11 02080 g005
Figure 6. Scatterplots of precipitation between IMERG, 3B42V7 products, and rain-gauge data at six-hourly (a, only scatterplots of IMERG and rain-gauge data), daily (b,c), and monthly (d,e) timescales during the whole study period. The diagonal reference line is indicated by a dashed line, and the fitting line (determined via the least-squares method) is indicated by a red solid line.
Remotesensing 11 02080 g006
Figure 7. Boxplot of the detecting ability of precipitation occurrences of daily and six-hourly IMERG products at 67 gauges. Five lines from bottom to top for one box represent minimum value, 25th percentile, 50th percentile, 75th percentile, and maximum value, respectively.
Remotesensing 11 02080 g007
Figure 8. Mean monthly precipitation in the five tributaries from rain gauges, 3B42V7, and IMERG, from April to September 2014–2017.
Remotesensing 11 02080 g008
Figure 9. PDFc (probability distribution function in precipitation occurrence) and PDFv (probability distribution function in precipitation volume) of daily precipitation with different precipitation rates, as derived from rain gauges, IMERG, and 3B42V7.
Remotesensing 11 02080 g009
Figure 10. Relations between evaluation metrics from 3B42V7, IMERG, and elevation in the five tributaries. Each dot represents a rain gauge. Solid lines represent the linear trends estimated by the least-squares error method.
Remotesensing 11 02080 g010
Figure 11. Relations between evaluation metrics from 3B42V7, IMERG, and slope in the five tributaries. Each dot represents a rain gauge. Solid lines represent the linear trends estimated by the least-squares error method.
Remotesensing 11 02080 g011
Table 1. List of the statistical indices to quantify the performance of the SPPs (satellite precipitation products).
Statistical IndexUnitFormulaPerfect Value
Correlation coefficient (CC)NA C C = [ i = 1 n ( S i S ¯ ) ( G i G ¯ ) ] 2 i = 1 n ( S G ) 2 i = 1 n ( G G ) 2 1
Root mean square error (RMSE)mm R M S E = 1 n i = 1 n ( S i G i ) 2 0
Mean absolute error (MBE)mm A B E = 1 n i = 1 n | S i G i | 0
Relative bias (BIAS)NA B ias = i = 1 n ( S i G i ) i = 1 n G i 0
Probability of detection (POD)NA P O D = a a + c 1
False alarm ratio (FAR)NA F A R = b a + b 0
Frequency bias index (FBI)NA F B I = a + b a + c 1
Equitable threat score (ETS)NA E T S = a H e a + b + c H e
H e = ( a + b ) ( a + c ) ( a + b + c + d )
1
Notation: n, the number of satellite/gauge data; i, the ith of satellite-gauge data; Gi, gauge observed precipitation; Si, satellite precipitation estimates; G i ¯ and S i ¯ , the average precipitation of gauge observed and satellite estimates, respectively. Each pairing of satellite-gauge data can be classified as a hit represented by a (observed precipitation detected correctly), a false alarm represented by b (detected precipitation not observed), a miss represented by c (observed precipitation not detected), or a correct negative represented by d (precipitation not observed and not detected) event.
Table 2. Comparison of characteristic values between 3B42V7 and rain gauge precipitation in the chosen 3B42V7 grids during warm seasons from 2014 to 2017.
GridName of GaugesNumber of Precipitation Days aAverage Precipitation (mm/day) in Precipitation DaysAverage Precipitation (mm/day)
GaugeAverage b3B42V7GaugeAverage c3B42V7GaugeAverage d3B42V7
A1Bolaqie219233 2067.6 7.2 9.13.0 3.0 3.4
Wumatang2376.9 3.0
Dangquka2326.6 2.8
Guoqing2316.6 2.8
Dishugang2448.7 3.9
Baqiongduo2396.9 3.0
Gesangka2257.0 2.9
Longreng2347.1 3.0
A2Zhalangduo218209 2086.2 6.2 9.42.5 2.4 3.6
Mengga2056.1 2.3
Maxiang2166.7 2.6
Ema1965.9 2.1
A3Chundui222216 2207.7 7.7 10.1 3.1 3.0 4.0
Kadong2138.4 3.3
Kazi2066.9 2.6
Palangdui2197.7 3.1
Nianbo2248.0 3.3
Baya2167.8 3.1
Baiding2127.4 2.9
A4Emuduo264255 247 7.1 7.9 9.8 3.4 3.7 4.4
Niaoduogang2438.1 3.6
Demoxiong2578.5 4.0
A5Puba173181 177 6.8 7.0 9.7 2.1 2.3 3.1
Laduo1906.8 2.4
Pusong1887.7 2.6
Xuela1716.8 2.1
a Days with precipitation ≥1 mm; b Average of the precipitation day measured by gauges in a grid; c Average precipitation in precipitation days measured by gauges in a grid; d Average precipitation measured by gauges in a grid.
Table 3. Comparison of characteristic values between 3B42V7, IMERG, and rain gauge precipitation in the chosen IMERG grids during warm seasons from 2014 to 2017.
GridsName of GaugesNumber of Precipitation Days aAverage Precipitation (mm/day) in Precipitation DaysAverage Precipitation (mm/day)
GaugeAverage b3B42V7IMERGGaugeAverage c3B42V7IMERGGaugeAverage d3B42V7IMERG
B1Guoqing231238 2062616.6 7.4 9.1 7.4 2.8 3.2 3.4 3.5
Dishugang2448.7 3.9
Baqiongduo2396.9 3.0
B2Zhalangduo218213 2082426.2 6.3 9.4 6.3 2.5 2.5 3.6 2.8
Mengga2056.1 2.3
Maxiang2166.7 2.6
B3Kazi206215 2202606.9 7.5 10.1 7.0 2.6 2.9 4.0 3.3
Nianbo2248.0 3.3
B4Emuduo264254 2472677.1 7.6 9.8 7.1 3.4 3.5 4.4 3.5
Niaoduogang2438.1 3.6
B5Puba173181 1772146.8 7.0 9.7 6.4 2.1 2.3 3.1 2.5
Laduo1906.8 2.4
Pusong1887.7 2.6
Xuela1716.8 2.1

