Article

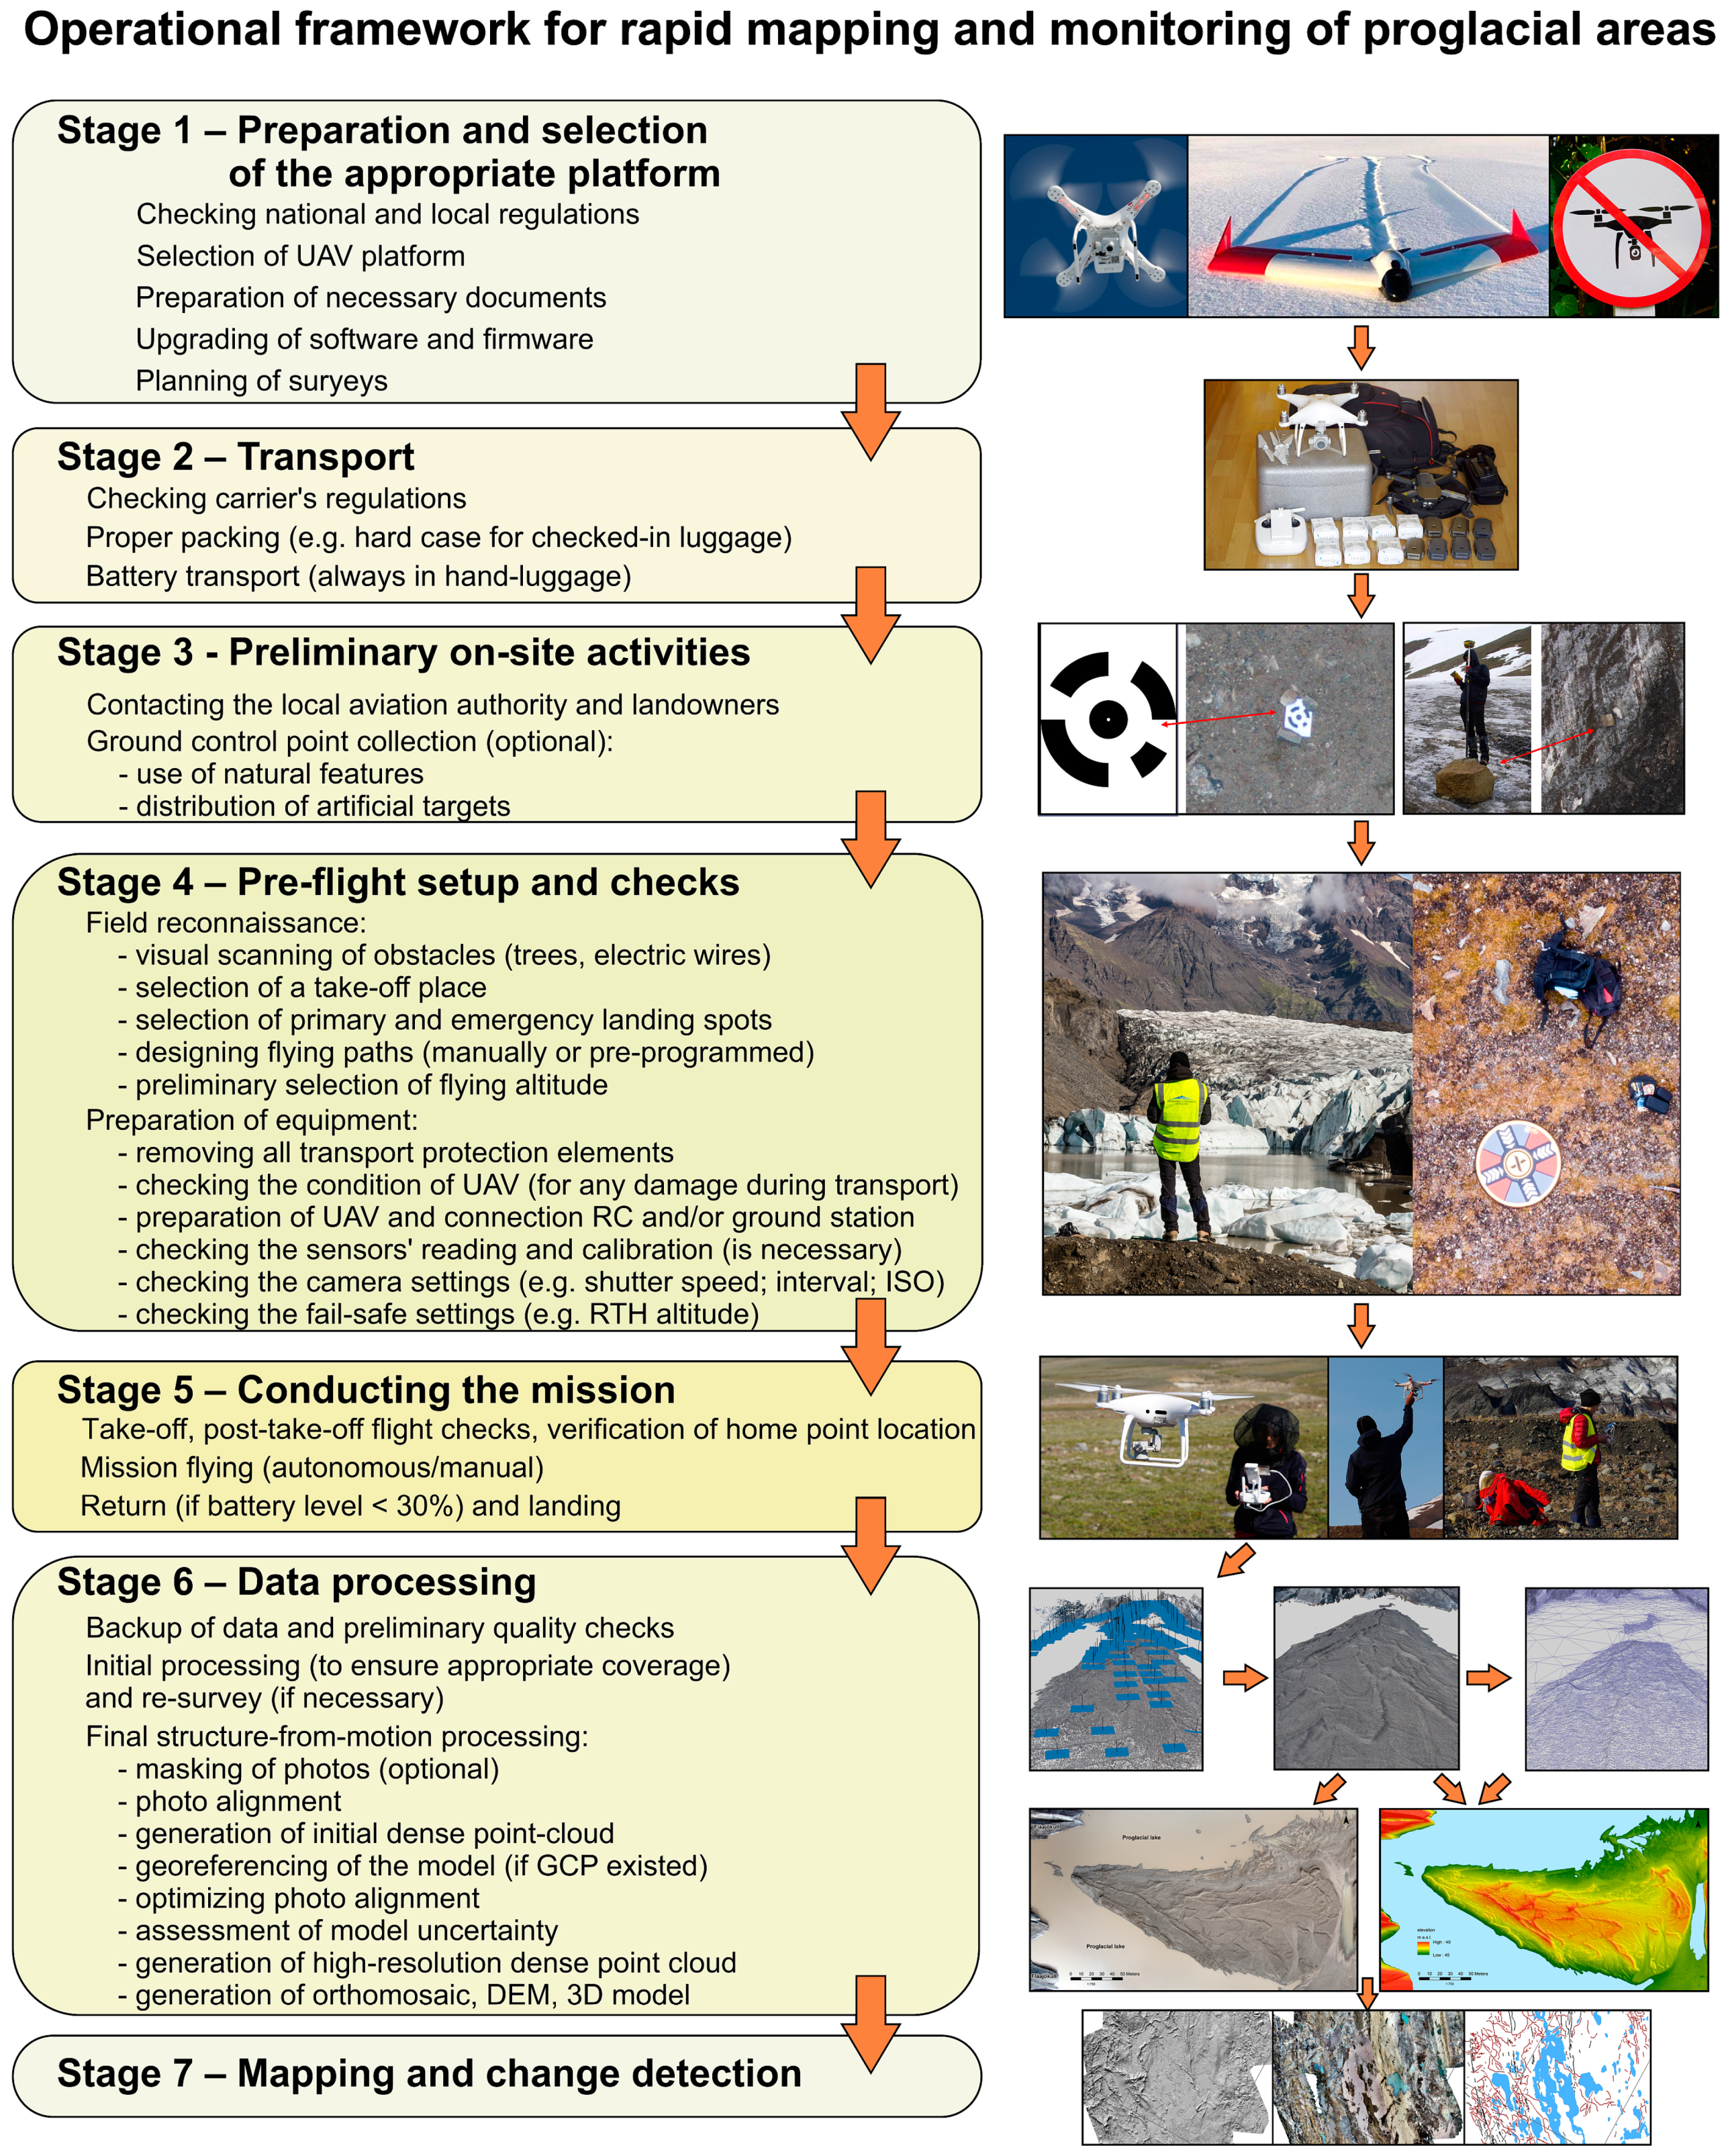
Operational Framework for Rapid, Very-high Resolution Mapping of Glacial Geomorphology Using Low-cost Unmanned Aerial Vehicles and Structure-from-Motion Approach

by
Marek W. Ewertowski
1,*,
Aleksandra M. Tomczyk
1,
David J. A. Evans
2,
David H. Roberts
2 and
Wojciech Ewertowski
1
1
Faculty of Geographical and Geological Sciences, Adam Mickiewicz University, Krygowskiego 10, 61-680 Poznań, Poland
2
Department of Geography, Durham University, Lower Mountjoy, South Road, Durham DH1 3LE, UK
*
Author to whom correspondence should be addressed.
Remote Sens. 2019, 11(1), 65; https://doi.org/10.3390/rs11010065
Submission received: 1 December 2018 / Revised: 14 December 2018 / Accepted: 24 December 2018 / Published: 1 January 2019
(This article belongs to the Section Remote Sensing in Geology, Geomorphology and Hydrology)

Abstract

:
This study presents the operational framework for rapid, very-high resolution mapping of glacial geomorphology, with the use of budget Unmanned Aerial Vehicles and a structure-from-motion approach. The proposed workflow comprises seven stages: (1) Preparation and selection of the appropriate platform; (2) transport; (3) preliminary on-site activities (including optional ground-control-point collection); (4) pre-flight setup and checks; (5) conducting the mission; (6) data processing; and (7) mapping and change detection. The application of the proposed framework has been illustrated by a mapping case study on the glacial foreland of Hørbyebreen, Svalbard, Norway. A consumer-grade quadcopter (DJI Phantom) was used to collect the data, while images were processed using the structure-from-motion approach. The resultant orthomosaic (1.9 cm ground sampling distance—GSD) and digital elevation model (7.9 cm GSD) were used to map the glacial-related landforms in detail. It demonstrated the applicability of the proposed framework to map and potentially monitor detailed changes in a rapidly evolving proglacial environment, using a low-cost approach. Its coverage of multiple aspects ensures that the proposed framework is universal and can be applied in a broader range of settings.

Graphical Abstract

1. Introduction

The ongoing glacier retreat has resulted in the continuous exposure of proglacial areas. Such areas contain important information about the glacial process–form relationships that manifest themselves in specific landform assemblages (glacial landsystems). However, the preservation potential of freshly exposed glacial landforms can be very low, as proglacial terrains are one of the most dynamic parts of the glaciated landscapes (cf. [1,2,3,4]).
Rapid mapping and geomorphological characterization of such areas are important from a glaciological and geomorphological standpoint, for a proper understanding and reconstruction of the glacier–landform dynamics. However, the annual patterns of recession and the relatively small areas exposed every year mean that carrying out regular aerial or satellite survey is expensive and, therefore, impractical. Moreover, some of the landforms are very subtle, making it impossible to recognize them, even with high-resolution satellite imagery (Figure 1). Recent advances in technology have enabled the development of low-cost alternatives for traditional aerial surveys [5,6,7,8,9,10]. Small unmanned aerial vehicles (UAVs) can be used to acquire high-resolution (several cm ground sampling distance (GSD)), low-altitude images. These UAV-based images can subsequently be processed using structure-from-motion (SfM), to generate detailed orthophotomaps and digital elevation models.
The last decade has seen a significant drop in the price of UAVs, with simple but powerful ready-to-use consumer-grade drones becoming abundant in retail outlets. Such a significant increase in the availability and usability of drones has caused a revolution in mapping, probably the biggest since the development of GPS. Simple to use, yet powerful, platforms are now common elements in many mapping projects, including geomorphological mapping, (e.g., [5,11,12,13,14,15,16,17,18,19]). Examples of the use of UAVs in geomorphological research most often include mapping of small fragments of proglacial areas [16,20,21,22,23,24,25,26,27], sometimes concentrated on specific landforms like recessional push-moraine ridges [20] or flutes [22,28]. The increasing popularity of UAVs and SfM has generated significant research interest in various approaches to assess quality and optimize the collection and processing of the UAV-generated data (e.g., [29,30,31,32,33,34,35,36]). However, despite the growing number of studies implementing UAV in glacial geomorphology, no uniform approach has been proposed that could serve as a framework for future study and ensure meaningful compatibility of output (as most of the previous works varied in terms of equipment used, size of the surveyed area, flying altitude, number and overlap of the images, capturing strategy, spatial and temporal resolution, processing specifics; moreover, in some publications such details were not fully specified). Therefore, there is a need for an operational framework, which would include various aspects related to UAV-mission planning and execution.
The aim of this study was to demonstrate an operational framework for using low-cost UAV and structure-from-motion photogrammetry for rapid mapping and monitoring of glacial geomorphology, in front of retreating glaciers. The proposed framework consists of seven stages: (1) Preparation and selection of the appropriate platform; (2) transport; (3) preliminary on-site activities (including optional ground-control-point collection); (4) pre-flight setup and checks; (5) conducting the mission; (6) data processing; and (7) mapping and change detection. Operational procedures were developed on the basis of several years of application of different types of consumer-grade UAVs over a wide range of case studies representing ice margins of glaciers in Svalbard, Iceland, and Peru.

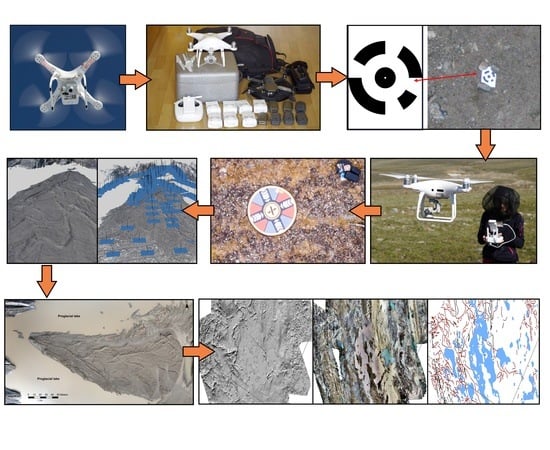
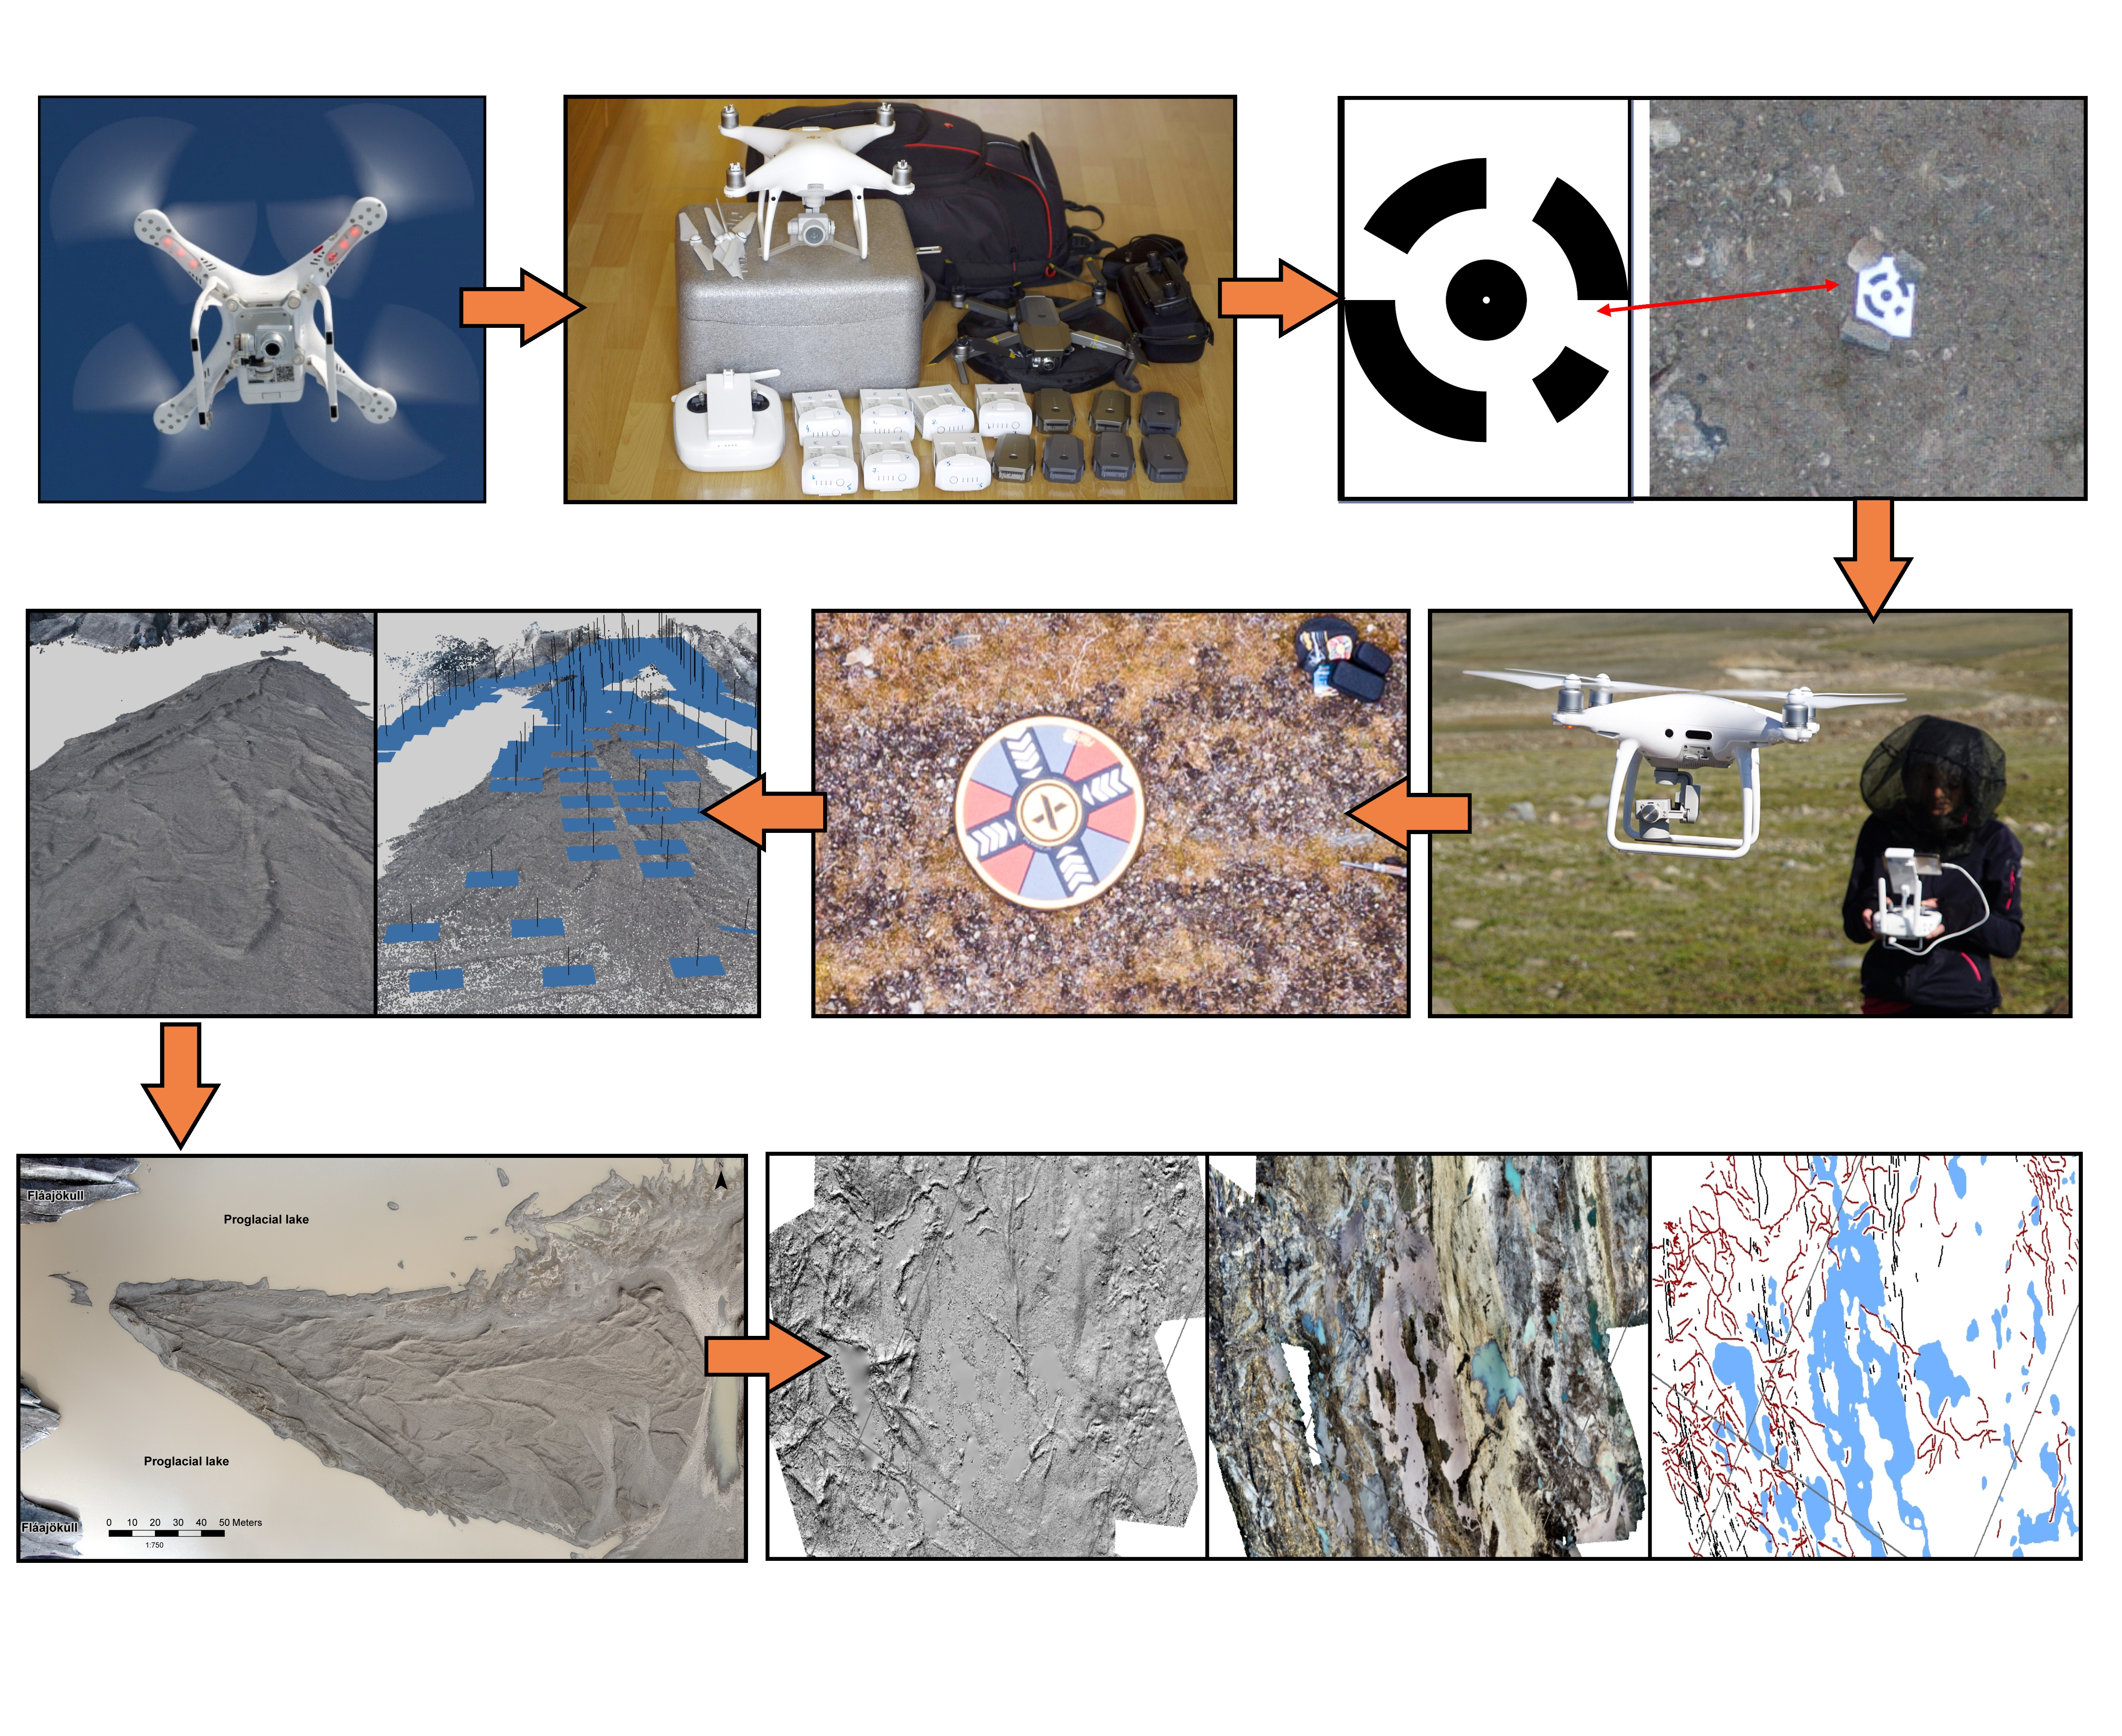
2. Operational Framework for Rapid Mapping and Monitoring of Proglacial Areas

The proposed operational framework for rapid mapping and monitoring of proglacial areas with the use of low-cost UAVs is divided into seven stages (Figure 2). UAV operations in cold environments are specific to the local conditions and, therefore, several procedures additional to those of normal operating conditions were taken into account. In this section, each of the operational stages is described, whereas, the application of the proposed framework for a real-world example of glacial mapping is provided in Section 3.

2.1. Stage 1—Preparation and Selection of the Appropriate Platform

During the planning stage for conducting rapid geomorphological mapping, the type of platform should be chosen in accordance with the terrain’s characteristics and the specified aims of the mapping, as well as the availability of a specific type/model of UAV at the research institution. The selection of UAV is dictated by the following:
  • Size of the study area.
  • Target product (orthomosaic/digital elevation model (DEM)/3D model) and its required GSD.
  • Accessibility of the terrain to be mapped, including type of available transport to and within the study area (by car, by boat, on foot, etc.) and accessibility of the power sources.
  • Character of the study: One-time mapping vs. regular monitoring.
  • Typical lighting condition.
  • Typical weather conditions, including temperature, precipitation, and wind regimes.
  • National and local regulation, which might exclude certain types of platforms or missions.
The last point is especially crucial for a successful UAV campaign. The growing number of UAVs has driven changes to the UAV-related regulations in many countries. A recent review [37] has provided information about legislations in nineteen countries, representing diverse legal systems. The regulations, however, tend to change dynamically with time and vary between countries. Therefore, the solution is to obtain the latest information for specific study areas, from the legal authorities. Such regulations may further limit the choice of the available platform, in terms of the following:
  • Technical prerequisites of allowed UAV such as weight, fail-safe systems, range.
  • Types of allowed missions, e.g., allowing only VLOS (visual line of sight) operations.
  • Non-fly zones related to airports, heliports, military areas, urban areas, conservation areas, etc.
  • Administrative measures, e.g., notification to local aviation authorities and need for permission from land-owners.
  • UAV-personnel requirements, limiting the use of UAV to certified operators.
It is essential to follow the regulations provided by national aviation authorities; however, in many cases it is not sufficient to ensure safe flying operations. Very often, contacting local authorities (such as managers of protected natural areas), the nearest airport, and private-ground owners is also necessary. In some countries, flying for scientific purposes requires prior registration (e.g., Norway and the USA) or licensing of operator (e.g., Poland), which must be done before the flying survey and, therefore, the appropriate time for preparation is required.
Depending on national regulations, various additional documents might be necessary. Documents such as operation manuals and flight procedure lists are obligatory in some countries, in others only voluntary; however, it is good to prepare such documents and follow the established procedure to ensure the safety of the project. In most countries, having the appropriate insurance cover is also necessary; however, the sum of this insurance (usually expressed in Special Drawing Rights [SDR]) varies from country to country.
The UAV sector is developing rapidly, such that a common situation is that new firmware and software updates are issued on a regular basis. It is a good practice to upgrade all kit at home before traveling into the field, as it is much easier to do it in a warm place with good internet connection than in the field. One of the most crucial preparation stages is double-checking that every piece of equipment works, including performing flight tests and calibration.
As for the planning timeframe for the UAV surveys, it is recommended to include some spare days in case of bad weather or other non-flying conditions. This is especially important for surveys in glacial environments where adverse weather conditions might last for days or even weeks. Packing spare equipment is also crucial, which preferably should also include a spare UAV and spare phone/tablet/ground control station (if required for flying).

2.2. Stage 2—Transport

Depending on the specific case study location, transport of the equipment into the field might involve air or sea travel. Despite the fact that UAVs are becoming more durable, still most of the damage to the equipment happens during transport. A proper preparation for the transport stage, including recognition of airline regulations, is therefore, crucial. If the UAV can fit into hand luggage, most airlines will accept it as such, and this is a recommended way of traveling. Larger UAVs have to be checked-in, and may therefore, require solid, rigid cases to withstand transport and luggage handling. Transport of the battery packs might be restricted, depending on the type of battery. LiPo (Lithium Polymer) batteries, which are generally the most commonly used in consumer-grade drones, are only allowed on-board. According to the current regulation (December 2018), there is no limit on the spare batteries per passenger, as long as they are below 100 Wh [38]. If the batteries are between 100 and 160 Wh, a single passenger can take two spare batteries. Batteries of capacities greater than 160 Wh (as used in large UAVs) are not permitted on normal air traffic, hence, they must be shipped separately, using a special courier service [38]. However, some airlines have their own regulations, e.g., limiting all spare LIPO batteries <160 Wh (including <100 Wh) to two per passenger.

2.3. Stage 3—Preliminary on-Site Activities (Including Optional Ground-Control-Point Collection)

Regardless of previously obtained flight permits, it is necessary to contact the local aviation authority and landowners again just before going into the field and starting the mission. This can include calling the nearest airport tower or simply asking the station manager, if the field activity is planned in a more remote area. In many cases, such an approach can help avoid dangerous incidents, as local authorities should be more knowledgeable about low-altitude traffic activities (e.g., tourist flights and helicopter tours).
Depending on the platform and nature of the research being conducted, it might be necessary to collect ground control points (GCP). If only one-time mapping is required, the accuracy of the on-board global navigation satellite system GNSS (usually 5–10 m) will be sufficient. In the case of change-detection studies, GCP are strongly recommended, unless the error of the on-board GNSS is insignificant in comparison to the surface change being assessed. For example, change-detection between two surveys which employs only the on-board GNSS will result in level of detection equal to several meters, which might be sufficient, if expected changes are within a range of 100 m or more. However, if the expected changes are going to be smaller than several meters, precisely measured GCPs are required, allowing to achieve <0.1 m level of detection. GCP should be distributed evenly over the survey area, preferably including additional points in low- and high-topographic points. Previous research has indicated that 100 m is a radius where the GCP influence is sufficient [39]; however, this is also site-specific and related to the terrain’s characteristics.
Two main scenarios of ground control points can be considered:
  • Surveying natural, characteristic points like boulders—the advantage of such an approach is that it is not necessary to distribute the artificial targets before flights (i.e., surveys can be done after flying as well). The drawback is that the natural feature will usually have less obvious center points, which will introduce greater errors in the processing stage.
  • Artificial targets (like laminated printed targets) ought to be distributed over the study area, before flying (survey can be done before or after), and collected after completing the flying mission. The advantage is that they are often more easily recognizable on the captured images.
The number of surveyed points should also include additional points (check-points) which will be used to assess the quality of the resultant data. Usually about two-third of the surveyed points are used as ground control points (GCP; i.e., they are used for georeferencing the point cloud), whereas, the remaining one-third serve as independent check-points (i.e., they are not used for georeferencing but for assessing the overall error of the DEMs and the orthomosaics).

2.4. Stage 4—Pre-flight Setup and Checks

Pre-flight site reconnaissance is crucial and should include a visual scanning of obstacles, (1) which can potentially block the line of sight or radio signal; or (2) which can damage the UAV such as trees, electric wires (even if they are not common in polar areas). Choosing a take-off place is crucial as it should offer as much visibility as possible. It is better to avoid concrete surfaces and objects (as they can contain metal parts which will interfere with the UAV’s magnetometer). The UAV operator should also choose a proper landing spot, as well as alternative spots, in case of emergency (e.g., in cases of unanticipated low-flying helicopters).
Depending on the setup, the mission planning can include: (1) Selecting flight areas and the associated take-off/landing spots; (2) designing flying paths, manually flown or pre-programmed, which will ensure the appropriate image overlap (preferably 80% or more). These also include the preliminary selection of the flying altitude, so as to achieve the required ground sampling distance. In case of large differences in the relative elevation over the study area, planning of variable flying altitudes might be necessary. In many countries, high-vis vests are obligatory for UAV operators, and sometimes clear indicators of the landing area are also required.
Preparation of equipment for starting the mission includes:
  • Removing all transport protection elements.
  • Preparation of the UAV (e.g., mounting of propellers).
  • Connection of the remote controller and the ground station.
  • Checking the condition of the UAV (for any damage during transport).
  • Turning on the remote controller before turning on the UAV.
  • Checking the sensors’ reading if available (accelerometer, magnetometer, gyroscope, etc.). If they do not behave in a normal way, calibration is necessary, especially when flying over a new area.
  • Checking the fail-safe settings, such as return-to-home (RTH) altitude (i.e., it should be set up higher than the highest obstacles) and the home-point location.
  • Checking the camera settings, including the shutter speed and interval (in case of automatic shutting). Depending on lighting condition and type of platform (multi-rotors with the ability to hover versus planes), an ISO (i.e. determination of exposure index, ISO speed ratings, standard output sensitivity, and recommended exposure index: International Organization for Standardization - ISO 12232:2006) adjustment might be necessary to avoid blurred photos.

2.5. Stage 5—Conducting the Mission

Depending on the environmental settings, type of mission (VLOS vs. Beyond the Visual Line of Sight (BVLOS)) and the national regulations, the flying team should consist of two or three people, including the pilot (responsible for flying and taking pictures), the observer (to keep visual contact with the drone at all times), and the wildlife monitor (if necessary, for example in Arctic locations). It is the UAV operator’s responsibility to ensure that the take-off conditions are safe, and that there are no unwarned people in the area of operation.
Good practice includes take-off and simple post-take-off tests, such as hovering at about 5 m above the ground to check the stability of the UAV, and then pulling the UAV forward/backward/left/right and rotating it sharply, to ensure that the aircraft responds in a normal way in all three dimensions (i.e., about the vertical axis (yaw), the transverse axis (pitch), and the longitudinal axis (roll)) and to the acceleration and deceleration. Additional checks can include taking test images from the planned survey altitude to verify if the subject is in focus and the level of details is appropriate—in many cases, such images can be viewed and verified on the screen of the controller or the phone.
Mission flying can be autonomous or manual, depending on the condition and character of the specified terrain to be mapped. Depending on the aim of the research, different types of images are required:
  • If the surveyed area is relatively flat and characterized by low relief, vertical (nadir) imagery will be sufficient in most cases (especially if an orthomosaic is the only required product).
  • If the relief is more complicated, additional oblique images are recommended; or, in case of the vertical rock or ice-cliffs, horizontal images are recommended to ensure proper representation of the steep terrain sections.
  • Images should be taken with a large overlap (>80%). It can be done (1) manually, (2) in preprogrammed time intervals, or (3) in preprogrammed locations—depending on the operator experience and availability of the mission planning software.
It is a good practice to return when the battery level drops to 30% to ensure enough spare flying time, in case of an emergency or problems with landing. However, this also depends on the distance from the landing site, temperature, wind speed, and direction. If possible, mission plan should consider wind direction, e.g., flying out against the prevailing wind, so the UAV will be wind-assisted on the return. Starting surveys from the furthest point from take-off/landing site and gradually flying toward it, can also limit the chances of running out of power. Additional precautions must be considered when flying:
  • Note that, at a high altitude, due to the low air pressure, flying times will be different and, in most cases, the automatic battery level indicator will not work properly (however, there is a potential to modify some elements of the UAV’s design, to compensate for the high altitude e.g., [40]).
  • Note that, in low temperature conditions, the performance of the batteries is limited.
During a longer, multi-battery mission in cold conditions, it is necessary to ensure that the UAV operator is still capable of reacting promptly. Warm clothes and gloves that allow touch screen operations are crucial for working in polar areas and at high-altitudes.

2.6. Stage 6—Data Processing

The first steps of data processing include the backup of data and preliminary quality checks. All blurred or out-of-focus images must be removed, as they will introduce unnecessary noise into the model. For that reason, overlap should be high enough to sacrifice some of the photos. Checks can be made visually or some automatic approaches might be used [41]. During the field trip, initial processing using the lowest settings is recommended, to ensure that the survey area has appropriate coverage. In case of missing fragments, re-survey is necessary.
Full photogrammetric processing is usually undertaken back at the office, using workstations. A wide range of software packages is now available for the processing of data using the structure-from-motion approach, including desktop packages, such as Agisoft Photoscan, Pix4D, Bundler, CMVS, as well as the online-processing solutions, which do not require any input from the end user, such as DroneDeploy, Maps made Easy, etc. Classic desktop workflow allows for at least some control from the user (however, most of the processing is done in a black-box model) and includes usually up to eight main steps: (1) Masking of the photos (optional)—if any of the photos include sky or other unwanted elements they should be masked; (2) photo alignment; (3) generation of the initial dense point-cloud; (4) georeferencing of the model (if GCP were created); (5) optimizing the photo alignment using the ground control points; (6) assessment of the model uncertainty [29], optional but recommend if change detection is required; (7) generation of a high-resolution, dense point-cloud; and (8) generation of the orthomosaic, the DEM, and the 3D model.

2.7. Stage 7—Mapping and Change Detection

After producing the orthomosaics and the digital elevation model, the next stage is to use this product for the mapping of the glacial geomorphology and detection of changes. Nowadays, mapping is usually done on screen, with a component of field verification (cf. [42]). If change detection is required, testing of the DEMs’ co-registration is crucial [43], as well as assessing the level of uncertainty in the volumetric budget [31,44].

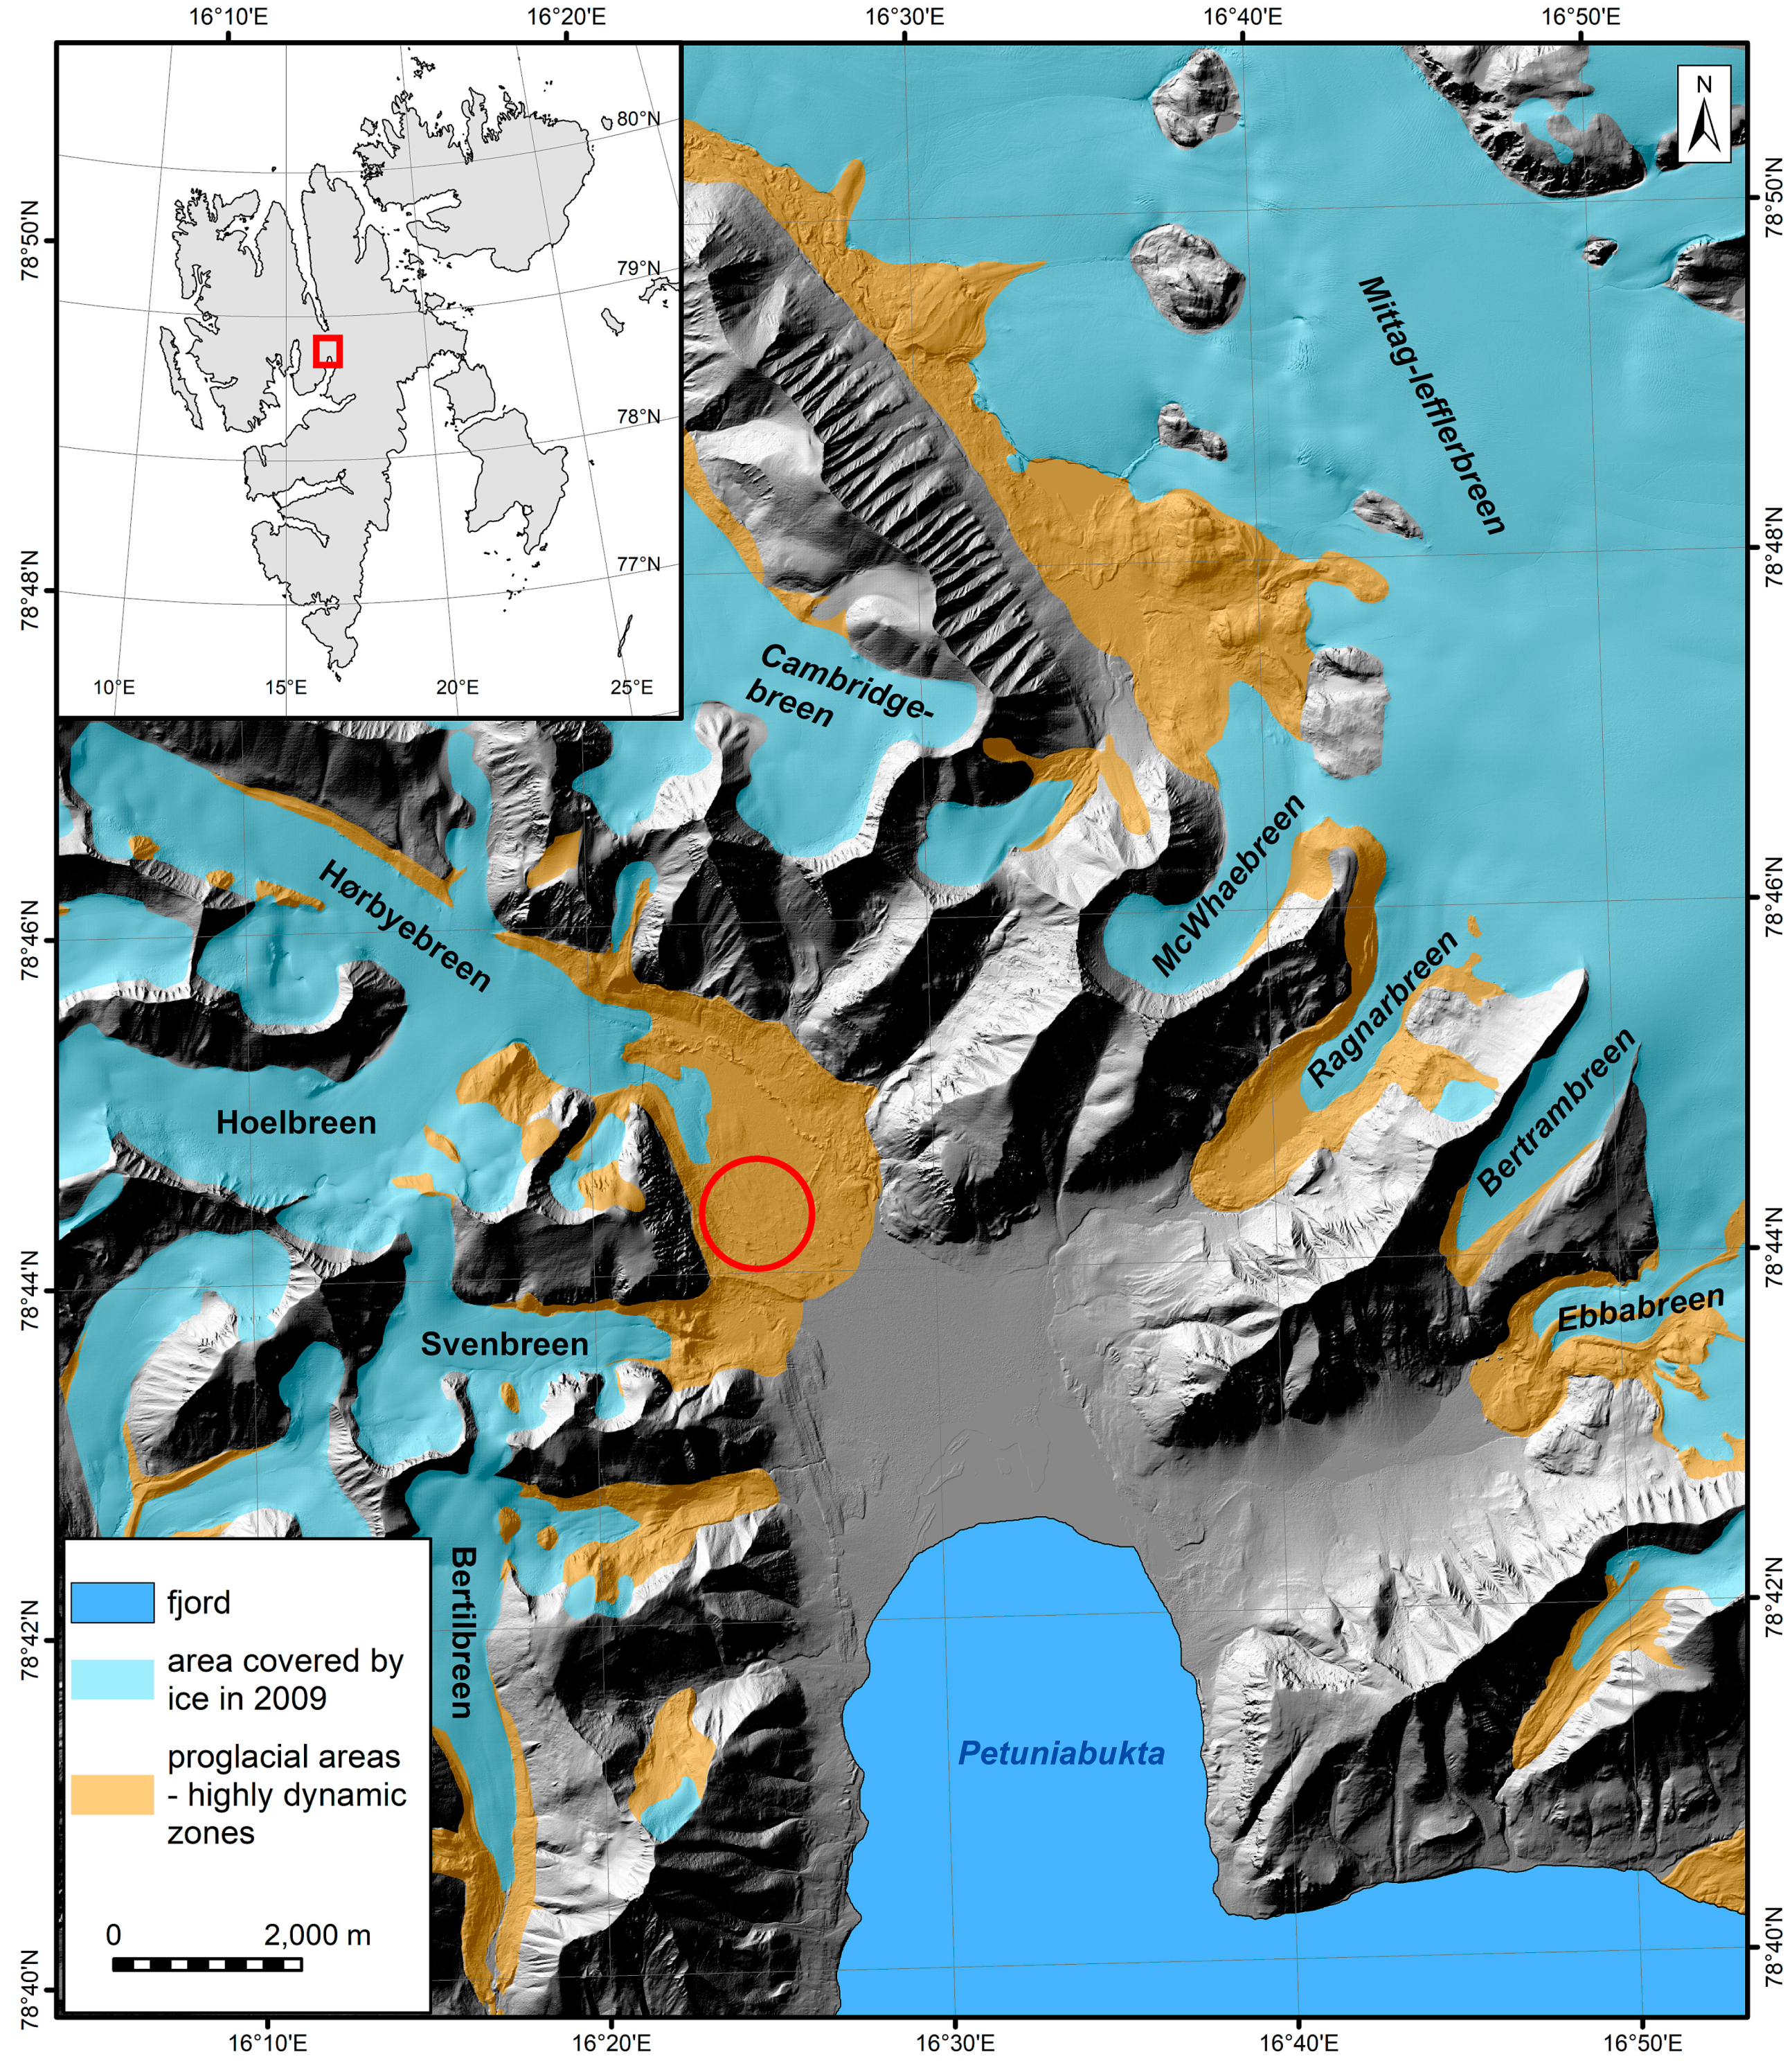
3. Implementation of the Proposed Framework—Study Area, Platform, and Methods

In this section, the proposed operational framework has been illustrated, with an example that may provide a basis of knowledge for future research. The case study example was Hørbyebreen, one of the glaciers located in the central part of the Spitsbergen Island, the Svalbard archipelago, Norway, in a high-Arctic setting (Figure 3). The surveys took place in July 2016.

3.1. Choosing the Appropriate Platform, Preparation, and Transport

The general aim of our research was to map the minor features that developed in front of Hørbyebreen. Although they were clearly visible in the field, it was difficult to recognize them from the high-resolution satellite imagery and aerial photographs. Therefore, our baseline conditions were the following:
  • Our study area was relatively small (~1 km2), although not easily accessible; reaching the survey area required traveling by plane and boat, and then more than three hours of hiking over the rugged terrain.
  • The use of motorized vehicles was prohibited so all equipment had to be carried on foot.
  • Svalbard is usually cloudy, so lighting was unfavorable for taking photography.
  • Surveys were planned for the summer months, with temperatures between 0 and 5 °C, and often in windy conditions.
  • The UAV regulation on the Svalbard generally follows the Norwegian regulations; i.e., to perform VLOS flights it was necessary to register as an RO1 operator.
Therefore, we needed to use a platform which would fulfil the following requirements: (1) A compact size and weight, preferably with the possibility of being put into a backpack, especially as additional necessary equipment included differential Global Positioning System (dGPS) receiver, radios and rifles, all of which had to be transported by a team of 2–3 people; (2) the ability to take pictures in low-light conditions, so that a quadcopter, with its ability to hover over a place, was more suitable than a fixed-wing plane; (3) a long flying time or the possibility to take additional batteries; (4) the ability to operate in cold conditions, normally close to 0 °C; and (5) an inexpensive system, as there were possibilities that the equipment might break during the transport or the operation.
After consideration of several options, we decided to use a small quadcopter from the DJI Phantom series. Larger multi-rotors, while offering potentially better image quality (due to their ability to carry a mirrorless or even DSLR camera), were too expensive and too large to transport in a backpack. Fixed-wing constructions (like the SmartPlane, DataHawk, and Q-200) were too expensive and did not offer the ability to hover over a spot for the capture of sharp stills in low-light conditions. In addition, since we decided to operate a VLOS-only mission, the main advantage of the fixed-wing platforms (i.e., longer range and flying time) was not appropriate. The Phantom series offered a good compromise between the quality of image and the portability, ready-to-fly operations, and the price. A small footprint and, hence, the ability to take-off and land in a small area, was also ideal for working in a rugged proglacial environment. Nowadays, the Mavic series offers similar advantages with even more compact size; however, it was not yet available during our preparation stage (winter 2015/spring 2016).
In terms of general safety, we decided to limit our operations to the VLOS operations, and therefore, registered in Norway as RO1 operators, well in advance of the planned fieldwork. Additional permission was sought from the governor of Svalbard. As the weather on Svalbard can be unpredictable and generally unfavorable for UAV operations, we included three spare days as a contingency to the planned duration of the fieldwork.
We used a DJI Phantom 3 Advanced, equipped with fixed-lens 12MP camera. The focal length was 3.61 mm (20 mm for 35 mm focal equivalent). The Lightbridge connection enabled live video transmission, which allowed for the identification of the flying path and capturing images. The Phantom is relatively compact, so it was possible to transport it inside hand luggage, during air travel. Batteries had capacities lower than 100 Wh, so they were also transported in hand luggage.

3.2. Preliminary on-Site Activities

Before starting the UAV operations, Longyearbyen (capital of Svalbard) Airport Tower was contacted to determine the details of the operations. As the study site is located in a remote, uninhabited area, there was no need to contact the local land owners. Ground control points had been collected using dGPS Topcon Hiper II. Unique ground features (mostly boulders) were surveyed and the surveyed points were scattered uniformly over the study area.

3.3. Pre-flight Setup, Checks, and the Flying Mission

The planned area of survey was divided into nine sections, with the take-off positions ensuring the appropriate visibility for the VLOS operations. The terrain was relatively flat with local relief at a maximum of 20 m. The only potential obstacles included steep rock slopes, but these were outside the planned survey area. Missions were planned to ensure a very dense overlap of >80%, in case of blurred images, as lighting conditions were poor. Before take-off, sensor readings were checked and necessary compass calibrations were performed. A return-to-home altitude was set at 60 m above the starting point, as there were no obstacles over the study area.
Three people conducted the mission, with one serving as the wildlife (bear) monitor. The UAV was flown in manual mode, as in such northern locations the magnetometer readings are sometimes inaccurate and the UAV switches from GPS to ATTI mode, so that autonomous flights do not work properly. Most of the images captured were vertical, with a small number of additional oblique images to ensure a proper representation of the steeper sections of the terrain. The average flying altitude was 53 m above the take-off point. Out of the six field days, only three days were suitable for flying, and during most of that time, the flying conditions were far from ideal, with cloudy skies, winds, and sporadic rain.
In total, more than 2650 images were captured with an ISO ranging from 100 to 200 and a shutter speed from as low as 1/25 to 1/500. After deleting the blurred images, 2614 were selected for further processing.

3.4. Data Processing and Analysis

UAV-generated images were processed in the Agisoft Photoscan Professional Edition 1.4.0., following the standard workflow:
  • Photo alignment—accuracy of alignment was set to high, with both generic and reference preselections of images checked. Key point and tie-point limits were set at 40,000 and 4,000, respectively.
  • Optimization of the camera parameters was performed to fit the generated tie-points to the ground control points measured with the dGPS. UTM 33N was used as a coordinating system. Thirty points were used as the ground control points, for georeferencing of the model and optimization of a dense-point cloud. The remaining 15 points were used as checkpoints to assess the general accuracy of the final model.
  • Extraction of the dense-point cloud was performed at a medium resolution and an aggressive depth-filtering mode.
  • DEM (7.9 cm GSD) was generated on the basis of the dense-point cloud.
  • Orthomosaic (1.9 cm GSD) was generated on the basis of the DEM surface and in a mosaic-blending mode, with the optional hole-filling mode being checked.
DEM (1.2 GB) and Orthomosaic (26 GB) were exported as GeoTIFF files (BigTIFFs). Data were used in the ArcMap 10.5, to map the distribution of small-scale landforms (mostly different types of ridges), which will be used for further studies. Mapping was done manually in an on-screen mode. Lines were vectorized along the centerline of the ridge. The mapping process was guided by an inspection of the hillshade models generated using different sun azimuths, to ensure the inclusion of ridges with different orientations.

4. Results and Analysis

4.1. Initial Photo Alignment and Establishing Internal Orientation

The processing of the 2614 images generated 1,162,733 tie-points which were subsequently filtered and the points characterized by the highest uncertainty in the reconstruction were removed, to produce a final number of 899,176 tie points (7,371,360 Projections). The final value of the RMSE (root mean square error), calculated in pixel units, was 0.469 pix.
The UAV-generated images came with coordinates from the onboard GNSS system (GPS+GLONASS), which was generally adequate, in terms of accuracy, for mapping purposes. However, for a more precise registration, the ground control points surveyed with the dGPS were also used. The ground control points were identified, manually, on all visible images; however, this process was guided by the software. The mean RMSE of the ground control points in pixel units was 0.65 pix. After optimization of the camera parameters, the mean RMSE of the ground control points was 4.62 cm (x = 3.15 cm; y = 3.0 cm; z = 1.54 cm), while the check-points showed larger errors with a mean RMSE of 8 cm. Relatively high values resulted from the surveys of the natural GCP (boulders); therefore, in some cases the operator might have imprecisely registered points on the images, especially when they were located close to the edge of the images. The obtained accuracies were sufficient for mapping; however, in the case of change detection, additional steps should be taken in order to co-register the DEMs from subsequent periods.

4.2. DEM and the Orthomosaic Generation

The extraction of a dense-point cloud was performed at a medium resolution and an aggressive filtering mode. A total of 157,820,110 points were extracted, which translated into 161 points/m2 and a DEM with 7.9 cm GSD was generated. Due to the considerable heterogeneity of the studied area, there was generally no problem with the point extraction and creation of the DEM, even if the lighting conditions and contrasts were generally poor. There were, however, problems with the generation of the points over the water surfaces. In the study area, there were numerous ponds and rivers which transported large quantities of suspended sediment. Therefore, light was not able to penetrate through the water. In addition, as the water surface was in constant motion, due to the wind-driven currents, a proper photogrammetric reconstruction of the water surfaces was not possible, and the algorithm generated a relatively large number of incorrect matches. This resulted in artefacts in the final dense-point cloud. Dense clouds had to be manually filtered, in order to obtain a satisfactory DEM. Alternatively, areas of the water could be masked in the source pictures. Figure 4 presents examples of full-resolution DEMs, for the sample areas.
For the mapping of glacial geomorphology, an orthoimage combined with DEM visualization was crucial (Figure 4 and Figure 5)—as only the combination of these products allows for proper interpretation and characterization of landforms. Thanks to a sizable overlap of the gathered images, the generated orthomosaic was close to the concept of “true ortho”, i.e., ortho coverage was generated from most of the nadir parts of the images. Qualitative assessment of the final orthomosaic indicated that the data were uniform, and no color issues occurred, even if the data had been collected over three separate days. Examples of mosaics are shown in Figure 5. Only a few artefacts related to water bodies occurred, which resulted from the problems described earlier (i.e., a lack of transparency and constant movement of the water surface).

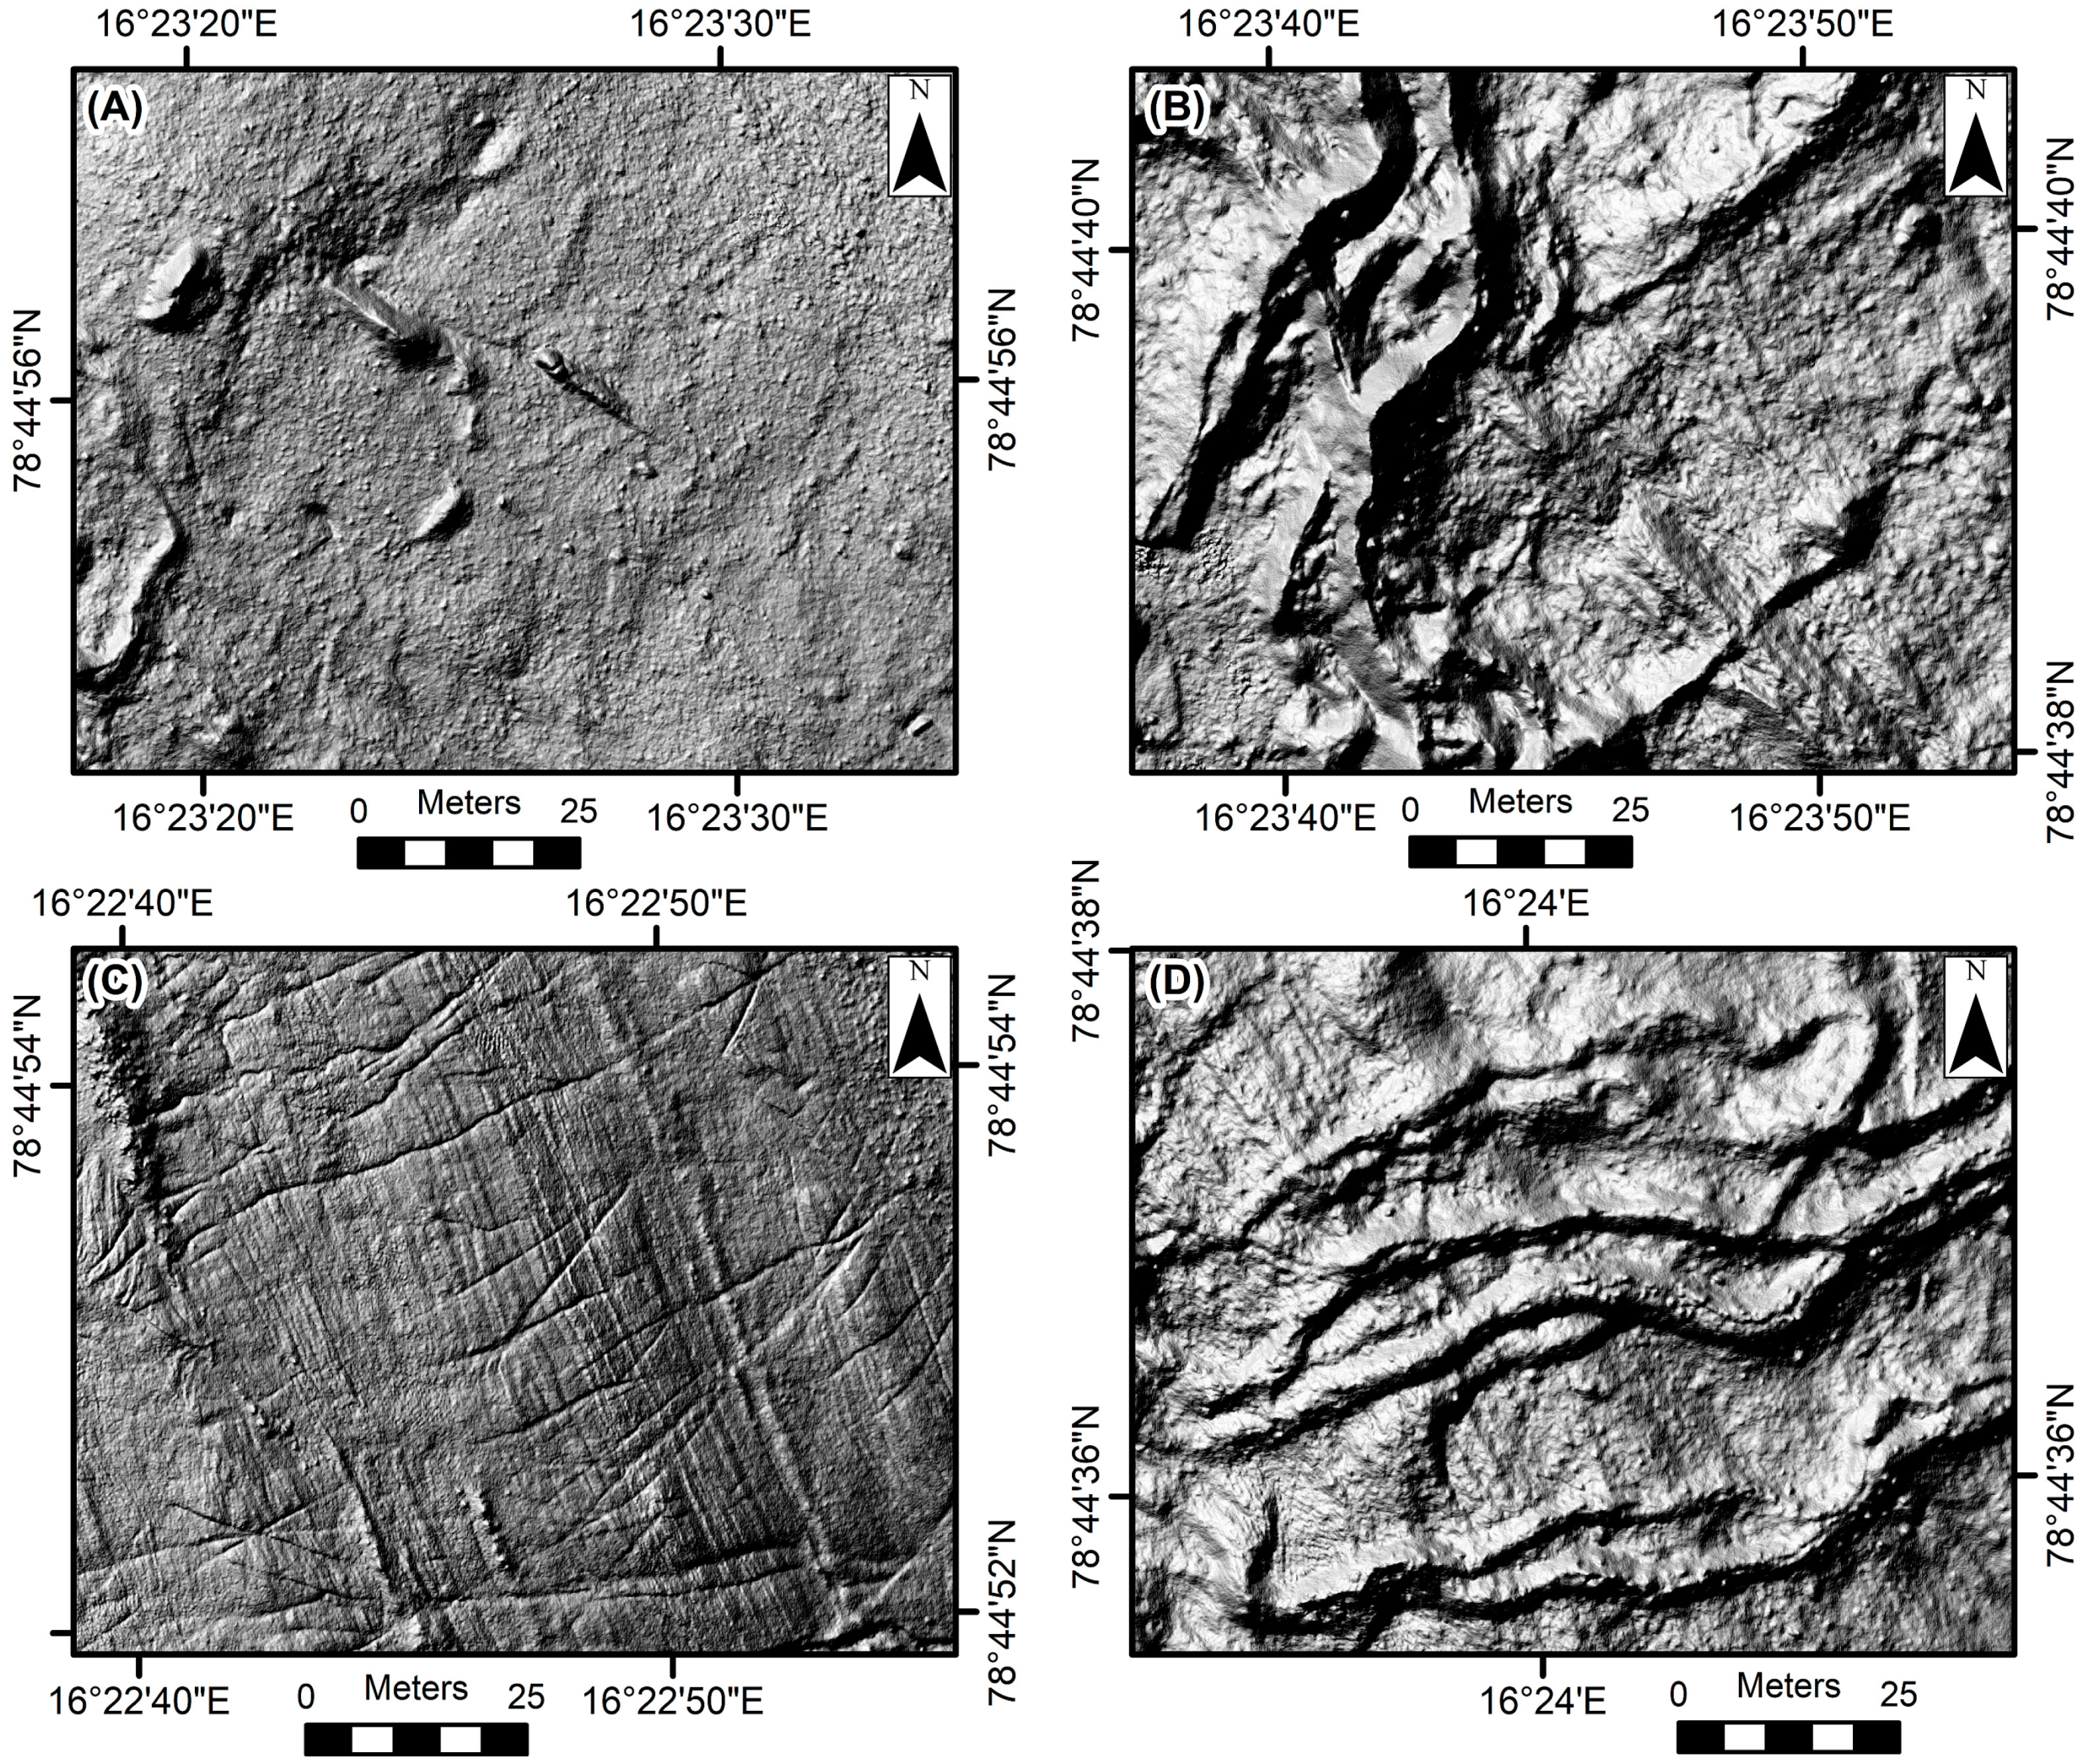
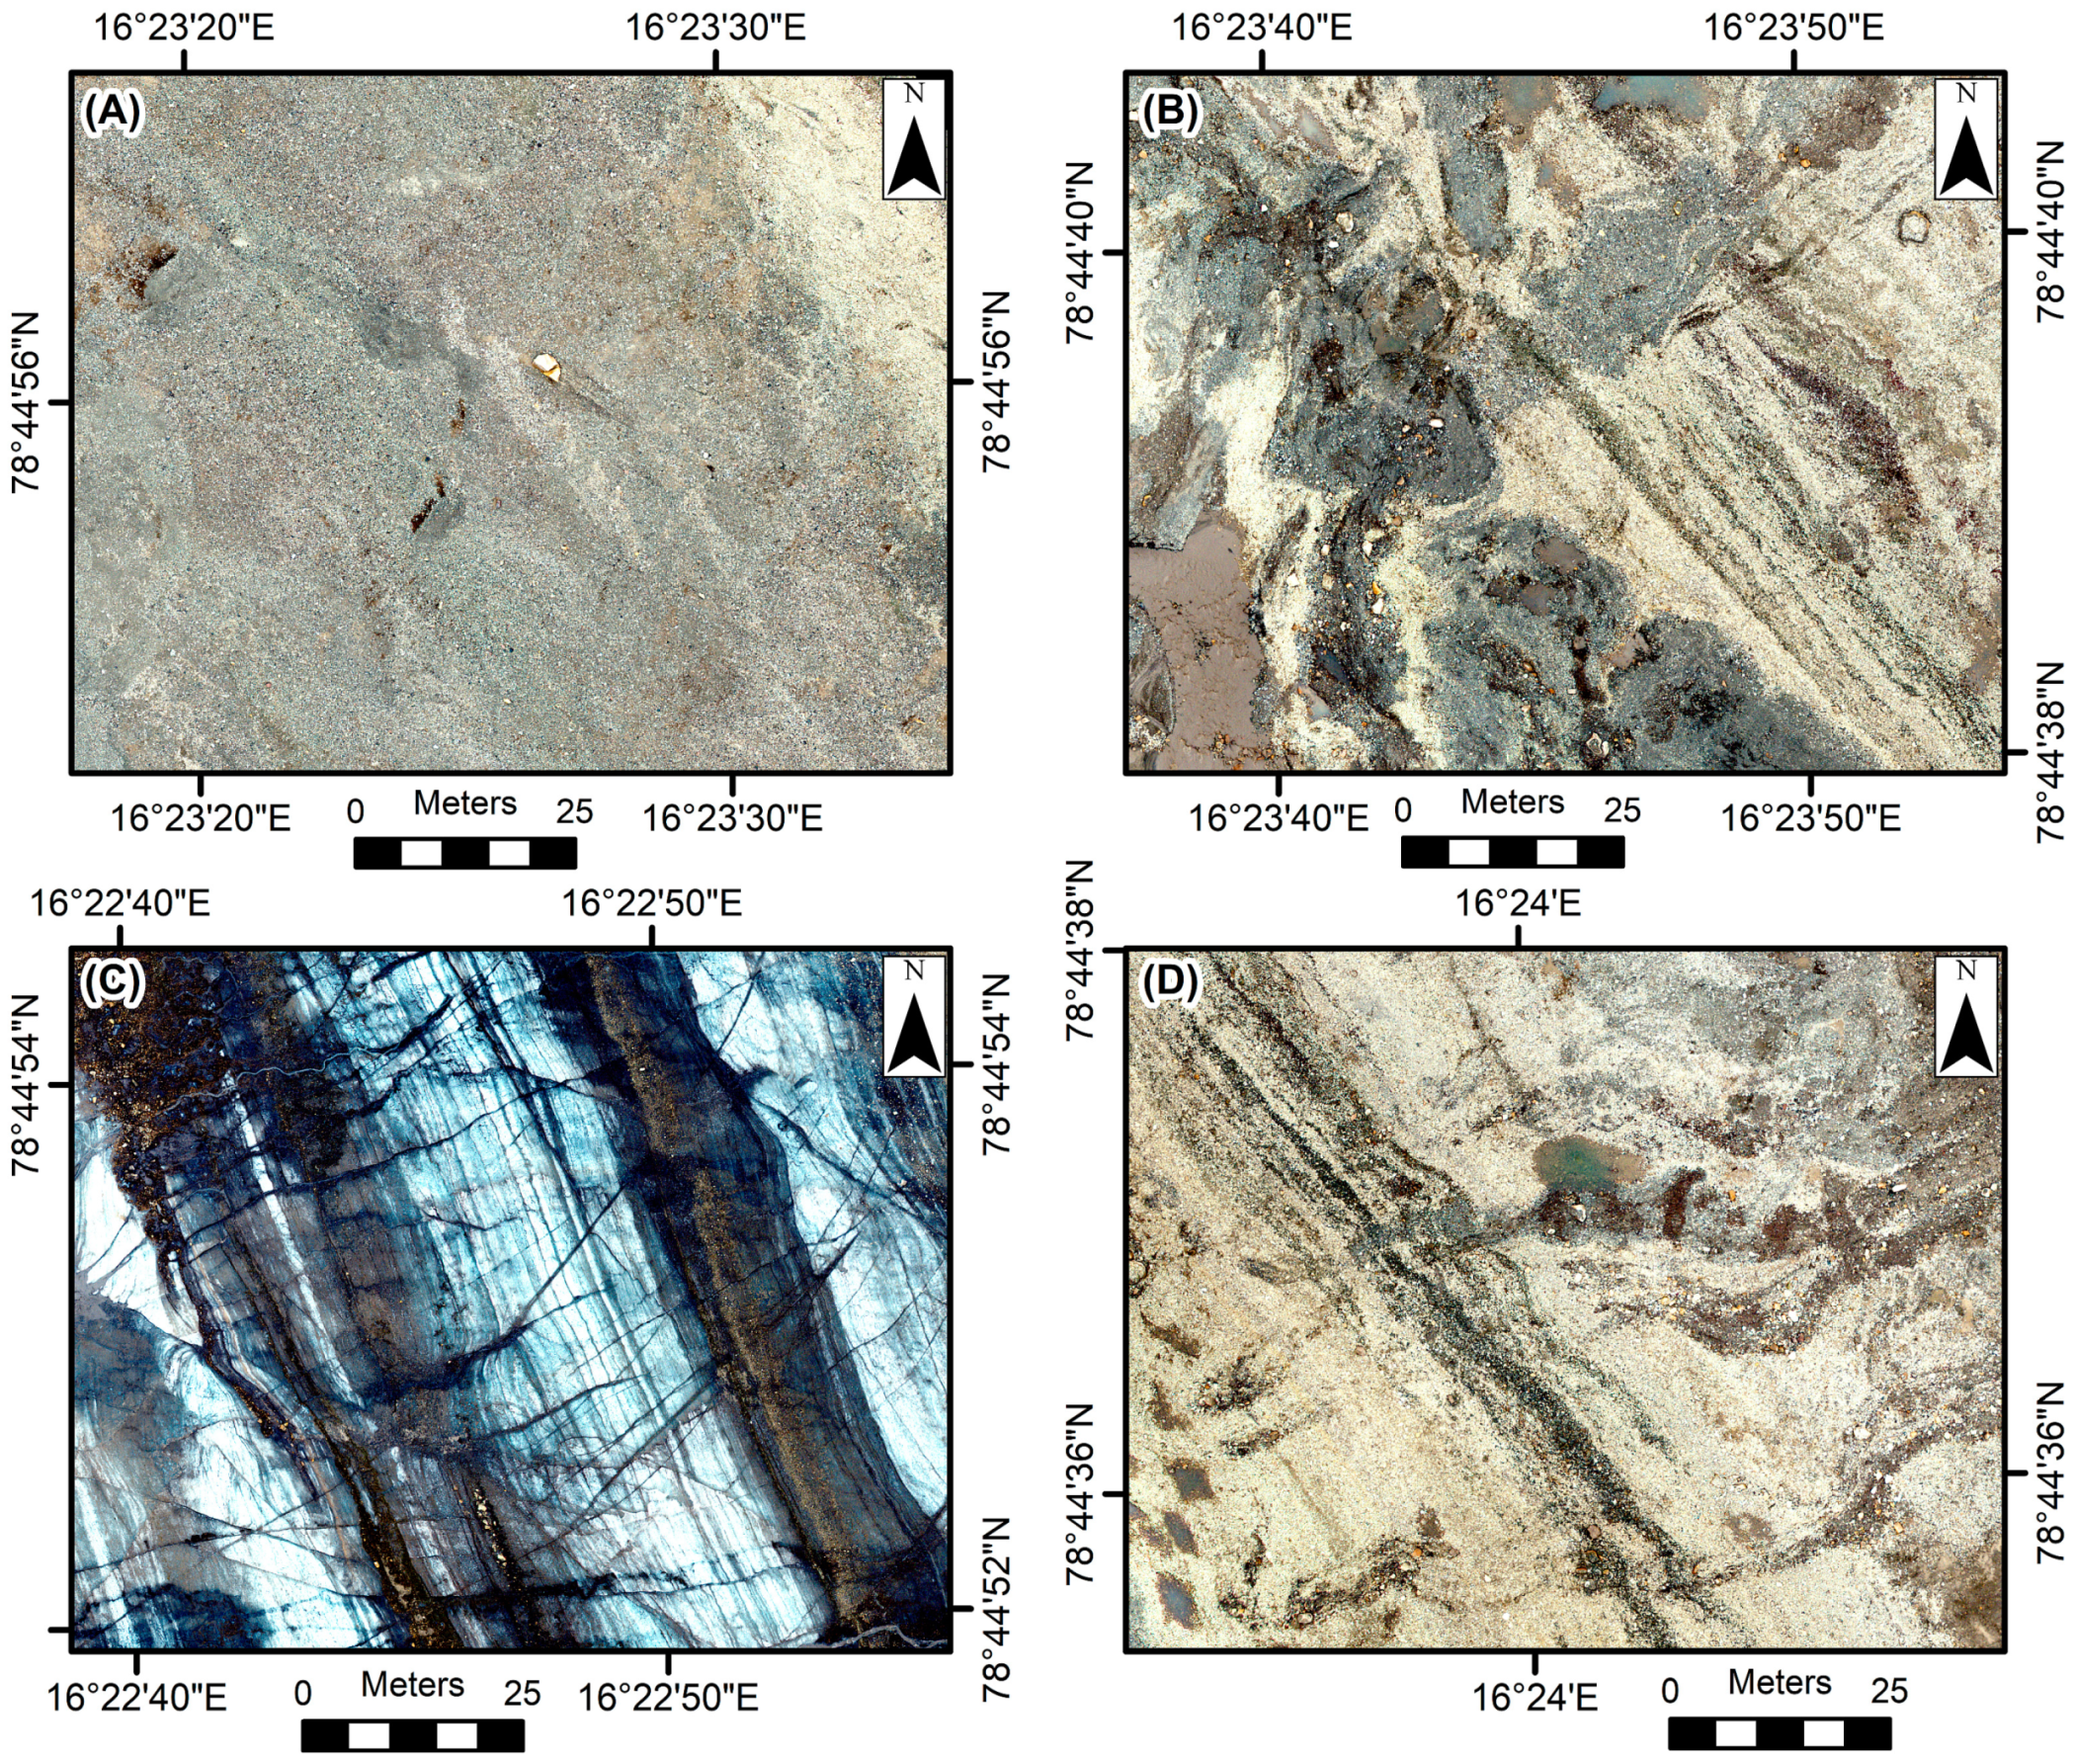
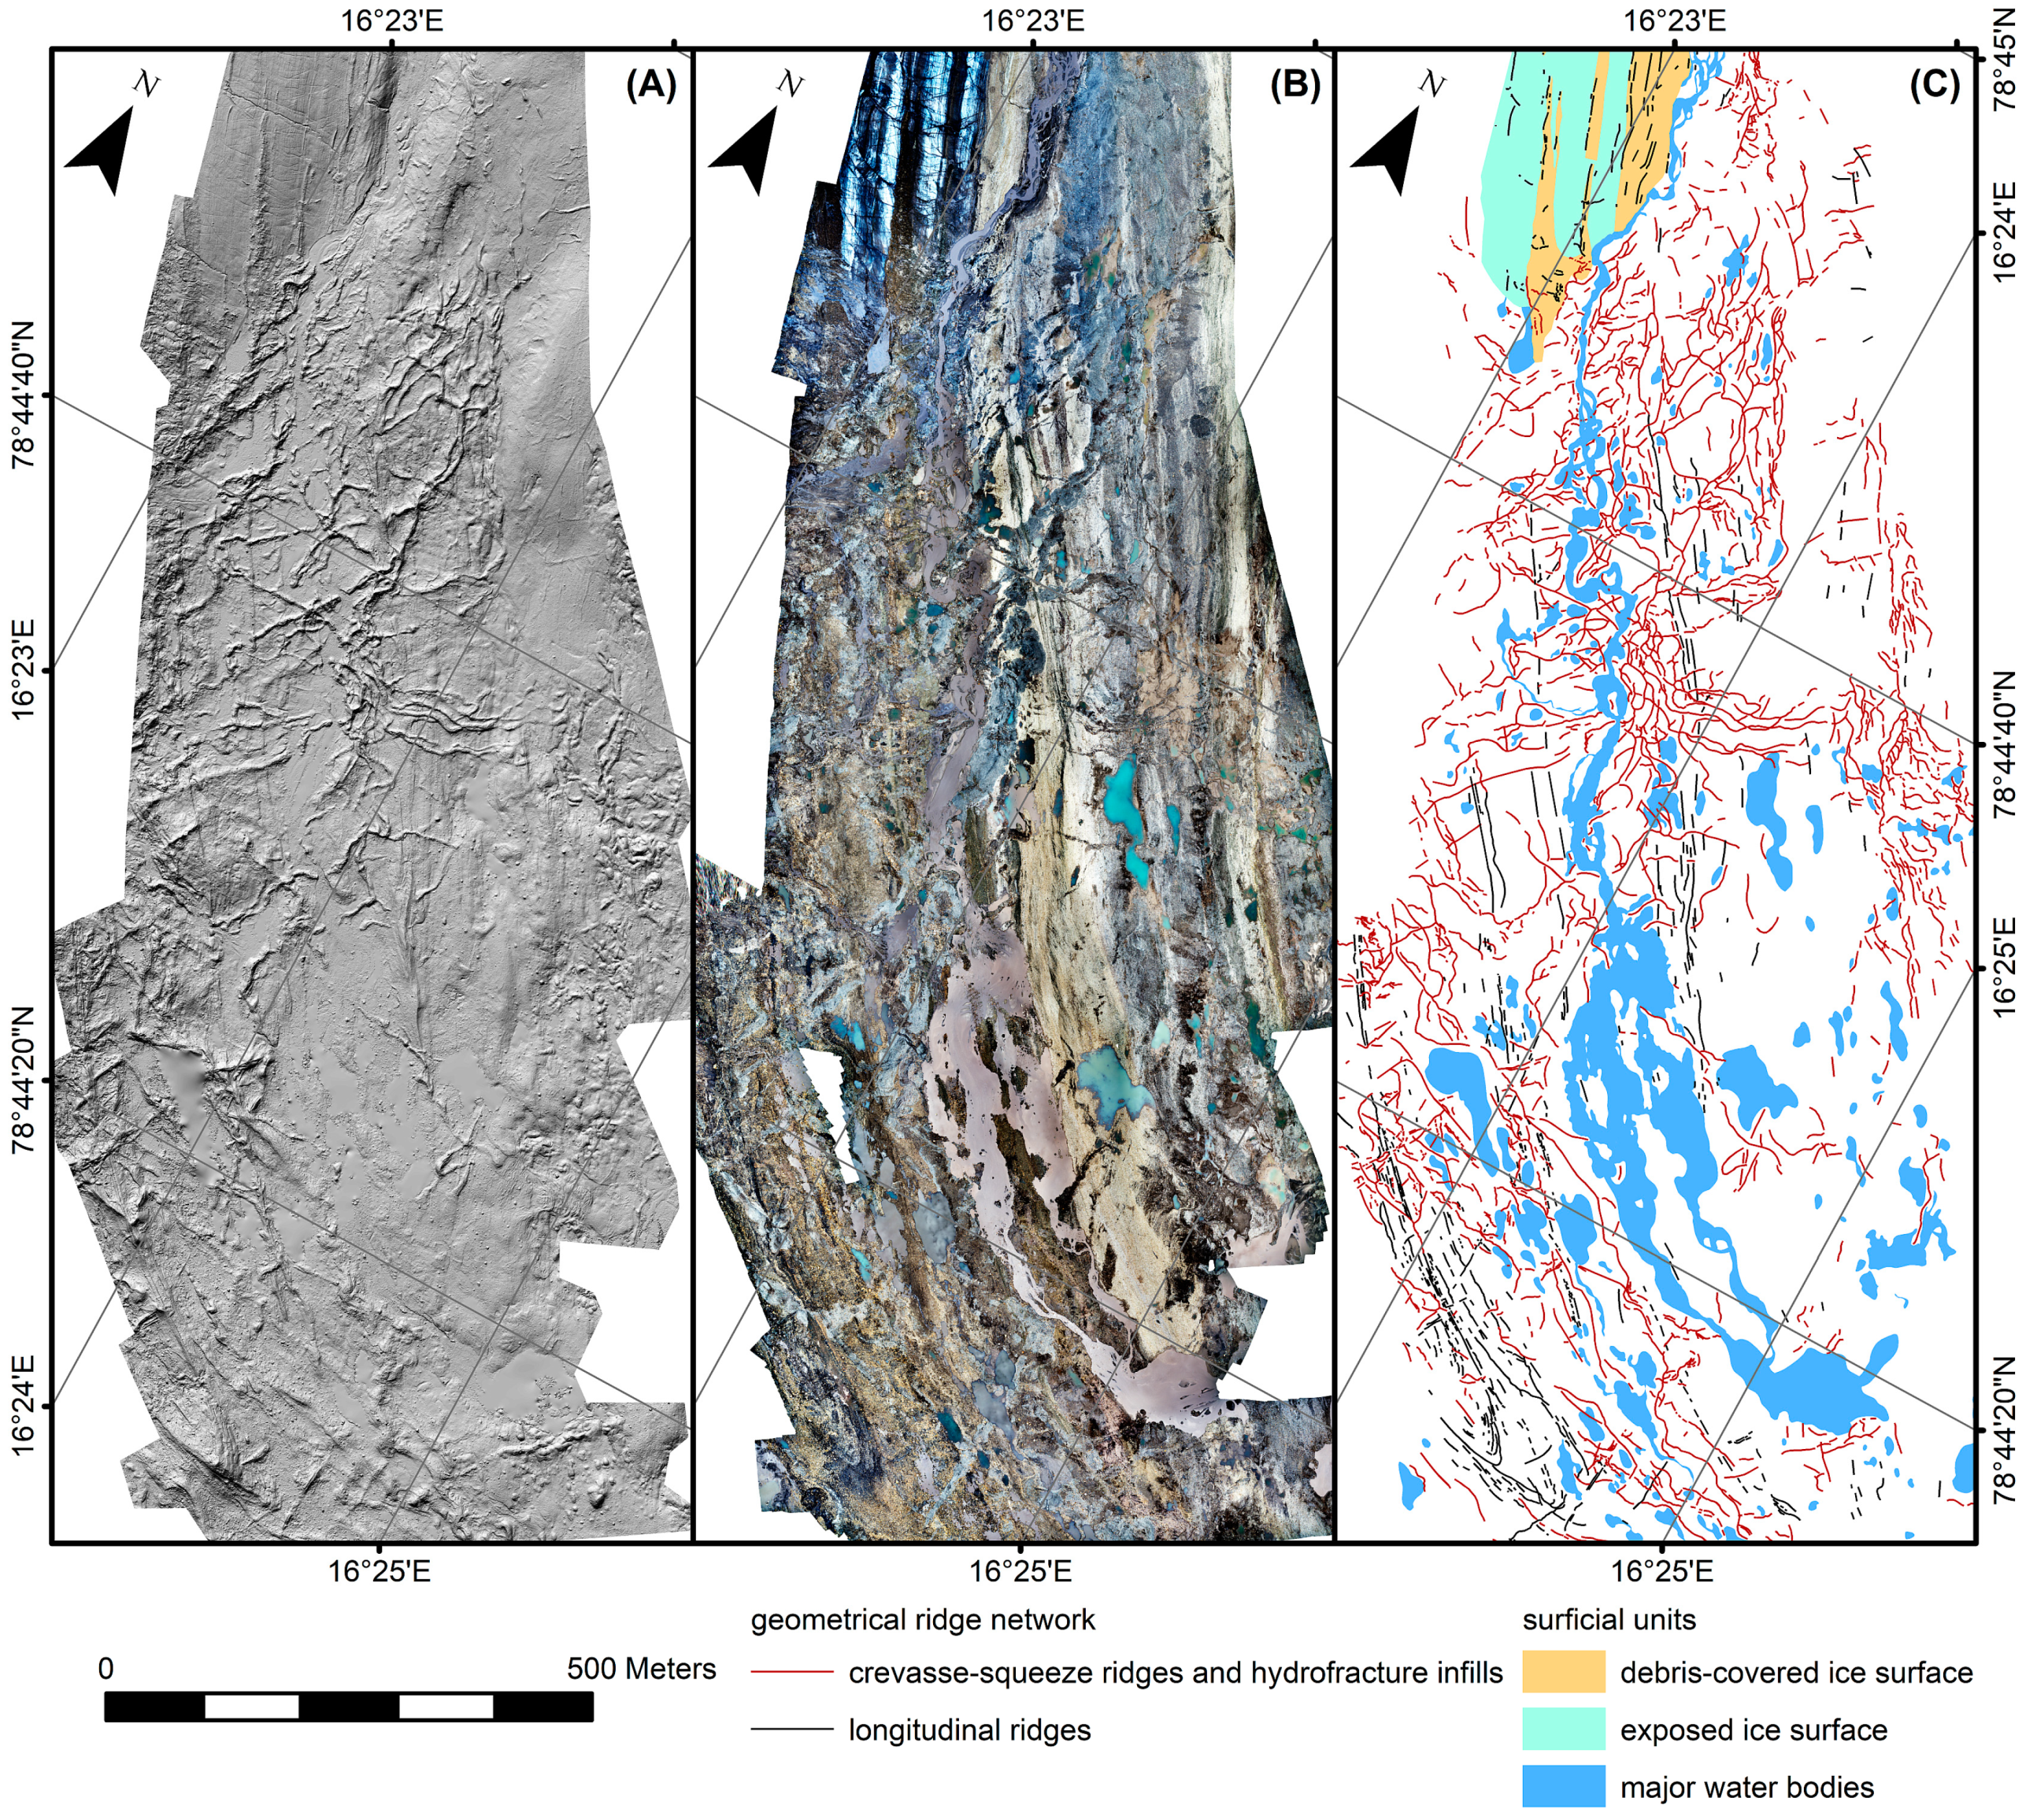
4.3. The Mapping of Subtle Glacial Landforms

In total, 565 segments of ridges were mapped (Figure 6). They were manually classified into two main groups, based on orientation, characteristics of surface material, and size. Analysis of the digital elevation model identified a vertical diversity of ridges. Analysis of texture of the superficial material allowed for the delimitation of three different zones, thereby, helping to interpret some of the ridges as being associated with medial moraines. A high-resolution orthomosaic and point cloud can allow a precise identification of the debris type and in the case of larger clasts, even an overall impression of the clast shape, thereby, complementing the more detailed but point-based field measurements of the clast shape and morphology.

5. Discussion

5.1. Design and Implementation of the Proposed Framework

The proposed framework on the application of UAV and SfM for rapid mapping and monitoring of glacial geomorphology comprised seven stages (Section 2). These stages included preparation (including complying with the national and local UAV regulations), transport, preliminary fieldwork, pre-flight setup and checks, conducting the mission, data processing, and finally, the mapping and change detection. This universal framework was subsequently illustrated through its application in the Svalbard glacier case study of data acquisition and processing (Section 3).
The development of an operational framework for use in glacial geomorphology comprises an appropriate set of tools, which enable mapping and monitoring of rapidly changing proglacial areas. Its coverage of multiple aspects ensures that the proposed framework is universal and can be applied in a broader range of settings.
Recent advances in the UAV technology and SfM processing will probably increase the amount of data in the near future; however, to ensure proper collection, it is necessary to: (1) Fulfil national and local aviation regulations, as well as apply common sense, so as to minimize the risks associated with the use of UAVs (cf. [34]); and (2) follow the procedures for the optimization and co-registration of DEMs, to ensure the repeatability of surveys [9,29,30,31].

5.2. Application of the UAV and the SfM in Glacial Geomorphology Mapping

Over the last six years, we have been using UAVs for mapping subtle glacial landforms in different areas, using different generations of equipment and software. It can be concluded that the use of UAVs has been a major breakthrough, enabling rapid mapping, and detection of changes, in unprecedented ways. Low-cost, off-the-shelf, ready-to-fly platforms, combined with their ease-of-use and, in general, a satisfactory image quality, mean that it is possible to obtain very-high resolution (spatial and temporal) DEMs and orthomosaics (cf. [25,45]). This further expands previous mapping methods and opens up future research questions, both from an observation standpoint, as well as that of the numerical modeler.
The average accuracy and resolution of products generated from the low-cost UAVs are still worse than the terrestrial laser scanning datasets; however, they are definitely much better than the traditional aerial photogrammetry and high-resolution satellite imagery [9,33,46,47]. Moreover, both parameters are related to (and can be controlled by)—the scale of analysis, flight height, type of the sensor, number and distribution of images and GCPs, and the type of terrain, among others [48]. The crucial issue, here, is appropriate planning and execution of surveys.
There are also operational challenges to the use of a UAV and structure-from-motion photogrammetry in glacial geomorphological mapping. Environmental conditions are primary limitations, as most of the current ice margins are located in cold, often windy, environments (cf. [24,34]). These necessitate the inclusion of spare days in planning the fieldwork, requiring longer periods of time and, thereby, increasing costs. Surveying ground control points, in some areas, is impossible (e.g., in crevassed ice surfaces and proglacial lakes); however, this issue might be resolved by the use of direct georeferencing [30,49]. So far, consumer-grade drones are not equipped with dGPS, but this might change in the near future, as prices of dGPS are falling. More accurate internal altitude sensors might also become available in the foreseeable future. However, large areas of proglacial lakes or clean ice surfaces still pose problems for the automatic tie-point detection.
Probably the most substantial issue, at the present time, is uncertainty in terms of current regulations (cf. [50]), with the rather serious possibility that some countries may ban the use of drones or strictly limit their use. Local restrictions have also to be taken into consideration.

6. Conclusions

The proposed operational framework for the application of small budget UAVs for the mapping of glacial geomorphology incorporates various organizational and technical aspects related to mission preparation, mission execution, and data processing. Our framework consists of seven stages: (1) Preparation and selection of the appropriate platform; (2) transport; (3) preliminary on-site activities (including optional ground-control-points collection); (4) pre-flight setup and checks; (5) conducting the mission; (6) data processing; and (7) mapping and change detection.
We have demonstrated that it is possible to map in detail fine-resolution, glacial-related landforms, using products (i.e., DEM and orthomosaic) generated through the implementation of our proposed framework. This can be achieved even with the use of low-cost UAVs equipped with a consumer-grade camera, but with image coverage sufficient for a Structure-from-Motion approach. The proposed approach opens up new perspectives on detailed mapping and monitoring of modern glacial land-systems and the development of models of process-form regimes, in glacial geomorphology.

Author Contributions

Conceptualization, M.W.E. and A.M.T.; Methodology, M.W.E., A.M.T. and W.E.; Software, M.W.E. and A.M.T.; Validation, M.W.E., A.M.T., D.J.A.E., D.H.R. and W.E.; Formal Analysis, M.W.E.; Investigation, M.W.E., A.M.T., D.J.A.E., D.H.R. and W.E.; Resources, M.W.E.; Data Curation, M.W.E. and A.M.T.; Writing—Original Draft Preparation, M.W.E.; Writing—Review & Editing, M.W.E., A.M.T., D.J.A.E., D.H.R. and W.E.; Visualization, M.W.E. and A.M.T.; Project Administration, M.W.E.; Funding Acquisition, M.W.E.

Funding

This research was funded by the National Science Centre, Poland, Grant Number 2011/01/D/ST10/06494. The article processing charge (APC) received no external funding.

Acknowledgments

Fieldwork would not be possible without the logistic support provided by AMUPS (Adam Mickiewicz University Polar Station). Two anonymous reviewers and the editor are greatly appreciated for their constructive comments.

Conflicts of Interest

The authors declare no conflict of interest. The funders had no role in the design of the study; in the collection, analyses, or interpretation of data; in the writing of the manuscript, and in the decision to publish the results.

References

  1. Benn, D.I.; Evans, D.J.A. Glaciers and Glaciation; Hodder Education: London, UK, 2010. [Google Scholar]
  2. Ewertowski, M.W.; Tomczyk, A.M. Quantification of the ice-cored moraines’ short-term dynamics in the high-Arctic glaciers Ebbabreen and Ragnarbreen, Petuniabukta, Svalbard. Geomorphology 2015, 234, 211–227. [Google Scholar] [CrossRef]
  3. Carrivick, J.L.; Heckmann, T. Short-term geomorphological evolution of proglacial systems. Geomorphology 2017, 287, 3–28. [Google Scholar] [CrossRef] [Green Version]
  4. Ewertowski, M.W.; Evans, D.J.A.; Roberts, D.H.; Tomczyk, A.M.; Ewertowski, W.; Pleksot, K. Quantification of historical landscape change on the foreland of a receding polythermal glacier, Hørbyebreen, Svalbard. Geomorphology 2019, 325, 40–54. [Google Scholar] [CrossRef]
  5. Westoby, M.J.; Brasington, J.; Glasser, N.F.; Hambrey, M.J.; Reynolds, J.M. ‘Structure-from-Motion’ photogrammetry: A low-cost, effective tool for geoscience applications. Geomorphology 2012, 179, 300–314. [Google Scholar] [CrossRef] [Green Version]
  6. Hugenholtz, C.H.; Whitehead, K.; Brown, O.W.; Barchyn, T.E.; Moorman, B.J.; LeClair, A.; Riddell, K.; Hamilton, T. Geomorphological mapping with a small unmanned aircraft system (sUAS): Feature detection and accuracy assessment of a photogrammetrically-derived digital terrain model. Geomorphology 2013, 194, 16–24. [Google Scholar] [CrossRef] [Green Version]
  7. Tonkin, T.N.; Midgley, N.G.; Graham, D.J.; Labadz, J.C. The potential of small unmanned aircraft systems and structure-from-motion for topographic surveys: A test of emerging integrated approaches at Cwm Idwal, North Wales. Geomorphology 2014, 226, 35–43. [Google Scholar] [CrossRef] [Green Version]
  8. Whitehead, K.; Hugenholtz, C.H.; Myshak, S.; Brown, O.; LeClair, A.; Tamminga, A.; Barchyn, T.E.; Moorman, B.; Eaton, B. Remote sensing of the environment with small unmanned aircraft systems (UASs), part 2: Scientific and commercial applications. J. Unmanned Veh. Syst. 2014, 2, 86–102. [Google Scholar] [CrossRef]
  9. Smith, M.W.; Carrivick, J.L.; Quincey, D.J. Structure from motion photogrammetry in physical geography. Prog. Phys. Geogr. Earth Environ. 2016, 40, 247–275. [Google Scholar] [CrossRef]
  10. Bhardwaj, A.; Sam, L.; Akanksha; Martín-Torres, F.J.; Kumar, R. UAVs as remote sensing platform in glaciology: Present applications and future prospects. Remote Sens. Environ. 2016, 175, 196–204. [Google Scholar] [CrossRef]
  11. Rippin, D.M.; Pomfret, A.; King, N. High resolution mapping of supra-glacial drainage pathways reveals link between micro-channel drainage density, surface roughness and surface reflectance. Earth Surf. Proc. Land 2015, 40, 1279–1290. [Google Scholar] [CrossRef] [Green Version]
  12. Ryan, J.C.; Hubbard, A.L.; Box, J.E.; Todd, J.; Christoffersen, P.; Carr, J.R.; Holt, T.O.; Snooke, N. UAV photogrammetry and structure from motion to assess calving dynamics at Store Glacier, a large outlet draining the Greenland ice sheet. Cryosphere 2015, 9, 1–11. [Google Scholar] [CrossRef] [Green Version]
  13. Fugazza, D.; Scaioni, M.; Corti, M.; D’Agata, C.; Azzoni, R.S.; Cernuschi, M.; Smiraglia, C.; Diolaiuti, G.A. Combination of UAV and terrestrial photogrammetry to assess rapid glacier evolution and map glacier hazards. Nat. Hazards Earth Syst. Sci. 2018, 18, 1055–1071. [Google Scholar] [CrossRef] [Green Version]
  14. Dąbski, M.; Zmarz, A.; Pabjanek, P.; Korczak-Abshire, M.; Karsznia, I.; Chwedorzewska, K.J. UAV-based detection and spatial analyses of periglacial landforms on Demay Point (King George Island, South Shetland Islands, Antarctica). Geomorphology 2017, 290, 29–38. [Google Scholar] [CrossRef]
  15. Kraaijenbrink, P.D.A.; Shea, J.M.; Pellicciotti, F.; Jong, S.M.d.; Immerzeel, W.W. Object-based analysis of unmanned aerial vehicle imagery to map and characterise surface features on a debris-covered glacier. Remote Sens. Environ. 2016, 186, 581–595. [Google Scholar] [CrossRef]
  16. Bernard, É.; Friedt, J.M.; Tolle, F.; Marlin, C.; Griselin, M. Using a small COTS UAV to quantify moraine dynamics induced by climate shift in Arctic environments. Int. J. Remote Sens. 2016, 38, 2480–2494. [Google Scholar] [CrossRef]
  17. Turner, D.; Lucieer, A.; de Jong, S.M. Time Series Analysis of Landslide Dynamics Using an Unmanned Aerial Vehicle (UAV). Remote Sens. 2015, 7, 1736–1757. [Google Scholar] [CrossRef] [Green Version]
  18. Kasprzak, M.; Jancewicz, K.; Michniewicz, A. UAV and SfM in Detailed Geomorphological Mapping of Granite Tors: An Example of Starościńskie Skały (Sudetes, SW Poland). Pure Appl. Geophys. 2018, 175, 3193–3207. [Google Scholar] [CrossRef]
  19. Rossini, M.; Di Mauro, B.; Garzonio, R.; Baccolo, G.; Cavallini, G.; Mattavelli, M.; De Amicis, M.; Colombo, R. Rapid melting dynamics of an alpine glacier with repeated UAV photogrammetry. Geomorphology 2018, 304, 159–172. [Google Scholar] [CrossRef]
  20. Chandler, B.M.P.; Evans, D.J.A.; Roberts, D.H.; Ewertowski, M.W.; Clayton, A.I. Glacial geomorphology of the Skálafellsjökull foreland, Iceland: A case study of ‘annual’moraines. J. Maps 2016, 12, 904–916. [Google Scholar] [CrossRef]
  21. Evans, D.J.A.; Ewertowski, M.; Orton, C. Fláajökull (north lobe), Iceland: Active temperate piedmont lobe glacial landsystem. J. Maps 2016, 12, 777–789. [Google Scholar] [CrossRef]
  22. Ewertowski, M.W.; Evans, D.J.A.; Roberts, D.H.; Tomczyk, A.M. Glacial geomorphology of the terrestrial margins of the tidewater glacier, Nordenskiöldbreen, Svalbard. J. Maps 2016, 12, 476–487. [Google Scholar] [CrossRef] [Green Version]
  23. Tonkin, T.N.; Midgley, N.; Cook, S.J.; Graham, D.J. Ice-cored moraine degradation mapped and quantified using an unmanned aerial vehicle: A case study from a polythermal glacier in Svalbard. Geomorphology 2016, 258, 1–10. [Google Scholar] [CrossRef] [Green Version]
  24. Westoby, M.J.; Dunning, S.A.; Woodward, J.; Hein, A.S.; Marrero, S.M.; Winter, K.; Sugden, D.E. Sedimentological characterization of Antarctic moraines using UAVs and Structure-from-Motion photogrammetry. J. Glaciol. 2017, 61, 1088–1102. [Google Scholar] [CrossRef]
  25. Wigmore, O.; Mark, B. Monitoring tropical debris-covered glacier dynamics from high-resolution unmanned aerial vehicle photogrammetry, Cordillera Blanca, Peru. Cryosphere 2017, 11, 2463–2480. [Google Scholar] [CrossRef] [Green Version]
  26. Allaart, L.; Friis, N.; Ingólfsson, Ó.; Håkansson, L.; Noormets, R.; Farnsworth, W.R.; Mertes, J.; Schomacker, A. Drumlins in the Nordenskiöldbreen forefield, Svalbard. GFF 2018, 140, 170–188. [Google Scholar] [CrossRef]
  27. Midgley, N.G.; Tonkin, T.N.; Graham, D.J.; Cook, S.J. Evolution of high-Arctic glacial landforms during deglaciation. Geomorphology 2018, 311, 63–75. [Google Scholar] [CrossRef] [Green Version]
  28. Ely, J.C.; Graham, C.; Barr, I.D.; Rea, B.R.; Spagnolo, M.; Evans, J. Using UAV acquired photography and structure from motion techniques for studying glacier landforms: Application to the glacial flutes at Isfallsglaciären. Earth Surf. Proc. Landf. 2017, 42, 877–888. [Google Scholar] [CrossRef]
  29. James, M.R.; Robson, S.; Smith, M.W. 3-D uncertainty-based topographic change detection with structure-from-motion photogrammetry: Precision maps for ground control and directly georeferenced surveys. Earth Surf. Proc. Landf. 2017, 42, 1769–1788. [Google Scholar] [CrossRef]
  30. Carbonneau, P.E.; Dietrich, J.T. Cost-effective non-metric photogrammetry from consumer-grade sUAS: Implications for direct georeferencing of structure from motion photogrammetry. Earth Surf. Proc. Landf. 2017, 42, 473–486. [Google Scholar] [CrossRef]
  31. James, M.R.; Robson, S.; d’Oleire-Oltmanns, S.; Niethammer, U. Optimising UAV topographic surveys processed with structure-from-motion: Ground control quality, quantity and bundle adjustment. Geomorphology 2017, 280, 51–66. [Google Scholar] [CrossRef]
  32. O’Connor, J.; Smith, M.J.; James, M.R. Cameras and settings for aerial surveys in the geosciences: Optimising image data. Prog. Phys. Geogr. Earth Environ. 2017, 41, 325–344. [Google Scholar] [CrossRef]
  33. Cook, K.L. An evaluation of the effectiveness of low-cost UAVs and structure from motion for geomorphic change detection. Geomorphology 2017, 278, 195–208. [Google Scholar] [CrossRef]
  34. Cimoli, E.; Marcer, M.; Vandecrux, B.; Boggild, C.E.; Williams, G.; Simonsen, S.B. Application of Low-Cost UASs and Digital Photogrammetry for High-Resolution Snow Depth Mapping in the Arctic. Remote Sens. 2017, 9, 1144. [Google Scholar] [CrossRef]
  35. Eltner, A.; Kaiser, A.; Castillo, C.; Rock, G.; Neugirg, F.; Abellán, A. Image-based surface reconstruction in geomorphometry—Merits, limits and developments. Earth Surf. Dynam. 2016, 4, 359–389. [Google Scholar] [CrossRef]
  36. Rusnák, M.; Sládek, J.; Kidová, A.; Lehotský, M. Template for high-resolution river landscape mapping using UAV technology. Measurement 2018, 115, 139–151. [Google Scholar] [CrossRef]
  37. Stocker, C.; Bennett, R.; Nex, F.; Gerke, M.; Zevenbergen, J. Review of the Current State of UAV Regulations. Remote Sens. 2017, 9, 459. [Google Scholar] [CrossRef]
  38. Available online: http://www.iata.org/whatwedo/cargo/dgr/Pages/lithium-batteries.aspx (accessed on 1 December 2018).
  39. Tonkin, T.; Midgley, N. Ground-Control Networks for Image Based Surface Reconstruction: An Investigation of Optimum Survey Designs Using UAV Derived Imagery and Structure-from-Motion Photogrammetry. Remote Sens. 2016, 8, 786. [Google Scholar] [CrossRef]
  40. Silvagni, M.; Tonoli, A.; Zenerino, E.; Chiaberge, M. Multipurpose UAV for search and rescue operations in mountain avalanche events. Geomat. Nat. Hazards Risk 2017, 8, 18–33. [Google Scholar] [CrossRef]
  41. Sieberth, T.; Wackrow, R.; Chandler, J.H. Automatic detection of blurred images in UAV image sets. ISPRS J. Photogramm. Remote Sens. 2016, 122, 1–16. [Google Scholar] [CrossRef] [Green Version]
  42. Chandler, B.M.P.; Lovell, H.; Boston, C.M.; Lukas, S.; Barr, I.D.; Benediktsson, Í.Ö.; Benn, D.I.; Clark, C.D.; Darvill, C.M.; Evans, D.J.A.; et al. Glacial geomorphological mapping: A review of approaches and frameworks for best practice. Earth-Sci. Rev. 2018, 185, 806–846. [Google Scholar] [CrossRef]
  43. Nuth, C.; Kääb, A. Co-registration and bias corrections of satellite elevation data sets for quantifying glacier thickness change. Cryosphere 2011, 5, 271–290. [Google Scholar] [CrossRef] [Green Version]
  44. Wheaton, J.M.; Brasington, J.; Darby, S.E.; Sear, D.A. Accounting for uncertainty in DEMs from repeat topographic surveys: Improved sediment budgets. Earth Surf. Proc. Landf. 2010, 35, 136–156. [Google Scholar] [CrossRef]
  45. Immerzeel, W.W.; Kraaijenbrink, P.D.A.; Shea, J.M.; Shrestha, A.B.; Pellicciotti, F.; Bierkens, M.F.P.; de Jong, S.M. High-resolution monitoring of Himalayan glacier dynamics using unmanned aerial vehicles. Remote Sens. Environ. 2014, 150, 93–103. [Google Scholar] [CrossRef]
  46. Hendrickx, H.; Vivero, S.; De Cock, L.; De Wit, B.; De Maeyer, P.; Lambiel, C.; Delaloye, R.; Nyssen, J.; Frankl, A. The reproducibility of SfM algorithms to produce detailed Digital Surface Models: The example of PhotoScan applied to a high-alpine rock glacier. Remote Sens. Lett. 2019, 10, 11–20. [Google Scholar] [CrossRef]
  47. Clapuyt, F.; Vanacker, V.; Van Oost, K. Reproducibility of UAV-based earth topography reconstructions based on Structure-from-Motion algorithms. Geomorphology 2016, 260, 4–15. [Google Scholar] [CrossRef]
  48. Smith, M.W.; Vericat, D. From experimental plots to experimental landscapes: Topography, erosion and deposition in sub-humid badlands from Structure-from-Motion photogrammetry. Earth Surf. Proc. Landf. 2015, 40, 1656–1671. [Google Scholar] [CrossRef]
  49. Turner, D.; Lucieer, A.; Wallace, L. Direct Georeferencing of Ultrahigh-Resolution UAV Imagery. IEEE Trans. Geosci. Remote 2014, 52, 2738–2745. [Google Scholar] [CrossRef]
  50. Cunliffe, A.M.; Anderson, K.; DeBell, L.; Duffy, J.P. A UK Civil Aviation Authority (CAA)-approved operations manual for safe deployment of lightweight drones in research. Int. J. Remote Sens. 2017, 38, 2737–2744. [Google Scholar] [CrossRef] [Green Version]
Figure 1. A comparison of very-high resolution satellite imagery (World-View 2, 50 cm ground sampling distance (GSD)) and UAV-derived imagery (4 cm GSD) on the foreland of Hoffellsjökull, Iceland. Note that the UAV-derived data allowed for recognition of the subtle annual push moraines, thereby, enabling the investigation of previous annual (or seasonal) ice-margin dynamics.
Remotesensing 11 00065 g001
Figure 2. Operational framework for rapid mapping and monitoring of proglacial areas.
Remotesensing 11 00065 g002
Figure 3. Location of the study area; red circle indicates the approximate location of the surveyed part of the Hørbyebreen foreland. Reprinted from Geomorphology, 325: 40–54, Ewertowski et al., “Quantification of historical landscape change”, Copyright (2019), with permission from Elsevier [4].
Remotesensing 11 00065 g003
Figure 4. Samples of full-resolution (7.9 cm GSD) digital elevation models (DEMs) visualized using hillshading. Foreland of Hørbyebreen, Svalbard. Note that it is possible to recognize: (A) Very small and short flutes anchored behind the boulders; (B,D) Several types of cross-cutting ridges characterised by different orientation, width and height; (C) At least several types of glaciological structures including transverse surface fractures (crevasse traces) and longitudinal foliations.
Remotesensing 11 00065 g004
Figure 5. Samples of full resolution (1.9 cm GSD) orthomosaic showing the same locations as in Figure 4. Foreland of Hørbyebreen, Svalbard. Note, that comparing to the visualization of hillshade model (Figure 4), some elements are better visible, whereas others are harder to recognize; e.g., (A) Flutes are hard to identify, but the boulders are clearly visible; (B,D) It is hard to recognize transverse ridges and to assess their height; however, it is much easier to differentiate between transverse ridges and debris flow stripes, due to the difference in the color of the debris; (C) Crevasse traces and longitudinal foliations are clearly visible; in addition longitudinal debris stripes are also easy to identify.
Remotesensing 11 00065 g005
Figure 6. Distribution of the geometrical ridges in front of Horbyebreen, Svalbard. (A) Hillshade model; (B) Orthomosaic; (C) Geomorphological map showing complex pattern of cross-cutting ridges. Note, that it was necessary to combine both, DEM and orthomosaic, for proper interpretation and mapping of the ridges.
Remotesensing 11 00065 g006

