A Three-Way Clustering Method Based on Ensemble Strategy and Three-Way Decision


1
School of Science, Jiangsu University of Science and Technology, Zhenjiang 212003, China
2
College of Mathematics and Information Science, Hebei Normal University, Shijiazhuang 050024, China
3
School of Computer Science, Jiangsu University of Science and Technology, Zhenjiang 212003, China
4
School of Naval Architecture and Ocean Engineering, Jiangsu University of Science and Technology, Zhenjiang 212003, China
*
Author to whom correspondence should be addressed.
Information 2019, 10(2), 59; https://doi.org/10.3390/info10020059
Submission received: 12 December 2018
/
Revised: 27 January 2019
/
Accepted: 10 February 2019
/
Published: 14 February 2019
(This article belongs to the Section Information Theory and Methodology)
Abstract
:Three-way decision is a class of effective ways and heuristics commonly used in human problem solving and information processing. As an application of three-way decision in clustering, three-way clustering uses core region and fringe region to represent a cluster. The identified elements are assigned into the core region and the uncertain elements are assigned into the fringe region in order to reduce decision risk. In this paper, we propose a three-way clustering algorithm based on the ideas of cluster ensemble and three-way decision. In the proposed method, we use hard clustering methods to produce different clustering results and labels matching to align all clustering results to a given order. The intersection of the clusters with the same labels are regarded as the core region. The difference between the union and the intersection of the clusters with the same labels are regarded as the fringe region of the specific cluster. Therefore, a three-way clustering is naturally formed. The results on UCI data sets show that such a strategy is effective in improving the structure of clustering results.
1. Introduction
As a new idea of artificial intelligence in recent years, granular computing is a relatively modern theory in simulating human beings thinking and problem solving [1,2,3]. One of the fundamental tasks of granular computing is to explore an efficient information granulation method, in order to build multilevel granular structures [4]. Among the many approaches of information granulation [5,6,7,8], cluster analysis is perhaps one of the most widely used ones [9]. The fundamental objective of clustering is to discover the underlying structure of a data set. In general, the structure means that similar samples are assigned to the same cluster while dissimilar samples are assigned to different clusters. The lack of prior knowledge makes clustering analysis remain a very challenging problem. Research on clustering algorithm has received much attention and a number of clustering methods have been developed over the past decades.
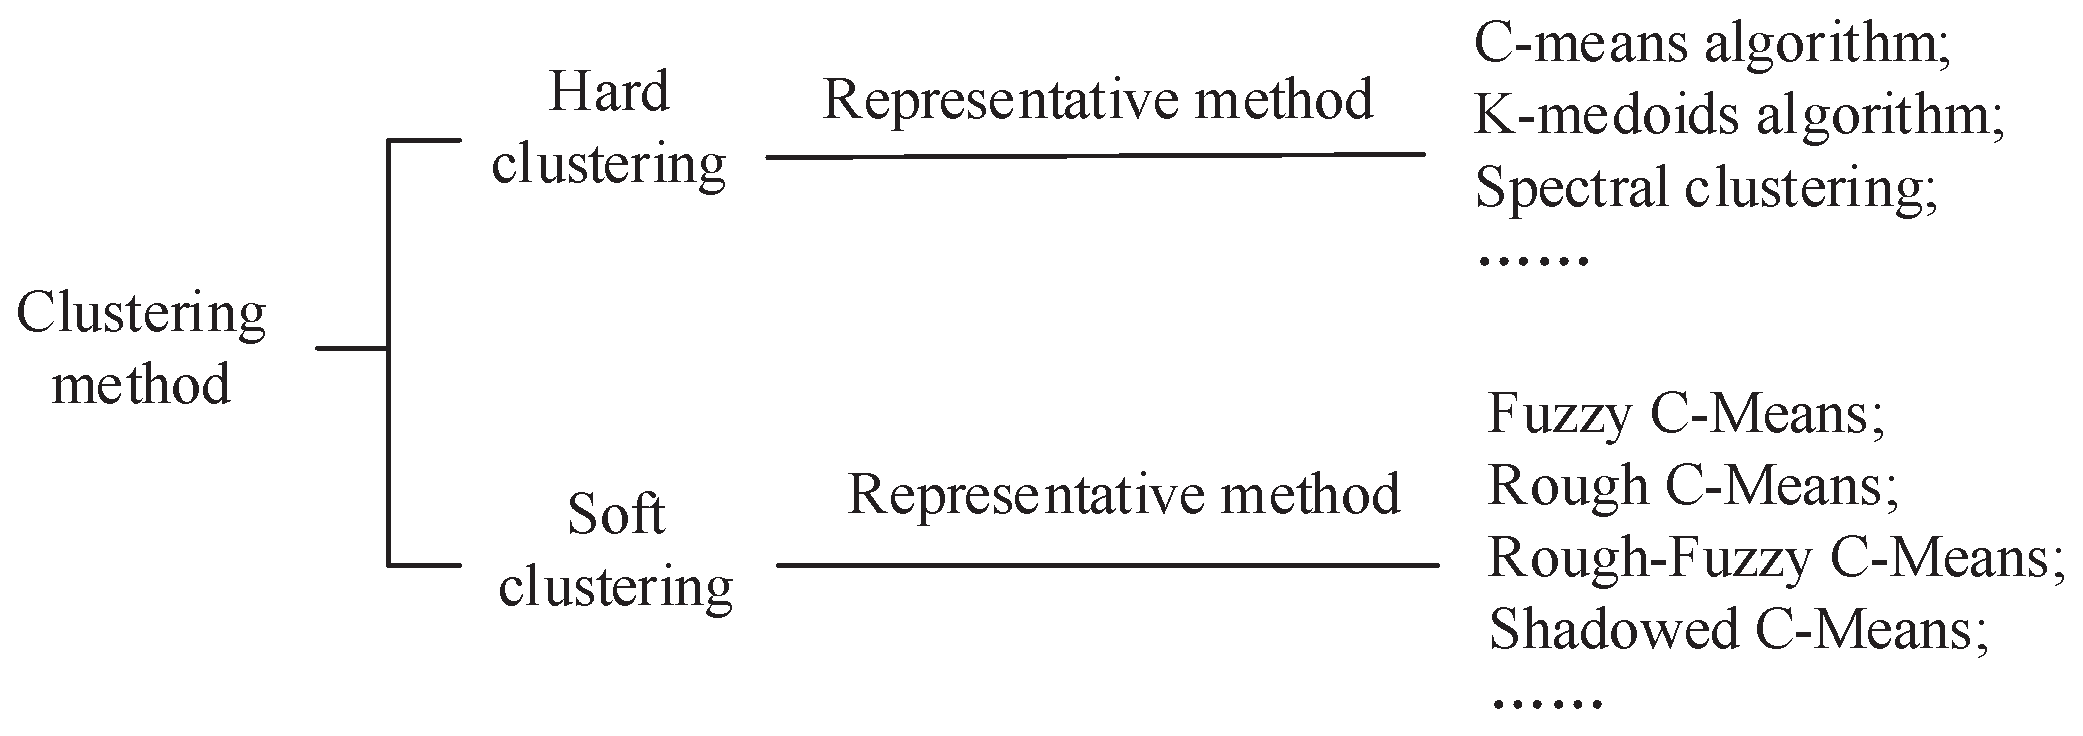
The various methods for clustering can be divided into two categories: hard clustering and soft clustering. Hard clustering methods, such as c-means [10] and spectral clustering [11], are based on an assumption that a cluster is represented by a set with a crisp boundary. That is, a data point is either in or not in a specific cluster. The requirement of a sharp boundary leads to easy analytical results, but may not adequately show the fact that a cluster may not have a well-defined boundary. Furthermore, it is not the best way to divide the uncertain objects into one cluster.
In order to relax the constraint of hard clustering methods, many soft clustering methods were proposed for different application backgrounds. Fuzzy sets are a well known generalization of crisp sets, which were first introduced by Zadeh [12]. Incorporating fuzzy sets into c-means clustering, Bezdek [13] proposed fuzzy c-means (FCM), which assumes that a cluster is represented by a fuzzy set that models a gradually changing boundary. Another effective tool for uncertain data analysis is rough set theory [14], which uses a pair of exact concepts, called the lower and upper approximations, to approximate a rough (imprecise) concept. Based on the rough set theory, Lingras and West [15] introduced rough c-means (RCM) clustering, which describes each cluster not only by a center, but also with a pair of lower and upper bounds. Incorporating membership in the RCM framework, Mitra et al. [16] put forward a rough-fuzzy c-means (RFCM) clustering method. Shadowed set, proposed by Pedrycz [17], provides an alternate mechanism for handling uncertainty. As a conceptual and algorithmic bridge between rough sets and fuzzy sets, shadowed set has been successfully used for clustering analysis, resulting in shadowed c-means (SCM) [18]. A brief classification of existing clustering methods can be shown in Figure 1.
Although there are a lot of clustering methods, the performances of many clustering algorithms are critically dependent on the characteristics of the data set and the input parameters. Improper input parameters may lead to clusters that deviate from those in the data set. It has been accepted that a single clustering algorithm cannot handle all types of data distribution effectively. In order to solve this problem, Strehl and Ghosh [19] proposed cluster ensemble algorithm, which combines multiple clusterings of a set of objects into one clustering result without accessing the original features of the objects. It has been shown that cluster ensemble is useful in many applications, such as knowledge-reuse [20], multi-view clustering [21], distributed computing [22] and in improving the quality and robustness of clustering results [23,24,25,26].
Three-way decision as a separate filed of study for problem solving was proposed by Yao [27,28,29,30], which is an extension of the commonly used binary-decision model. The approach of three-way decisions divides the universe into the Positive, Negative and Boundary regions, which denote the regions of acceptance, rejection and non-commitment for ternary classifications, respectively. For the objects that partially satisfy the classification criteria, it is difficult to directly identify them without uncertainty. Instead of making a binary decision, we use thresholds on the degrees of satisfiability to make one of three decisions: accept, reject, or non-commitment. The third option may also be referred to as a deferment decision that requires further judgments. Three-way decisions have been proved to build on solid cognitive foundations and are a class of effective ways commonly used in human problem solving and information processing [31]. Many soft computing models for leaning uncertain concepts, such as interval sets, rough sets, fuzzy sets and shadowed sets, have the tri-partitioning properties and can be reinvestigated within the framework of three-way decision [30].
Hard clustering methods do not address satisfactorily the uncertain relationships between an element and a cluster. It is more reasonable in some applications that there may be three types of relationships between an element and a cluster, namely, belong-to fully, belong-to partially (i.e., also not belong-to partially), and not belong-to fully. In most of the existing studies, a cluster is represented by a single set and the set naturally divides the space into two regions. Objects belong to the cluster if they are in the set, otherwise they do not. Here, only two relationships are considered and we refer to these clustering methods based on such two-way decisions as hard clustering methods. In order to address the three types of relationships between a cluster and an object, three-way clustering has been proposed and studied [32,33,34]. Three-way clustering uses two regions to represent a cluster, i.e., core region (Co) and fringe region (Fr) rather than one set. The core region is an area where the elements are highly concentrated of a cluster and fringe region is an area where the elements are loosely concentrated. There may be common elements in the fringe region among different clusters.
This paper aims at presenting a three-way clustering method based on the results of hard clustering. The idea comes from cluster ensemble and three-way decision. Because different algorithms or different parameters for a hard algorithm may lead to different clustering results. It is hard to judge which structure best matches the real distribution without supervised information. Therefore, we integrate multiple clustering results and lead to a three way clustering algorithm. In the proposed algorithm, hard clustering methods are used to produce different clustering results and label matching is used to align each clustering result to a given order. Different from the other three-way clustering algorithms, which use evaluation functions to decide the core region and fringe region, we regard the intersection of the clusters with same order as the core region. The difference between the union and the intersection of the clusters with the same order are regarded as the fringe region of the specific cluster. Therefore, a three-way explanation of the cluster is naturally formed.
The present paper is based on, but substantially expands, our preliminary study reported in a conference paper [35]. The study is organized into five sections. We start with brief preliminaries of the background knowledge in Section 2. In Section 3, we present the process of three-way ensemble clustering by two main steps. Experimental results are reported in Section 4. We conclude the paper and point out some future research problems in Section 5.
2. Preliminaries
In this section we briefly introduce some work related to this paper. These include three-way clustering and cluster ensemble.
2.1. Three-Way Clustering
Hard clustering algorithms usually represent a cluster by a single set based on a two-way decision strategy, which does not address satisfactorily the uncertain relationship between an element and a cluster. In fact, it is more reasonable in some applications that there are three types of relationships between an object and a cluster, namely, belong-to definitely, not belong-to definitely, and uncertain. It is more appropriate to use three regions to represent a cluster than using one set. Inspired by the theory of three-way decisions, Yu [33,34] had proposed a framework of three-way cluster analysis which describes a cluster by a pair of sets or three sets. The use of three regions to represent a cluster is more appropriate than the use of a set, which also directly leads to a three-way decision based interpretation of clustering. Rough clustering assumes that an object must belong to one lower approximation or intersection of two upper approximations [36]. It seems to be more realistic for three-way clustering to assume that an object can belong to one core region at most or one fringe region at least.
We introduce some basic knowledge about three-way clustering. Assume that is a family clusters of universe . A hard clustering requires that satisfies the following properties:
Property (i) states that each cluster cannot be empty. Properties (ii) and (iii) state that every belongs to only one cluster. In this case, C is a partition of the universe. Different from the general crisp representation of a cluster, three-way clustering uses a pair of sets to represent a three-way cluster , i.e.,
where and . Let . The three sets, and naturally form the Core Region, Fringe Region, and Trivial Region, respectively, of a cluster. That is:
is the set of the objects which belong to the cluster definitely; is the set of the objects which might belong to and , is the set of the objects which does not belong to definitely. These subsets have the following properties.
If , the representation of turns into . It is a set and . This is a representation of two-way decision. The representation of a cluster by a single set is a special case of three-way cluster in which the fringe regions are the empty set.
For different applications, we can adopt different requirements on and . In this paper, we use the following properties:
Property (I) demands that each cluster cannot be empty. Property (II) states that it is possible that an element belongs to more than one cluster. Property (III) requires that the core regions of clusters are pairwise disjoint. Based on the above discussion, we have the following family of clusters to represent the result of three-way clustering:
Note that the properties of can be obtained from properties (I)-(III).
2.2. Cluster Ensemble
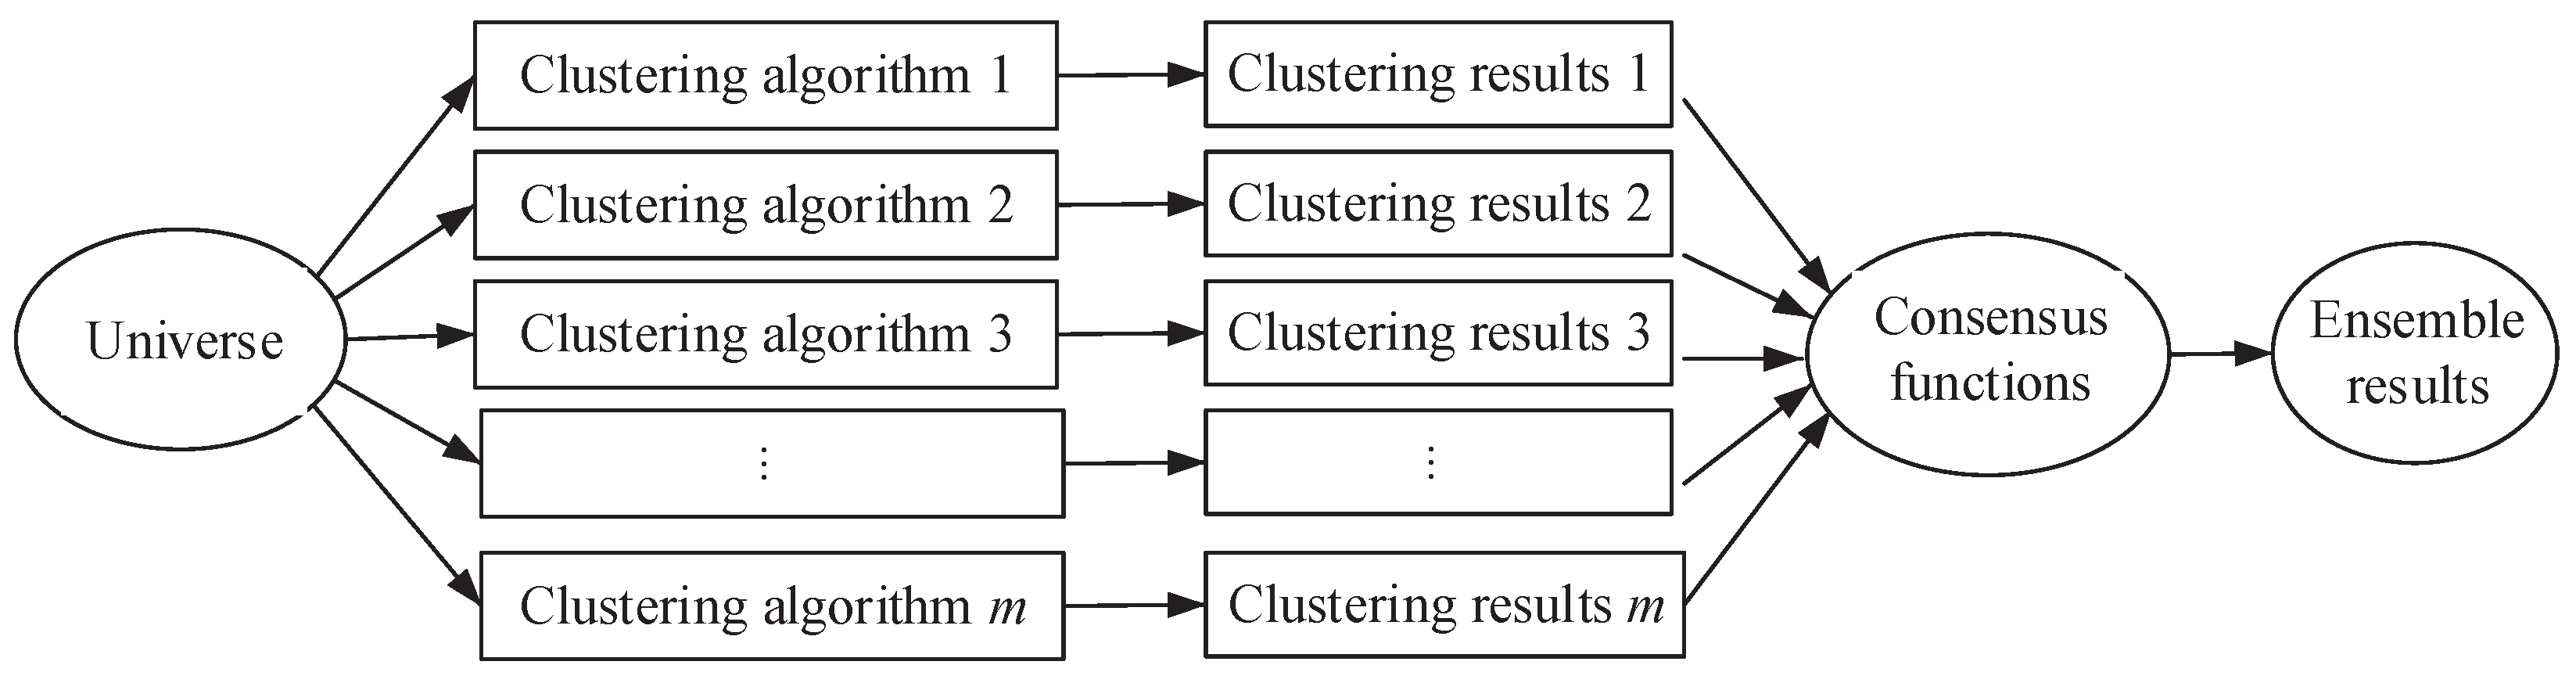
Cluster ensemble is a framework for combining multiple clusterings of a set of objects without accessing the original features of the objects. This problem was first proposed in a knowledge reuse framework by Strehl and Ghosh [19], who applied it for improving clustering quality and for distributed clustering. The problem of clustering ensemble can be considered as the optimization problem where, given a set of objects V and m clusterings on V, compute a new clustering that minimizes the total number of disagreements with all the given clusterings. The procedure can be described by Figure 2.
There are two problems during the process of clustering ensemble: (1) how to generate a number of different clustering results; (2) how to design a valid consensus function to integrate the clustering results, and get a data partition which can reflect the structure of the data set. For the first problem, we can use different clustering methods or the same clustering methods with different parameters to generate different clustering results. So the pivotal problem of cluster ensemble is construction of consensus function. Many different methods, such as voting method, hypergraph division, probability accumulation and so on, were developed to construct consensus function since the framework of cluster ensemble was proposed. However, most of the existing methods are focused on integrating hard clusterings into hard clustering or integrating soft clusterings into soft clustering. There are relatively few studies on integration of hard clustering into soft clustering. Based on the hard clustering results, we present a three-way clustering method using the ideas of cluster ensemble and three-way decision.
3. Three-Way Ensemble Clustering
By following ideas of cluster ensemble and three-way decision, we present a three-way ensemble clustering algorithm. In this section, we assume that the universal has been divided into k disjoint sets m times by existing hard clustering algorithms. We discuss how to design a valid consensus function to obtain a three-way clustering based on the hard clustering results.
We begin our discussion by introducing some notations. We suppose that is a set of n objects and denotes th clustering of V, where is a hard clustering results of V, that is, and . The k sets are clusters of . Although we have obtained the clustering results of V, cannot be directly used for the conclusion of the next stage due to the lack of priori category information. As an example, we consider the data set and let and be three clusterings of V which are shown in Table 1. Although the objects are expressed in different orders, they represent the same clustering result. In order to combine the clustering results, the cluster labels must be matched to establish the correspondence between each one.
In general, the number of identical objects covered by the corresponding cluster labels should be the largest. The cluster labels can be registered based on this heuristic. Assume and are two hard clustering results of V. Each divides the data set into k clusters denoted by and , respectively. First, the numbers of identical objects covered by each pair of cluster labels and in the two clusters are recorded in the overlap matrix of . Then select the cluster label that covers the largest number of identical objects to establish the correspondence and remove the result from the overlap matrix. Repeat the above process until all the cluster labels have established the corresponding relationship.
When there are clustering results, we can randomly select one as the matching criterion and match the other clustering results with the selected results. The matching algorithm only needs to check the clustering results and and store the overlap matrix with the storage space of . The whole matching process is fast and efficient.
After all clustering labels match, all objects of V can be divided into three types for a given label j based on the results of labels matching:
From the above classifications, it can be seen that the objects in Type I are assigned to th cluster in all clustering results. The objects of Type II are assigned to th cluster in part of clustering results. The objects in Type III have no intersection with th in each clustering result. Based on the ideas of three-way decision and three-way clustering, the elements in Type I are clearly attributable to the th cluster and should be assigned to core region of th cluster. The elements in Type II should be assigned to fringe region of th cluster and all the elements in Type III should be assigned to trivial region of th cluster. From the above discussion, we get the following strategy to obtain a three-way clustering by cluster ensemble.
The above clustering method is called a three-way ensemble clustering. The procedure of three-way ensemble clustering consists mainly of three steps.
- Obtain a group of hard clustering results by using existing methods.
- Randomly select one clustering result in step 1 as the matching criterion and match the other clustering results with the selected results
- Compute the intersection of the clusters with the same labels and the difference between the union and the intersection of the clusters with the same labels.
The above procedure can be depicted by Figure 3. Finally, we present Algorithm 1, which describes the proposed three-way ensemble clustering based on hard clustering results. In Algorithm 1, we choose the first clustering results as matching criterion and match the other clustering results with during label matching.
| Algorithm 1 Three-way ensemble clustering |
|
4. Experimental Illustration
4.1. Evaluation Measures
The evaluation of clustering, also referred to as cluster validity, is a crucial process to assess the performance of the learning method in identifying relevant groups. A good measure of cluster quality will help in allowing the comparison of several clustering methods and the analysis of whether one method is superior to another one. The following quantitative indices are often used to evaluate the performance of clustering algorithms.
1. Davies-Bouldin index [37,38] ( hereafter).
where and are the intra-cluster distance and the inter-cluster separation, respectively. is defined as follows:
As a function of the ratio of the within cluster scatter to the between cluster separation, a lower value will mean that the clustering is better.
2. Average Silhouette index [39] ( hereafter).
where n is the total number of objects in the set and is the silhouette of object , which defined as,
is the average distance between and all other objects in its own cluster, and is the minimum of the average distance between and objects in other clusters.
The silhouette of each object shows which objects lie well within their cluster, and which ones are merely somewhere in between clusters. The average silhouette provides an evaluation of clustering validity. The range of the average silhouette index is . A higher value means a better clustering result.
3. Accuracy (ACC hereafter).
where is the number of common objects in the th cluster and its matched class j after obtaining a one-to-one match between clusters and classes. The partition with highest is taken to be optimal. The value is equal to 1 only when the clustering result is same as the ground truth.
Most of the above indices are used to evaluate the efficiency of two-way clustering. In three-way clustering, a cluster is represented by core region and fringe region rather than one set. In order to apply the above indicators to three-way clustering, we use all core regions to form a non-overlap clustering result. Simultaneously, we use the unions of core region and fringe region to form an overlap clustering result. We compute the above indices with two clustering results respectively. A better three-way clustering result should have a lower value, a lower value and a higher value on core region.
4.2. Efficiency of Proposed Algorithms Based on c-Means
To illustrate the effectiveness of Algorithm 1, eight UCI [40] data sets are employed in this subsection. The details of these data sets are shown in Table 2.
In the first set of experiments, we use c-means algorithm on each data set to obtain hard clustering results and repeat 10 times with different initial centroids. For the sake of a clear presentation, the average performances and the best performances of and in 10 times runs are reported in Table 3 and Table 4. Base on the results of c-means, we use the proposed three-way ensemble clustering algorithm to obtain the core regions and fringe regions. In order to identify the quality of three-way ensemble clustering, we use all core regions to form a non-overlap clustering result, which is called core region clustering result. Simultaneously, we use the unions of core regions and fringe regions to form an overlap clustering result, which is called union region clustering result. We compute the above indices for the two clustering results, respectively. The results are presented in Table 5 and Table 6.
With a deep investigation of Table 3, Table 4, Table 5 and Table 6, we can find that the performances on Hill and WDBC are the same. This is because the clustering results of c-means in 10 times runs are the same. All the objects are assigned to core regions and the fringe regions are empty according to three-way ensemble clustering strategy. On the other data sets, three-way ensemble clustering performs the lowest values on core region clustering result. The improvement can be attributed to the fact that core region clustering result helps to increase the degree of separation between clusters since objects in fringe regions have been successfully marked out. Conversely, values of three-way ensemble clustering on union region clustering result are higher because the inclusions of objects in fringe regions decrease the degree of separation between clusters. The same is true for . As for , the performances on union region clustering result are the highest since the number of common objects in the union of core region and fringe region and its matched class are obviously higher than the original cluster.
4.3. Efficiency of Proposed Algorithms Based on Spectral Clustering
Spectral clustering [41] is another hard clustering method based on graph theory. One of the spectral clustering algorithms is NJW algorithm [42], which uses the following Gaussian kernel function to compute similarity function.
where is a scale parameter and is the Euclidean distance. In the second set of experiments, we use NJW algorithm to obtain hard clustering results. The experiments are repeated 60 times with changed from to , each time increased by 0.01. The average performances and the best performances of and in 60 times runs are reported in Table 7 and Table 8. Similarly, the performances of three-way ensemble clustering based on spectral clustering results are computed, which are presented in Table 9 and Table 10.
From Table 7, Table 8, Table 9 and Table 10, it is not difficult to observe that three-way ensemble clustering performs the lowest values and the highest values on core region clustering result. The best values are obtained on union region clustering result of three-way ensemble clustering. The relation is true with the results of c-means. This conclusion means that the exclusions of objects in fringe regions increase the degree of separation, while the inclusions of objects in fringe regions increase the accuracy of the clustering result.
5. Concluding Remarks
In this paper, we developed a three-way ensemble clustering method by employing the ideas of three-way decisions and cluster ensemble. Hard clustering methods are used to produce different clustering results and cluster labels matching is used to align each clustering result to a given order. The intersection of the clusters with the same labels are regarded as the core region and the difference between the union and the intersection of the clusters with the same labels are regarded as the fringe region of a specific cluster. Based on the above strategy, a three-way explanation of the cluster is naturally formed and experimental results demonstrate that the new algorithm can significantly improve the structure of classification results by comparing with the traditional clustering algorithm. The present study is the first step for the research of three-way clustering. The following two problems will be an interesting topic to be addressed for further research. First, in the proposed three-way algorithm, the number of clusters is given in advance. However, how to determine the number of clusters needs further attention. Second, multi-granulation is a recent topic in granular computing which can be used for the constructing approximations with respect to multiple granulations. Our proposed algorithm is based on a single granulation. How to develop three-way clustering based on multigranulations needs further attention.
Author Contributions
Data curation, K.W.; Funding acquisition, G.X.; Investigation, K.W.; Methodology, P.W.; Software, Q.L.; Writing, review & editing, P.W.
Funding
This work was supported in part by National Natural Science Foundation of China (Nos. 61503160 and 61773012), Key University Science Research Project of Jiangsu Province (No. 18KJA130001), Natural Science Foundation of the Jiangsu Higher Education Institutions of China (No. 15KJB110004).
Conflicts of Interest
The authors declare no conflict of interest.
References
- Fujita, H.; Li, T.; Yao, Y. Advances in three-way decisions and granular computing. Knowl.-Based Syst. 2016, 91, 1–3. [Google Scholar] [CrossRef]
- Yao, Y.Y. A triarchic theory of granular computing. Granul. Comput. 2016, 1, 145–157. [Google Scholar] [CrossRef] [Green Version]
- Zadeh, L.A. Toward a theory of fuzzy information granulation and its centrality in human reasoning and fuzzy logic. Fuzzy Set Syst. 1997, 90, 111–127. [Google Scholar] [CrossRef]
- Yao, Y.Y. Integrative levels of granularity. In Human-Centric Information Processing through Granular Modelling; Bargiela, A., Pedrycz, W., Eds.; Springer: Berlin, Germany, 2009; pp. 31–47. [Google Scholar]
- Hu, Q.H.; Yu, D.R.; Liu, J.F.; Wu, C.X. Neighborhood rough set based heterogeneous feature subset selection. Inf. Sci. 2008, 178, 3577–3594. [Google Scholar] [CrossRef]
- Pawlak, Z. Some issues on rough sets. In Transactions on Rough Sets I; Springer: Berlin, Germany, 2004; pp. 1–58. [Google Scholar]
- Qian, Y.H.; Cheng, H.H.; Wang, J.T.; Liang, J.Y.; Pedrycz, W.; Dang, C.Y. Grouping granular structures in human granulation intelligence. Inf. Sci. 2017, 382–383, 150–169. [Google Scholar] [CrossRef]
- Fujita, H.; Gaeta, A.; Loia, V.; Orciuoli, F. Resilience analysis of critical infrastructures: A cognitive approach based on granular computing. IEEE Trans. Cybern. 2018, 1–14. [Google Scholar] [CrossRef] [PubMed]
- Pedrycz, W. Granular Computing Analysis and Design of Intelligent Systems; CRC Press: Boca Raton, FL, USA, 2013. [Google Scholar]
- Macqueen, J. Some methods for classification and analysis of multivariate observations. In Proceedings of the 5th Berkeley Symposium on Mathematical Statistics and Probability, 21 June–18 July 1965 and 27 December 1965–7 January 1966; University of California Press: Berkeley, CA, USA, 1967; pp. 281–297. [Google Scholar]
- Fiedler, M. Algebraic connectivity of graphs. Czech. Math. J. 1973, 23, 298–305. [Google Scholar]
- Zadeh, L. Fuzzy sets. Inform. Control 1965, 8, 338–353. [Google Scholar] [CrossRef] [Green Version]
- Bezdek, J. Pattern Recognition with Fuzzy Objective Function Algorithms; Plenum Press: NewYork, NY, USA, 1981. [Google Scholar]
- Pawlak, Z. Rough sets. Int. J. Comput. Inf. Sci. 1982, 11, 314–356. [Google Scholar] [CrossRef]
- Lingras, P.; West, C. Interval set clustering of web users with rough K-Means. J. Intell. Inf. Syst. 2004, 23, 5–16. [Google Scholar] [CrossRef]
- Mitra, S.; Banka, H.; Pedrycz, W. Rough-fuzzy collaborative clustering. IEEE Trans. Syst. Man Cybern. B 2006, 36, 795–805. [Google Scholar] [CrossRef]
- Pedrycz, W. Shadowed sets: Representing and processing fuzzy sets. IEEE Trans. Syst. Man Cybern. B 1998, 28, 103–109. [Google Scholar] [CrossRef]
- Mitra, S.; Pedrycz, W.; Barman, B. Shadowed c-means: Integrating fuzzy and rough clustering. Pattern Recogn. 2010, 43, 1282–1291. [Google Scholar] [CrossRef]
- Strehl, A.; Ghosh, J. Cluster ensembles—A knowledge reuse framework for combining multiple partitions. J. Mach. Learn. Res. 2002, 3, 583–617. [Google Scholar]
- Ghosh, J.; Strehl, A.; Merugu, S. A consensus framework for integrating distributed clusterings under limited knowledge sharing. In Proceedings of the NSF Workshop on Next Generation Data Mining, Baltimore, MD, USA, 1–3 November 2002; pp. 99–108. [Google Scholar]
- Kreiger, A.M.; Green, P. A generalized rand-index method for consensus clustering of separate partitions of the same data base. J. Classif. 1999, 16, 63–89. [Google Scholar] [CrossRef]
- Merugu, S.; Ghosh, J. Privacy-preserving distributed clustering using generative models. In Proceedings of the Third IEEE International Conference on Data Mining (ICDM), Melbourne, FL, USA, 19–22 November 2003; pp. 211–218. [Google Scholar]
- Fern, X.Z.; Brodley, C.E. Random projection for high dimensional clustering: A cluster ensemble approach. In Proceedings of the Twentieth International Conference on Machine Learning, Washington, DC, USA, 21–24 August 2003. [Google Scholar]
- Fred, A.; Jain, A.K. Data clustering using evidence accumulation. In Proceedings of the Sixteenth International Conference on Pattern Recognition (ICPR), Quebec City, QC, Canada, 11–15 August 2002; pp. 276–280. [Google Scholar]
- Kuncheva, L.; Hadjitodorov, S. Using diversity in cluster ensembles. In Proceedings of the IEEE International Conference on Systems, Man and Cybernetics, The Hague, The Netherlands, 10–13 October 2004; pp. 1214–1219. [Google Scholar]
- Hadjitodorov, S.; Kuncheva, L.; Todorova, L. Moderate diversity for better cluster ensembles. Inf. Fusion 2006, 7, 264–275. [Google Scholar] [CrossRef]
- Yao, Y.Y. Three-way decision: An interpretation of rules in rough set theory. In Proceedings of the 4th International Conference on Rough Sets and Knowledge Technology, RSKT’09, Gold Coast, Australia, 14–16 July 2009; Springer: Berlin/Heidelberg, Germany, 2009; pp. 642–649. [Google Scholar]
- Yao, Y.Y. Three-way decisions with probabilistic rough sets. Inf. Sci. 2010, 180, 341–353. [Google Scholar] [CrossRef] [Green Version]
- Yao, Y.Y. The superiority of three-way decisions in probabilistic rough set models. Inf. Sci. 2011, 181, 1080–1096. [Google Scholar] [CrossRef]
- Yao, Y.Y. An outline of a theory of three-way decisions. In Proceedings of the 8th International Conference on Rough Sets and Current Trends in Computing, RSCTC 2012, Chengdu, China, 17–20 August 2012; Springer: Berlin/Heidelberg, Germany, 2012; pp. 1–17. [Google Scholar]
- Yao, Y.Y. Three-way decisions and cognitive computing. Cognit. Comput. 2016, 8, 543–554. [Google Scholar] [CrossRef]
- Yu, H. A framework of three-way cluster analysis. In Proceedings of the International Joint Conference on Rough Sets, Olsztyn, Poland, 3–7 July 2017; pp. 300–312. [Google Scholar]
- Yu, H.; Jiao, P.; Yao, Y.Y.; Wang, G.Y. Detecting and refining overlapping regions in complex networks with three-way decisions. Inf. Sci. 2016, 373, 21–41. [Google Scholar] [CrossRef]
- Yu, H.; Zhang, C.; Wang, G.Y. A tree-based incremental overlapping clustering method using the three-way decision theory. Knowl.-Based Syst. 2016, 91, 189–203. [Google Scholar] [CrossRef]
- Wang, P.X.; Liu, Q.; Yang, X.B.; Xu, F.S. Ensemble re-clustering: Refinement of hard clustering by three-way strategy. In Proceedings of the International Conference on Intelligence Science and Big Data Engineering, Dalian, China, 22–23 September 2017; Springer: Berlin/Heidelberg, Germany, 2017; pp. 423–430. [Google Scholar]
- Lingras, P.; Peters, G. Rough clustering. WIRES Data Min. Knowl. 2011, 1, 64–72. [Google Scholar] [CrossRef]
- Bezdek, J.; Pal, N. Some new indexes of cluster validity. IEEE Trans. Syst. Man Cybern. B 1998, 28, 301–315. [Google Scholar] [CrossRef] [PubMed]
- Maulik, U.; Bandyopadhyay, S. Performance evaluation of some clustering algorithms and validity indices. IEEE Trans. Pattern Anal. 2002, 24, 1650–1654. [Google Scholar] [CrossRef] [Green Version]
- Rousseeuw, P. Silhouettes: A graphical aid to the interpreta-tion and validation of cluster analysis. J. Comput. Appl. Math. 1987, 20, 53–65. [Google Scholar] [CrossRef]
- UCI Machine Learning Repository. Available online: http://www.ics.uci.edu/mlearn/MLRepository.html (accessed on 11 February 2019).
- Donath, W.; Hoffman, A. Lower bounds for the partitioning of graphs. IBM J. Res. Dev. 1973, 17, 420–425. [Google Scholar] [CrossRef]
- Ng, A.; Jordan, M.; Weiss, Y. On spectral clustering: Analysis and an algorithm. In Proceedings of the 15th International Conference on Neural Information Processing Systems, NIPS’02, Vancouver, BC, Canada, 9–14 December 2002; MIT Press: Cambridge, MA, USA, 2002; pp. 849–856. [Google Scholar]
Figure 1.
Classification diagram of existing clustering methods.

Figure 2.
Procedure diagram of cluster ensemble.

Figure 3.
Procedure diagram of three-way ensemble re-clustering.


Table 1.
Different representations of the same clustering results.
| 1 | 2 | 3 | |
| 1 | 2 | 3 | |
| 2 | 3 | 2 | |
| 2 | 3 | 2 | |
| 3 | 1 | 1 | |
| 3 | 1 | 1 |
Table 2.
A description of USPS data sets in the experiments.
| ID | Data Sets | Samples | Attributes | Classes |
|---|---|---|---|---|
| 1 | Bank | 1372 | 4 | 2 |
| 2 | Congress | 435 | 16 | 2 |
| 3 | Hill | 1212 | 100 | 2 |
| 4 | WDBC | 569 | 30 | 2 |
| 5 | Wine | 178 | 13 | 3 |
| 6 | Seeds | 310 | 6 | 2 |
| 7 | Forest | 523 | 27 | 4 |
| 8 | Sonar | 2008 | 60 | 2 |
Table 3.
Best performances of c-means in 10 times runs.
| Data Set | |||
|---|---|---|---|
| Bank | 1.1913 | 0.3308 | 0.5752 |
| Congress | 1.4850 | 0.2799 | 0.8671 |
| Hill | 0.4080 | 0.8716 | 0.5091 |
| WDBC | 1.1363 | 0.3845 | 0.9279 |
| Wine | 1.3147 | 0.3002 | 0.9522 |
| Seeds | 0.8771 | 0.4221 | 0.8867 |
| Forest | 1.2814 | 0.2502 | 0.7822 |
| Sonar | 2.0922 | 0.1751 | 0.5418 |
Table 4.
Average performances of c-means in 10 times runs.
| Data Set | |||
|---|---|---|---|
| Bank | 1.1911 | 0.3311 | 0.5758 |
| Congress | 1.4709 | 0.2800 | 0.8713 |
| Hill | 0.4080 | 0.8716 | 0.5091 |
| WDBC | 1.1363 | 0.3845 | 0.9279 |
| Wine | 1.3086 | 0.3013 | 0.9719 |
| Seeds | 0.8759 | 0.4221 | 0.8905 |
| Forest | 1.2775 | 0.2517 | 0.7916 |
| Sonar | 1.9807 | 0.2087 | 0.5625 |
Table 5.
Performances of three-way ensemble clustering on core region clustering result by using c-means.
Table 5.
Performances of three-way ensemble clustering on core region clustering result by using c-means.
| Data Set | |||
|---|---|---|---|
| Bank | 1.1850 | 0.3334 | 0.5722 |
| Congress | 1.3890 | 0.2988 | 0.8529 |
| Hill | 0.4080 | 0.8716 | 0.5091 |
| WDBC | 1.1363 | 0.3845 | 0.9279 |
| Wine | 1.2430 | 0.3250 | 0.9213 |
| Seeds | 0.8727 | 0.4251 | 0.8857 |
| Forest | 1.2706 | 0.2578 | 0.7725 |
| Sonar | 1.5122 | 0.2733 | 0.3558 |
Table 6.
Performances of three-way ensemble clustering on union region clustering result by using c-means.
Table 6.
Performances of three-way ensemble clustering on union region clustering result by using c-means.
| Data Set | |||
|---|---|---|---|
| Bank | 1.1975 | 0.3299 | 0.5765 |
| Congress | 1.5785 | 0.2701 | 0.8851 |
| Hill | 0.4080 | 0.8716 | 0.5091 |
| WDBC | 1.1363 | 0.3845 | 0.9279 |
| Wine | 1.3925 | 0.2856 | 0.9721 |
| Seeds | 0.8805 | 0.4210 | 0.8906 |
| Forest | 1.2994 | 0.2465 | 0.7917 |
| Sonar | 3.5083 | 0.0845 | 0.7308 |
Table 7.
Average performances of spectral clustering in 60 times runs.
| Data Set | |||
|---|---|---|---|
| Bank | 1.2002 | 0.3238 | 0.6144 |
| Congress | 1.4819 | 0.2794 | 0.8633 |
| Hill | 0.4882 | 0.8534 | 0.5145 |
| WDBC | 1.1753 | 0.3629 | 0.9262 |
| Wine | 1.3069 | 0.3011 | 0.9664 |
| Seeds | 0.8751 | 0.4159 | 0.9267 |
| Forest | 1.3597 | 0.2209 | 0.7677 |
| Sonar | 2.1188 | 0.1578 | 0.5563 |
Table 8.
Best performances of spectral clustering in 60 times runs.
| Data Set | |||
|---|---|---|---|
| Bank | 1.2002 | 0.3238 | 0.6144 |
| Congress | 1.4730 | 0.2794 | 0.8736 |
| Hill | 0.4110 | 0.8710 | 0.5206 |
| WDBC | 1.1743 | 0.3639 | 0.9279 |
| Wine | 1.3069 | 0.3011 | 0.9719 |
| Seeds | 0.8723 | 0.4188 | 0.9333 |
| Forest | 1.3176 | 0.2356 | 0.7916 |
| Sonar | 2.1165 | 0.1584 | 0.5625 |
Table 9.
Performances of three-way ensemble clustering on core region clustering result by using spectral clustering.
Table 9.
Performances of three-way ensemble clustering on core region clustering result by using spectral clustering.
| Data Set | |||
|---|---|---|---|
| Bank | 1.2002 | 0.3238 | 0.6144 |
| Congress | 1.4207 | 0.2921 | 0.8552 |
| Hill | 0.3665 | 0.9187 | 0.4835 |
| WDBC | 1.1726 | 0.3644 | 0.9262 |
| Wine | 1.3002 | 0.3041 | 0.9663 |
| Seeds | 0.8406 | 0.4381 | 0.9048 |
| Forest | 0.9456 | 0.1446 | 0.4398 |
| Sonar | 2.0345 | 0.1687 | 0.5240 |
Table 10.
Performances of three-way ensemble clustering on union region clustering result by using spectral clustering.
Table 10.
Performances of three-way ensemble clustering on union region clustering result by using spectral clustering.
| Data Set | |||
|---|---|---|---|
| Bank | 1.2002 | 0.3238 | 0.6144 |
| Congress | 1.5402 | 0.2732 | 0.8782 |
| Hill | 0.6126 | 0.8310 | 0.5462 |
| WDBC | 1.1771 | 0.3625 | 0.9279 |
| Wine | 1.3178 | 0.2997 | 0.9719 |
| Seeds | 0.9121 | 0.4096 | 0.9381 |
| Forest | 2.1507 | 0.0506 | 0.8222 |
| Sonar | 2.2176 | 0.1500 | 0.5625 |
© 2019 by the authors. Licensee MDPI, Basel, Switzerland. This article is an open access article distributed under the terms and conditions of the Creative Commons Attribution (CC BY) license (http://creativecommons.org/licenses/by/4.0/).
Share and Cite
MDPI and ACS Style
Wang, P.; Liu, Q.; Xu, G.; Wang, K. A Three-Way Clustering Method Based on Ensemble Strategy and Three-Way Decision. Information 2019, 10, 59. https://doi.org/10.3390/info10020059
AMA Style
Wang P, Liu Q, Xu G, Wang K. A Three-Way Clustering Method Based on Ensemble Strategy and Three-Way Decision. Information. 2019; 10(2):59. https://doi.org/10.3390/info10020059
Chicago/Turabian StyleWang, Pingxin, Qiang Liu, Gang Xu, and Kangkang Wang. 2019. "A Three-Way Clustering Method Based on Ensemble Strategy and Three-Way Decision" Information 10, no. 2: 59. https://doi.org/10.3390/info10020059
Note that from the first issue of 2016, this journal uses article numbers instead of page numbers. See further details here.