Obstacle-Aware Indoor Pathfinding Using Point Clouds


1
Applied Geotechnologies Group, Dept. Natural Resources and Environmental Engineering, University of Vigo, Campus Lagoas-Marcosende, CP 36310 Vigo, Spain
2
Faculty of Geoengineering, Mining and Geology Wroclaw University of Science and Technology, ul. Na Grobli 15, 50-421 Wroclaw, Poland
3
Department of Infrastructure Engineering, University of Melbourne, Melbourne 3010, Australia
*
Author to whom correspondence should be addressed.
ISPRS Int. J. Geo-Inf. 2019, 8(5), 233; https://doi.org/10.3390/ijgi8050233
Submission received: 27 April 2019
/
Revised: 13 May 2019
/
Accepted: 15 May 2019
/
Published: 19 May 2019
(This article belongs to the Special Issue Multidimensional and Multiscale GIS)
Abstract
:With the rise of urban population, updated spatial information of indoor environments is needed in a growing number of applications. Navigational assistance for disabled or aged people, guidance for robots, augmented reality for gaming, and tourism or training emergency assistance units are just a few examples of the emerging applications requiring real three-dimensional (3D) spatial data of indoor scenes. This work proposes the use of point clouds for obstacle-aware indoor pathfinding. Point clouds are firstly used for reconstructing semantically rich 3D models of building structural elements in order to extract initial navigational information. Potential obstacles to navigation are classified in the point cloud and directly used to correct the path according to the mobility skills of different users. The methodology is tested in several real case studies for wheelchair and ordinary users. Experiments show that, after several iterations, paths are readapted to avoid obstacles.
1. Introduction
Over the last few years, indoor navigation became a subject of research interest because people spend a considerable amount of their time in indoor spaces such as houses, office buildings, commercial centers, and transportation facilities, among others. According to the Environmental Protection Agency, people spend on the average 90% of their time indoors [1]. Furthermore, in 2008, the percentage of people living in cities surpassed those living in rural areas, and this trend is expected to continue; the United Nations estimates that 70% of the world’s population will be living in cities and towns by 2050 [2], where buildings and their large variety of associated spaces such as underground passages, sky bridges, garages, yards, etc. are becoming increasingly complex conglomerates of enclosed spaces [3].
Indoor navigation consists of finding the most suitable path connecting two positions within an indoor environment while avoiding collision with obstacles. Indoor navigation is related to the specific tasks of pathfinding and route-planning; while pathfinding deals with the detection of possible routes between two locations, route-planning is directed to optimization of the route given certain constraints [4].
One direct application of indoor pathfinding is the navigational assistance for blind or wheelchair people, where algorithms generate efficient paths according to their mobility restrictions [5]. Local authorities are increasingly being required to make accessibility diagnoses and to take corrective actions in public spaces for enabling navigation for disabled people [6]. Building crisis management, such as fire protection or planned terrorist attacks, is another application where planned paths can provide possible safe and efficient evacuation paths under different emergency conditions [7]. Other applications are related to augmented reality, very important for gaming, tourism purposes, or for training emergency assistance units such as fire brigades or military and police corps. Moreover, the guidance of robots and drones inside buildings constitutes an application of interest for the future, which is also of special interest in emergency situations.
Navigational information is extracted from geometric models representing as-built environments. Traditionally, two-dimensional (2D) drawings or building layouts were used as input. However, they usually contain 2D geometric information, while three-dimensional (3D) and semantic data are missing. Successful pathfinding for a 3D indoor environment depends on the accurate and updated geometry, semantics, and topology of building components and spaces [8]. Openings in buildings such as doors and windows, transition spaces such as staircases or corridors, and structural elements such as beams and columns are relevant for indoor planning specially in crisis management applications. The position and size of indoor obstacles are also of a great interest because they usually disturb the navigation process.
Building information models (BIMs) stand as a valuable source for facilitating navigation [9]. However, they are usually not up to date, thereby not representing the current state of buildings and their content.
Laser scanners are well established in the robotics and remote-sensing communities for collecting and analyzing three-dimensional data of the as-built status of large-scale infrastructures. Acquisition is fast and point clouds depict the reality with high quality. The raw data from the acquisition process need to be processed in order to extract the useful information for the purpose for which it is intended. Although intense efforts were made in the last few years for extracting geometric, semantic, and topological features from point clouds [10,11,12], as-built modeling is still an active research of interest.
Efforts are mainly aimed to reconstruct building components, spaces, and openings, while less attention is paid to obstacle detection. Indoor environments are often busy and cluttered with the presence of objects such as pieces of furniture that can act as obstacles in indoor pathfinding, affecting the safety of pedestrians. Although obstacle detection is fundamental for obstacle-aware indoor pathfinding, state-of-the-art research on indoor navigation does not usually deal with the obstacle issue, and routing algorithms mostly consider empty spaces [13].
The focus of this work is to develop an obstacle-aware indoor path-planning methodology based on 3D point clouds. Most indoor models in the literature ignore real architectural characteristics such as the number of doors, openings, and windows, as well as obstacles [14]. The contribution of this work is related to the perception and understanding the role of the as-built models of indoor environments in order to enable pathfinding according to the spatial restrictions of pedestrians. Point clouds are firstly used to reconstruct semantically rich 3D indoor models, which constitute the basis for network generation. Next, point clouds are directly used to update the network. The navigable space is extracted from the surfaces representing floors and doors, and initial paths are updated when obstacles are detected in the point cloud, and when they are considered to interrupt the navigation process.
This paper is organized as follows: Section 2 reviews related works and establishes their differences with respect to our work. Section 3 describes the proposed methodology. Section 4 reports the results obtained from applying the methodology to different case studies. Finally, Section 5 is devoted to concluding this work.
2. Related Work
Several reviews were presented in the last few years with regard to as-built modeling from point clouds [11,12,15]. Most of the works addressed, with great success, the reconstruction of structural building components [16,17,18] and openings [19,20,21,22], while less attention was paid to the accurate modeling of floor elements, to the modeling of the free space, and to the modeling of obstacles, although they are essential for indoor path finding.
The detailed modeling of floor elements was recently addressed by several works. The combined use of point clouds and mobile laser scanner trajectories was used to segment and classify floors into stairs, ramps, and flat surfaces in indoor environments [23,24]. The procedure is based on the angle formed by trajectory with regard to a horizontal plane, followed by a projection in the point cloud discretized into a voxel-based model and a region growing. The trajectory path was also used outdoors to detect road regions and thereby classify ground elements into curbs, sidewalks, ramps, and stairs from geometrical and topological features [25,26].
Trajectory is a valuable source of information also in terms of modeling the free space. It can be assumed that trajectory depicts the path followed by the system during the acquisition process. This fact is exploited in indoor modeling for detecting open doors, which are the transition elements between two adjacent spaces [26,27]. In Reference [26], after door detection, the timestamp correspondence between trajectory and point cloud was used to subdivide the raw point cloud into connected rooms by implementing an energy-minimization function. Subdivided spaces were next submitted to a surface-based modeling approach. Trajectory was also used by Reference [27] to label doors, floors, walls, and ceilings in indoor spaces. This work was extended in Reference [28], in which the indoor space was subdivided by implementing morphological operations and connected components.
In terms of indoor navigation, a methodology extracting topological relationships between the spaces of an 3D indoor environment modeled from point clouds was recently presented by References [18,29]. Although these works solved, with great success, the modeling of indoor structures and the extraction of topological relationships between them, obstacles were not taken into account. Another very interesting work is the one presented by Reference [30], in which indoor geographic information system (GIS) maps were used to create a topological navigation graph to perform path-planning for wheelchair users. Also, in this paper, obstacles were not considered.
Most of previous works on indoor navigation considering obstacles were mostly 2D approaches. A skeleton-abstraction algorithm which generates a graph of intervisible locations was proposed by Reference [31]. Each node in the graph represents a point location, and each edge represents a visible connection between them. The proposal considered the presence of obstacles but as a set of 2D points, for example, from computer-aided design (CAD) files or 2D floorplans. Also, considering the 2D representation of indoor environments, a formal definition of an indoor routing graph was presented by Reference [32], in which the presence of obstacles inside rooms was manually represented in the indoor network by adding nodes around the obstacles. A data model to support pathfinding for vehicles among moving obstacles in forest fires was implemented in Reference [33]. Static obstacles such as trees and buildings, and dynamic simulated obstacles such as the spread of fire were considered in the pathfinding. The GIS-based simulation was tested in a case study, in which the geometric model, composed by the terrain, road network, trees, and buildings, was obtained from OpenStreetMap, and the fire spread was the obstacle represented by moving polygons crossing the network. Mortari et al. [14] presented a network-generation strategy taking into account obstacles in indoor scenes. The approach was based on predefined models, where obstacles were represented as 2D geometry in the floor plane. The result was a 3D network because 2D floor plans were abstracted at different height levels. Xiong et al. [8] introduced a method that supports 3D indoor path-planning from semantic 3D models represented in LoD4 CityGML. Although the method considered obstacles, experiments for testing the method were carried out with models without the presence of obstacles. Lui et al. [34] developed a methodology for real indoor navigation based on grid models, which were obtained from 2D floor plans where obstacles were predefined. Rodenberg [35] proposed a methodology for indoor pathfinding based on an octree representation of indoor point clouds. The A* pathfinding algorithm, based on using heuristics to guide the search, was conducted through empty nodes and, consequently, obstacles were avoided. Li et al. [36] also recently presented a path-planning method for drones indoors based on occupancy voxel maps, and on which the navigable space was composed of the empty voxels.
In this paper, the methodology is based on the use of point clouds which have the capability to depict the real state of the indoor scene. Point clouds are not only the basis for reconstructing permanent building elements such as envelope or openings, but they are also directly detected from point clouds, enabling obstacle-aware indoor pathfinding. Preliminary experiments on indoor pathfinding from point clouds considering obstacles are presented in Reference [37].
3. Methodology
The methodology starts with the reconstruction of a simple surface-based indoor model including openings. Point cloud regions not belonging to permanent building elements, and consequently belonging to elements such as furniture are used for obstacle detection. Indoor paths are initially generated from the 3D building model, and the original point cloud is used to check if obstacles intersect with the indoor path. If obstacles exist, the indoor path is readapted until no obstacles are detected, enabling accurate pathfinding. The methodology is organized in terms of building reconstruction (Section 3.1), obstacle detection (Section 3.2), and indoor path-planning (Section 3.3).
3.1. Building Reconstruction
This section includes the steps implemented to generate simple 3D models, enriched with semantics and topology, which are the basis of the indoor pathfinding algorithm. Building envelope elements, including floors, ceilings, and walls, are modeled using a data-driven approach (Section 3.1.1), while openings, i.e., windows and doors, are extracted with a model-driven approach based on the generalized Hough transform (Section 3.1.2). The geometry of these building elements is represented according to a gbXML schema (Section 3.1.3), because it can be directly used for extracting the initial navigable network.
3.1.1. Envelope Reconstruction
The first step of the methodology aims to parameterize the building envelope including ceilings, floors, and walls, as well as to isolate points belonging to indoor elements such as furniture, columns, plants, and other objects that can behave as obstacles to navigation (Figure 1).
The point cloud is segmented into planar regions by implementing a region-growing algorithm. The algorithm includes in the region all those points satisfying two geometric conditions: planarity and surface smoothness. In this process, thresholds are coarse enough to ensure that window and door elements are included in the region of the wall where they are contained.
Hereafter, regions are labeled by simple geometric and topologic hierarchical classification into four classes: ceilings, floors, walls, and obstacles. Floors and ceilings are the lower and the higher horizontal regions, respectively. Walls are those vertical regions adjacent and perpendicular to floors and ceilings. Obstacles are the remaining regions, that is, all regions not satisfying the conditions to be floors, ceilings, and walls. The first three are intersected with one another in order to obtain the boundary points defining envelope elements. The last class consists of the remaining regions of an indoor scene such as those belonging to furniture. Although columns are structural elements, they are also considered as obstacles for navigation purposes if they are inside the space enclosed by envelope elements. Points belonging to this class are considered as obstacle candidates and used in the following steps for obstacle detection and routing correction (Section 3.2 and Section 3.3).
3.1.2. Detection of Openings
As in Reference [20], windows and doors are modeled by finding parametrized rectangular shapes in images based on the generalized Hough transform (GHT) (Figure 2). In comparison with Reference [37], in which closed doors were extracted from color images, in this work, no color information is surveyed, and the reconstruction of openings is based on the detection of holes in wall regions.
To ensure a successful rasterization, wall regions are rotated around the Z-axis in a way that they become parallel to the XZ or YZ plane, as appropriate [38].
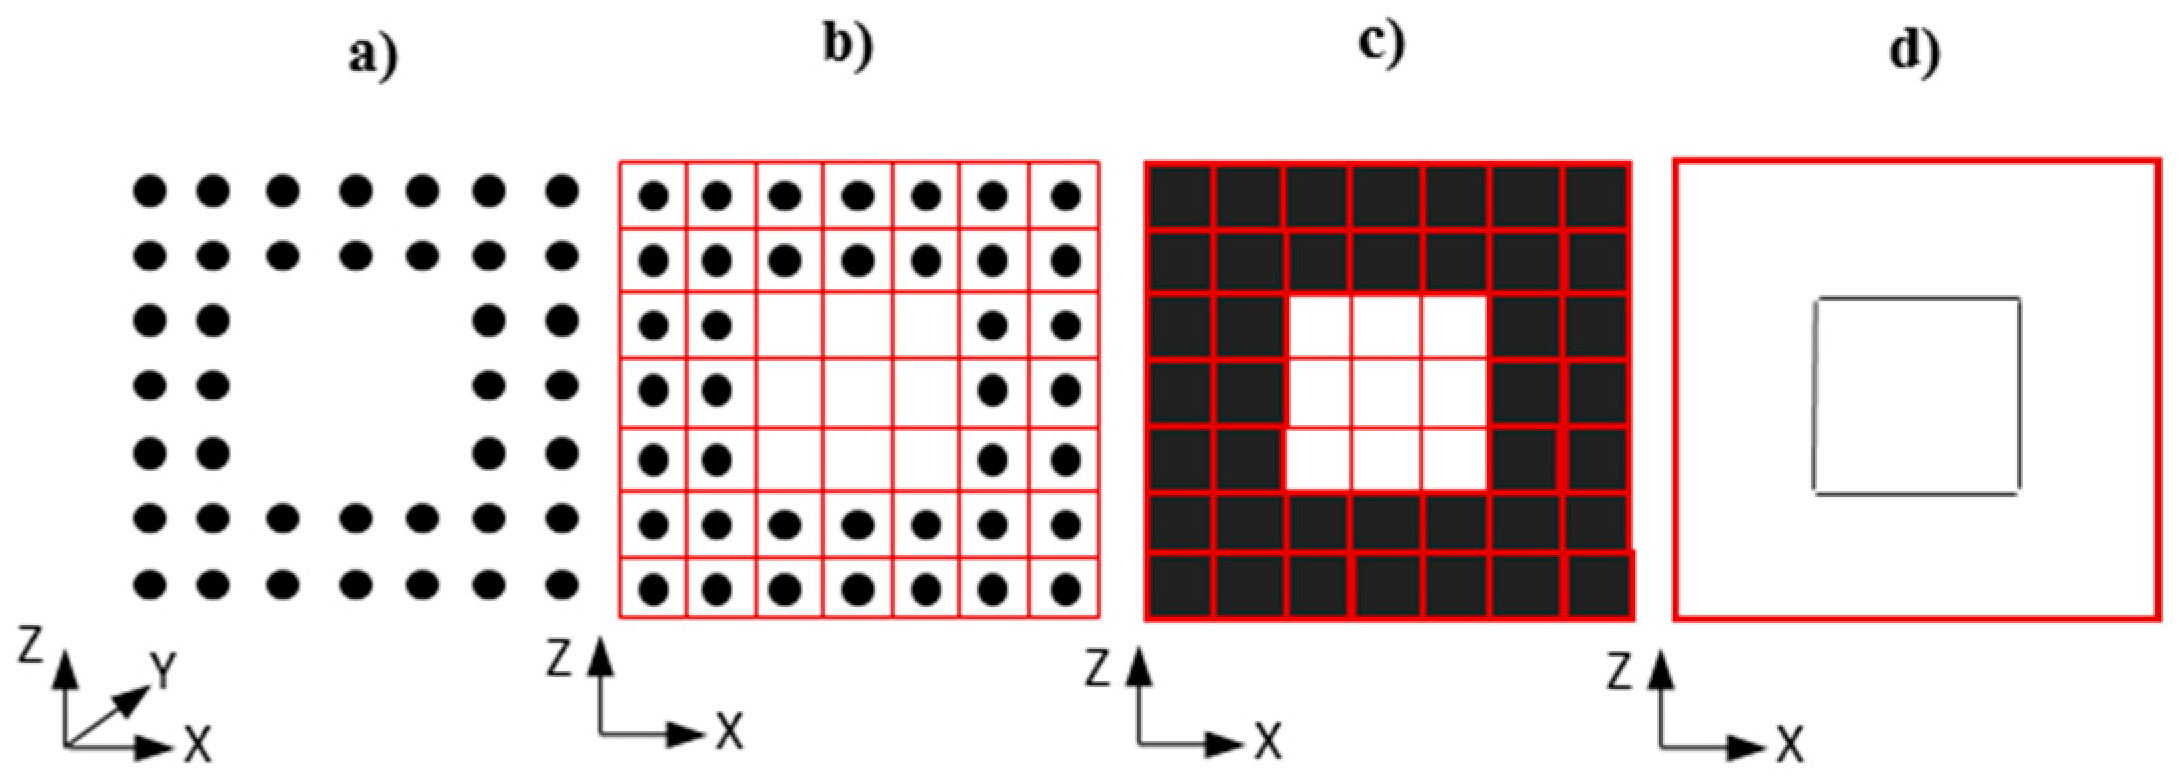
For each wall, the associated planar region (Figure 3a) is converted to a raster by projecting the points on the wall plane defined by its boundary points (Figure 3b). For this purpose, a rectangular matrix is created, and pixels are assigned a value of either one or zero depending on whether or not any points fall inside the pixel (Figure 3c). The binarized raster is submitted to a median filter to reduce salt-and-pepper noise. Finally, edge detection is performed using the Canny method, which finds edges by looking for local maxima of the gradient of the image (Figure 3d).
Edge images are the input of the GHT. Rectangles are found and detection is enforced taking into account a minimum and maximum width and length. As openings are assumed as holes in the wall region, they can be confused with holes caused by the presence of other objects with similar size and shape such as cupboards, bookshelves, etc. In this case, candidates could be pruned by analyzing the original 3D point cloud through histograms point-to-plane as in Reference [39], in which the number and position of the peaks with regard to the wall plane made possible the classification of candidates in closed doors, open doors, or furniture. Alternatively, door candidates can be verified as doors if they are detected from two adjacent indoor spaces. If the trajectory followed by the system during acquisition is available, it can also be used for door verification.
3.1.3. Model Generation
Features extracted from the previous steps are organized into an explicit format. Although other schemas such as cityGML, indoorGML, and IFC are more complete, we consider gbXML as a suitable model since detailed geometry is simplified, enabling the preservation of the essential relationships between rooms and indoor passes. The gbXML model represents buildings with their geometry, semantics, topology, and appearance. Even though the schema was developed to support energy analysis, semantic contents such as constructive materials make it appropriate for other applications such as emergency routing in a fire crisis, etc. Spaces are represented as enclosed units defined by building envelope components, and their geometry is simplified, since building components are represented as surfaces delimited by their boundary points, which are defined by Cartesian coordinates (x, y, z). Consequently, building elements such as walls have no thickness. Openings are included in the walls where they are contained, and they are also represented by their boundary points. Several works already support the use of gbXML for route-planning in emergency response applications [7,40].
3.2. Obstacle Detection
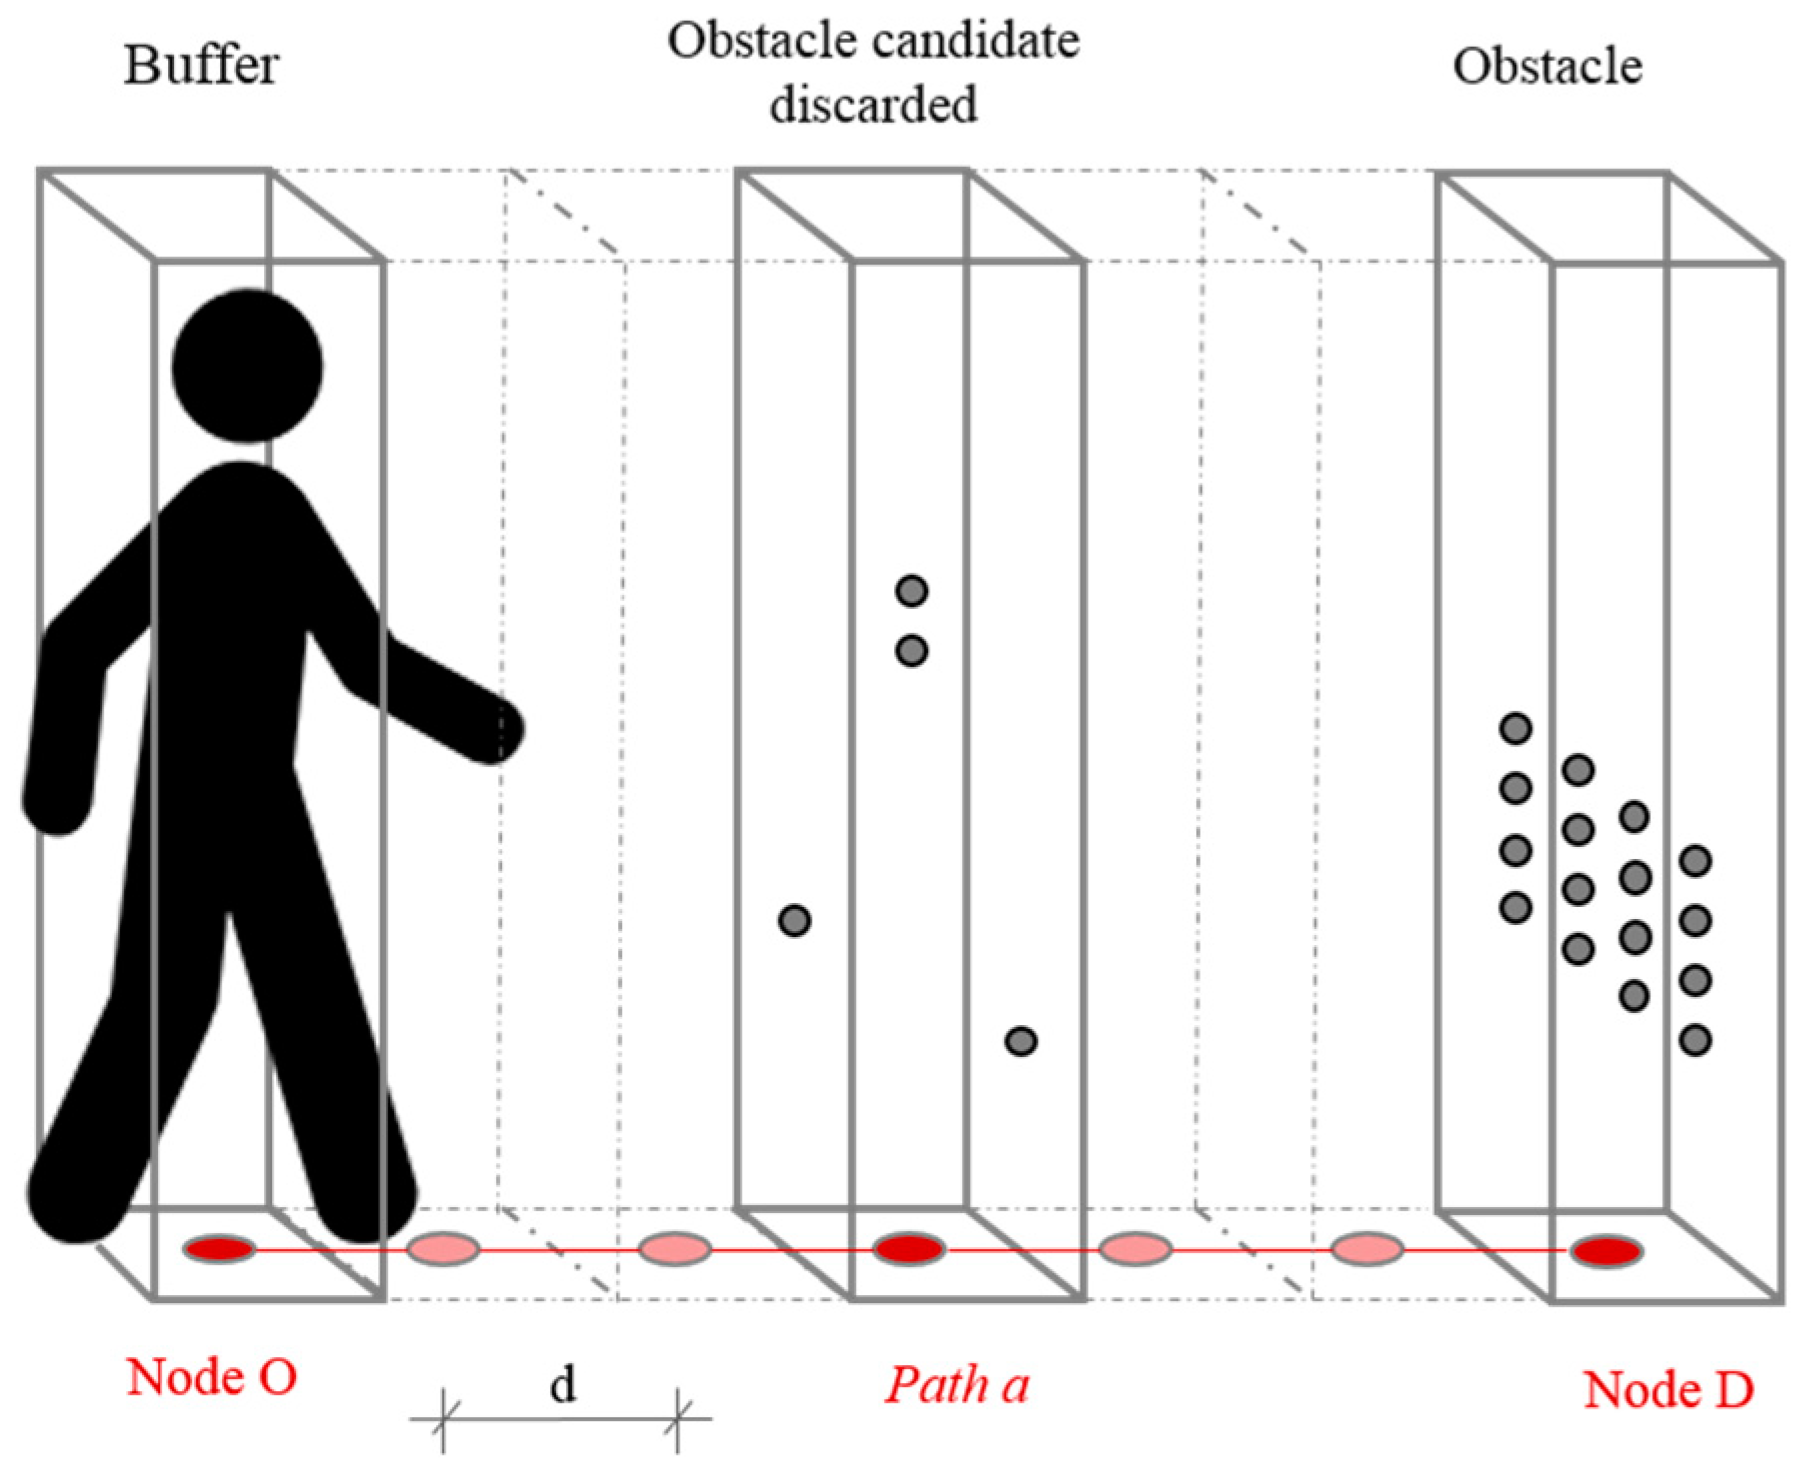
In this approach, an obstacle is defined as the presence of a set of 3D points interrupting the navigation between two nodes. The existence of obstacles is analyzed by checking if there are points inside the volume of a buffer representing a person (Figure 4). A rectangular prism is selected as the buffer shape. The buffer size varies upon considering the user as a walking person or a person on wheelchair.
The algorithm moves the buffer along the path (from Node O (origin) to Node D (destination)) considering a step (d) equal or inferior to the buffer depth to ensure that the whole path is analyzed. For each step, the algorithm checks if there are points of the obstacle class inside the buffer. In case a set of points is detected, it is analyzed to determine if the obstacle candidate is a true of false obstacle for indoor navigation. For instance, we consider a piece of furniture as a real obstacle in contrast to plant leaves or spurious points.
Size and aggregation are the features considered for evaluating obstacle candidates. Size is measured as the number of points, and it is related to the obstacle size. Aggregation is measured as the median of the Euclidean distance from each point to the closest point, and it is related to obstacle consistence. An obstacle is considered a true positive if it has a size greater than a size threshold and an aggregation less than an aggregation threshold.
Since both features depend on the point cloud density, the thresholds are also a function of it. In this way, the average point spacing of the entire dataset plus a 10% safety margin, and the number of points in an area equal to 10% of the buffer section are the thresholds for aggregation and size, respectively. In both cases, the parameters are selected with respect to empirical knowledge. They are tested to be appropriate for distinguishing real obstacles from spurious points or other small objects not impeding the navigation.
3.3. Indoor Pathfinding
The gbXML model introduced in Section 3.1.3 is used for the construction of a navigable model, which consists of a logical model including all indoor spaces and navigable networks for individual spaces [20]. The logical model is a graph reflecting the building topology, where graph nodes represent individual spaces, and links represent spatial relations among adjacent spaces. The navigable network is generated based on the Voronoi diagram with initial nucleation nodes located at the doors and concave corners, while additional nodes are added later in order to densify the network. Links allowed for navigation have a distance attribute used for the shortest pathfinding. The gbXML model conceives building elements as surfaces and, consequently, in a correct representation according to the schema, walls would have no thickness. In case of a building representation in which doors are represented by two surfaces or by a prism, the condition for the initial network generation would be a one-to-one representation for doors.
Dijkstra’s algorithm is used in this research to find the shortest path [41]. It computes a path between start and goal nodes by searching for the minimal travel cost based on distance attributes. Because the algorithm expands by means of analyzing all neighbors, the speed of the algorithm depends on the size of the network and the distance between the start and goal node. Therefore, it can be replaced with any pathfinding algorithm to improve the computational efficiency, such as the widely used A* [42].
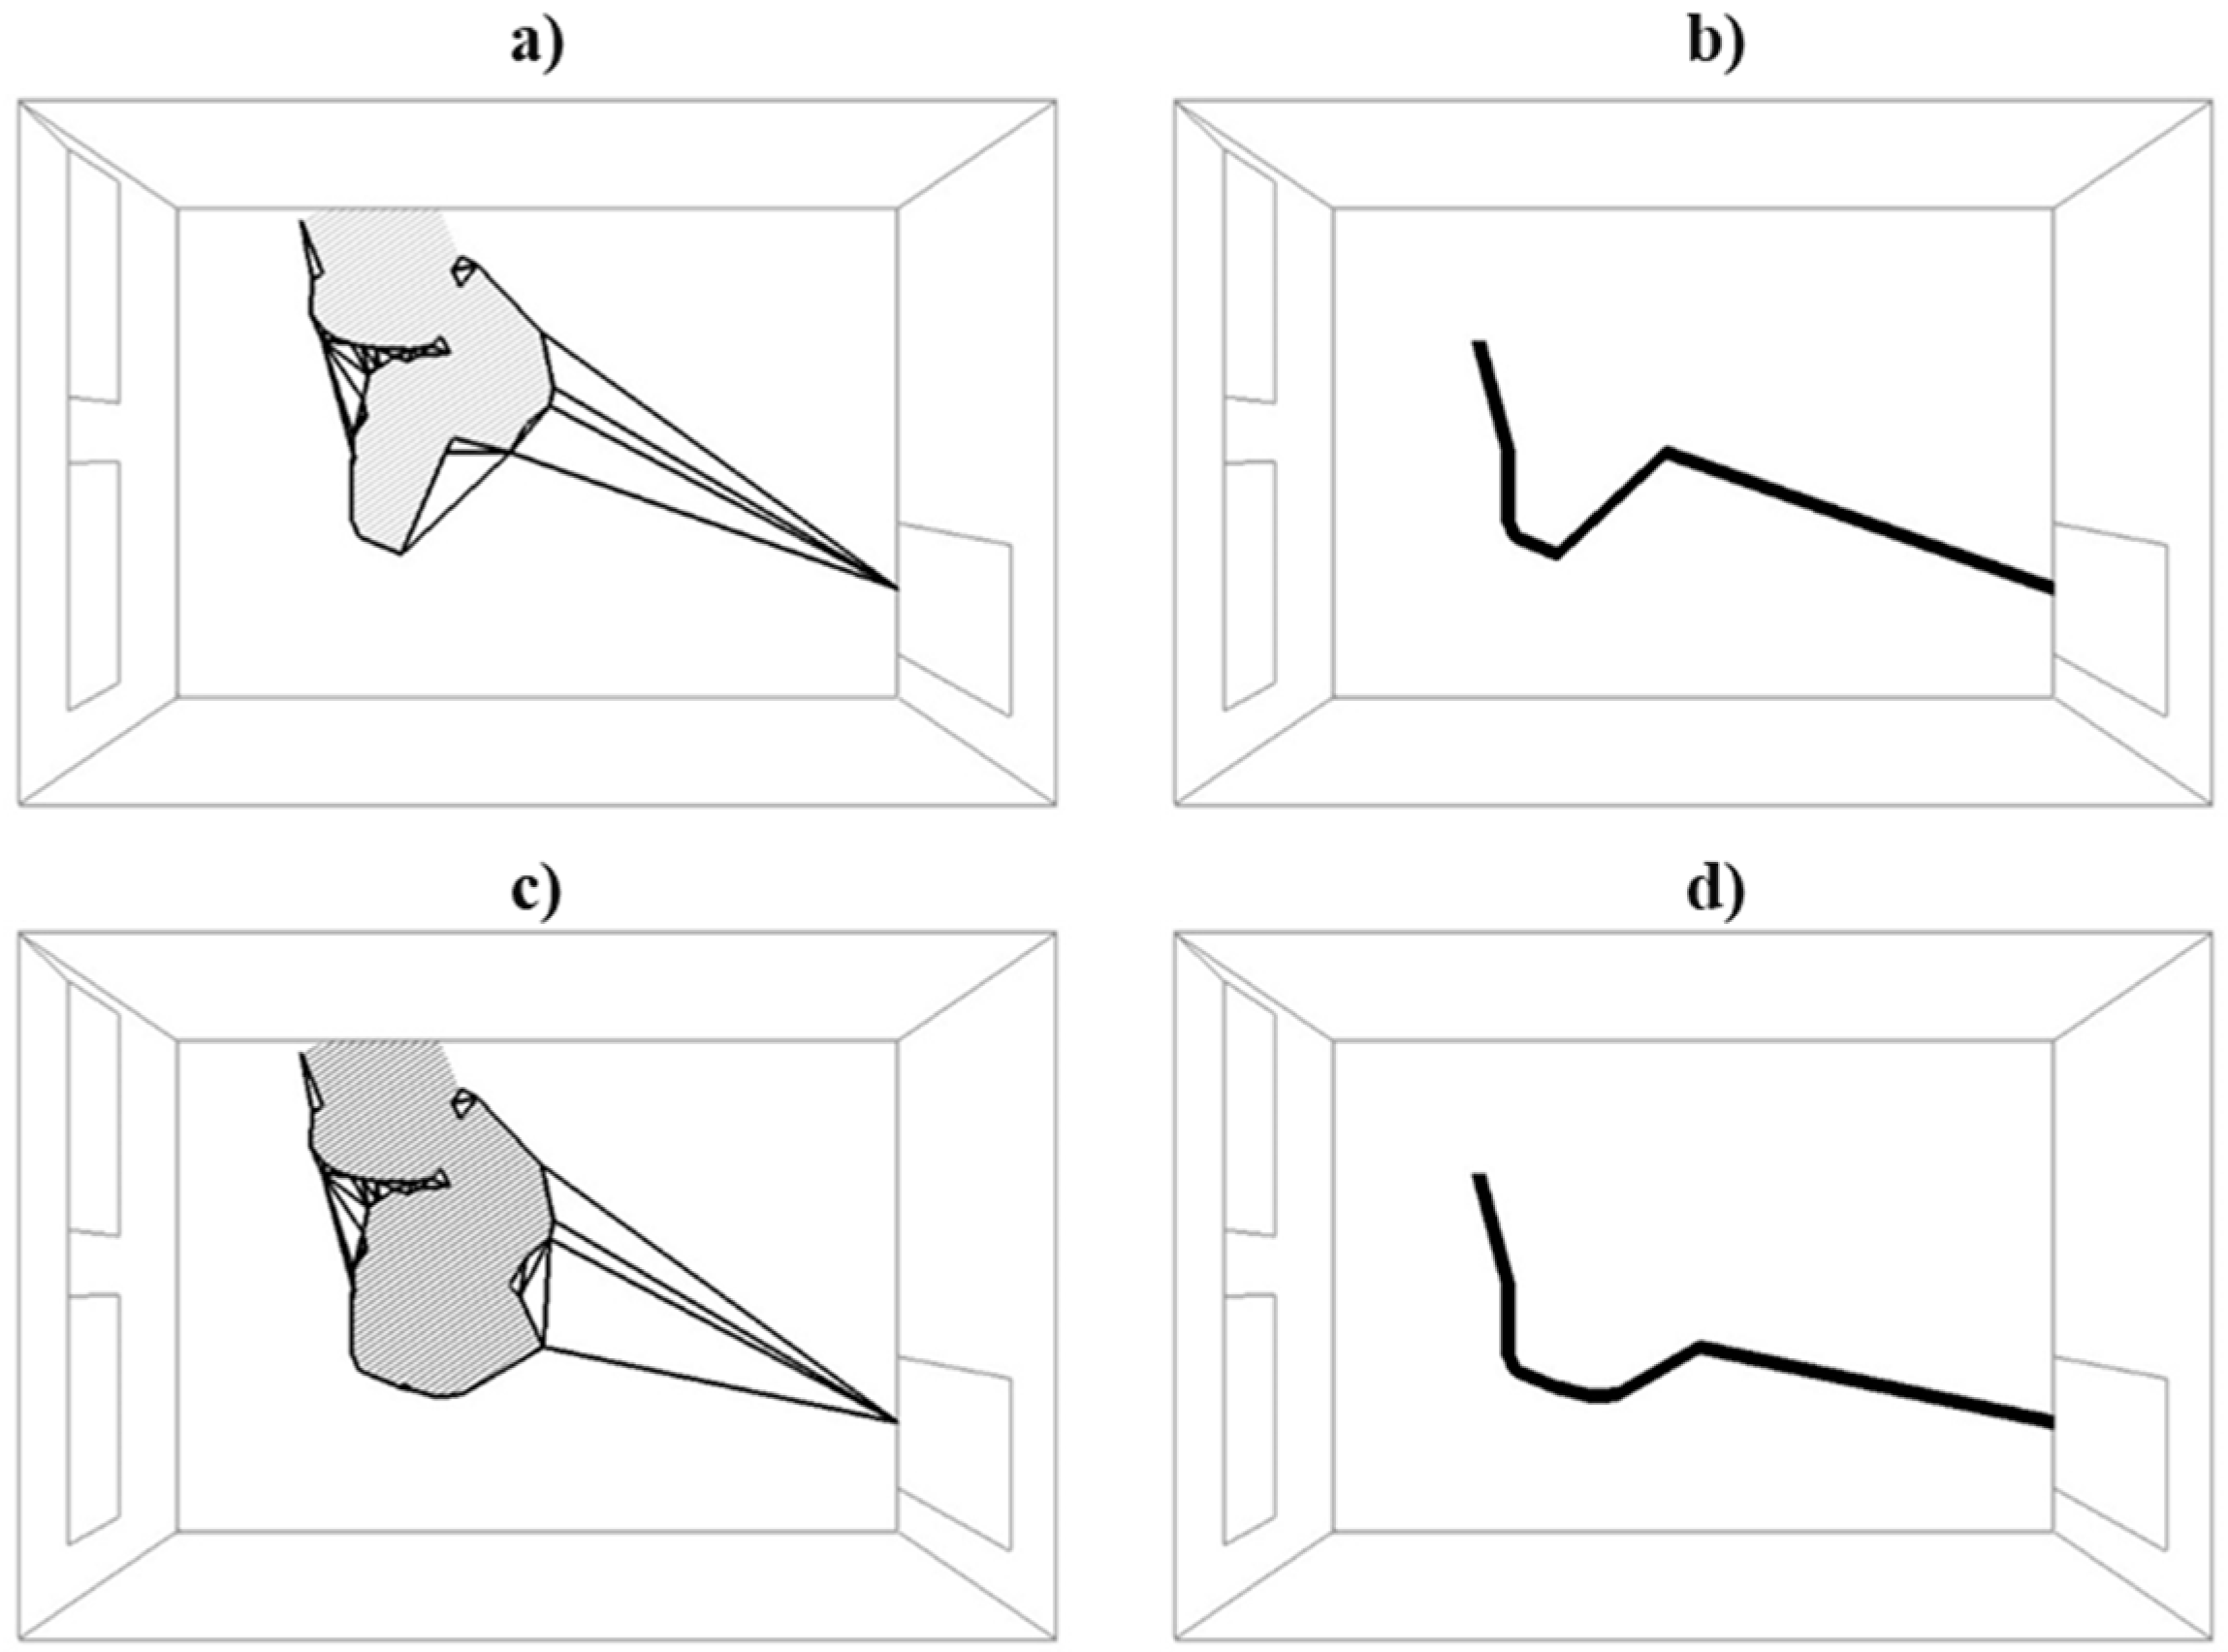
Because the initial model does not include information about indoor objects, such as furniture or installations, the resulting paths are only a rough approximation of the real situation and may not be precise enough for applications like robot navigation. However, the paths are updated locally when obstacle objects are added to the navigable model. A polygon identifying an area of obstacle points detected by the buffer described in Section 3.2 triggers modification of the navigable network. A new obstacle area is calculated and added to the network. In order to reduce the number of points added to the network, the obstacle polygon is processed as follows: (a) a convex hull is calculated; (b) consecutive collinear points and edges shorter than a minimum edge length threshold are removed as they do not change the shape of the polygon; and (c) in order to avoid collision detection with the same obstacle points in the next iteration of the algorithm, the polygon is expanded by the half of the buffer depth size (d/2). The obtained polygon is added to the obstacle area defined in the previous iteration. Points belonging to the final polygon are then used to update the navigable network. Links between network nodes, which are within the obstacle area, are excluded from navigation.
In theory, introduction of a new obstacle area to the network (see Figure 5a,c) should result in paths which are longer than those obtained in a previous iteration, as it is necessary to go around a detected obstacle object. However, in some cases, consecutive paths get shorter. For instance, the length of the shortest path shown in Figure 5b is 5.42 m, while the path length obtained after adding a new obstacle polygon to the network is 5.14 m (see Figure 5d). This is related to the location of network nodes and navigable network generation method. The method may be improved by introduction of additional nodes in areas not covered by the network; random or regular distribution may be considered. However, it is out of the scope of this research.
The presented network is a discrete model and, thus, calculated paths are an approximation of real paths. It was shown that the method used in this research produces better accuracy of the route length in comparison to prevailing approaches [40].
4. Discussion
The methodology was applied to several real case studies and experiments were carried out both for walking persons and for persons on a wheelchair. Section 4.1 introduces the instruments and data used, while Section 4.2 presents the results.
4.1. Instruments and Data
4.1.1. Case Studies
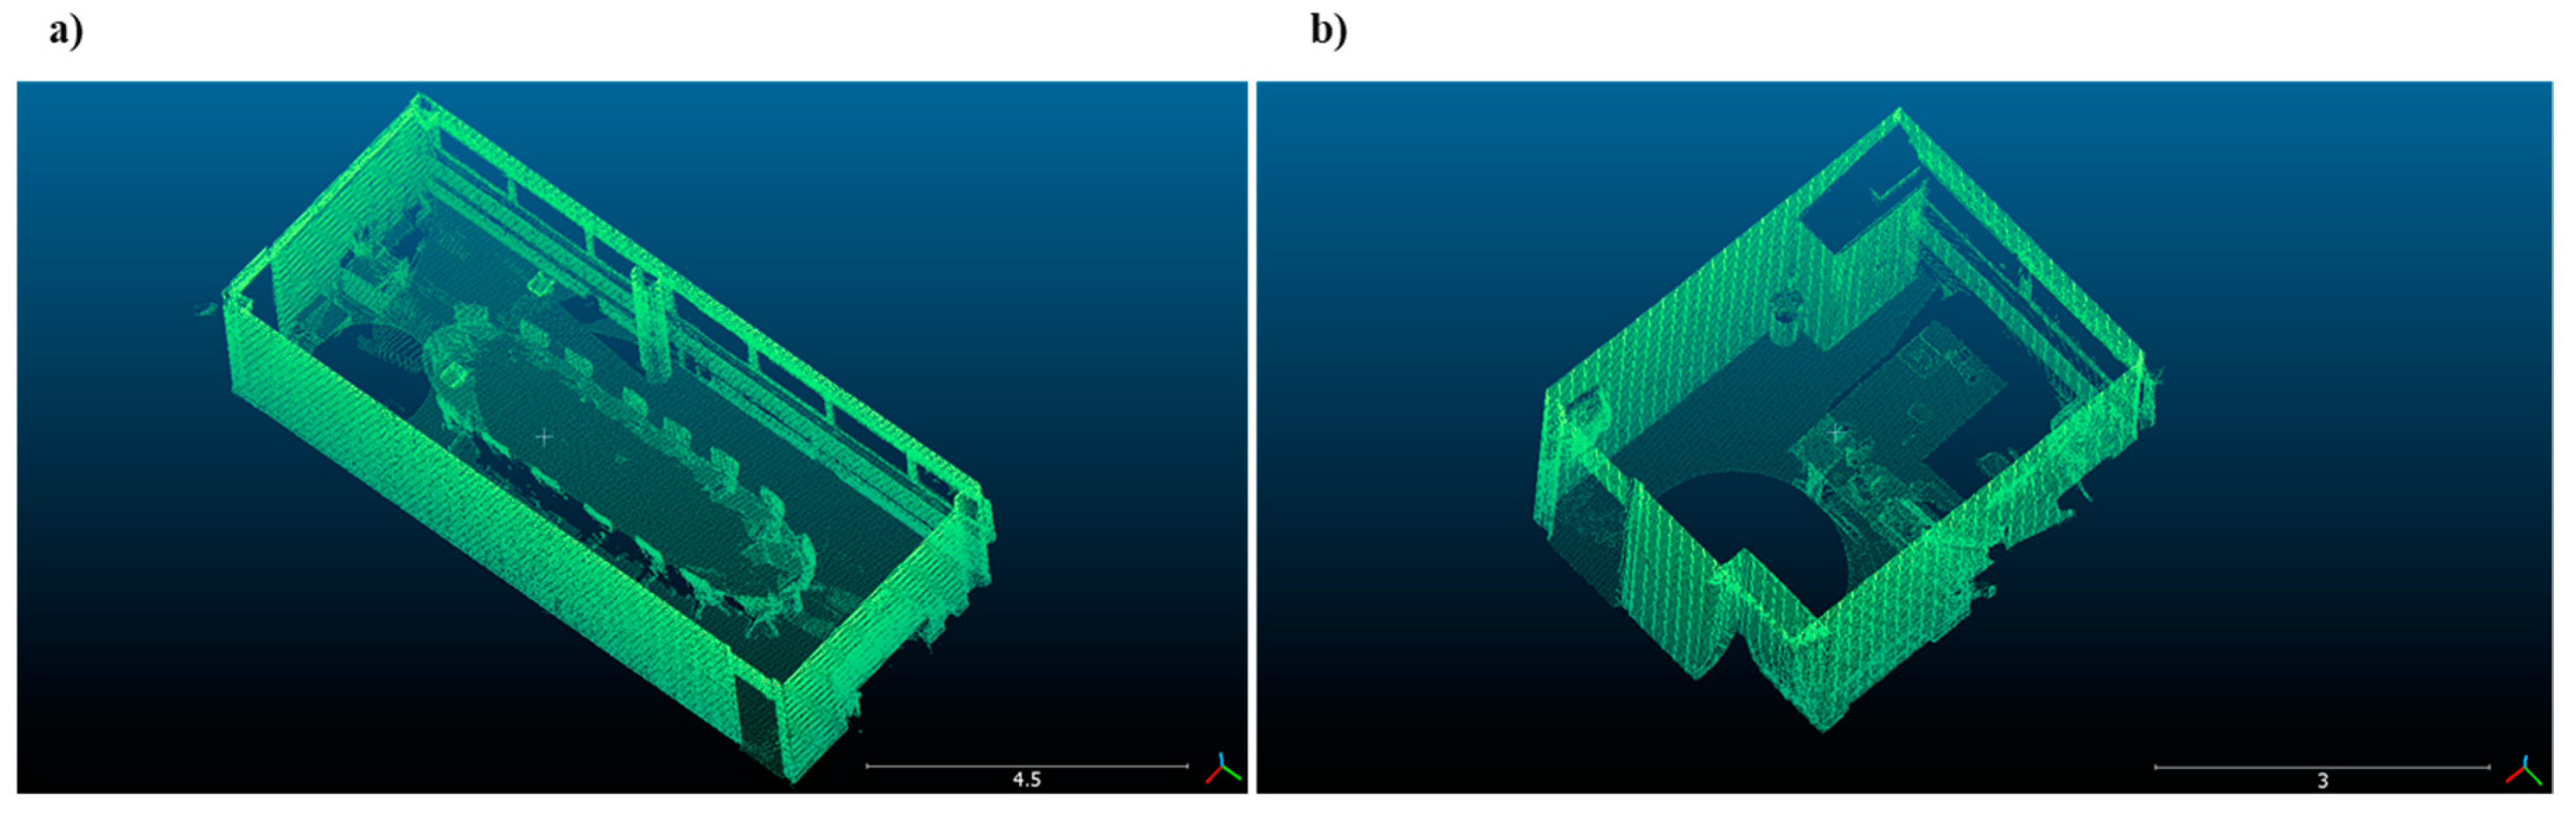
Several case studies with different levels of complexity were tested. Figure 6 shows two individual rooms. The first one is a videoconference room in an academic building. It was chosen because it has two doors, seven windows, and a big conference table in the middle of the indoor space (Figure 6a). The second one is an office space inside the same academic building. In this case, one door and two windows are present inside the space, as well as two cupboards and one table (Figure 6b).
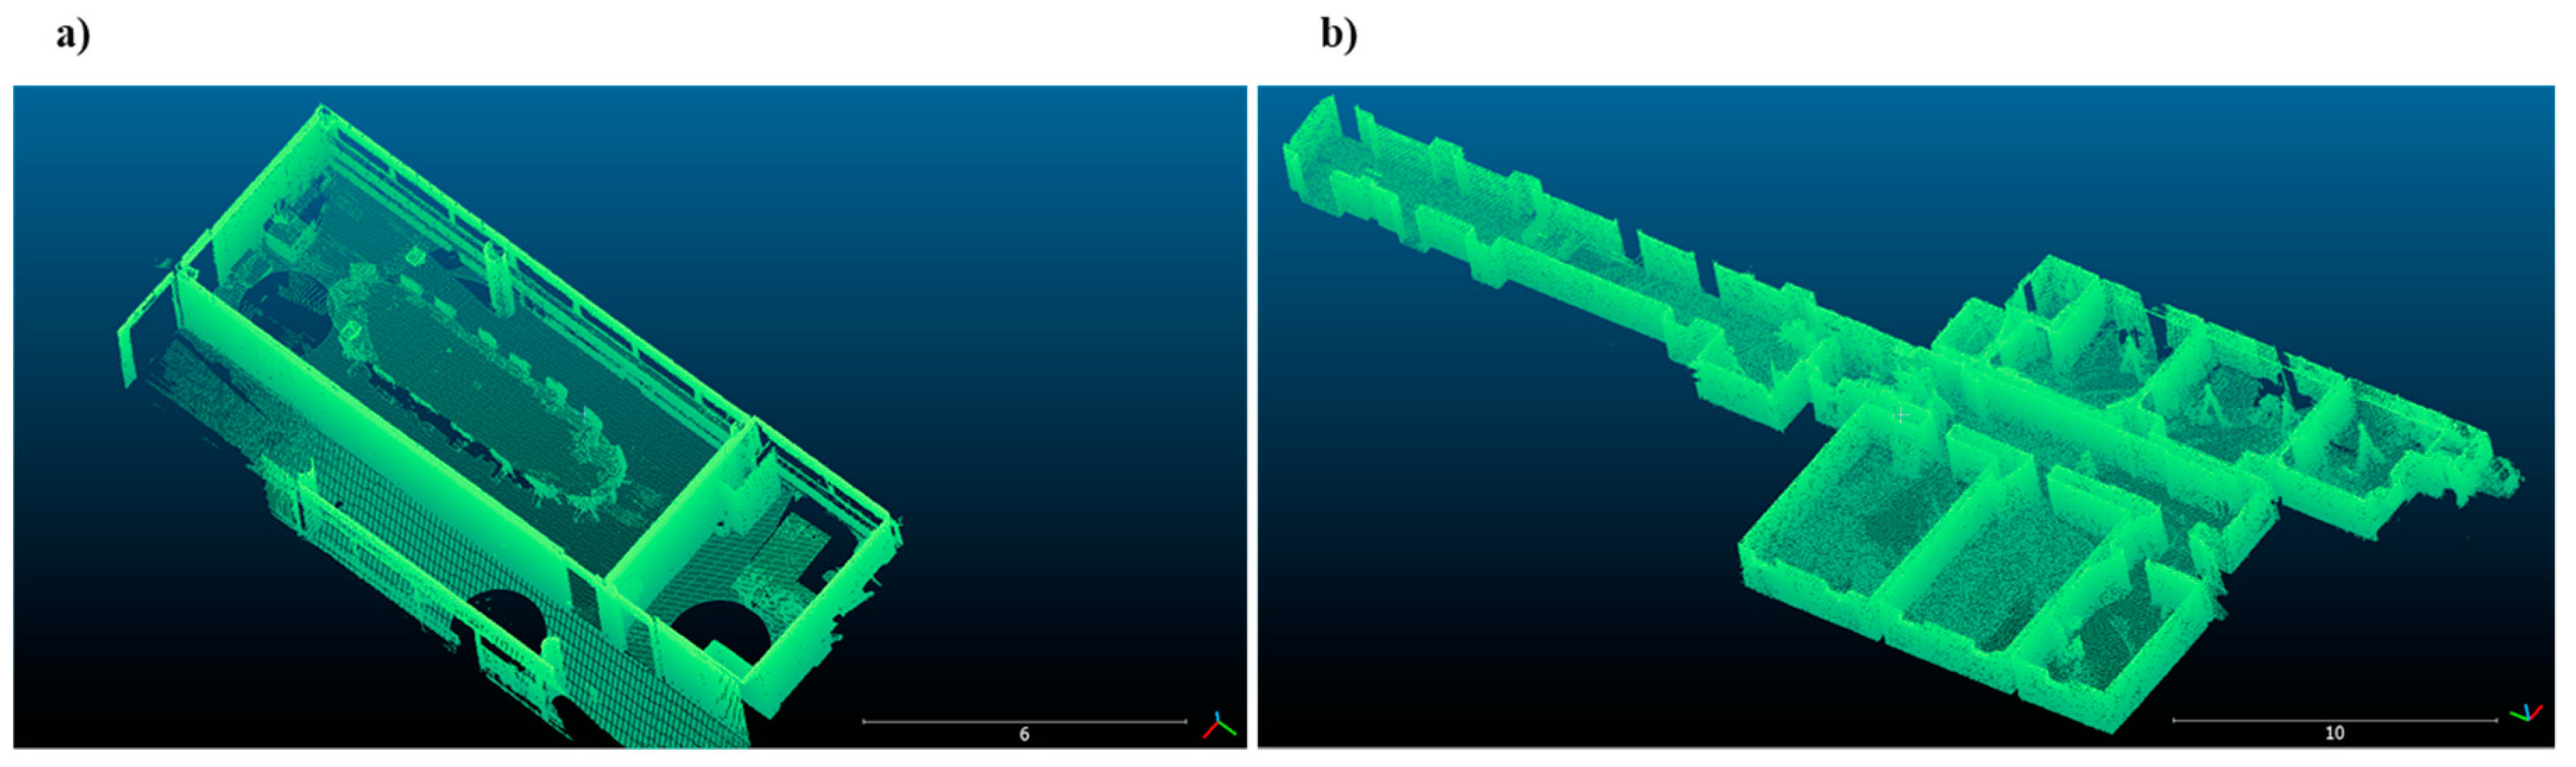
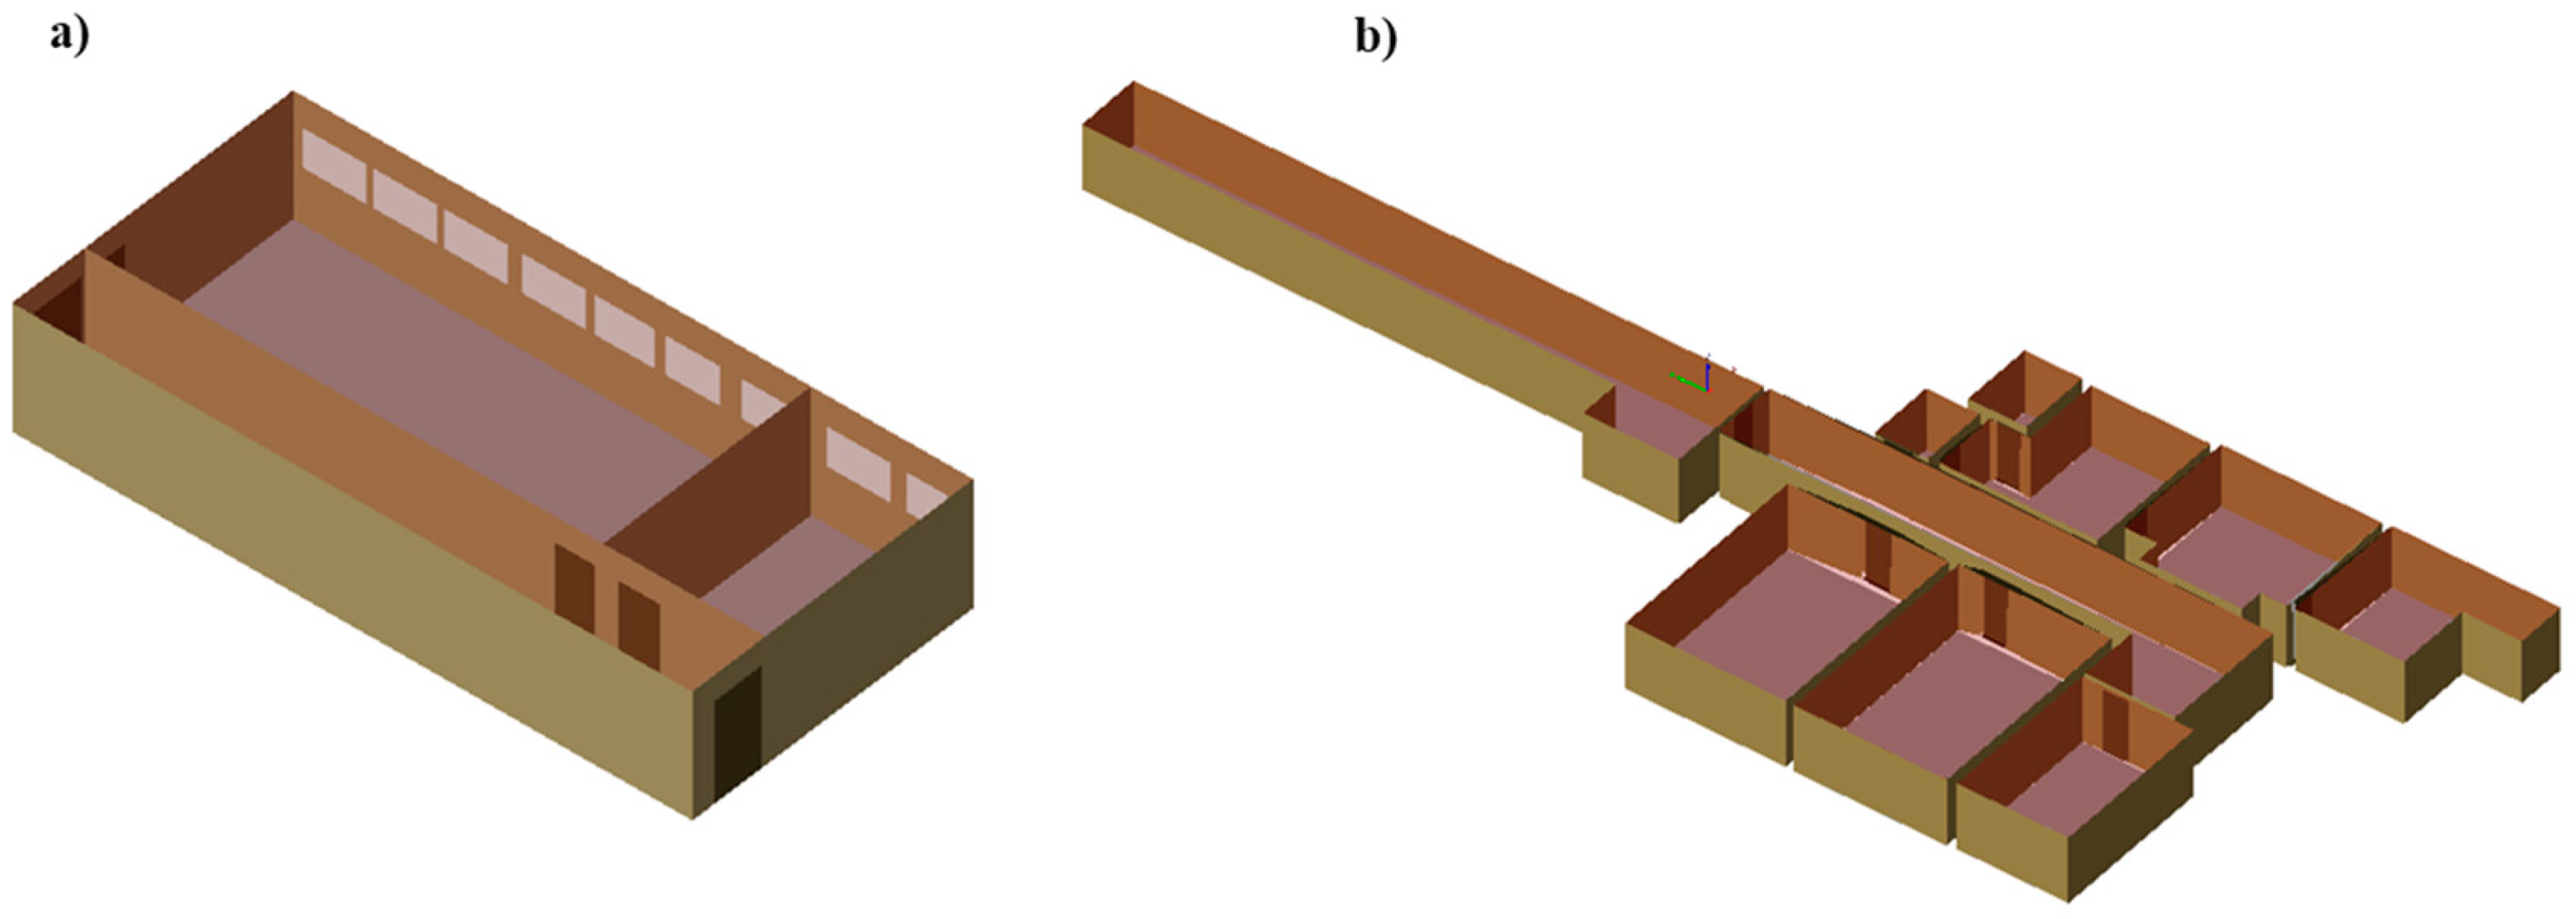
The third and fourth scenarios were composed of several rooms. Case study 3 was composed of the two previous scenes together with a corridor linking them (Figure 7a). Case study 4 comprised eight rooms and two corridors (Figure 7b). Case study 4 was provided by the ISPRS -International Society for Photogrammetry and Remote Sensing- Benchmark on Indoor Modeling [43].
4.1.2. Instruments and Data
The survey of case studies 1, 2, and 3 was carried out with a terrestrial laser scanner FARO Focus3D X 330, while case study 4 was acquired with an indoor mobile mapping system Viametris iMS3D [43]. The technical characteristics of the laser devices are summarized in Table 1.
Most processes are data-driven and, consequently, they are highly influenced by point cloud quality, especially in terms of completeness. This means that acquisition has to be performed such that the whole scene, and in particular the obstacles are covered. The coverage of the complete scene is relatively easy when data are acquired with an indoor mobile mapping system such as in case study 4; however, acquisition has to be carefully planned when a terrestrial laser scanner is used such as in case studies 1, 2, and 3. On the other hand, openings are detected as holes in the methodology. Therefore, they should be open during the acquisition process.
Point clouds from the same building were registered into the same coordinate system. Thus, datasets of case studies 1, 2, and 3 were registered by manually selecting at least four control points between point clouds and minimizing the sum of squared distances among all point pairs, followed by a fine registration performed based on the Iterative Closest Point (ICP) method [37]. The point cloud of case study 4 was already registered due to the intrinsic acquisition process based on Simultaneous Localization And Mapping (SLAM). In the latter, the point cloud was manually subdivided into rooms. All point clouds were filtered using a 0.03-m octree (for X-, Y-, and Z-directions) to reduce the number of points and to ensure uniform density.
4.2. Building Indoor Models
As explained in Section 3.1.1, the first step in building indoor reconstruction consisted of segmenting the point cloud into planar regions and classifying them into four classes: walls, floors, ceilings, and obstacles. It should be noted that each room was processed individually and, consequently, the point cloud of case study 4 was manually segmented into 10 subsets correspondent to the 10 rooms. The methodology was implemented in Matlab software.
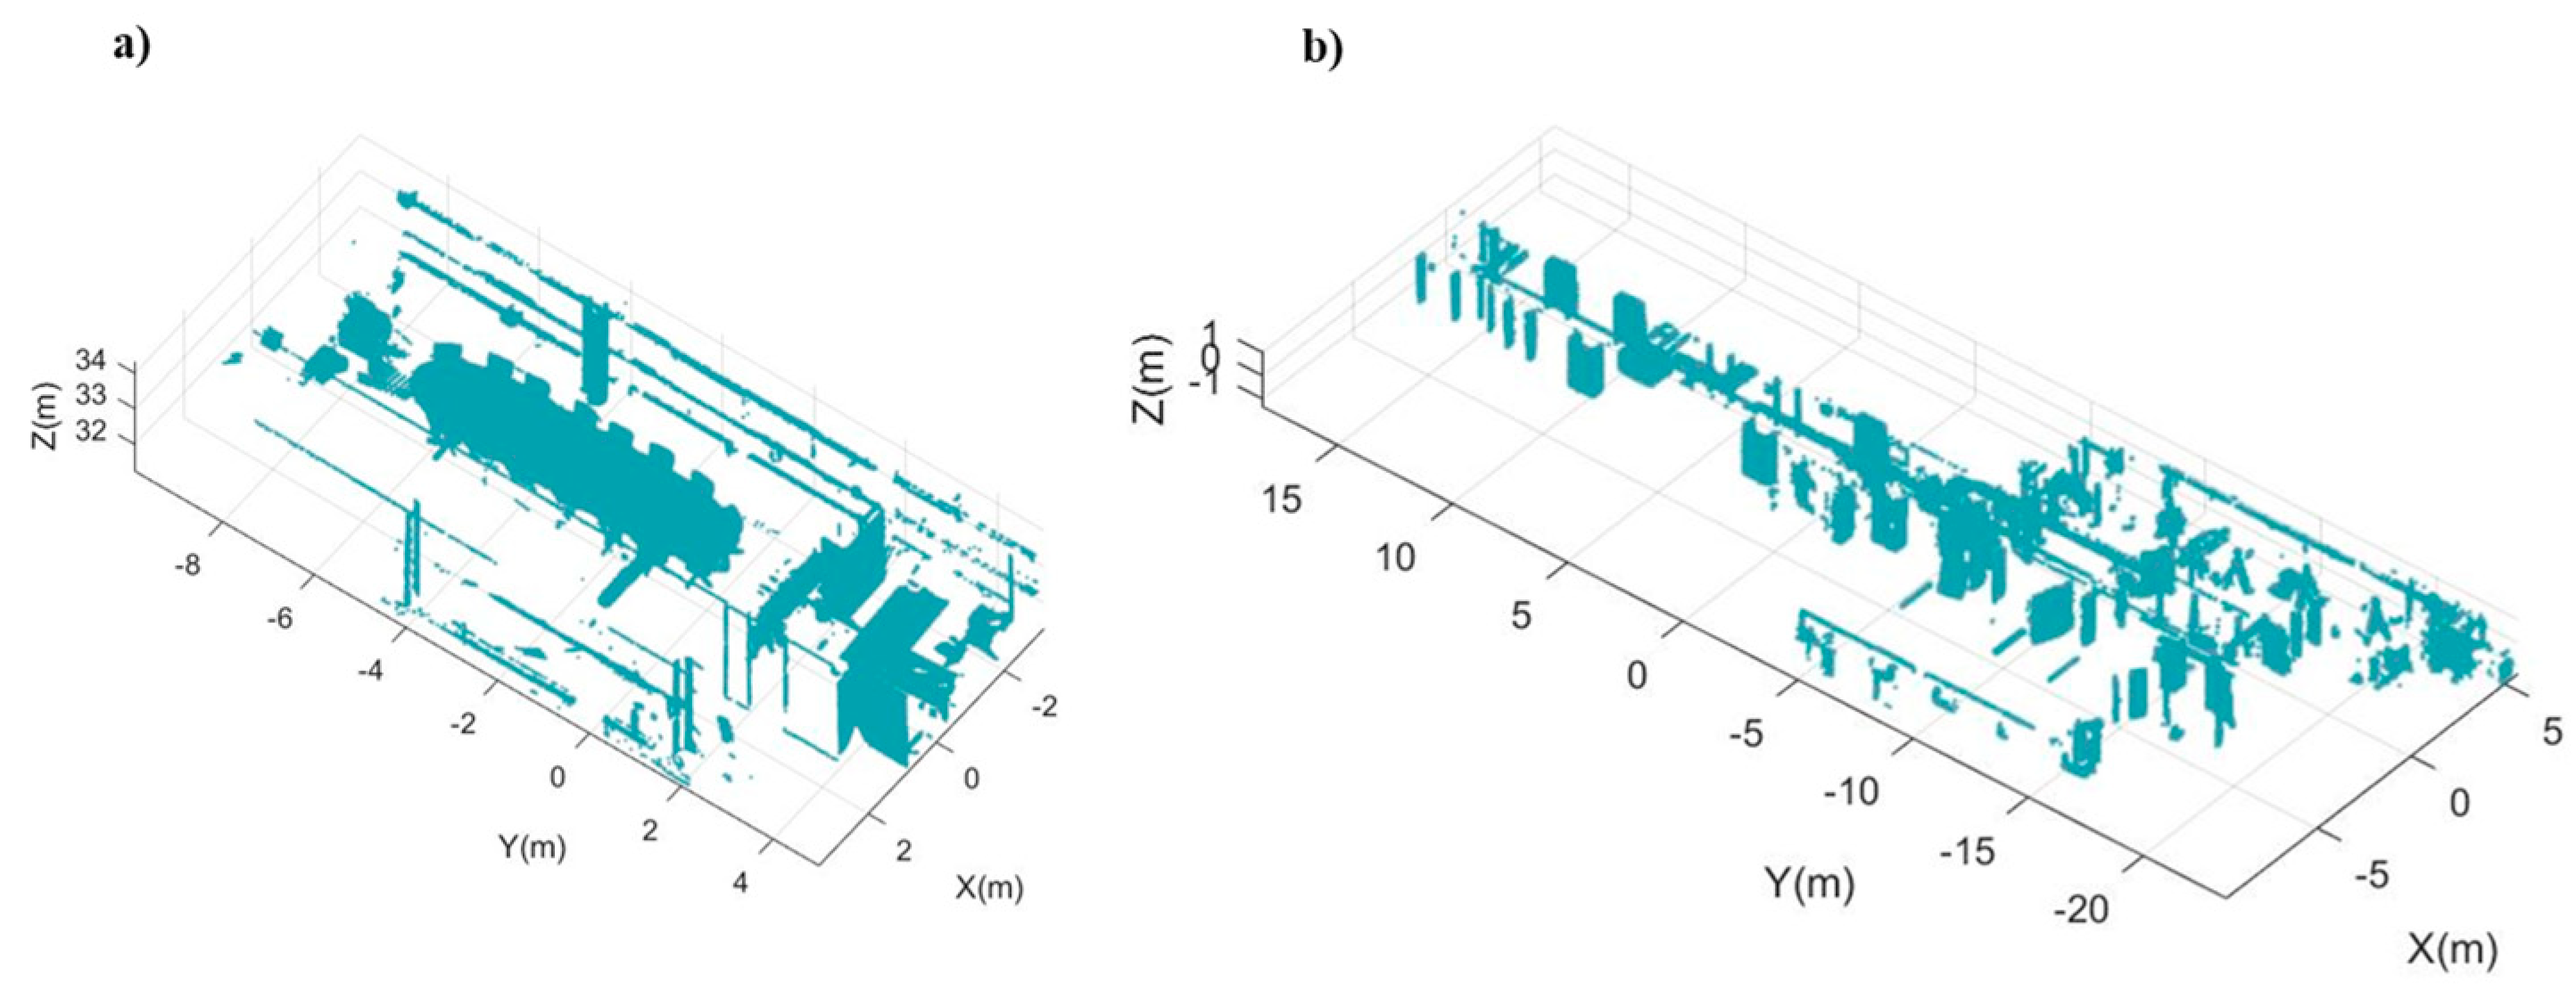
Normal vectors were calculated per point using Principal Component Analysis (PCA) and considering a neighborhood of 50 closest points. Segmentation was carried out by considering an angle threshold of 45 degrees and a point-to-plane distance of 0.3 m. The use of these coarse thresholds guaranteed that most window and door components such as frames were included in the region of the wall where they were contained. Regions with a size inferior to 50 points were directly assigned to the obstacle class. Horizontal and vertical regions were classified into walls, ceilings, and floors according to their size, adjacency relationships, orientation, and position with regard to the center of the scene. Those regions not labeled as building envelope classes (walls, floors, and ceilings) were included in the obstacle class. Figure 8 shows the obstacle class obtained for case study 3 and case study 4. Indoor elements such as columns or pieces of furniture like chairs, tables, desks, or bookshelves were classified as obstacles.
Once regions representing walls, ceilings, and floors were intersected to obtain the boundary points that defined them, they were used to create a raster image for each wall in order to search for windows and doors. The resolution of the raster was 0.04 m. As in Reference [30], input parameters to detect windows and doors were required, meaning that previous knowledge about the size of openings was required. The minimum and maximum width and height used in these case studies were 100 cm, 130 cm, 80 cm, and 100 cm for windows, and 70 cm, 90 cm, 180 cm, and 240 cm for doors. Because doors and windows were searched from edge images in two independent processes and the GHT is based on a maximum analysis, there could be detected both a door candidate and a window candidate for the same opening.
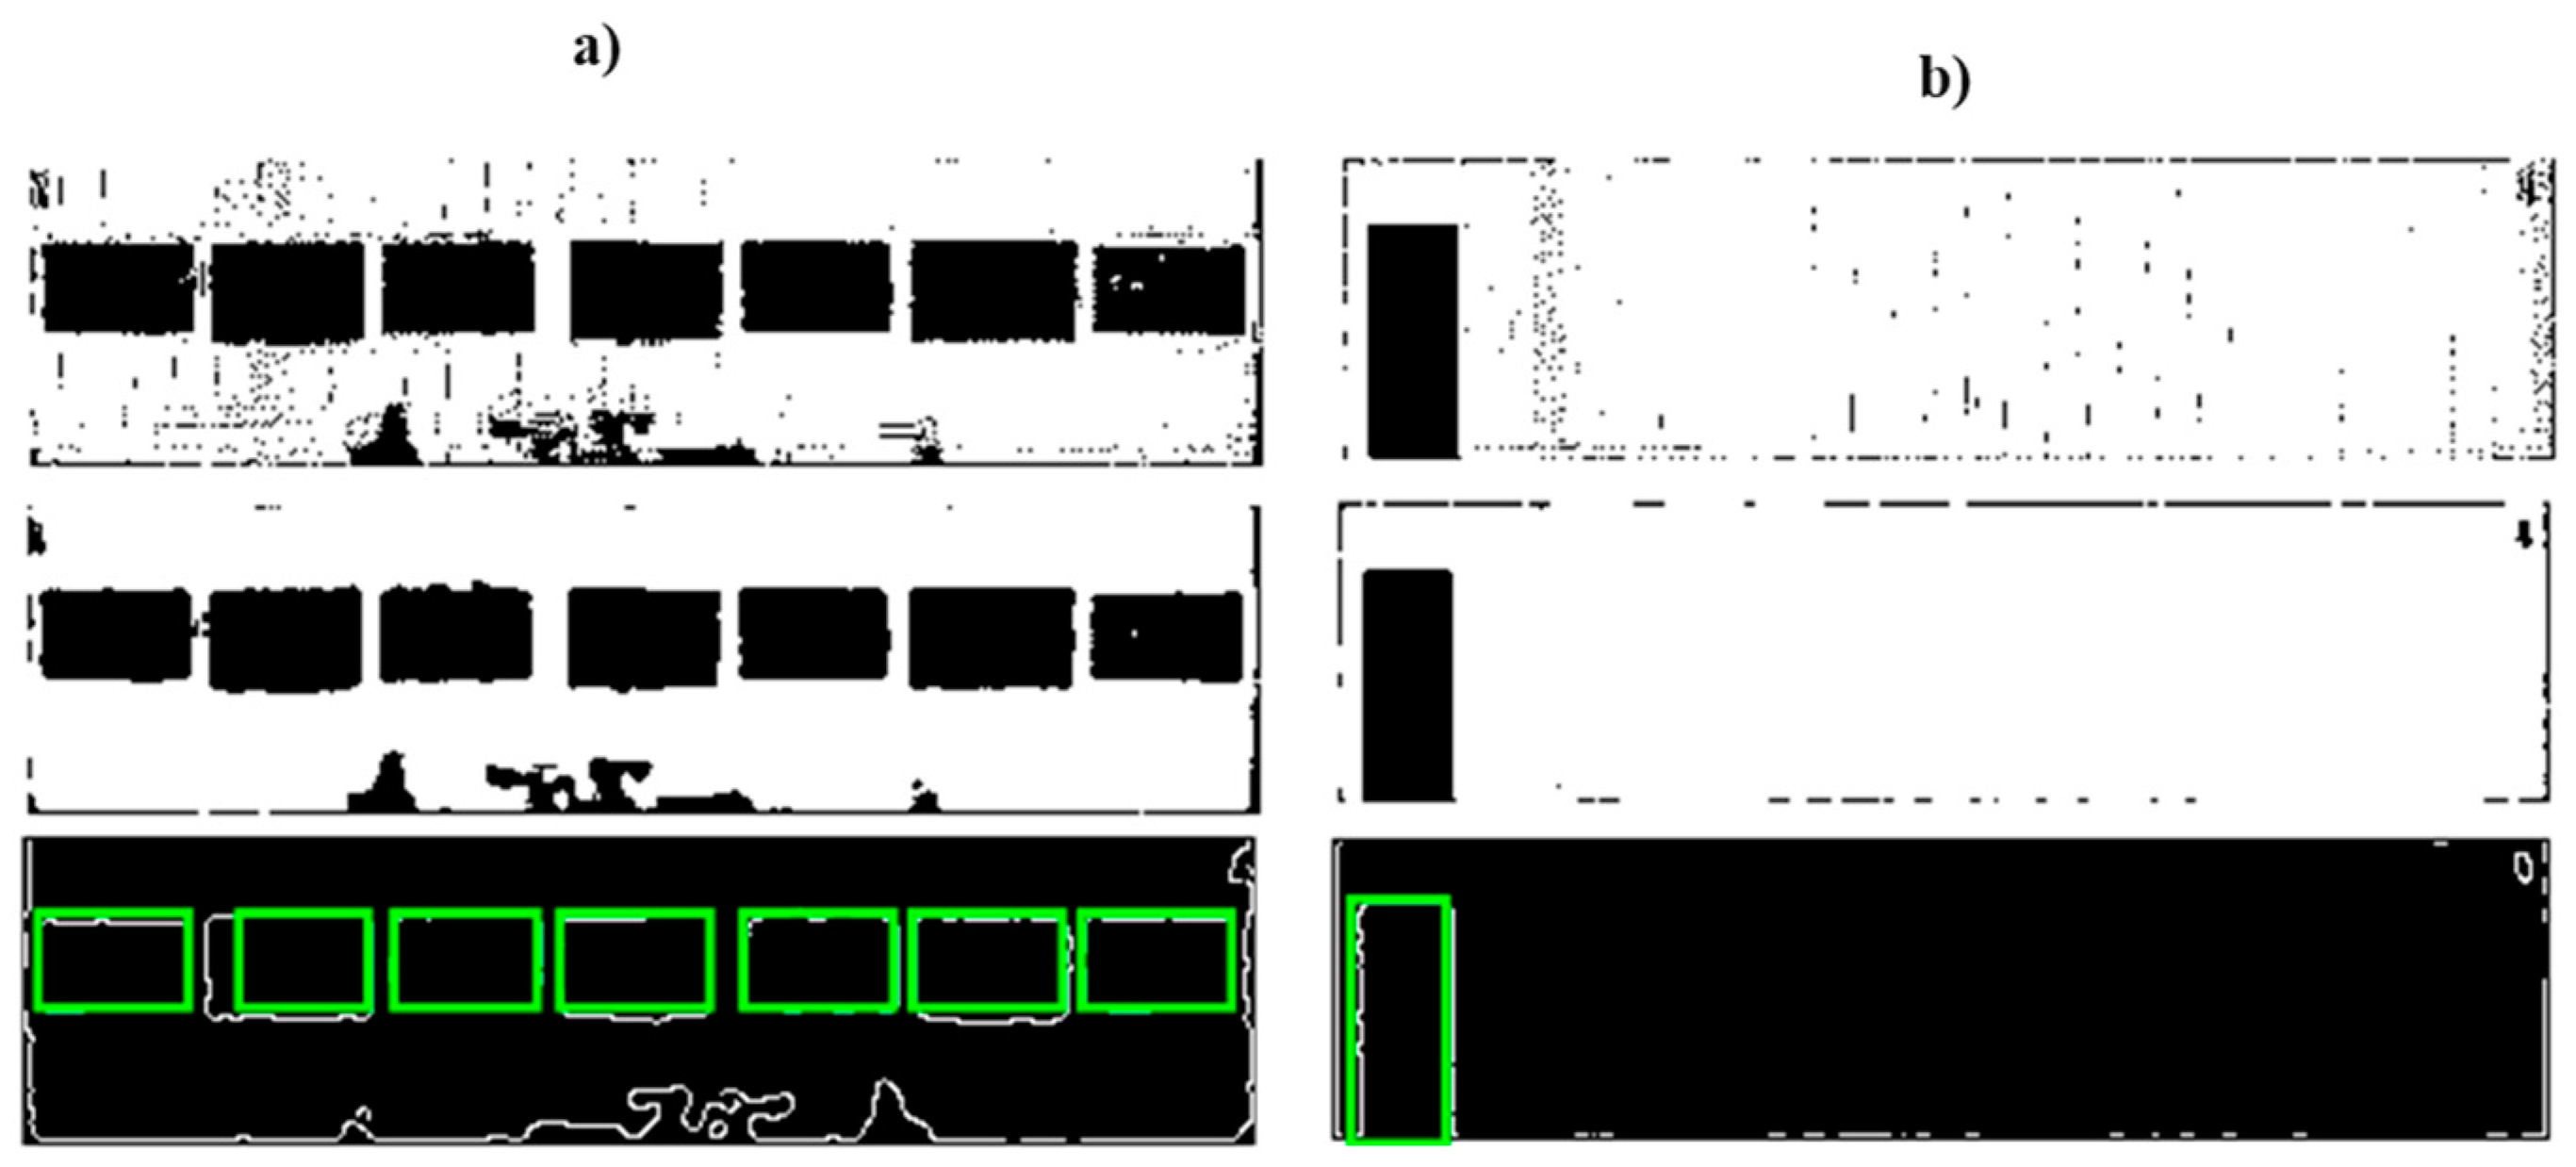
In case studies 1 and 2, the most voted candidates were selected. No other false positives were obtained because of the low presence of other objects with the same shape and size as windows and doors. Figure 9 shows an example of the detection of windows and doors in case study 1. Openings were finally submitted to a regularization process to make windows and doors with equal width and height.
In contrast to case studies 1 and 2, in case study 4, several false positives were found due to the presence of false holes in the walls caused by doors themselves when they were open. Since the trajectory followed by the system during the acquisition was available, doors were pruned as in Reference [19]. For this reason, only doors traversed by the trajectory were included in the model. Despite the fact that it implied an incomplete modeling of the indoor environment, the models were suitable for testing the indoor pathfinding for different users in an environment with multiple obstacles. The evaluation of the accuracy of the modeling method is out of the scope of this paper, since all steps implemented were already evaluated in the literature.
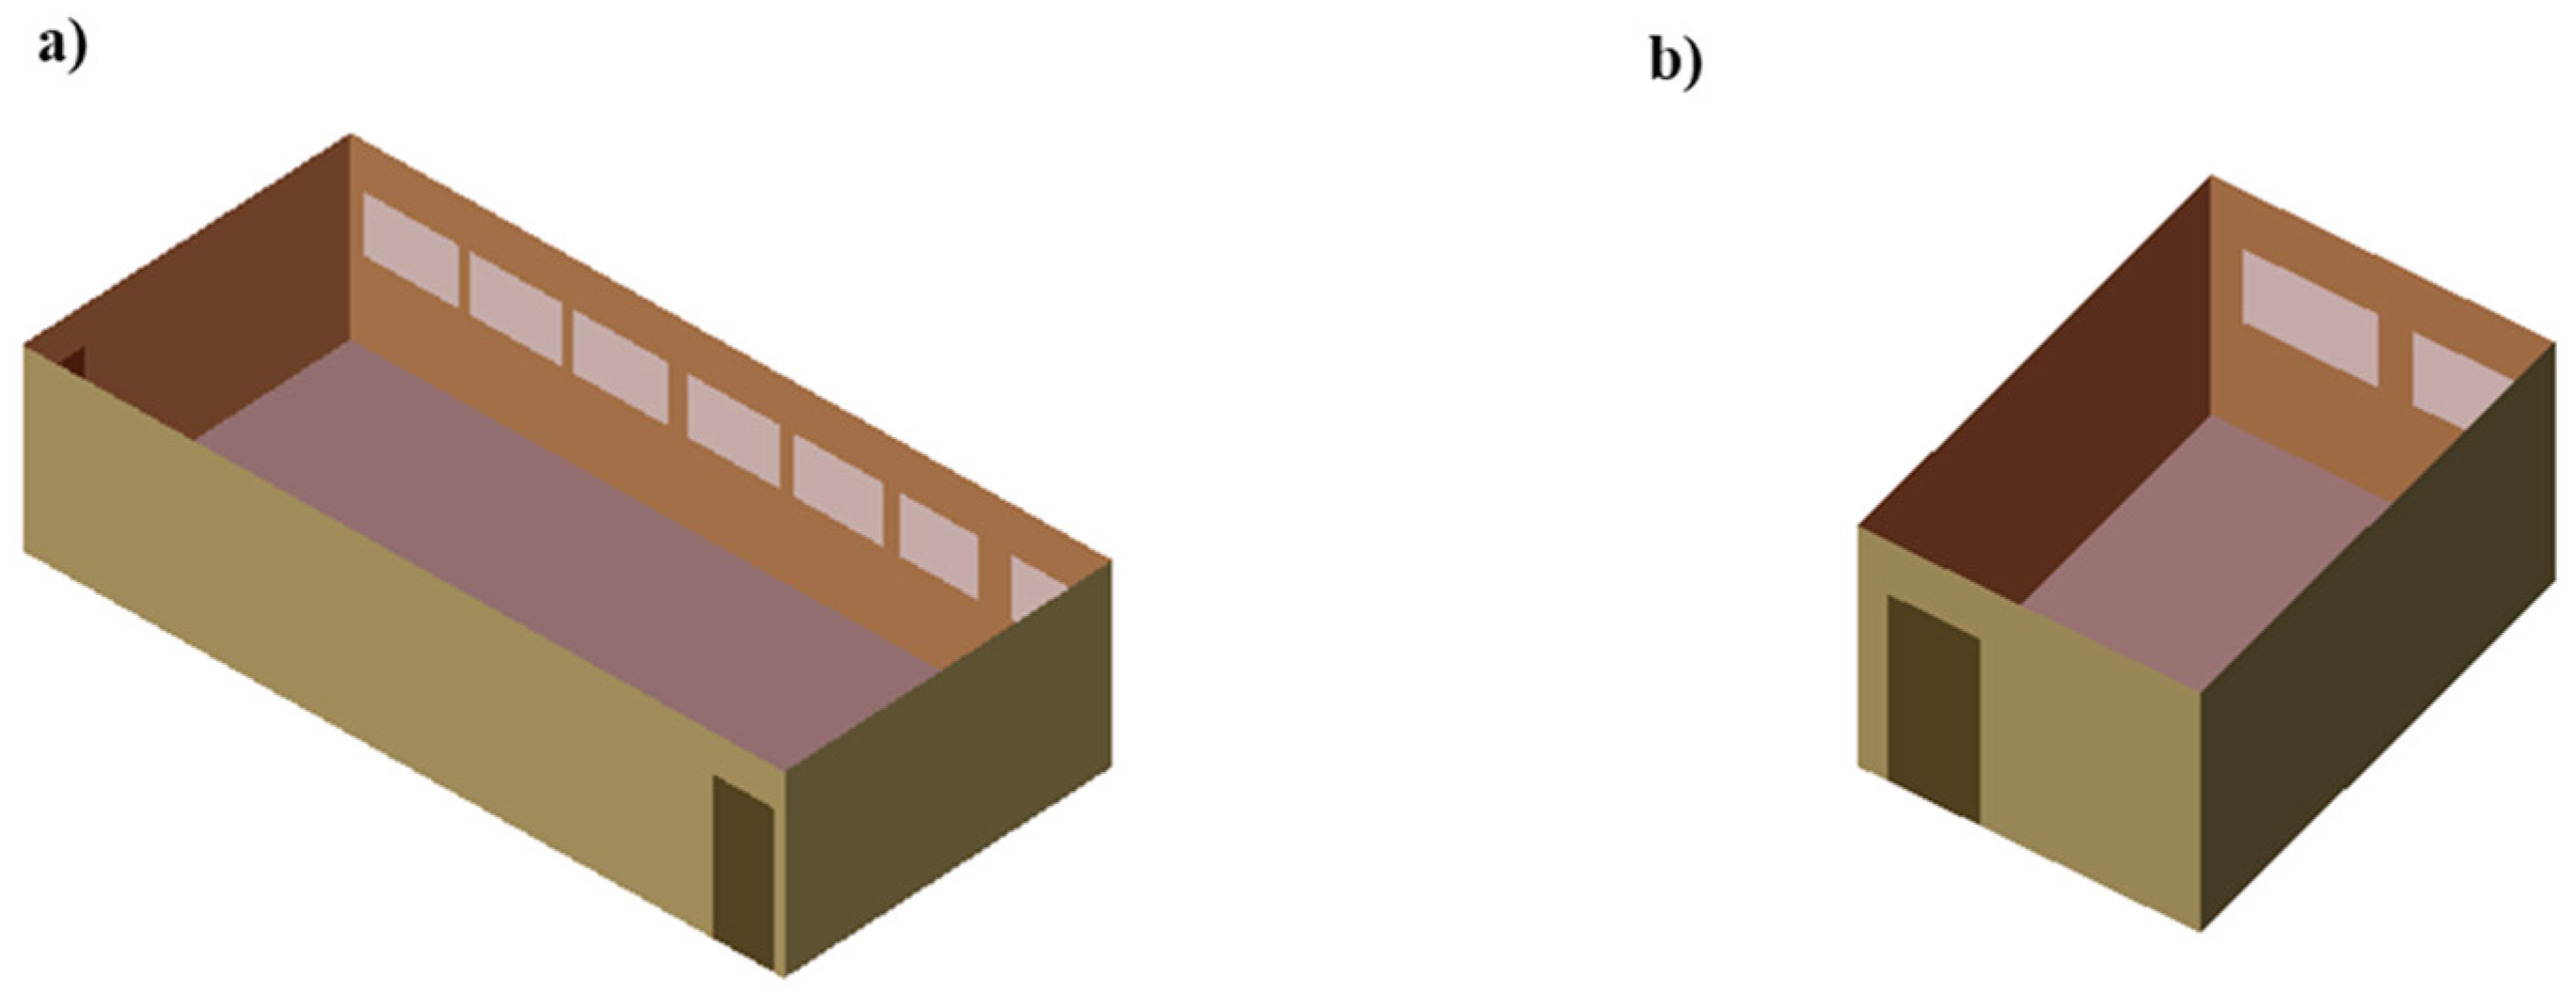
Once openings were found, their 2D geometry was reprojected to 3D, and information was structured in semantic 3D building models according to gbXML schema specifications. In Figure 10 and Figure 11, 3D models of the four case studies are visualized in FZK software. The elements of the building are visualized in different colors according to their type of surface.
4.3. Indoor Pathfinding in Real Scenarios
Experiments were carried out for both walking people and people on wheelchairs. Therefore, the rectangular buffer size representing a person was different for both cases, as along with the buffer displacement (d), which was calculated from the minimum number of steps necessary for analyzing the whole path (Figure 12). With regard to wheelchair people, buffer width was selected as the minimum width according to the United Nations [40].
Taking into account that point clouds were filtered with an octree of 0.03 m in X-, Y-, and Z-directions, aggregation and size thresholds were calculated according to the criteria defined in Section 3.2. As the objective was simply to distinguish elements causing an obstacle to navigation such as pieces of furniture rather than spurious points or small elements not interrupting the navigation, real obstacles were defined as those sets of points for which aggregation was higher than 0.033 m and size was higher than 28 points and 83 points for walking people and people on wheelchairs, respectively. This means that an obstacle was a continuous object with the size of at least 10% of the buffer size.
Different routes were simulated for testing the methodology. Origin nodes representing the initial position were manually determined for simulating representative situations. In Figure 13, a schema with the nodes used for testing the methodology is represented. For case studies 1, 2, and 3 (Figure 13a), the static obstacles such as pieces of furniture are represented. For case study 4 (Figure 13b), most of obstacles belonged to dynamic elements such as people; therefore, just one table is represented.
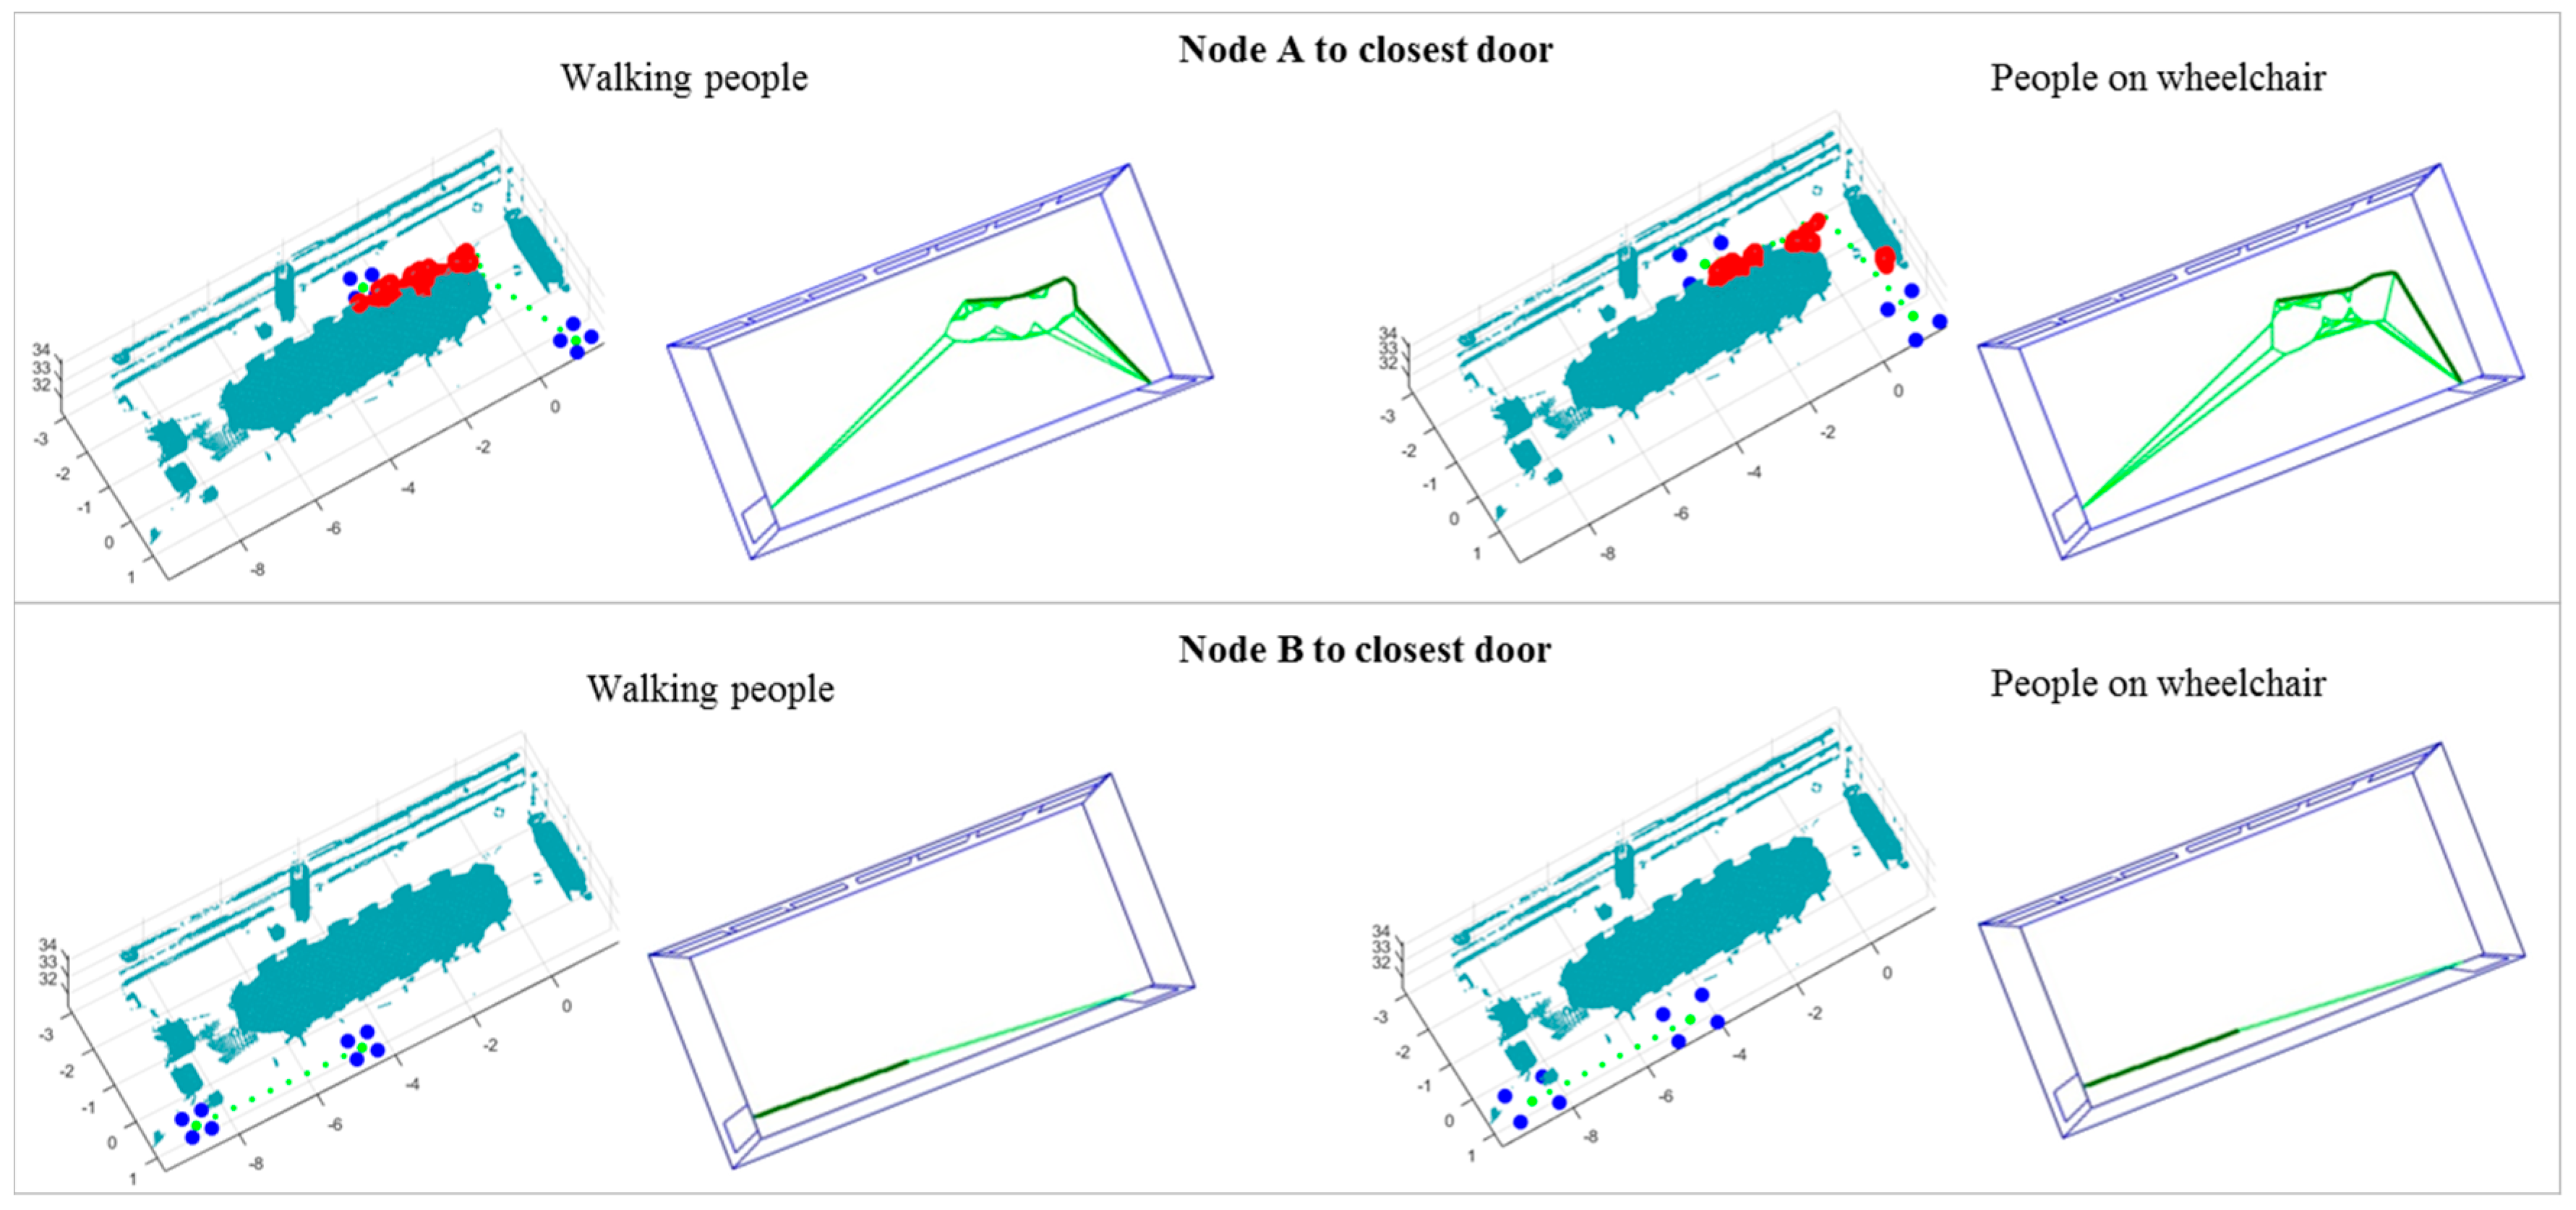
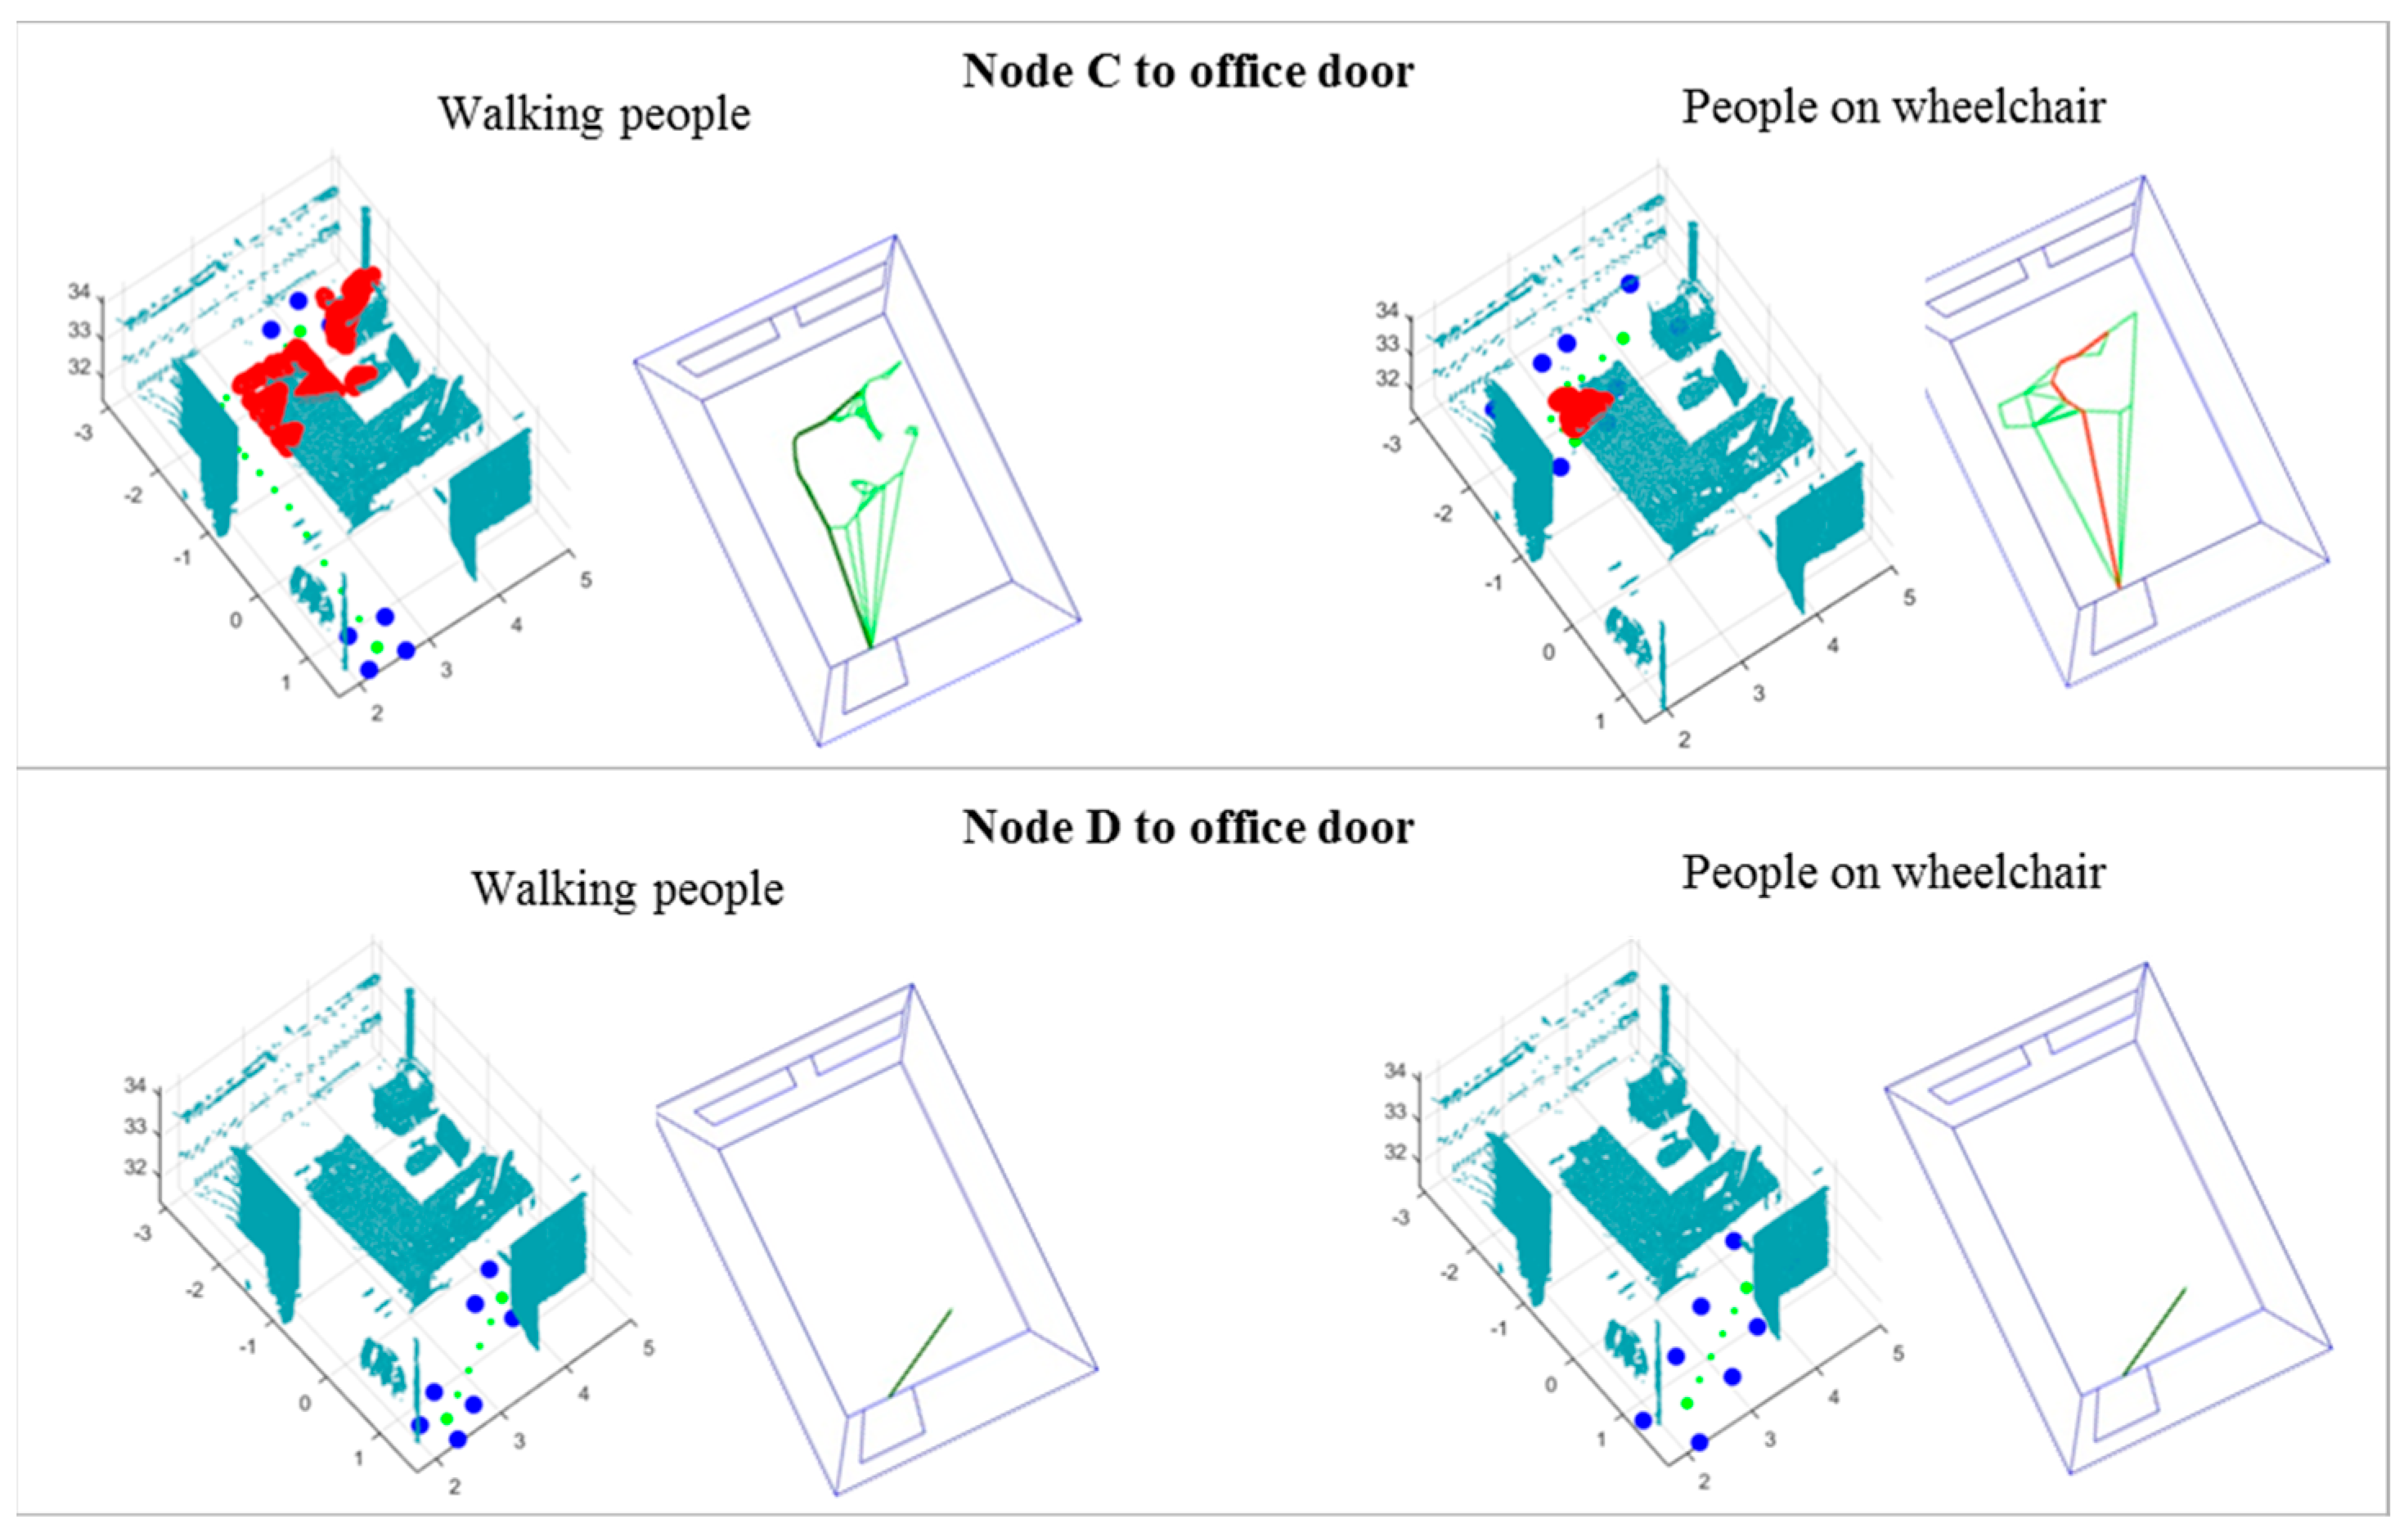
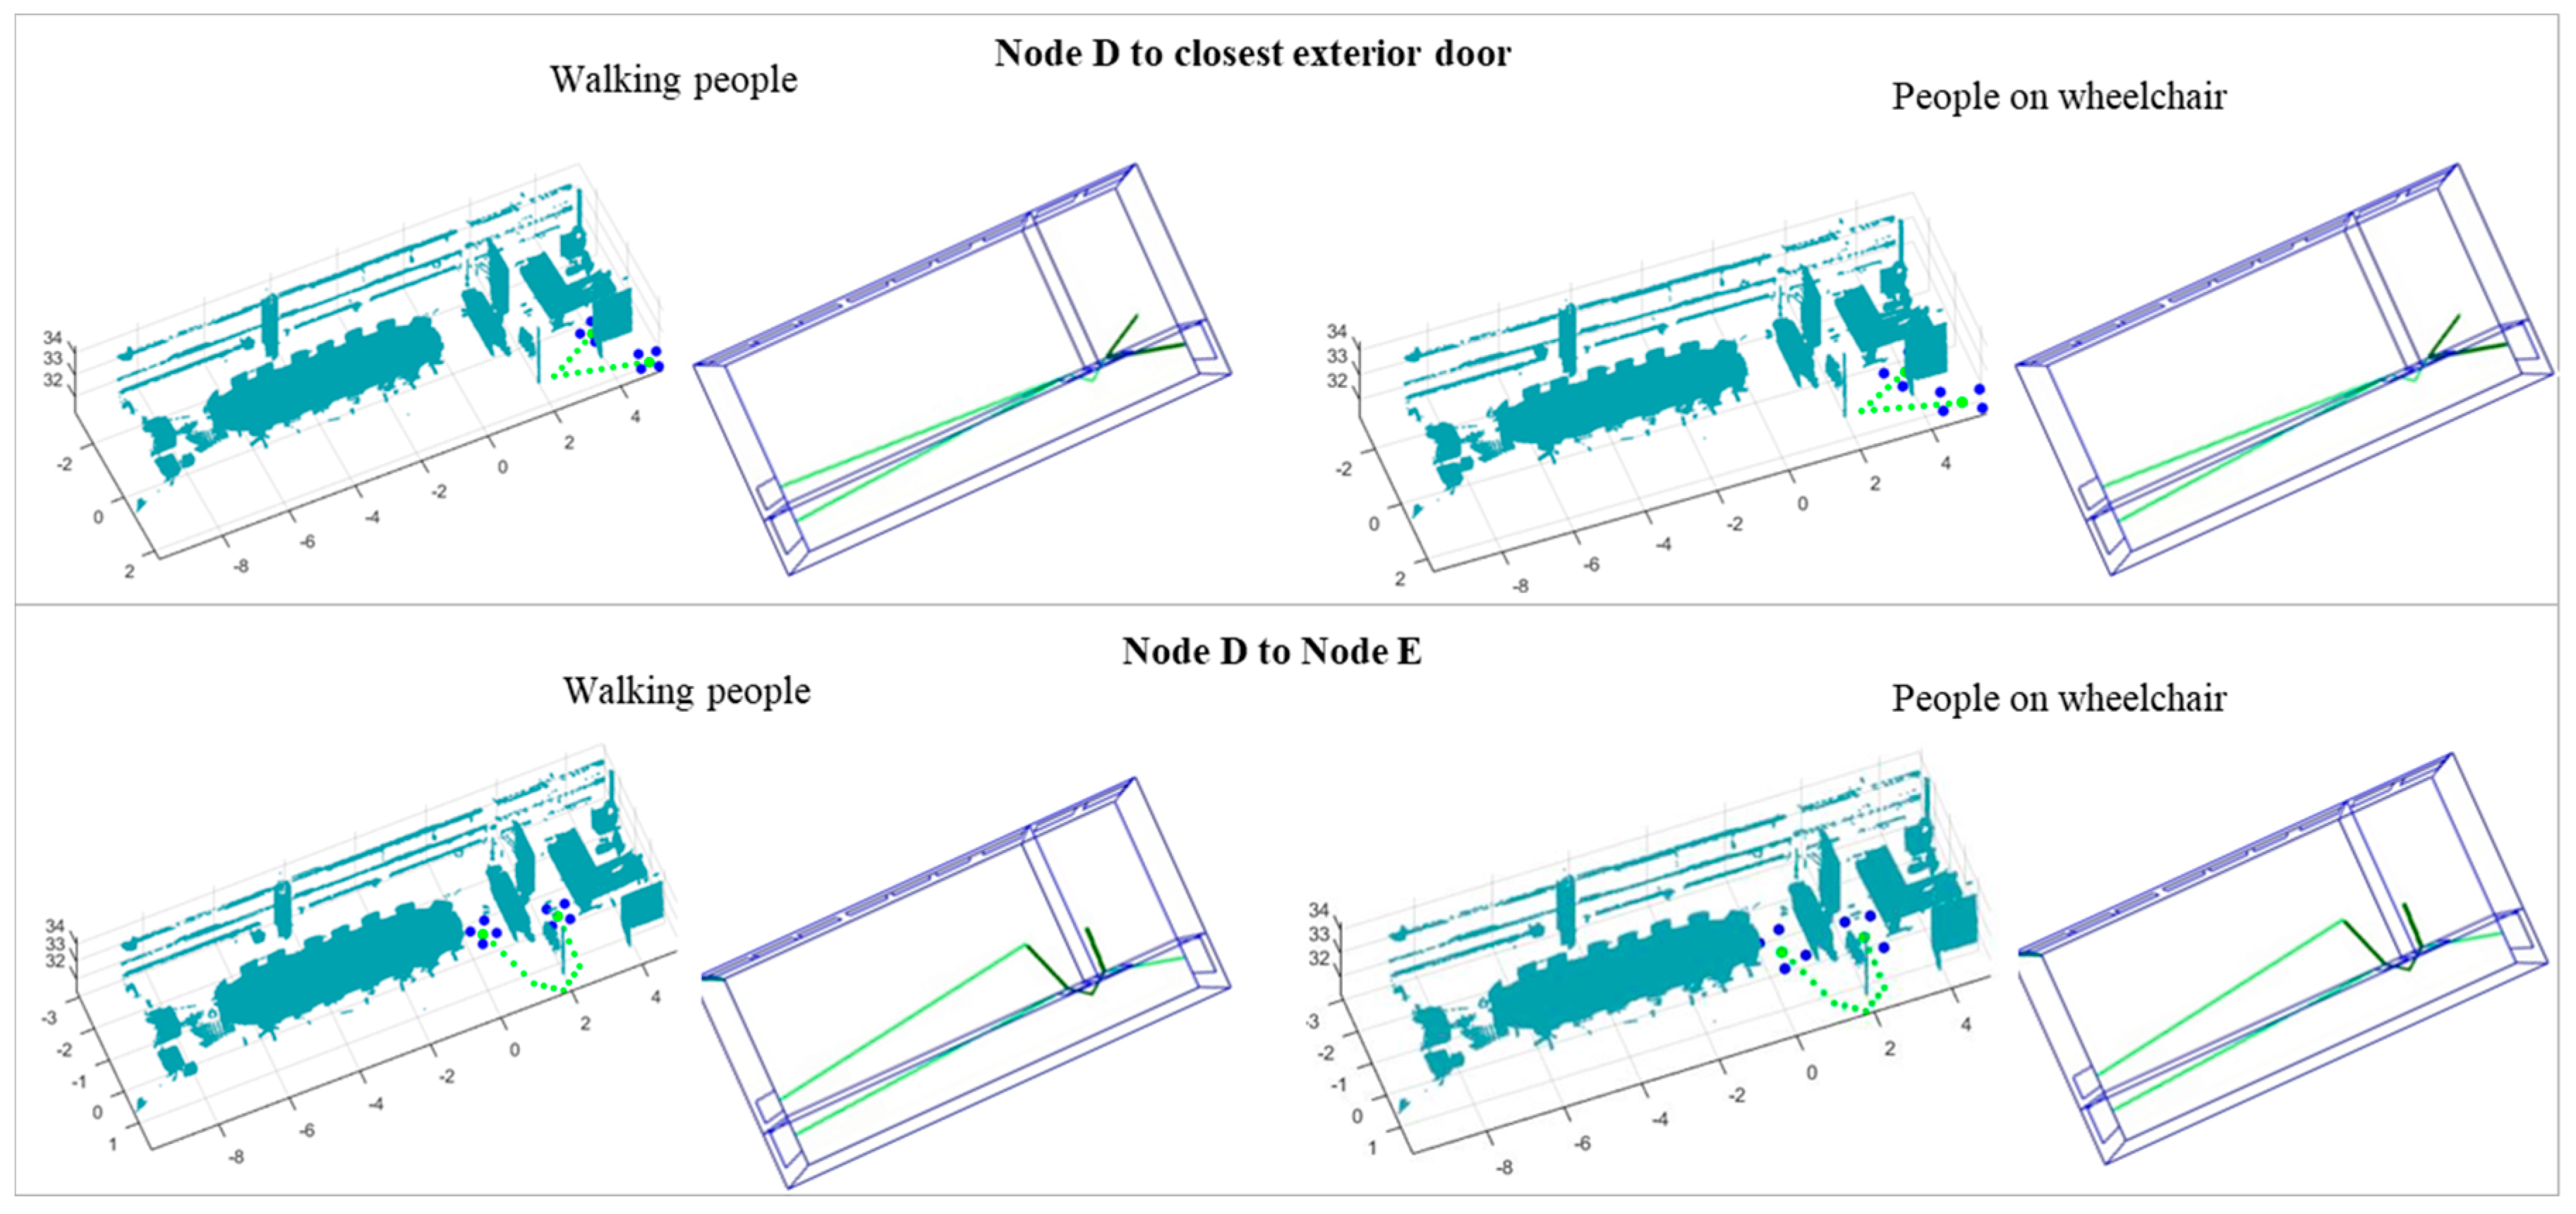
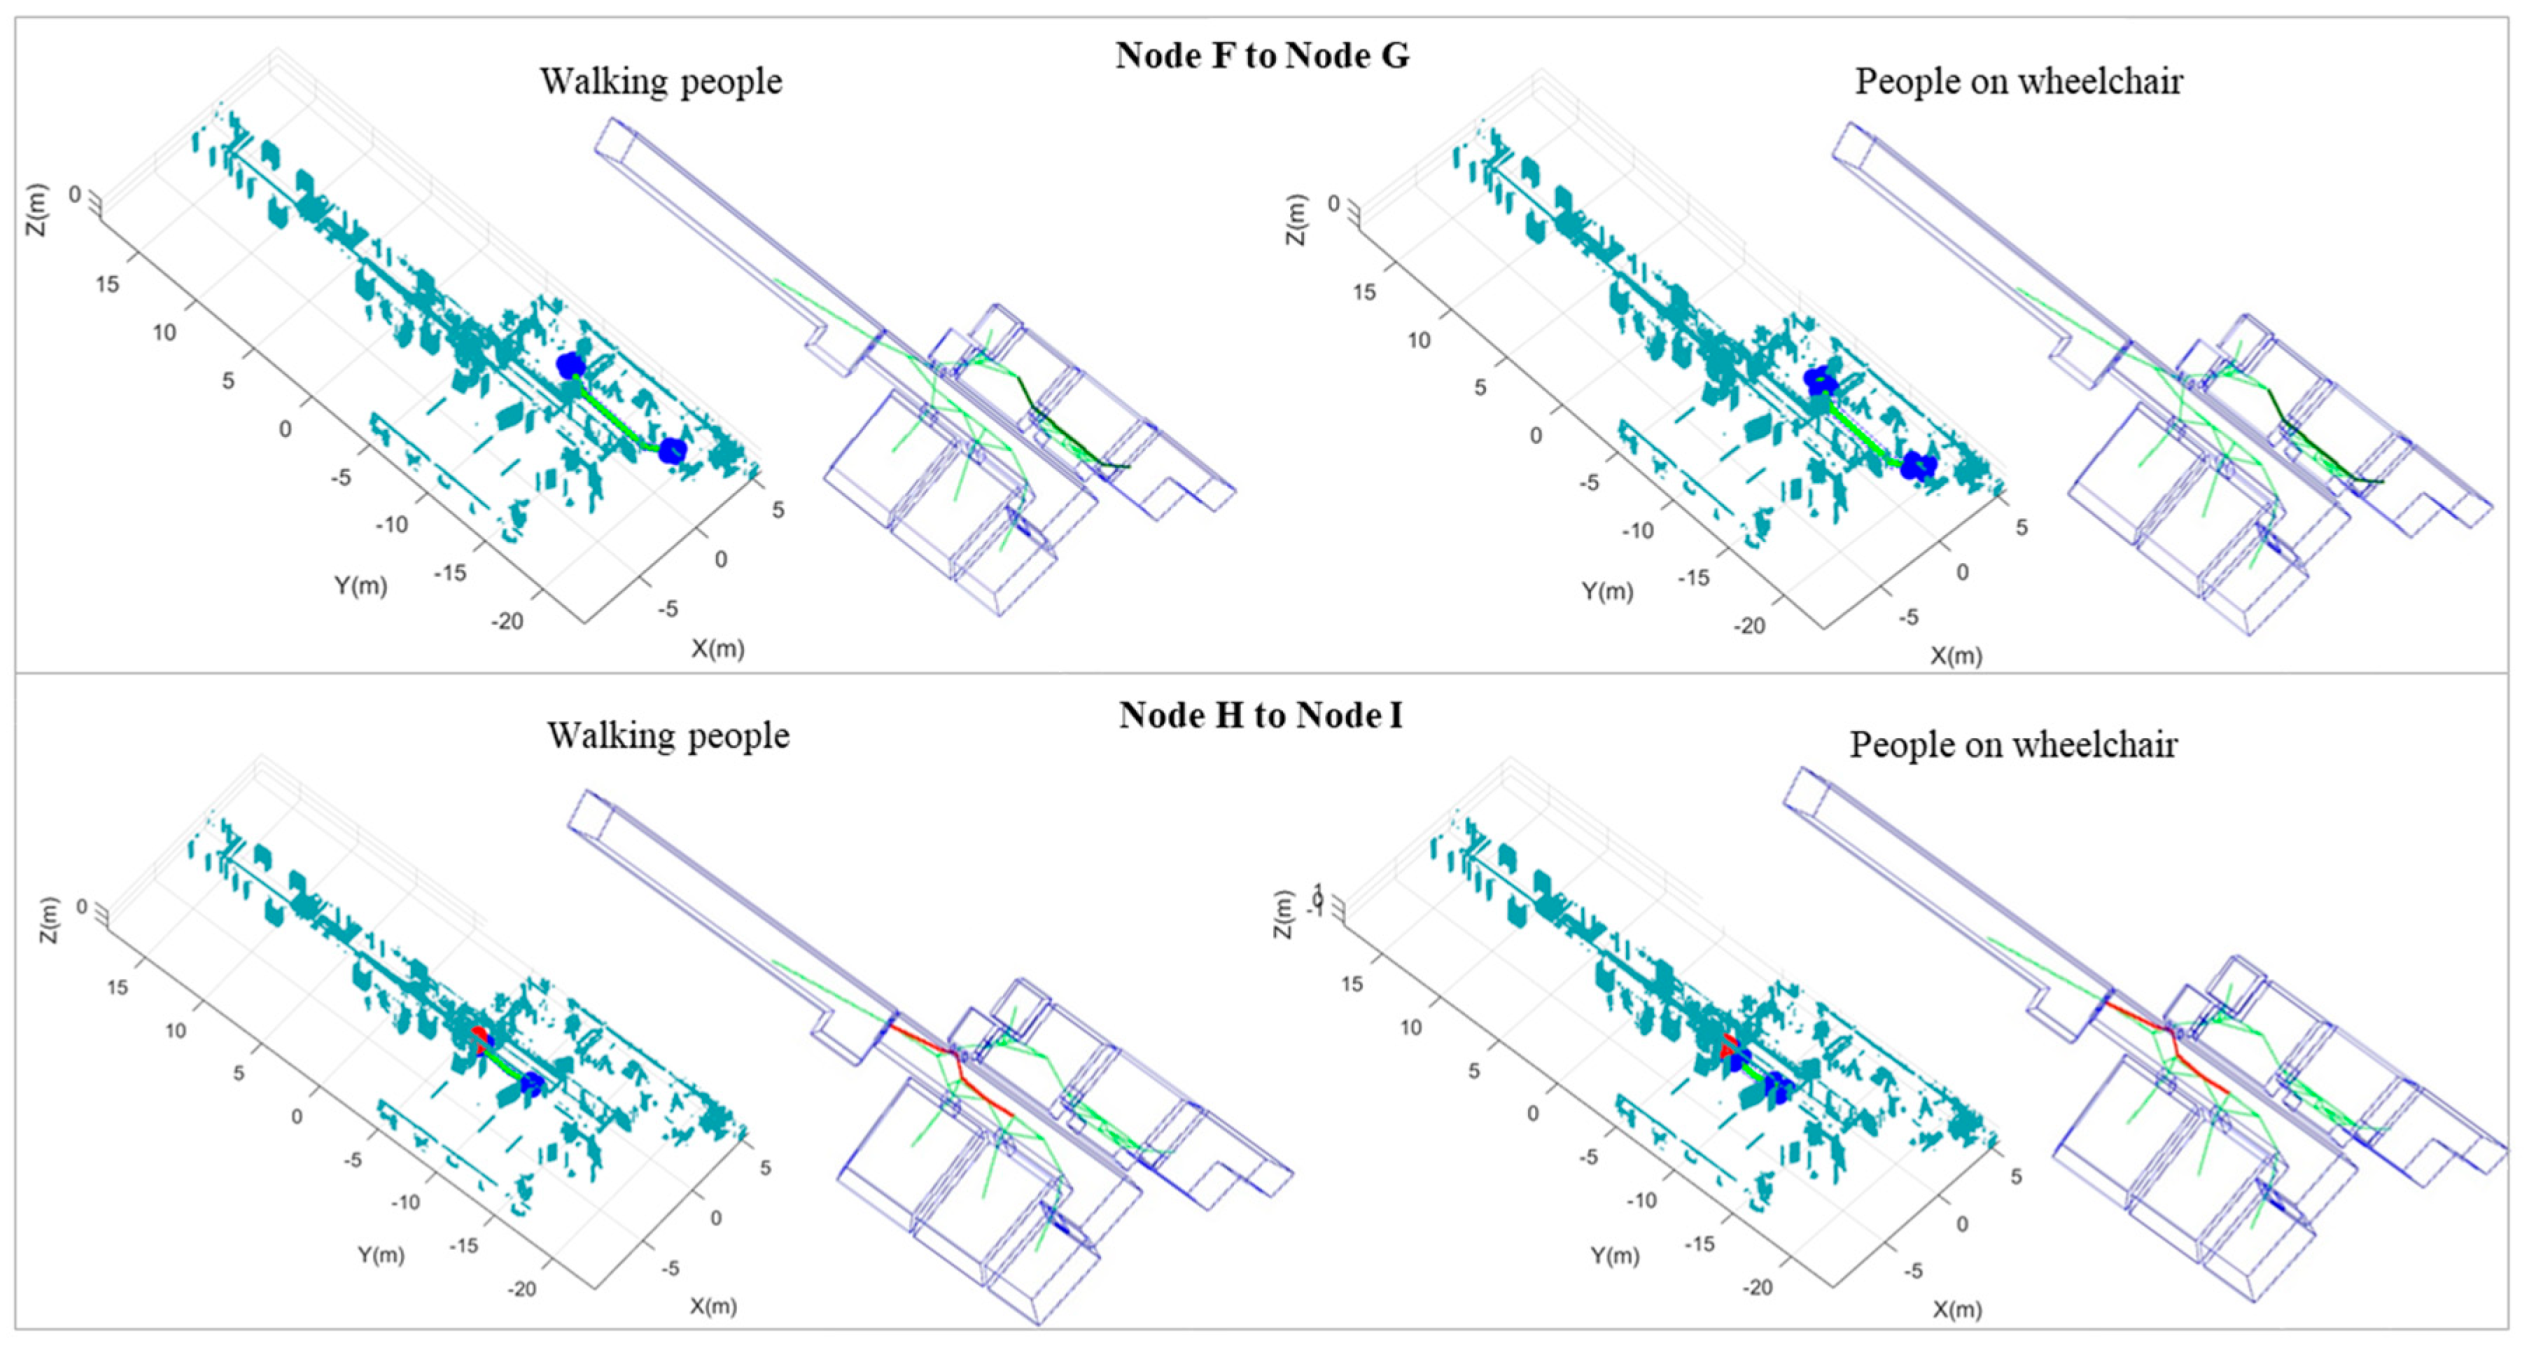
Results for both walking people and people on wheelchairs are shown in Figure 14, Figure 15 and Figure 16. Red points represent obstacle points detected through successive iterations. Green points represent the path followed from the origin to the destination node. Blue points represent the buffer section in the origin and destination nodes.
The tests simulated in the interior of the videoconference room are shown in Figure 14. For the test carried out from Node A (origin) to the closest door (destination), the shortest path was determined after 10 iterations for walking people, and after six iterations for people on wheelchairs. For the test performed from Node B (origin) to the closest door (destination), no iterations were needed for both buffer sizes.
Figure 15 represents the results for the tests carried out inside the office room in which the destination was the only door of the office. Starting from Node C, the algorithm needed 11 iterations for walking people, while it was not possible to reach the office room for people on wheelchair due to the presence of obstacles. No iterations were needed when starting from Node D.
Figure 16 shows two tests were performed taking into account the whole indoor environment encompassing three rooms. From Node D to the closest exterior door, and from Node D to Node E, no obstacles were detected in the initial path; thus, no iterations were needed.
Figure 17 represents the tests carried out for case study 4. Node F to Node G corresponds to a route between two different rooms. As no obstacles were found, the shortest route was obtained after the first iteration for both walking people and people on wheelchairs. Node H to Node I represents the route from a position inside the corridor to the door on the corridor. The method did not distinguish between static obstacles and dynamic obstacles; for this reason, the door could not be reached since several people in the corridor were detected and considered as obstacles.
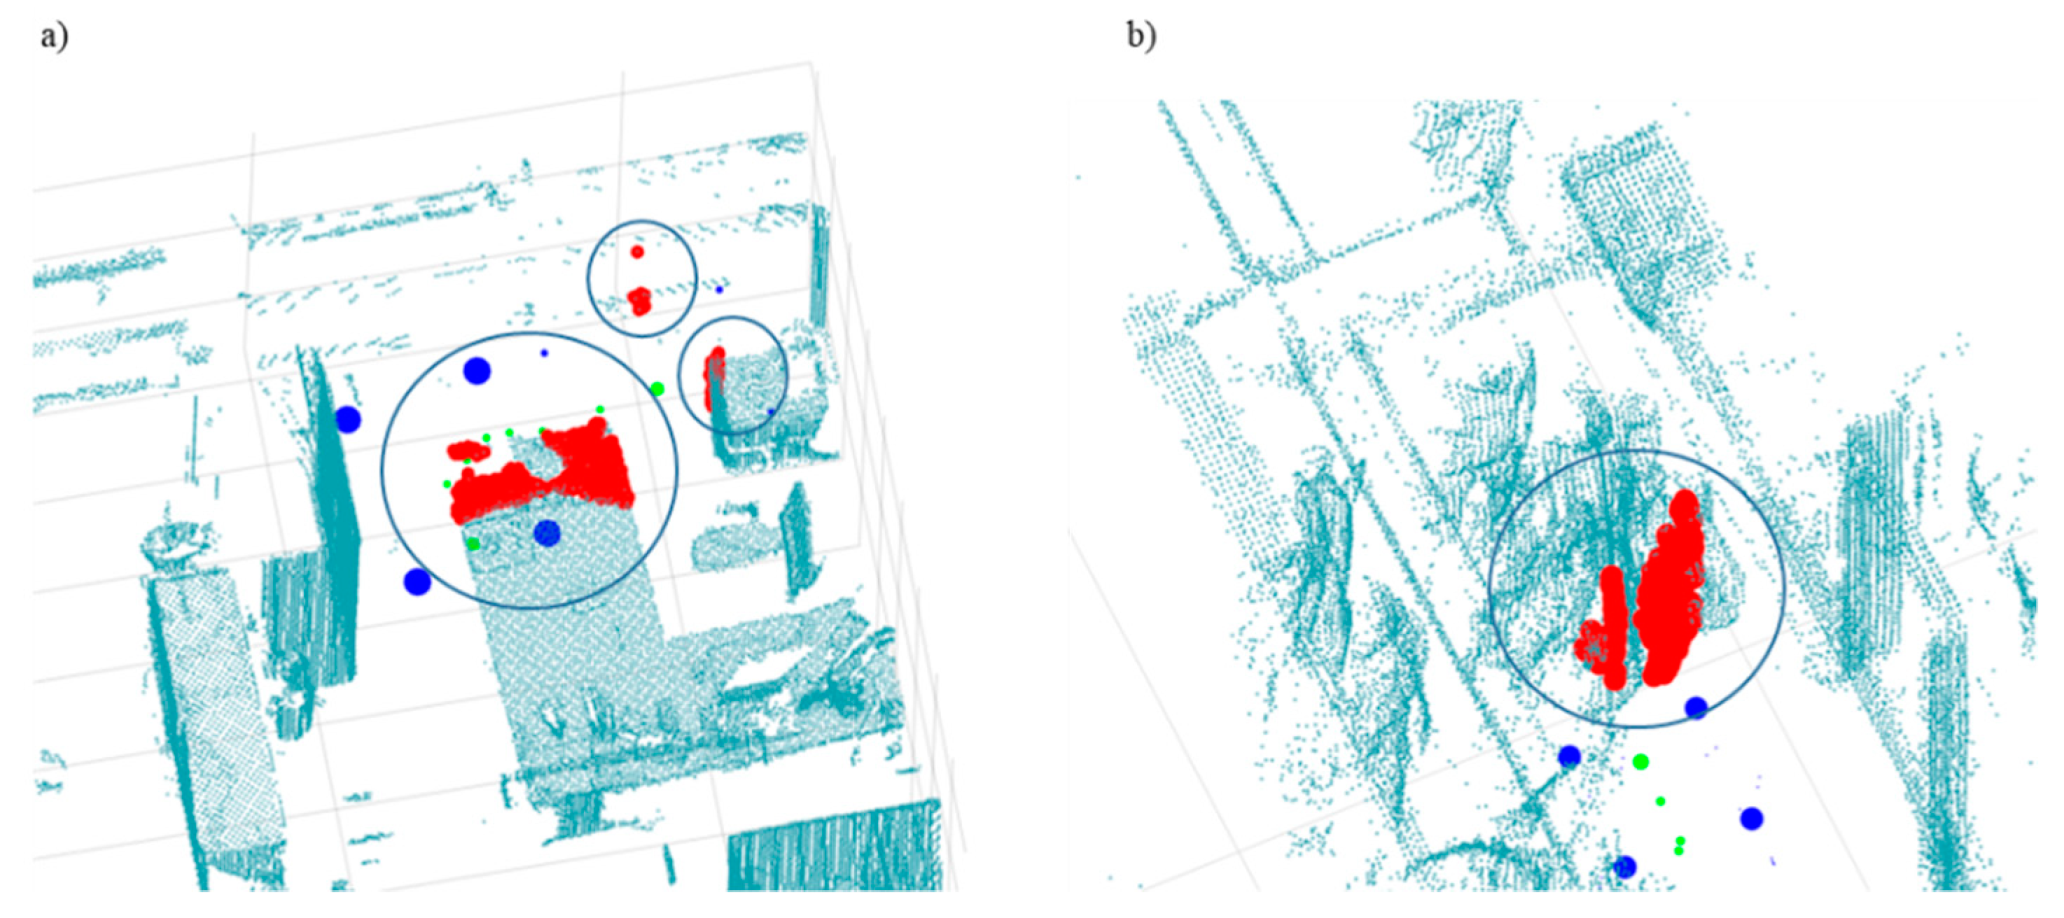
Figure 18a represents a zoom view of the “Node C to office door” test for wheelchair people and “Node H to Node I” for pedestrians. The four blue points represent the wheelchair buffer in the first case (a) and the walking person buffer in the second case (b). As it can be observed, there was no space for moving the buffer to reach the destination. The big circle highlights the obstacle points, while the small circles highlight points that were detected as potential obstacles at first, and discarded as real obstacles after checking their size and aggregation.
5. Conclusions
This paper proposes an automatic methodology for obstacle-aware indoor pathfinding. Point clouds were firstly processed to parameterize and reconstruct 3D indoor maps which constituted the basis for the network generation. Next, classified point clouds were directly used to update the network by obstacle detection and path correction.
Similar to the update of highly autonomous driving maps for autonomous vehicles, the methodology is based on the concept of updating the network from the use of point clouds. Obstacle detection is dependent on data completeness. The better the scene is depicted, the more accurate the paths are that are obtained. However, the methodology is not dependent on the complete acquisition of the entire building, since the correction of paths is considered just for the immediate area of the path instead of for the entire scene. In this way, although the paper is not conceived for a real-time application, it could be used for pathfinding with mobile laser scanning data as the input, such as for the case of autonomous wheelchairs. The distinction of dynamic and static obstacles is not considered in the methodology; however, this is an important topic for the generation of highly detailed 3D indoor maps. Consequently, this topic will be considered for future work.
From the results, the following main conclusions could be drawn:
- Results show a robust methodology for indoor pathfinding under the presence of obstacles;
- Buffer size can be changed for simulating different user conditions, such as pedestrians or people with reduced mobility;
- Although obstacles are searched in the 3D space, the network is created for each room in the 2.5D space. For instance, if a table is detected as an obstacle, the route cannot continue above or under it;
- The methodology is quality-dependent since obstacle detection depends on the input data completeness. The presence of occlusions from an incomplete survey can generate false negatives.
Future work will aim to extend the methodology to more complex scenarios including different floors elements such as stairs, ramps, etc. Extending the network creation to the 3D space will also be part of the future work, especially important for emergency applications.
Author Contributions
Lucía Díaz-Vilariño and Pawel Boguslawski designed the algorithm and performed the experiments; Kourosh Khoshelham provided supervision on the design and implementation of the research; all authors contributed to reviewing and improving the manuscript.
Funding
This research was funded by Xunta de Galicia, grant number ED481B 2016/079-0, and Ministerio de Economia, Industria, y Competitividad, Gobierno de España, grant number TIN2016-77158-C4-2-R.
Acknowledgments
The authors would like to express special thanks to Lamine Mahdjoubi for sharing his knowledge and comments on an earlier version of the manuscript. The statements made herein are solely the responsibility of the authors.
Conflicts of Interest
The authors declare no conflict of interest.
References
- EPA. Buildings and Their Impact on the Environment: A Statistical Summary, 7p. 2009. Available online: http://www.epa.gov/greenbuilding/pubs/gbstats.pdf (accessed on 20 December 2017).
- UN. United Nations Convention on the Rights of Persons with Disabilities. 2007. Available online: http://www.un.org/disabilities/convention/conventionfull.shtml (accessed on 20 December 2017).
- Zlatanova, S.; Liu, L.; Sithole, G.; Zhao, J.; Mortari, F. Space Subdivision for Indoor Applications; GISt report 66; Delft University of Technology: Delft, The Netherlands, 2014. [Google Scholar]
- Zlatanova, S.; Sithole, G.; Nakagawa, M.; Zhu, Q. Problems in indoor mapping and modelling. Int. Arch. Photogramm. Remote Sens. Spat. Inf. Sci. 2013, 40, 63–68. [Google Scholar] [CrossRef]
- Swobodzinski, M.; Raubal, M. An Indoor Routing Algorithm for the Blind: Development and Comparison to a Routing Algorithm for the Sighted. Int. J. Geogr. Inf. Sci. 2009, 23, 1315–1343. [Google Scholar] [CrossRef]
- Serna, A.; Marcotegui, B. Urban accessibility diagnosis from mobile laser scanning data. ISPRS J. Photogramm. Remote Sens. 2013, 84, 23–32. [Google Scholar] [CrossRef] [Green Version]
- Zverovich, V.; Mahdjoubi, L.; Boguslawski, P.; Fadli, F.; Barki, H. Emergency Response in Complex Buildings: Automated Selection of Safest and Balanced Routes. Comput. Civ. Infrastruct. Eng. 2016, 31, 617–632. [Google Scholar] [CrossRef] [Green Version]
- Xiong, Q.; Zhu, Q.; Zlatanova, S.; Du, Z.; Zhang, Y.; Zeng, L.Y. Multi-Level Indoor Path Planning Method. Int. Arch. Photogramm. Remote Sens. Spat. Inf. Sci. 2015, 40, 19–23. [Google Scholar] [CrossRef]
- Isikdag, U.; Zlatanova, S.; Underwood, J. A BIM-Oriented Model for supporting indoor navigation requirements. Comput. Environ. Urban Syst. 2013, 41, 112–123. [Google Scholar] [CrossRef]
- Haala, N.; Kada, M. An update on automatic 3D building reconstruction. ISPRS J. Photogramm. Remote Sens. 2010, 65, 570–580. [Google Scholar] [CrossRef]
- Volk, R.; Stengel, J.; Schultmann, F. Building Information Modeling (BIM) for existing buildings—Literature review and future needs. Autom. Constr. 2014, 38, 109–127. [Google Scholar] [CrossRef]
- Patraucean, V.; Armeni, I.; Nahangi, M.; Yeung, J.; Brilakis, I.; Haas, C. State of research in automatic as-built modelling. Adv. Eng. Inform. 2015, 29, 162–171. [Google Scholar] [CrossRef] [Green Version]
- Liu, L.; Zlatanova, S. Generating navigation models from existing building data. Int. Arch. Photogramm. Remote Sens. Spat. Inf. Sci. 2013, 40, 19–25. [Google Scholar] [CrossRef]
- Mortari, F.; Zlatanova, S.; Liu, L.; Clementini, E. “Improved Geometric Network Model” (IGNM): A novel approach for deriving Connectivity Graphs for Indoor Navigation. ISPRS Ann. Photogramm. Remote Sens. Spat. Inf. Sci. 2014, 2–4, 45–51. [Google Scholar] [CrossRef]
- Tang, P.; Huber, D.; Akinci, B.; Lipman, R.; Lytle, A. Automatic reconstruction of as-built building information models from laser-scanned point clouds: A review of related techniques. Autom. Constr. 2010, 19, 829–843. [Google Scholar] [CrossRef]
- Oesau, S.; Lafarge, F.; Alliez, P. Indoor scene reconstruction using feature sensitive primitive extraction and graph-cut. ISPRS J. Photogramm. Remote Sens. 2014, 90, 68–82. [Google Scholar] [CrossRef] [Green Version]
- Mura, C.; Mattausch, O.; Pajarola, R. Piecewise-planar Reconstruction of Multi-room Interiors with Arbitrary Wall Arrangements. Comput. Gr. Forum 2016, 35, 179–188. [Google Scholar] [CrossRef]
- Tran, H.; Khoshelham, K.; Kealy, A.; Díaz-Vilariño, L. Shape Grammar Approach to 3D Modelling of Indoor Environments Using Point Clouds. J. Comput. Civ. Eng. 2019, 33, 14. [Google Scholar] [CrossRef]
- Xiong, X.; Adan, A.; Akinci, B.; Huber, D. Automatic creation of semantically rich 3D building models from laser scanner data. Autom. Constr. 2013, 31, 325–337. [Google Scholar] [CrossRef] [Green Version]
- Díaz-Vilariño, L.; Khoshelham, K.; Martínez-Sánchez, J.; Arias, P. 3D modeling of building indoor spaces and closed doors from imagery and point clouds. Sensors 2015, 15, 3491–3512. [Google Scholar] [CrossRef]
- Quintana, B.; Prieto, S.A.; Adán, A.; Bosché, F. Door detection in 3D colored laser scans for autonomous indoor navigation. In Proceedings of the 2016 International Conference on Indoor Positioning and Indoor Navigation (IPIN), Alcala de Henares, Spain, 4–7 October 2016. [Google Scholar] [CrossRef]
- Previtali, M.; Díaz-Vilariño, L.; Scaioni, M. Indoor Building Reconstruction from Occluded Point Clouds Using Graph-Cut and Ray-Tracing. Appl. Sci. 2018, 8, 1529. [Google Scholar] [CrossRef]
- Staats, B.R.; Diakité, A.A.; Voûte, R.L.; Zlatanova, S. Automatic generation of indoor navigable space using a point cloud and its scanner trajectory. ISPRS Ann. Photogramm. Remote Sens. Spat. Inf. Sci. 2017, 4, 393–400. [Google Scholar] [CrossRef]
- Balado, J.; Díaz-Vilariño, L.; Arias, P.; González-Jorge, H. Automatic classification of urban ground elements from mobile laser scanning data. Autom. Const. 2018, 86, 226–239. [Google Scholar] [CrossRef]
- Balado, J.; Díaz-Vilariño, L.; Arias, P.; Soilán, S. Automatic building accessibility diagnosis from point clouds. Autom. Const. 2011, 82, 103–111. [Google Scholar] [CrossRef]
- Díaz-Vilariño, L.; Verbree, E.; Zlatanova, S.; Diakité, A. Indoor modelling from slam-based laser scanner: Door detection to envelope reconstruction. Int. Arch. Photogramm. Remote Sens. Spat. Inf. Sci. 2017, 42, 345–352. [Google Scholar] [CrossRef]
- Nikoohemat, S.; Peter, M.; Oude Elberink, S.; Vosselman, G. Exploiting indoor mobile laser scanner trajectories for semantic interpretation of point clouds. ISPRS Ann. Photogramm. Remote Sens. Spat. Inf. Sci. 2017, 4, 355–362. [Google Scholar] [CrossRef]
- Nikoohemat, S.; Peter, M.; Oude Elberink, S.; Vosselman, G. Semantic Interpretation of Mobile Laser Scanner Point Clouds in Indoor Scenes Using Trajectories. Remote Sens. 2018, 10, 1754. [Google Scholar] [CrossRef]
- Tran, H.; Khoshelham, K.; Kealy, A.; Díaz-Vilariño, L. Extracting topological relations between indoor spaces from point clouds. ISPRS Ann. Photogramm. Remote Sens. Spat. Inf. Sci. 2017, 4, 401–406. [Google Scholar] [CrossRef]
- Guzzi, J.; Di Carlo, G. From indoor GIS maps to path planning for autonomous wheelchairs. In Proceedings of the IEEE/RSJ International Conference on Intelligent Robots and Systems (IROS), Daejeon, Korea, 9–14 October 2016. [Google Scholar]
- De Berg, M.; Van Kreveld, M.; Overmars, M.; Schwarzkopf, O.C. Computational Geometry, 2nd ed.; Chapter 15: Visibility Graphs; Springer: Berlin/Heidelberg, Germany, 2000. [Google Scholar]
- Goetz, M.; Zipf, A. Formal definition of a user adaptive and length-optimal routing graph for complex indoor environments. Geo-Spat. Inf. Sci. 2011, 14, 119–128. [Google Scholar] [CrossRef]
- Wang, Z.; Zlatanova, S.; Van Oosterom, P. Path Planning for First Responders in the Presence of Moving Obstacles With Uncertain Boundaries. IEEE Trans. Intell. Transp. Syst. 2017, 18, 2163–2173. [Google Scholar] [CrossRef] [Green Version]
- Liu, L.; Xu, W.; Penard, W.; Zlatanova, S. Leveraging Spatial Model To Improve Indoor Tracking. Int. Arch. Photogramm. Remote Sens. Spat. Inf. Sci.-ISPRS Arch. 2015, 40, 75–80. [Google Scholar] [CrossRef]
- Rodenberg, O. The Effect of A* Pathfinding characteristics on the path length and performance in an octree representation of an indoor point cloud. Master’s Thesis, Technical University of Delft, Delft, The Netherlands, 2016. [Google Scholar]
- Li, F.; Zlatanova, S.; Koopman, M.; Bai, X.; Diakité, A. Universal path planning for an indoor drone. Autom. Constr. 2018, 95, 275–283. [Google Scholar] [CrossRef]
- Díaz-Vilariño, L.; Boguslawski, P.; Khoshelham, K.; Lorenzo, H.; Mahdjoubi, L. Indoor navigation from point clouds: 3D modelling and Obstacle Detection. Int. Arch. Photogramm. Remote Sens. Spat. Inf. Sci. 2016, 41, 275–281. [Google Scholar] [CrossRef]
- Díaz-Vilariño, L.; Conde, B.; Lagüela, S.; Lorenzo, H. Automatic detection and segmentation of columns in as-built buildings from point clouds. Remote Sens. 2015, 7, 15651–15667. [Google Scholar] [CrossRef]
- Díaz-Vilariño, L.; Martínez-Sánchez, J.; Lagüela, S.; Armesto, J.; Khoshelham, K. Door recognition in cluttered building interiors using imagery and LiDAR data. Int. Arch. Photogramm. Remote Sens. Spat. Inf. Sci. 2014, 40, 203–209. [Google Scholar] [CrossRef]
- Boguslawski, P.; Mahdjoubi, L.; Zverovich, V.; Fadli, F. Automated construction of variable density navigable networks in a 3D indoor environment for emergency response. Autom. Constr. 2016, 72, 115–128. [Google Scholar] [CrossRef] [Green Version]
- Dijkstra, E.W. A note on two problems in connexion with graphs. Numer. Math. 1959, 1, 269–271. [Google Scholar] [CrossRef] [Green Version]
- Hart, P.E.; Nilsson, N.J.; Raphael, B. A formal Basis for the Heuristic Determination of Minimum Cost Paths. IEEE Trans. Syst. Sci. Cybern. 1968, 4, 100–107. [Google Scholar] [CrossRef]
- Khoshelham, K.; Díaz Vilariño, L.; Peter, M.; Kang, Z.; Acharya, D. The ISPRS Benchmark on Indoor Modelling. Int. Arch. Photogramm. Remote Sens. Spat. Inf. Sci. 2017, 42, 367–372. [Google Scholar] [CrossRef]
Figure 1.
Workflow of the building envelope reconstruction.

Figure 2.
Workflow of the opening detection process.

Figure 3.
(a) Point cloud; (b) point cloud projected into a rectangular matrix; (c) binarized image; (d) edge image (adapted from [35]).
Figure 3.
(a) Point cloud; (b) point cloud projected into a rectangular matrix; (c) binarized image; (d) edge image (adapted from [35]).

Figure 4.
Schema of the obstacle detection strategy (adapted from [35]).
Figure 4.
Schema of the obstacle detection strategy (adapted from [35]).

Figure 5.
Pathfinding procedure: (a,c) navigable networks (solid lines) with obstacle areas (dashed polygons); (b,d) paths (thick solid lines) calculated in consecutive iterations.
Figure 5.
Pathfinding procedure: (a,c) navigable networks (solid lines) with obstacle areas (dashed polygons); (b,d) paths (thick solid lines) calculated in consecutive iterations.

Figure 6.
Three-dimensional view of the point clouds used as case study 1 and case study 2: (a) videoconference room; scale bar of 4.5 m; (b) office; scale bar of 3.0 m. The ceiling is removed in all views to facilitate visualization.
Figure 6.
Three-dimensional view of the point clouds used as case study 1 and case study 2: (a) videoconference room; scale bar of 4.5 m; (b) office; scale bar of 3.0 m. The ceiling is removed in all views to facilitate visualization.

Figure 7.
Three-dimensional view of the point clouds used as (a) case study 3 (scale bar of 6.0 m), and (b) case study 4 (scale bar of 10.0 m). The ceiling is removed in all views to facilitate visualization.
Figure 7.
Three-dimensional view of the point clouds used as (a) case study 3 (scale bar of 6.0 m), and (b) case study 4 (scale bar of 10.0 m). The ceiling is removed in all views to facilitate visualization.

Figure 8.
Obstacle class obtained after segmentation for case study 3 (a) and case study 4 (b).

Figure 9.
Results of window (a) and door (b) detection in case study 1 (videoconference room). From top to bottom: raster image, raster after median filtering, and edge image with detected openings in green.
Figure 9.
Results of window (a) and door (b) detection in case study 1 (videoconference room). From top to bottom: raster image, raster after median filtering, and edge image with detected openings in green.

Figure 10.
The gbXML models for (a) case study 1 and (b) case study 2. The ceiling was given transparency to improve visualization.
Figure 10.
The gbXML models for (a) case study 1 and (b) case study 2. The ceiling was given transparency to improve visualization.

Figure 11.
The gbXML models for (a) case study 3 and (b) case study 4. The ceiling was given transparency to improve visualization.
Figure 11.
The gbXML models for (a) case study 3 and (b) case study 4. The ceiling was given transparency to improve visualization.

Figure 12.
Buffer size for (a) walking people and (b) people on wheelchairs.

Figure 13.
A schema of the indoor scenes in which doors are represented in green, main pieces of furniture in blue, and indoor positions selected as origin nodes in red: (a) case studies 1, 2, and 3; (b) case study 4.
Figure 13.
A schema of the indoor scenes in which doors are represented in green, main pieces of furniture in blue, and indoor positions selected as origin nodes in red: (a) case studies 1, 2, and 3; (b) case study 4.

Figure 14.
The resulting indoor paths are represented in green for the tests carried out inside the videoconference room (“Node A to closest door” and “Node B to closest door”) (units in meters).
Figure 14.
The resulting indoor paths are represented in green for the tests carried out inside the videoconference room (“Node A to closest door” and “Node B to closest door”) (units in meters).

Figure 15.
The resulting paths for “Node C to office door” and “Node D to office door” are represented (units in meters).
Figure 15.
The resulting paths for “Node C to office door” and “Node D to office door” are represented (units in meters).

Figure 16.
“Node D to closest exterior door” and “Node D to Node E” tests are represented. In these cases, no obstacles were found in the first indoor path; thus, no iterations were needed (units in meters).
Figure 16.
“Node D to closest exterior door” and “Node D to Node E” tests are represented. In these cases, no obstacles were found in the first indoor path; thus, no iterations were needed (units in meters).

Figure 17.
“Node F to Node G” and “Node H to Node I” tests are represented. While, in the first case, no obstacles were found, in the last case, the destination could not be reached due to the presence of people in the corridor detected as obstacles (units in meters).
Figure 17.
“Node F to Node G” and “Node H to Node I” tests are represented. While, in the first case, no obstacles were found, in the last case, the destination could not be reached due to the presence of people in the corridor detected as obstacles (units in meters).

Figure 18.
Zoomed view of the office room during the “Node C to office door” test for the wheelchair buffer (a) and during the “Node H to Node I” for walking people (b). In both cases, the destination could not be reached due to the presence of static and dynamic obstacles, respectively.
Figure 18.
Zoomed view of the office room during the “Node C to office door” test for the wheelchair buffer (a) and during the “Node H to Node I” for walking people (b). In both cases, the destination could not be reached due to the presence of static and dynamic obstacles, respectively.


Table 1.
Technical characteristics of the FARO Focus3D X 330 and Viametris iMS3D according to the manufacturer datasheet.
Table 1.
Technical characteristics of the FARO Focus3D X 330 and Viametris iMS3D according to the manufacturer datasheet.
| Technical Characteristics | FARO Focus3D X 330 | Viametris iMS3D |
|---|---|---|
| Maximum measurement range | 330 m | 80 m |
| Ranging error | ±2 mm | 30 mm |
| Step size (vertical/horizontal) | 0.009°/0.009° | 0.25°/0.25° |
| Field of view (vertical/horizontal) | 300°/360° | 360°/360° |
| Measurement rate (points per second) | 122,000–976,000 | 86,000 |
| Trajectory | No | Yes |
© 2019 by the authors. Licensee MDPI, Basel, Switzerland. This article is an open access article distributed under the terms and conditions of the Creative Commons Attribution (CC BY) license (http://creativecommons.org/licenses/by/4.0/).
Share and Cite
MDPI and ACS Style
Díaz-Vilariño, L.; Boguslawski, P.; Khoshelham, K.; Lorenzo, H. Obstacle-Aware Indoor Pathfinding Using Point Clouds. ISPRS Int. J. Geo-Inf. 2019, 8, 233. https://doi.org/10.3390/ijgi8050233
AMA Style
Díaz-Vilariño L, Boguslawski P, Khoshelham K, Lorenzo H. Obstacle-Aware Indoor Pathfinding Using Point Clouds. ISPRS International Journal of Geo-Information. 2019; 8(5):233. https://doi.org/10.3390/ijgi8050233
Chicago/Turabian StyleDíaz-Vilariño, Lucía, Pawel Boguslawski, Kourosh Khoshelham, and Henrique Lorenzo. 2019. "Obstacle-Aware Indoor Pathfinding Using Point Clouds" ISPRS International Journal of Geo-Information 8, no. 5: 233. https://doi.org/10.3390/ijgi8050233
Note that from the first issue of 2016, this journal uses article numbers instead of page numbers. See further details here.