Scenario-Based Risk Assessment of Earthquake Disaster Using Slope Displacement, PGA, and Population Density in the Guyuan Region, China


Abstract
:1. Introduction
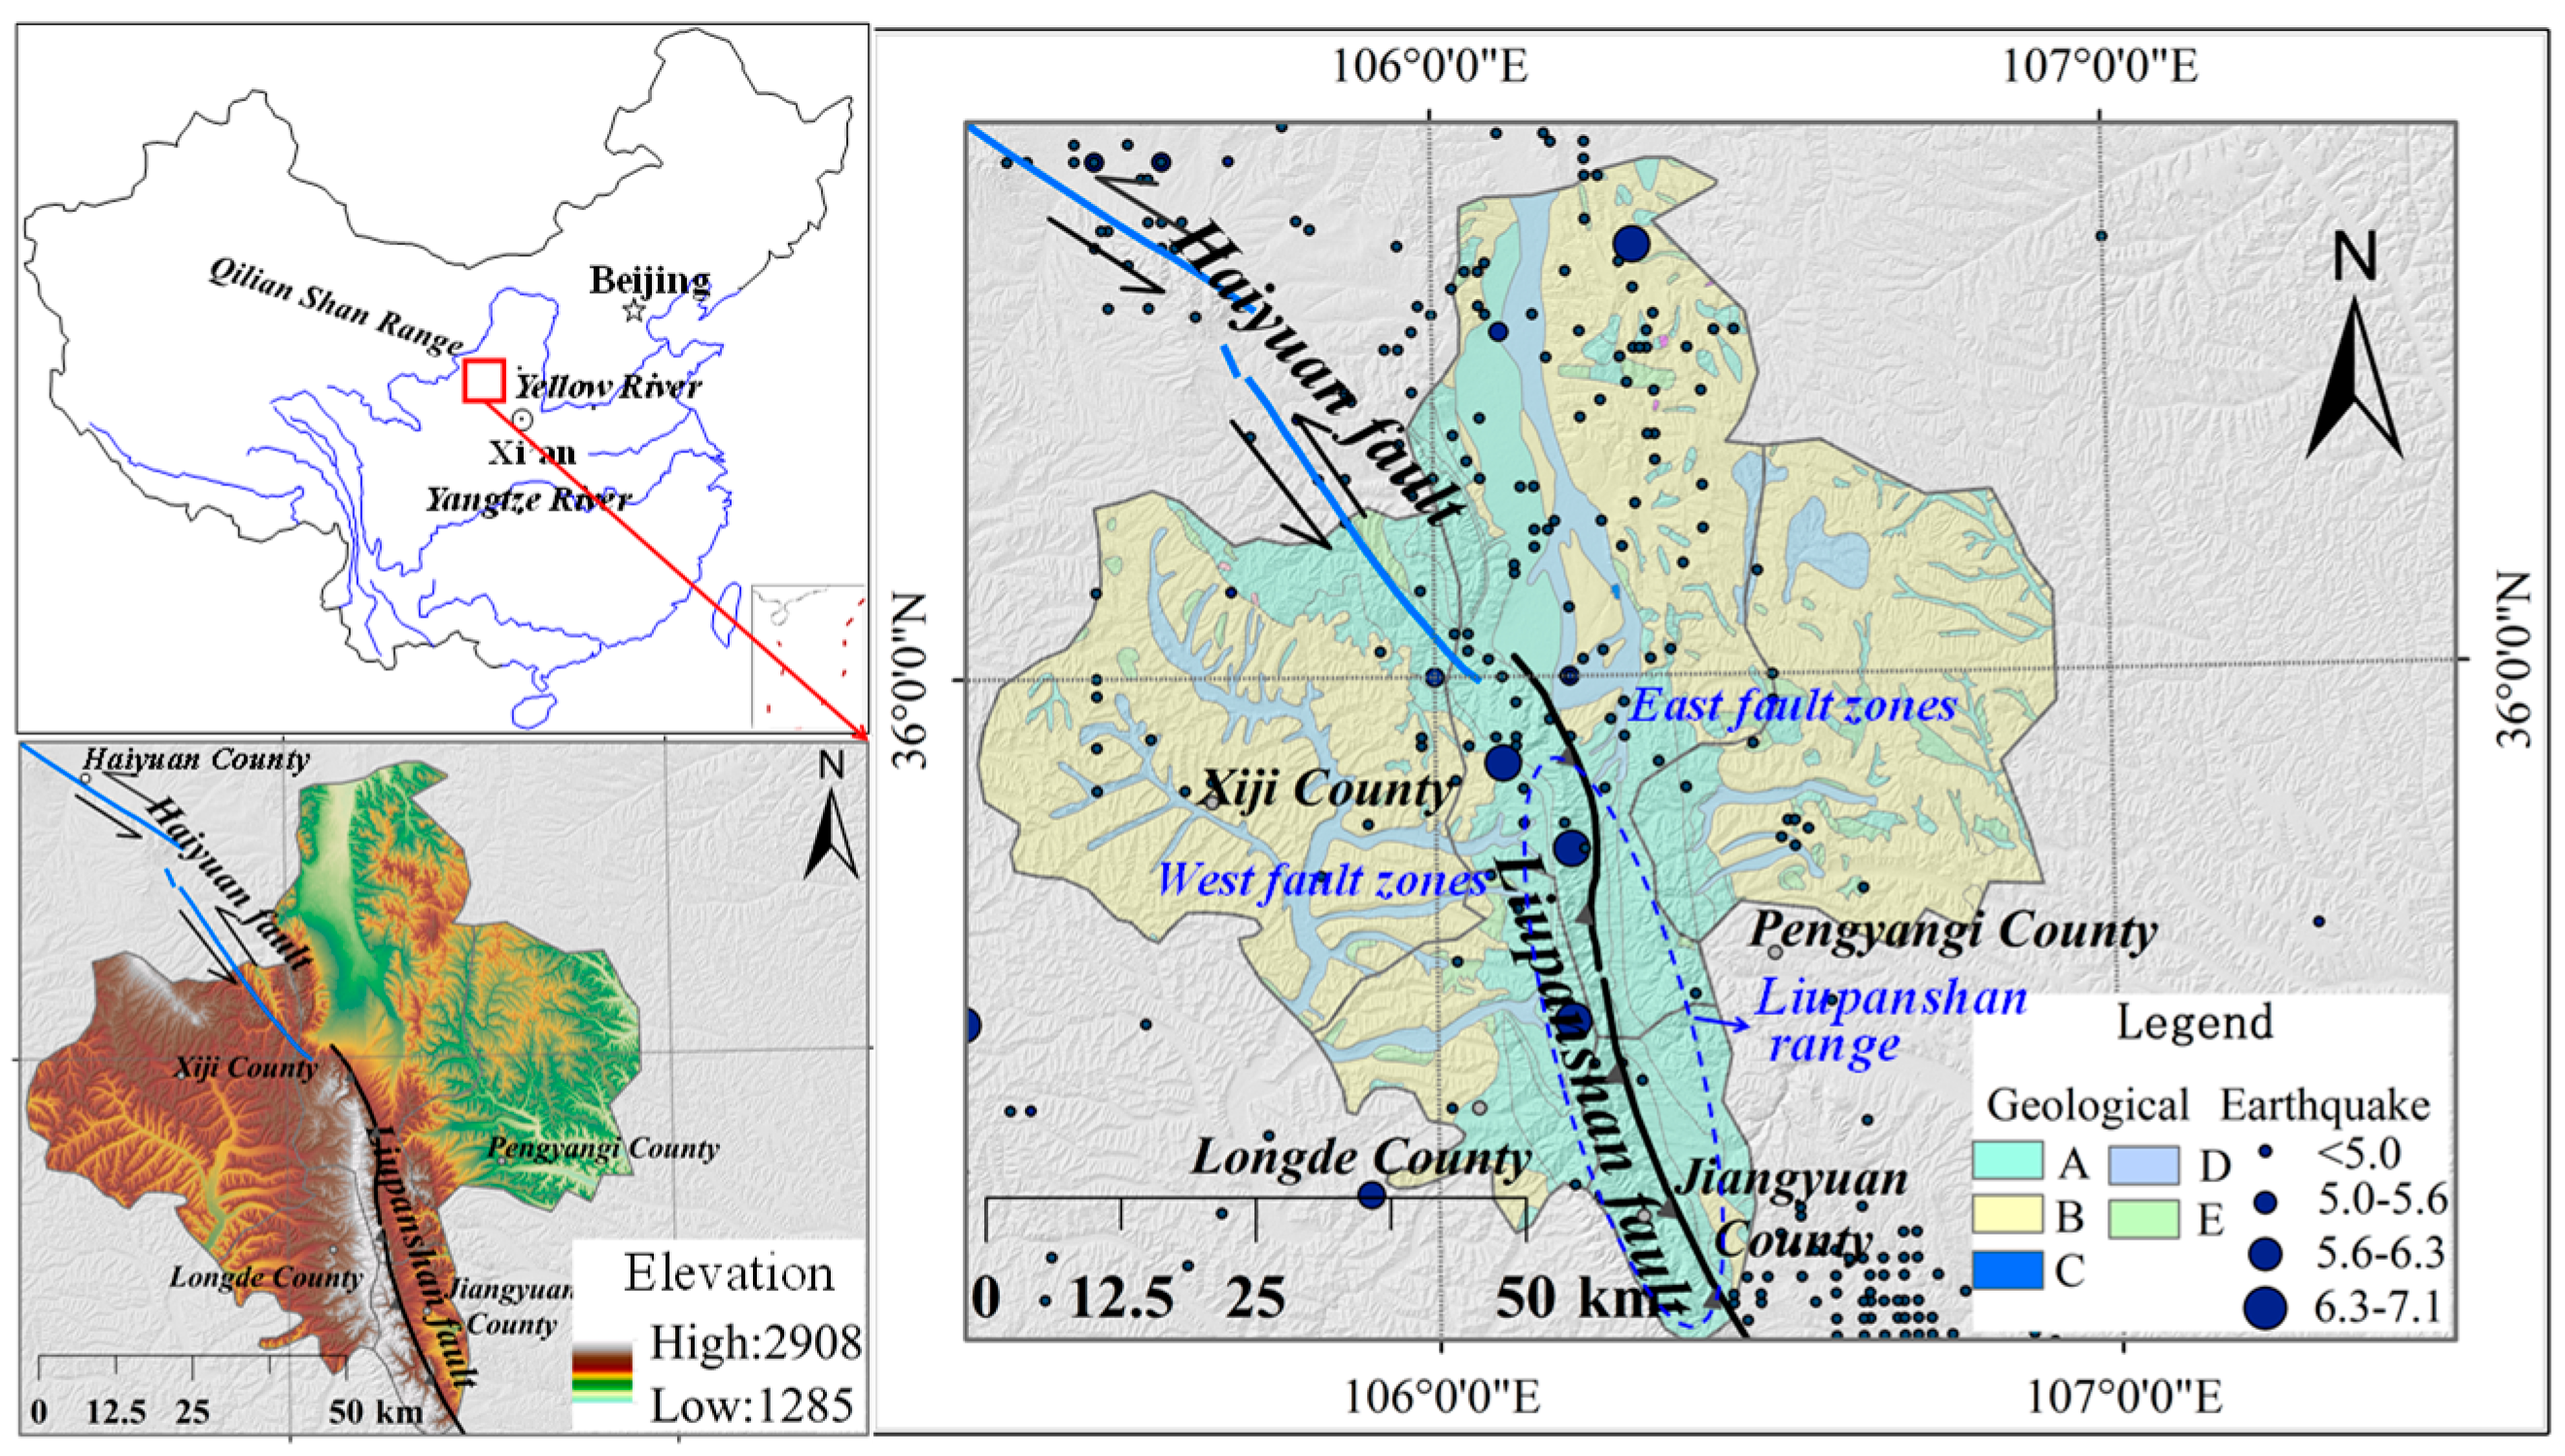
2. Region of Study
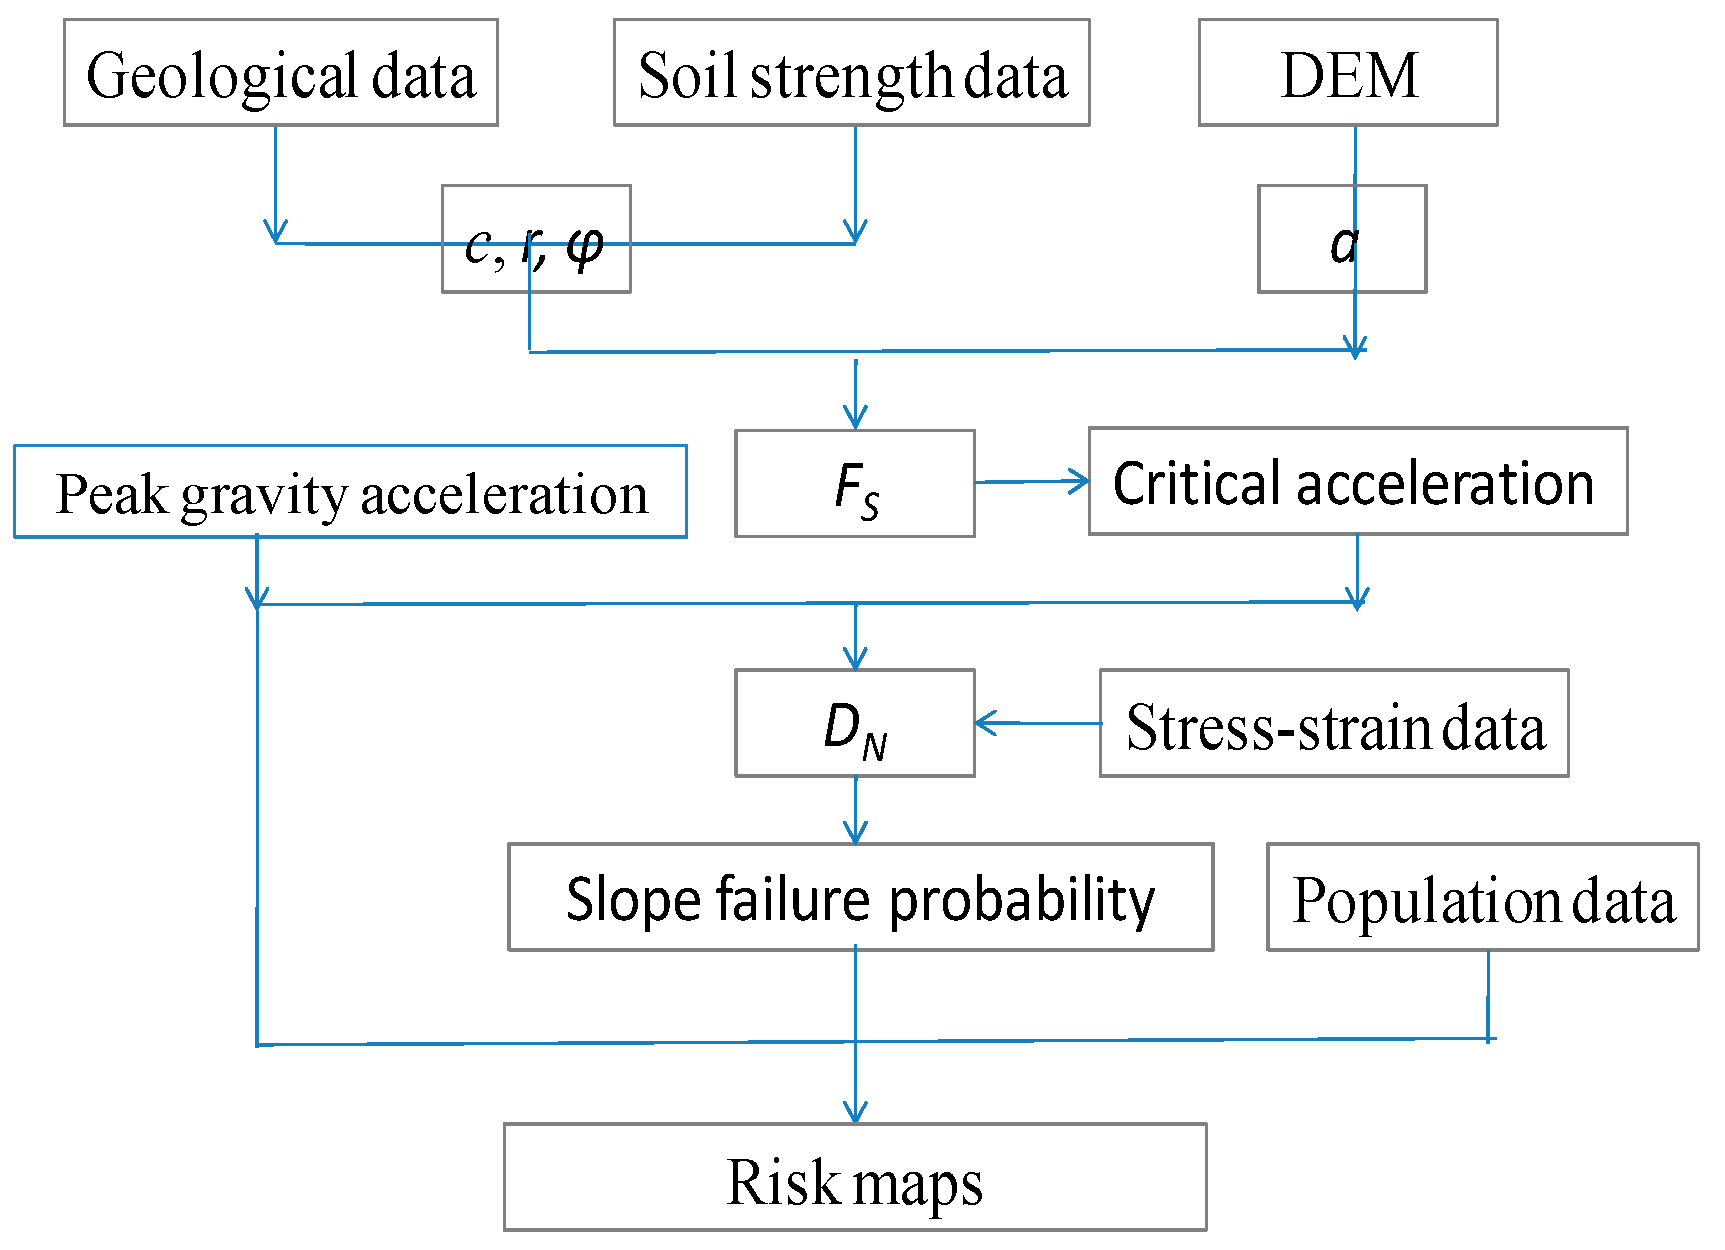
3. Methods and Data Collection
3.1. Landslide Assessment
3.2. Peak Ground Acceleration (PGA)
3.3. Critical Acceleration
3.4. Population Data
3.5. Geological Data and DEM
4. Results
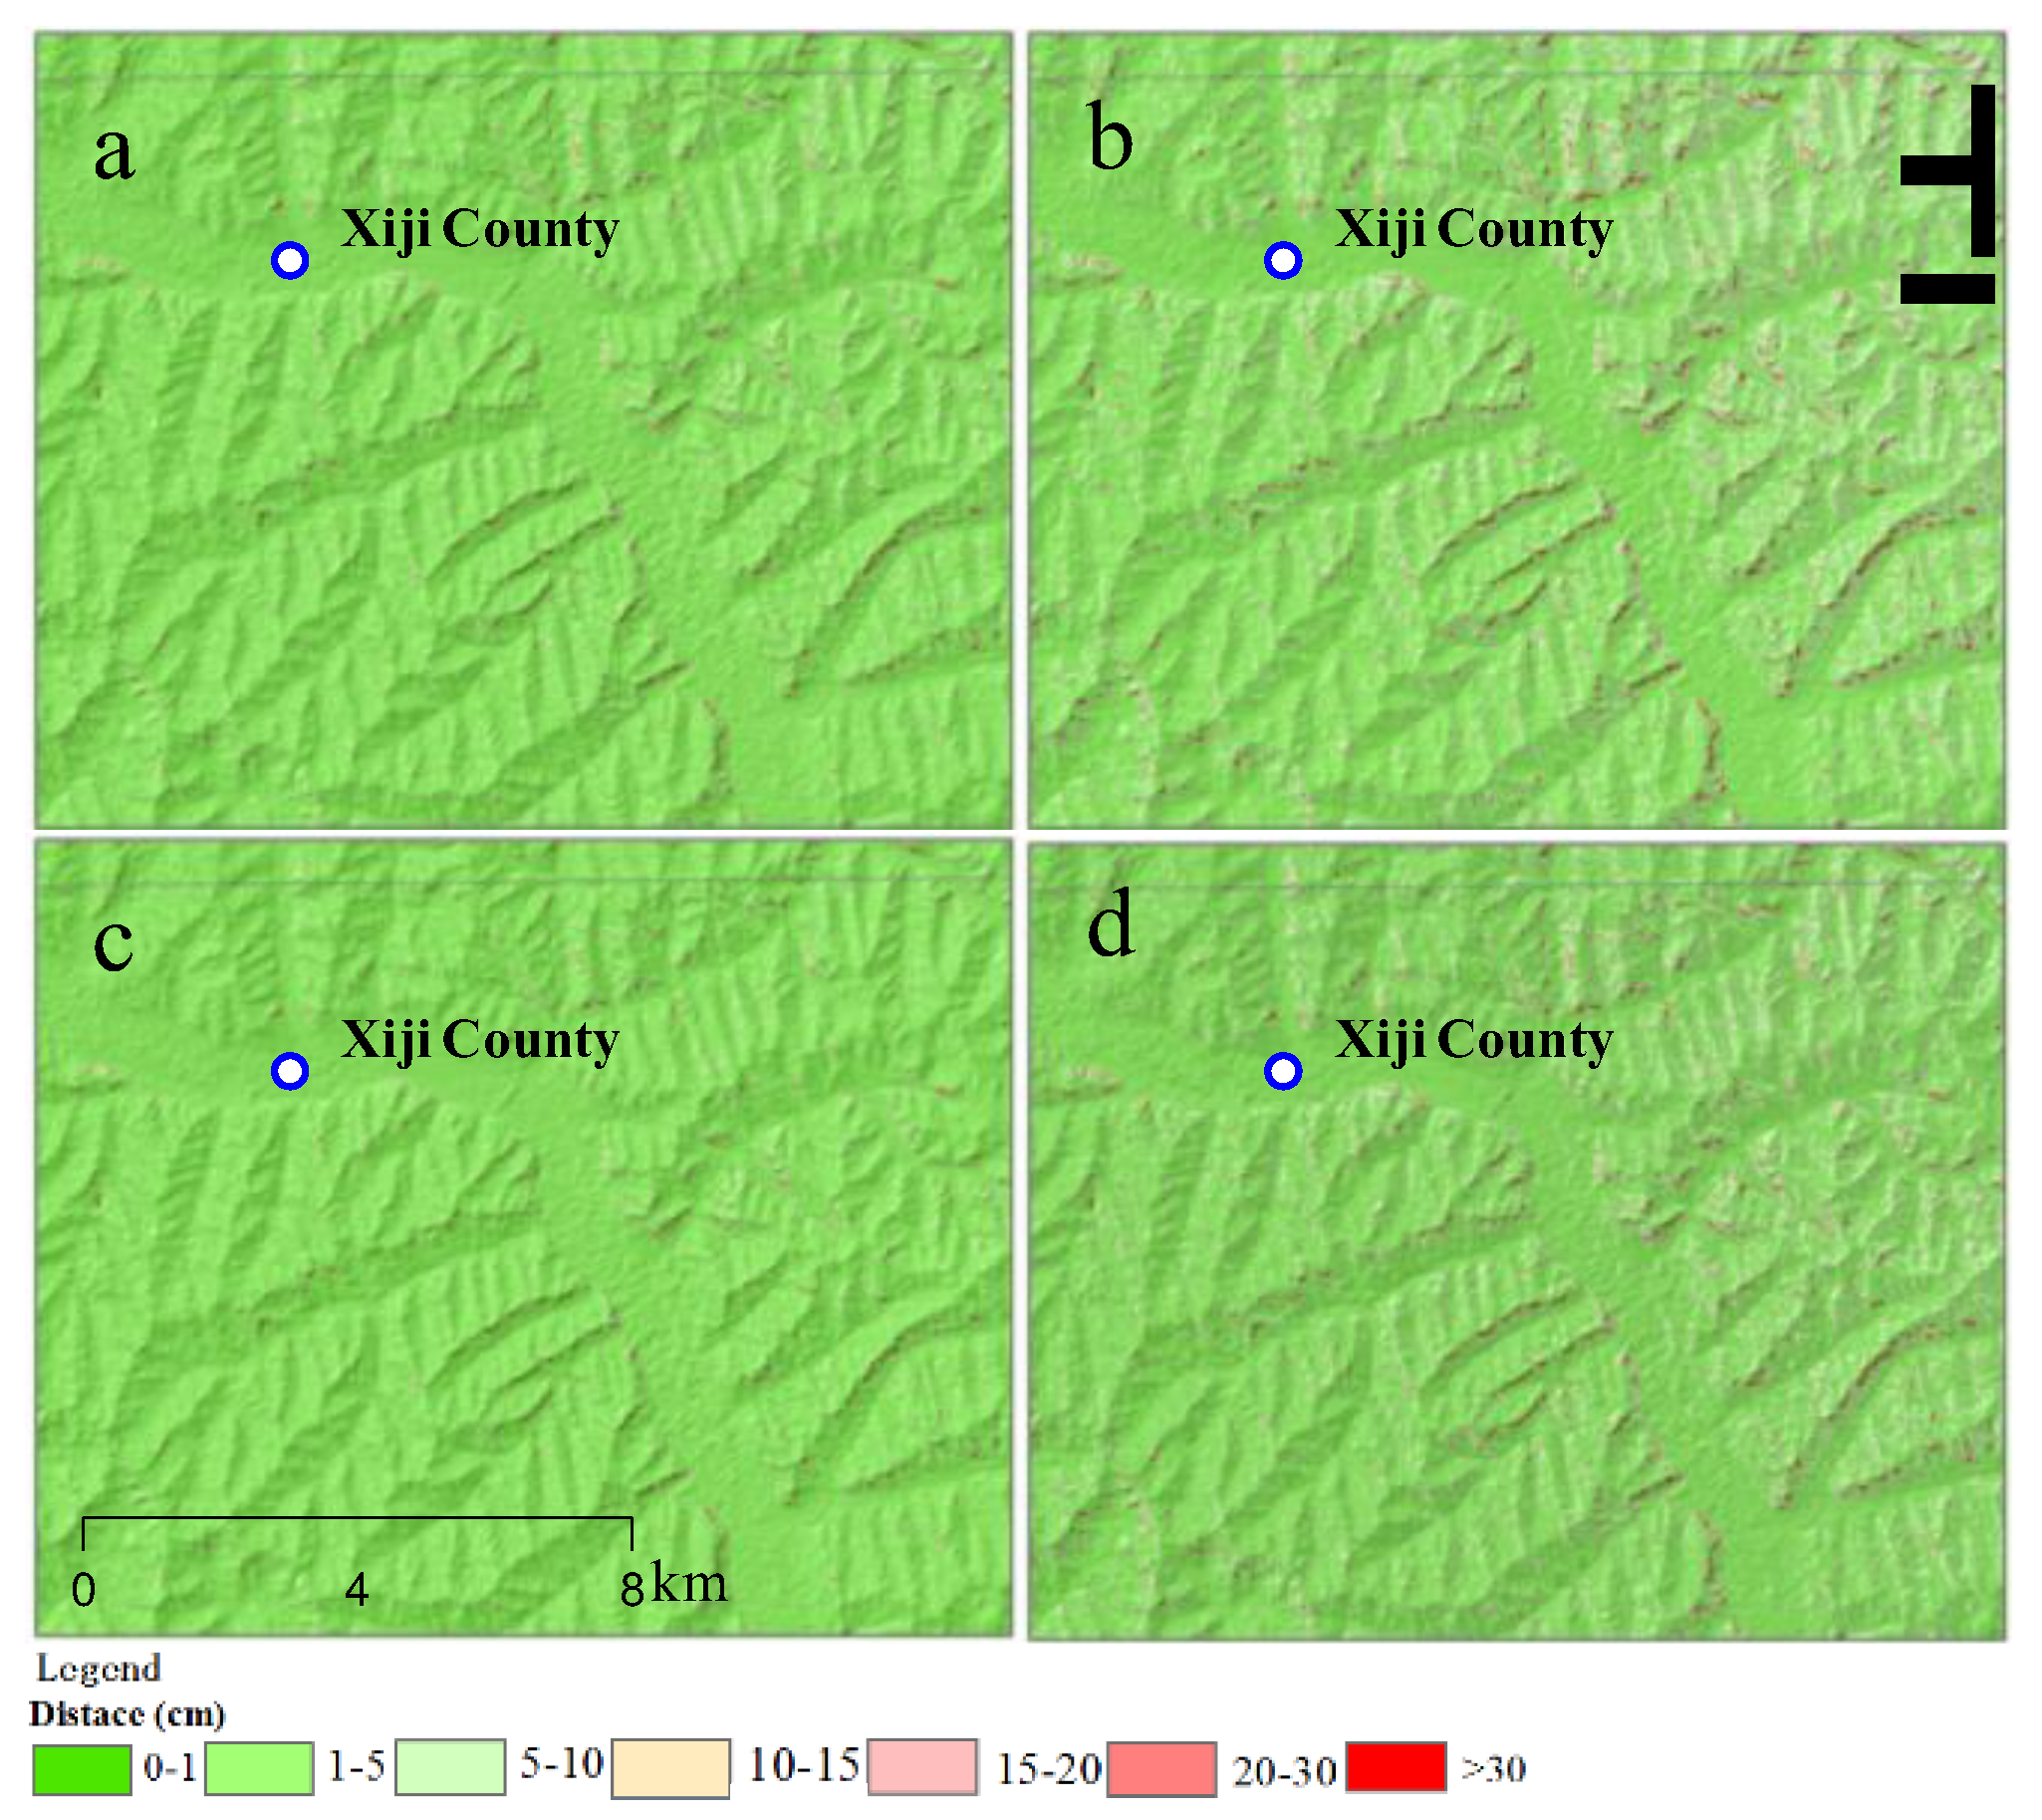
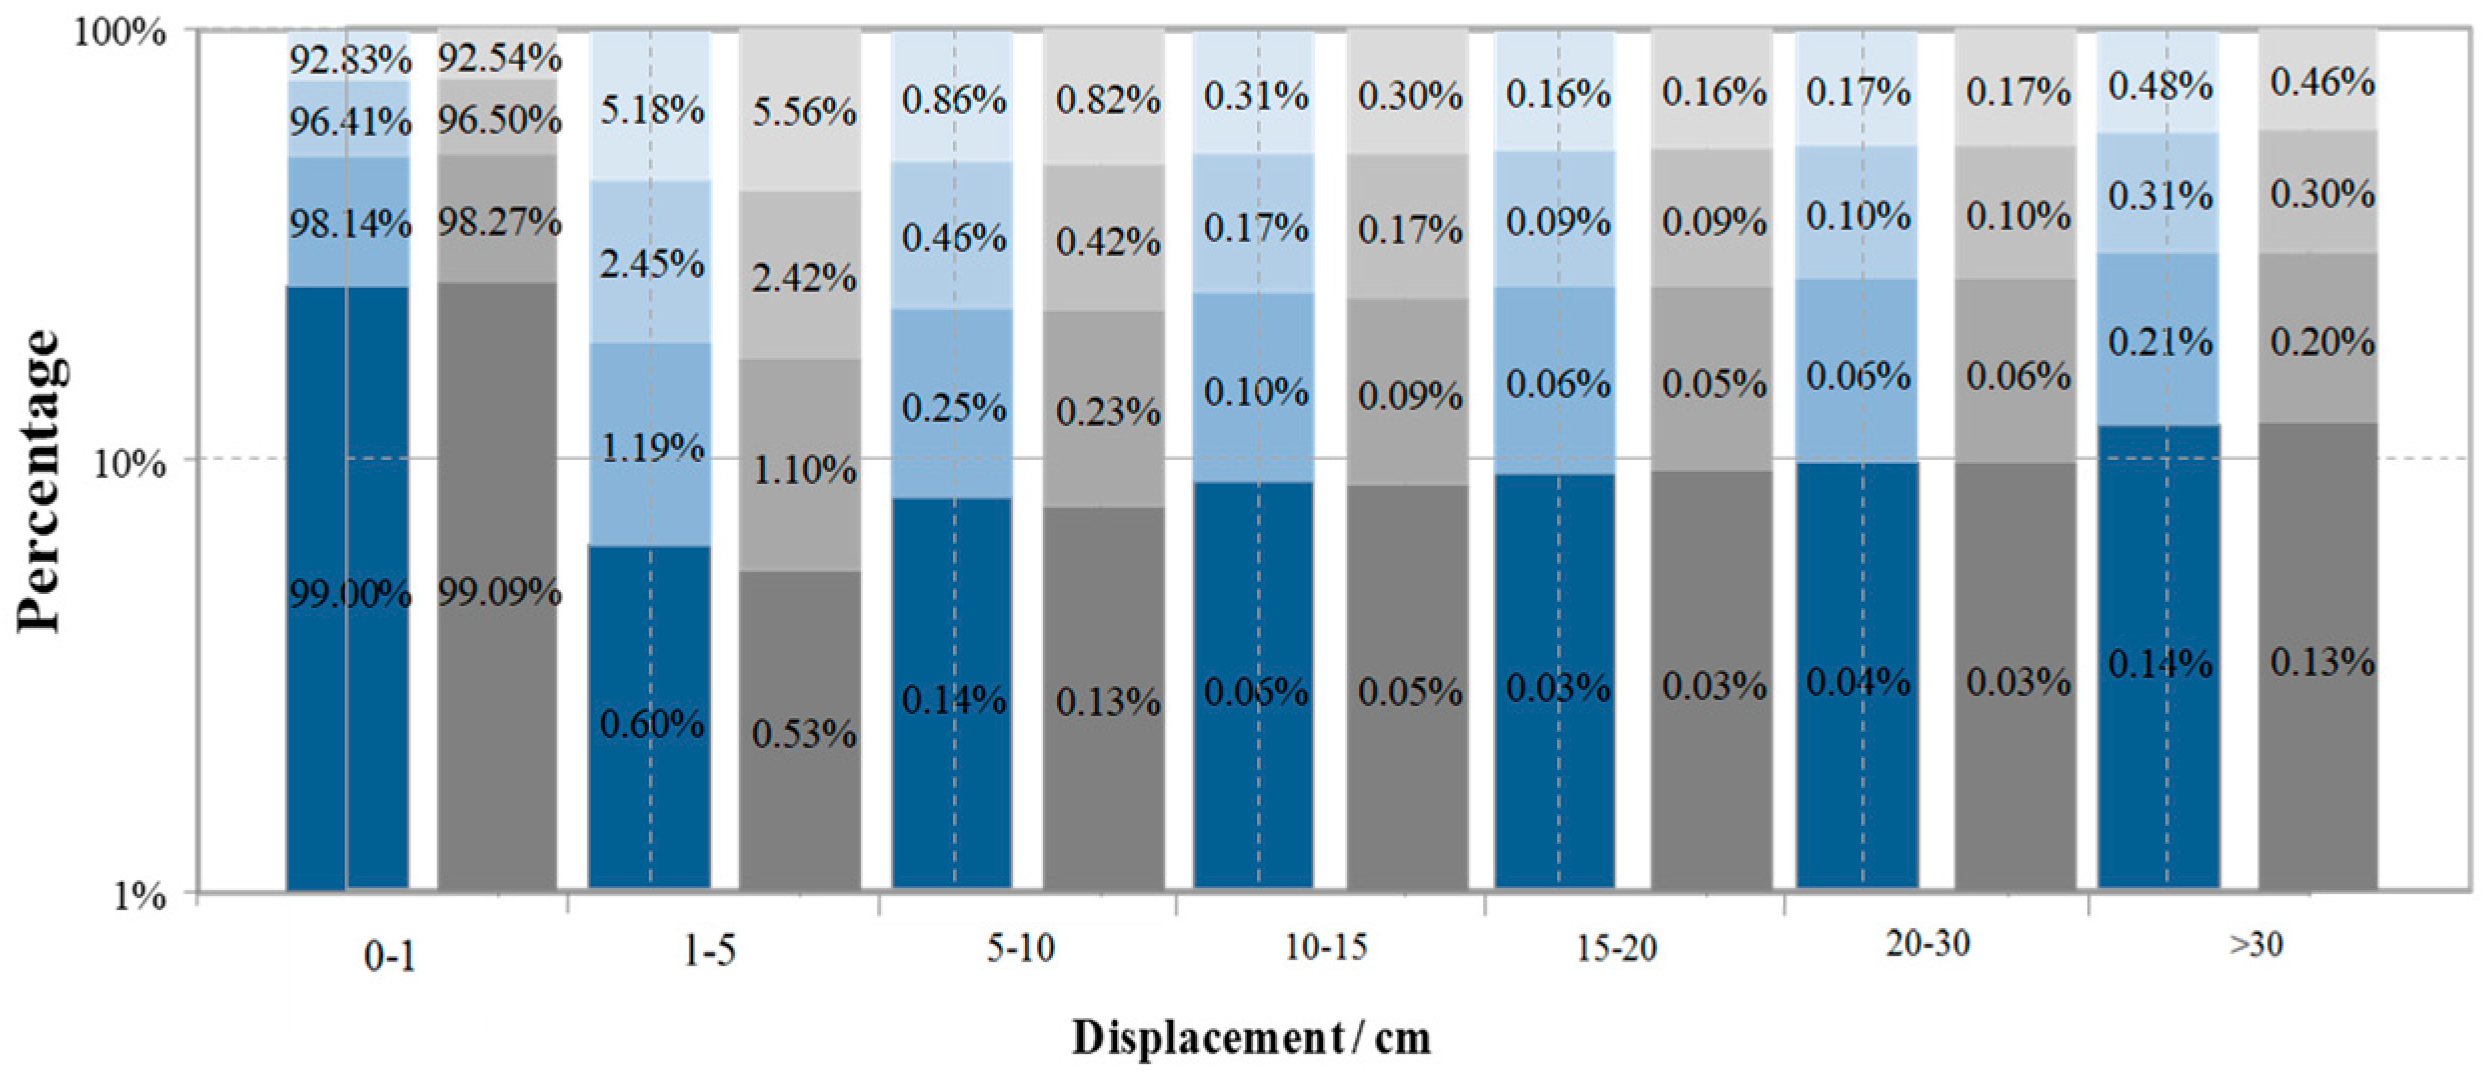
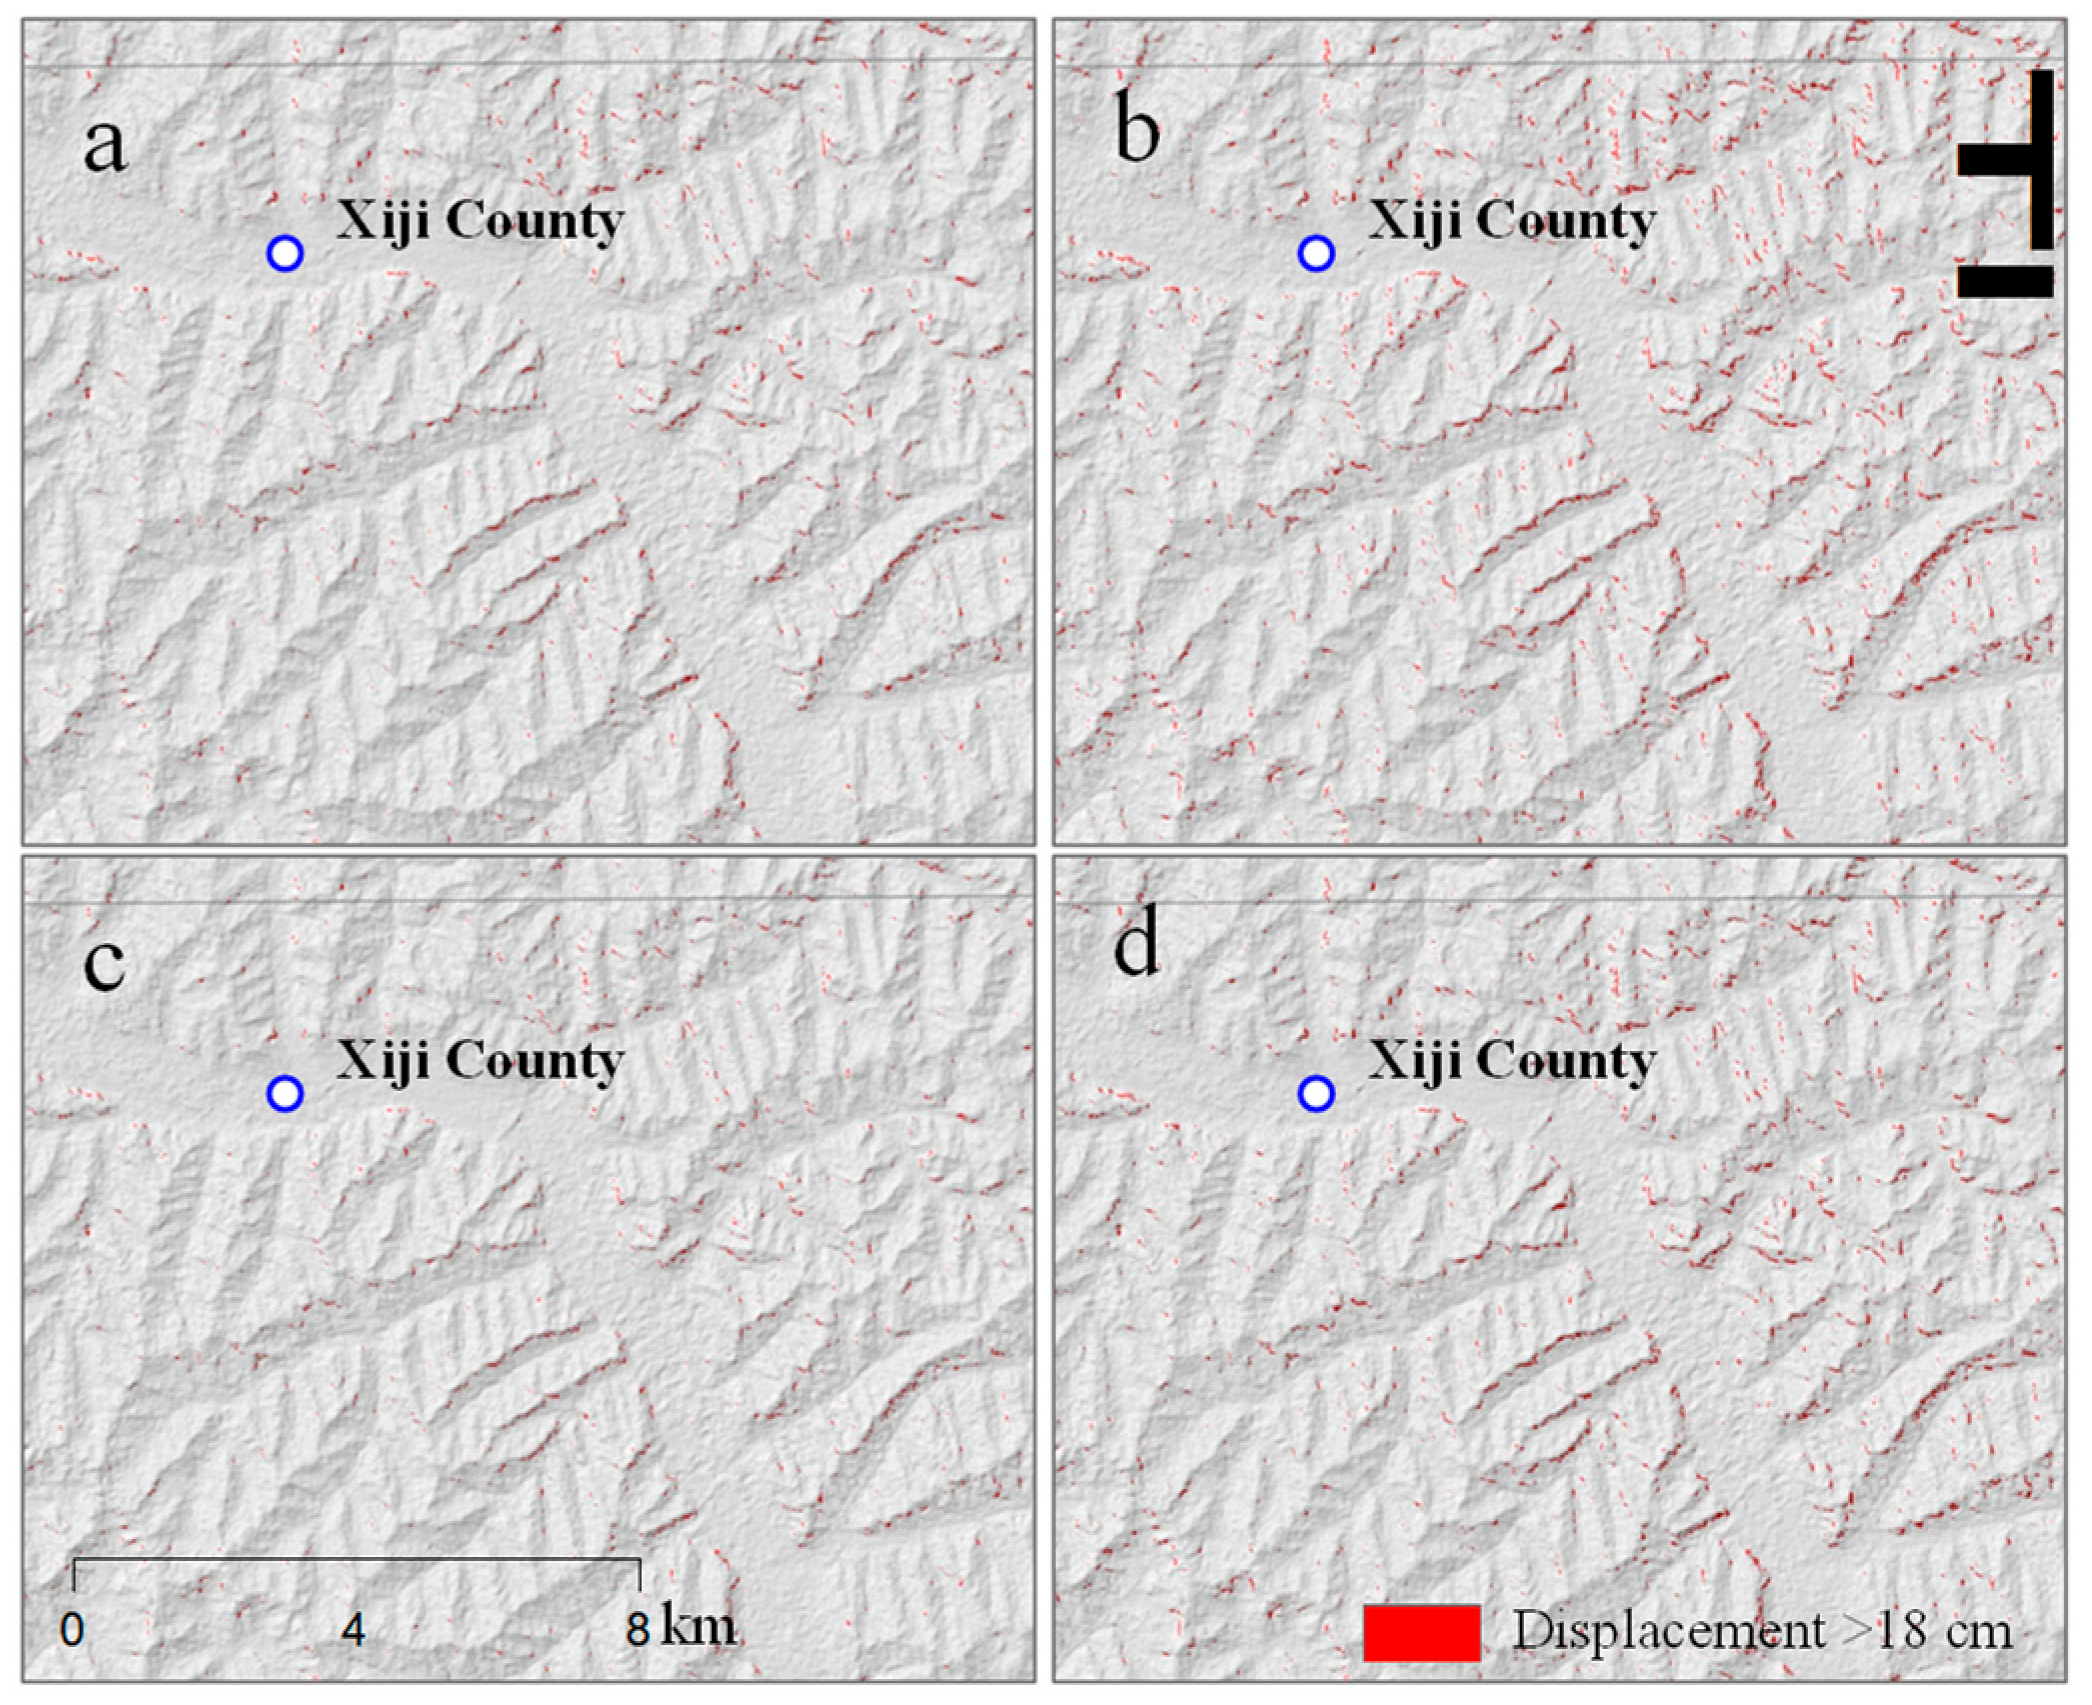
4.1. Earthquake-Induced Landslides
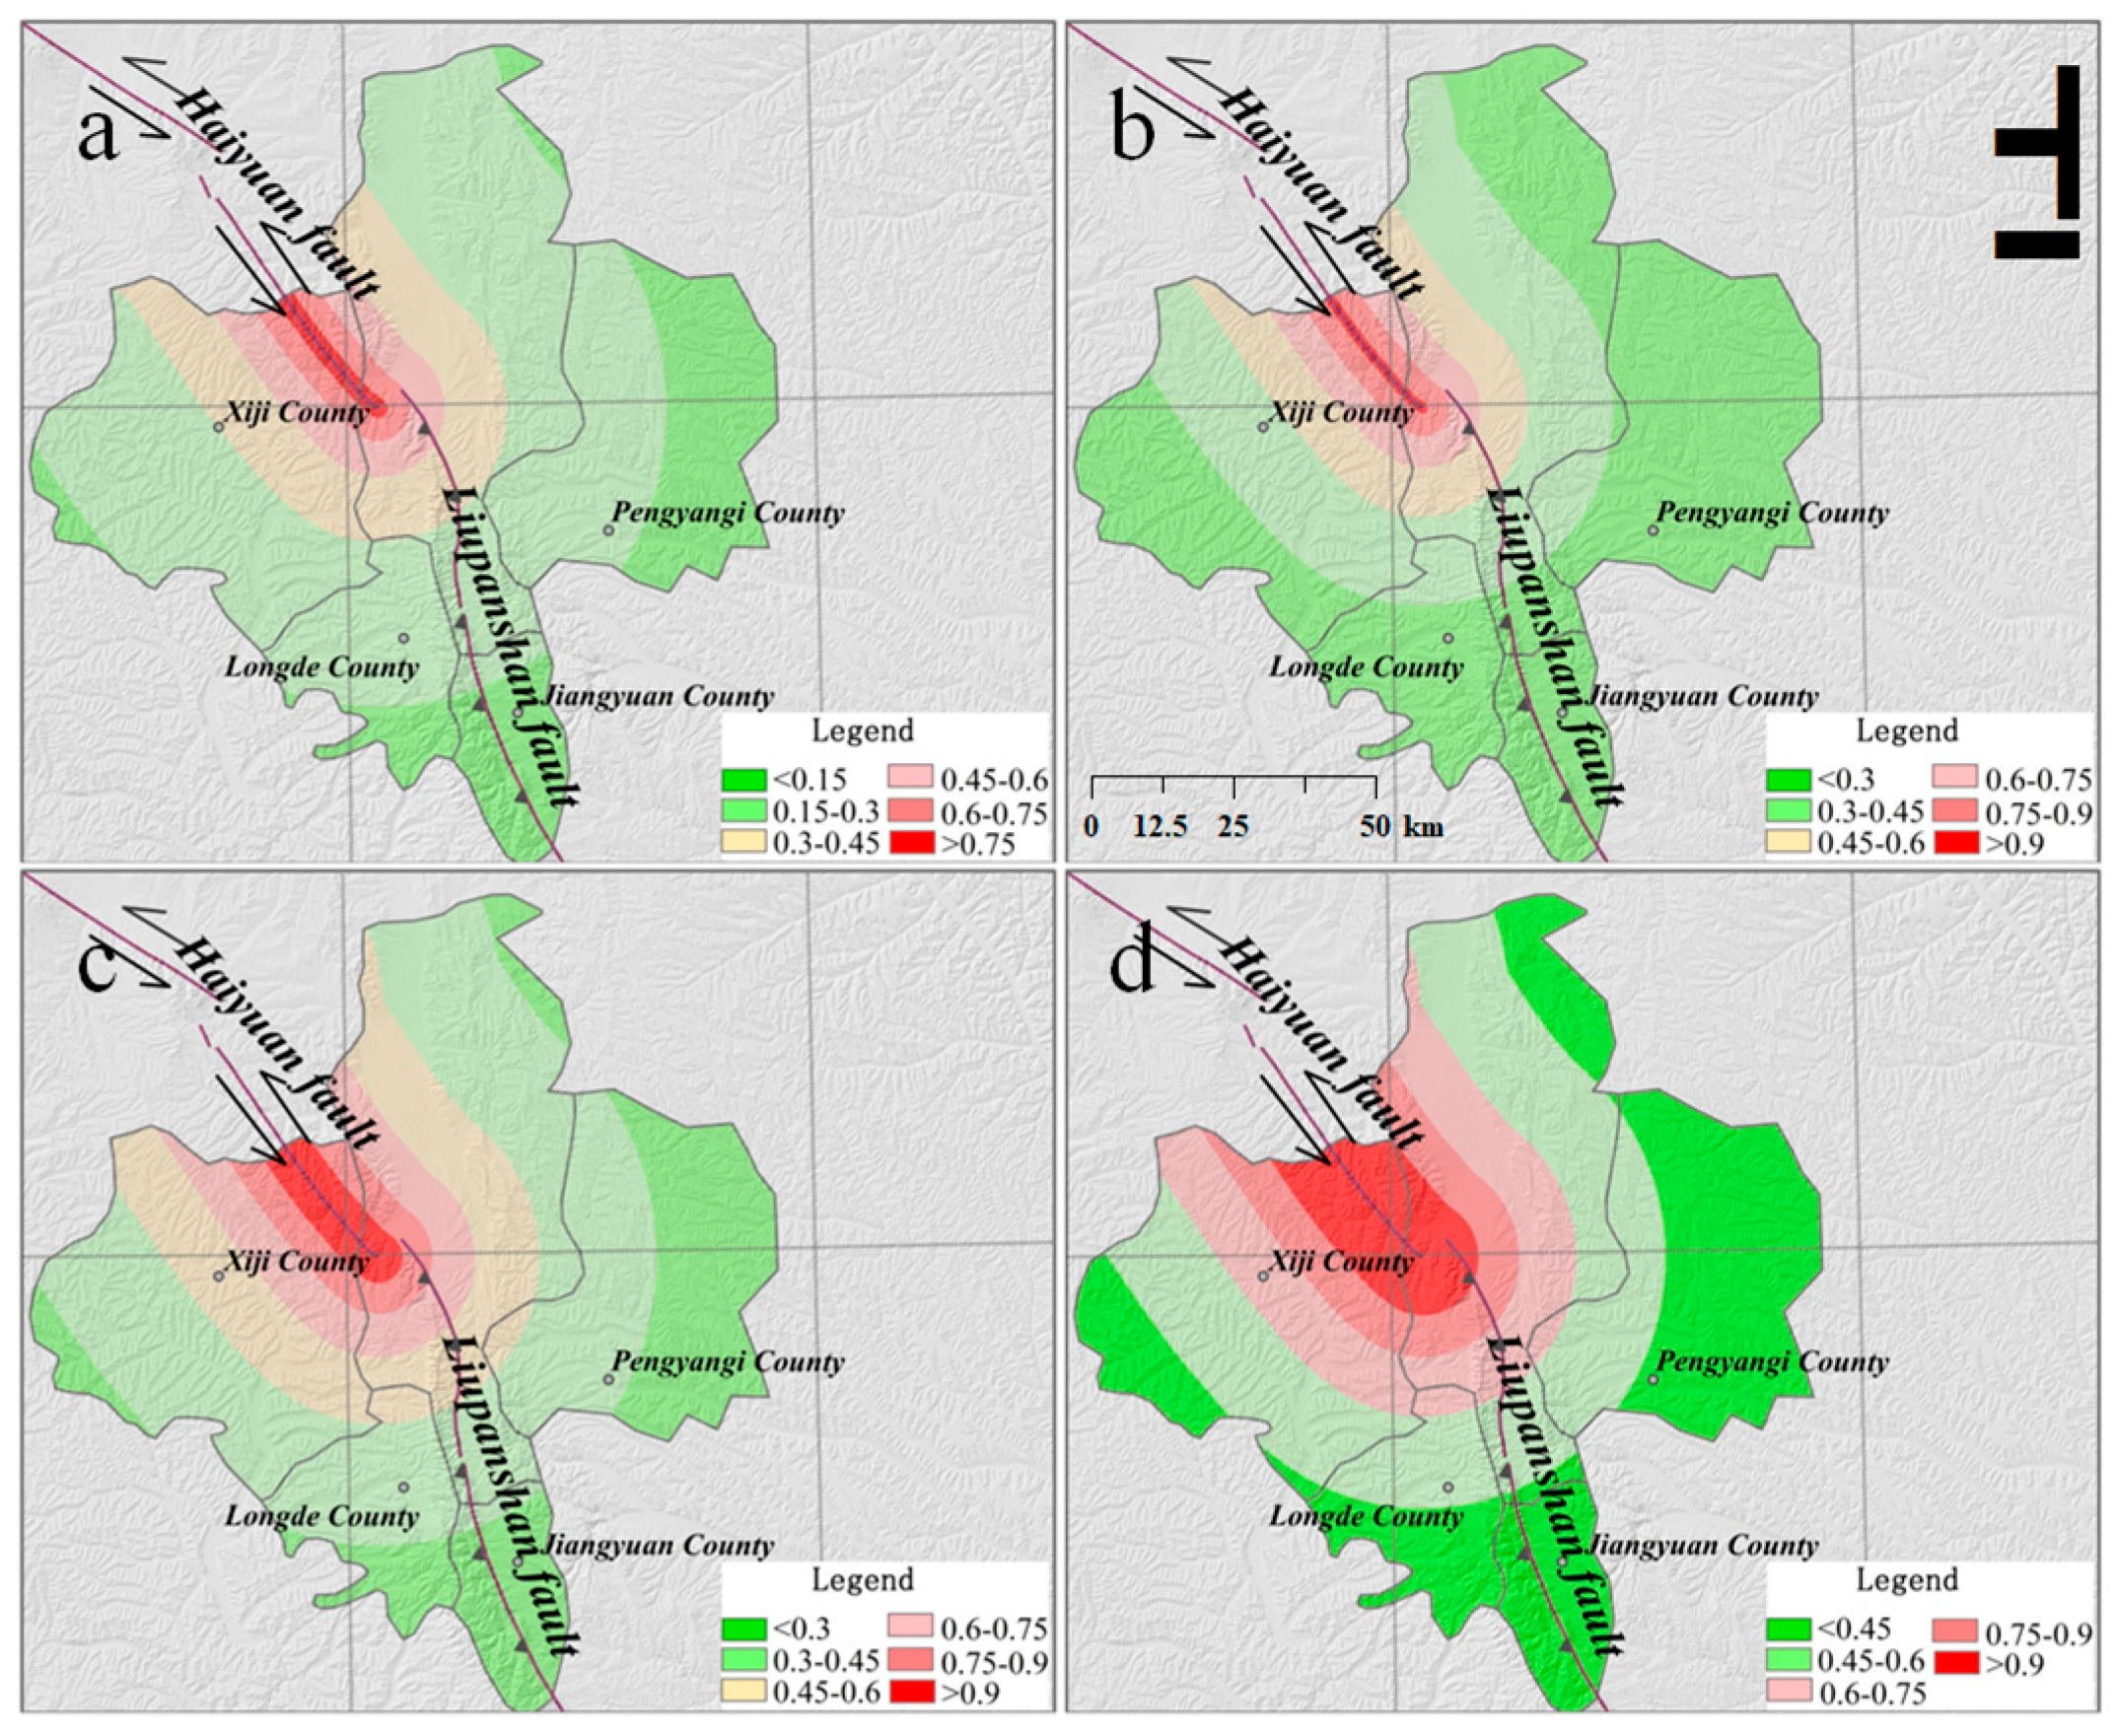
4.2. Peak Ground Acceleration and Population
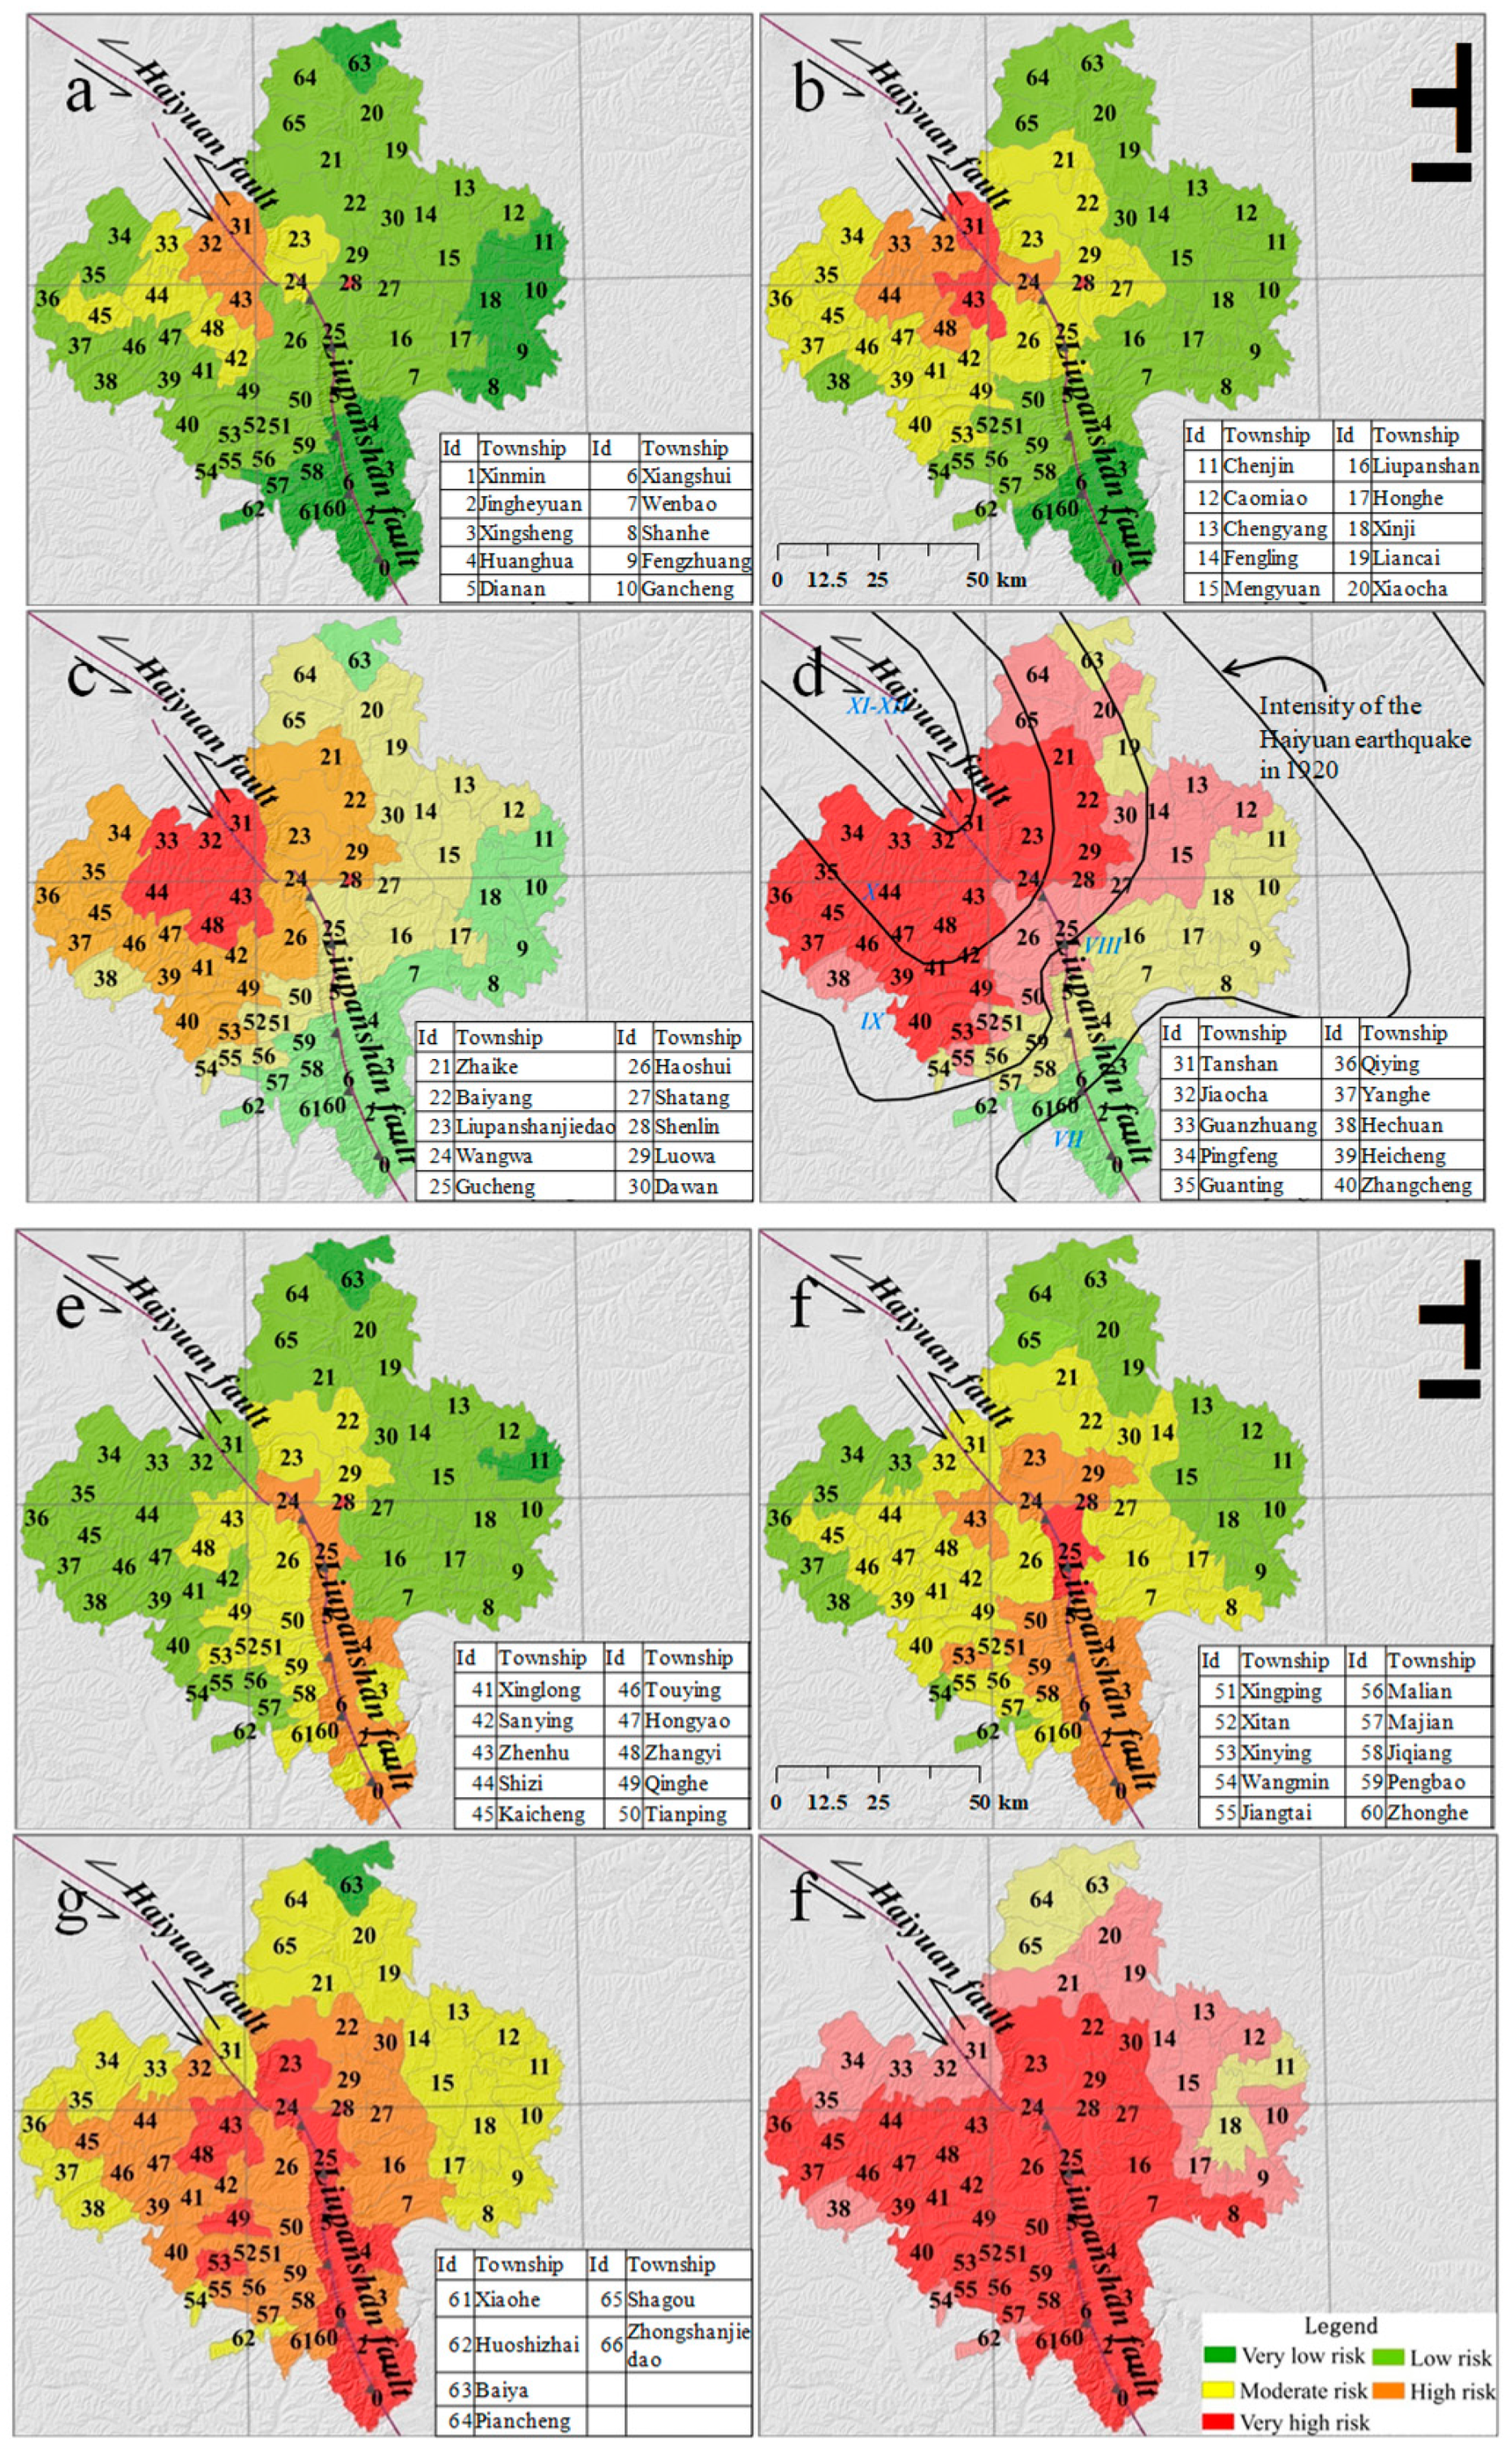
4.3. Scenario-Based Risk Assessment
4.3.1. Haiyuan Risk Zone
4.3.2. Liupanshan Risk Zone
5. Discussion and Conclusions
Author Contributions
Funding
Acknowledgments
Conflicts of Interest
References
- Adams, J.; Rogers, G.; Halchuk, S.; McCormack, D.; Cassidy, J. The case for an advanced national earthquake monitoring system for Canada’s cities at risk. In Proceedings of the 7th US Conference on Earthquake Engineering, Boston, MA, USA, 21–25 July 2002. [Google Scholar]
- Ploeger, S.K.; Atkinson, G.M.; Samson, C. Applying the HAZUS-MH software tool to assess seismic risk in downtown Ottawa, Canada. Nat. Hazards 2010, 53, 1–20. [Google Scholar] [CrossRef]
- Mildon, Z.K.; Roberts, G.P.; Walker, J.P.F.; Iezzi, F. Coulomb stress transfer and fault interaction over millennia on non-planar active normal faults: The Mw 6.5-5.0 seismic sequence of 2016–2017, central Italy. Geophys. J. Int. 2017, 210, 1206–1218. [Google Scholar] [CrossRef]
- Nastev, M. Adapting Hazus for seismic risk assessment in Canada. Can. Geotech. J. 2013, 51, 217–222. [Google Scholar] [CrossRef]
- Cui, P.; Chen, X.Q.; Zhu, Y.Y.; Su, F.H.; Wei, F.Q.; Han, Y.S.; Liu, H.J.; Zhuang, J.Q. The Wenchuan earthquake (May 12, 2008), Sichuan province, China, and resulting geohazards. Nat. Hazards 2011, 56, 19–36. [Google Scholar] [CrossRef]
- Uzielli, M.; Nadim, F.; Lacasse, S.; Kaynia, A.M. A conceptual framework for quantitative estimation of physical vulnerability to landslides. Eng. Geol. 2008, 102, 251–256. [Google Scholar] [CrossRef]
- Clague, J.J.; Bobrowsky, P.T. Evidence for a large earthquake and tsunami 100–400 years ago on western Vancouver Island. Br. Columbia Quat. Res. 1994, 41, 176–184. [Google Scholar] [CrossRef]
- Leblanc, G. A closer look at the September 16, 1732, Montreal earthquake. Can. J. Earth Sci. 1981, 18, 539–550. [Google Scholar] [CrossRef]
- Deng, Q.D.; Chen, S.F.; Song, F.N.; Zhu, S.L.; Wang, Y.P.; Zhang, W.Q.; Jiao, D.C.; Burchfiel, B.C.; Molnar, P.; Royden, L.; et al. Variations in the geometry and amount of slip on the Haiyuan (Nanxihaushan) fault zone, China and the surface rupture of the 1920 Haiyuan earthquake. Earthq. Source Mech. 1986, 37, 169–182. [Google Scholar]
- Wang, J.M. The Fenwei rift and its recent periodic activity. Tectonophysics 1987, 133, 257–275. [Google Scholar] [CrossRef]
- Gao, M.T. New National Seismic Zoning Map of China. Acta Seismol. Sin. 2003, 25, 630–636. [Google Scholar] [CrossRef]
- Han, Y.; Liu, H.; Cui, P.; Su, F.; Du, D. Hazard assessment on secondary mountain-hazards triggered by the Wenchuan earthquake. J. Appl. Remote Sens. 2009, 3, 31645–31660. [Google Scholar]
- Dubos, N.; Sylvander, M.; Souriau, A.; Ponsolles, C.; Chevrot, S.; Fels, J.F.; Benahmed, S. Analysis of the 2002 May earthquake sequence in the central Pyrenees, consequences for the evaluation of the seismic risk at Lourdes, France. Geophys. J. Int. 2004, 156, 527–540. [Google Scholar] [CrossRef]
- Marulanda, M.C.; Carreno, M.L.; Cardona, O.D.; Ordaz, M.G.; Barbat, A.H. Probabilistic earthquake risk assessment using CAPRA: Application to the city of Barcelona, Spain. Nat. Hazards 2013, 69, 59–84. [Google Scholar] [CrossRef]
- Riga, E.; Karatzetzou, A.; Mara, A.; Pitilakis, K. Studying the uncertainties in the seismic risk assessment at urban scale applying the Capacity Spectrum Method: The case of Thessaloniki. Soil Dynam. Earthq. Eng. 2017, 92, 9–24. [Google Scholar] [CrossRef]
- EERI. Theme issue: Loss Estimation. Earthq. Spectra 1997, 4, 795–814. [Google Scholar]
- Silva, V.; Crowley, H.; Pagani, M.; Monelli, D.; Pinho, R. Development of the OpenQuake engine, the Global Earthquake Model’s open-source software for seismic risk assessment. Nat. Hazards 2014, 72, 1409–1427. [Google Scholar] [CrossRef]
- Kircher, C.A.; Whitman, R.V.; Holmes, W.T. HAZUS earthquake loss estimation methods. Nat. Hazards Rev. 2006, 7, 45–59. [Google Scholar] [CrossRef]
- FEMA. HAZUS-MH Technical Manual; Federal Emergency Management Agency: Washington, DC, USA, 2003.
- Beauval, C. Quantifying Sensitivities of PSHA for France to Earthquake Catalog Uncertainties, Truncation of Ground-Motion Variability, and Magnitude Limits. Bull. Seismol. Soc. Am. 2004, 94, 1579–1594. [Google Scholar] [CrossRef]
- Burchfiel, B.C.; Zhang, P.; Wang, Y.; Zhang, W.; Song, F.; Deng, Q.; Molnar, P.; Royden, L. Geology of the Haiyuan fault zone, Ningxia-Hui Autonomous Region, China, and its relation to the evolution of the northeastern margin of the Tibetan Plateau. Tectonics 1991, 10, 1091–1110. [Google Scholar] [CrossRef]
- Zhang, P.; Burchfiel, B.C.; Molnar, P.; Zhang, W.; Jiao, D.; Deng, Q.; Wang, Y.; Royden, L.; Song, F. Amount and style of late Cenozoic deformation in the Liupan Shan area, Ningxia Autonomous Region, China. Tectonics 1991, 10, 1111–1129. [Google Scholar] [CrossRef]
- Seismological Institute of Lanzhou, SSB. And Seismological Team of Ningxia Hui Autonomous Region. Haiyuan Great Earthquake in 1920; Seismological Press: Beijing, China, 1980. [Google Scholar]
- Jing, L.Z.; Shao, Y.X.; Klinger, Y.; Xie, K.J.; Yuan, D.Y.; Lei, Z.S. Variability in magnitude of paleoearthquakes revealed by trenching and historical records, along the Haiyuan Fault, China. J. Geophys. Res. Solid Earth 2015, 120, 8304–8333. [Google Scholar]
- Song, F.M.; Zhu, S.L.; Wang, Y.P.; Deng, D.Q.; Zhang, W.Q. The Maximum Horizontal Displacement in the Haiyuan Earthquake of 1920 and the Estimation of the Earthquake Recurrence along the North Ern Marginal Fault of the Xihuashan. Acta Seismol. Sin. 1983, 5, 29–38. [Google Scholar]
- Xiang, H.F.; Chi, T.; An, L. Active Features of the Eastern Liupanshan Piedmont Reverse Fault Zone Since Late Quaternary. Acta Seismol. Sin. 1998, 20, 321–327. [Google Scholar]
- Lasserre, C.; Morel, P.H.; Gaudemer, Y.; Tapponnier, P.; Ryerson, F.J.; King, G.C.; Metivier, F.; Kasser, M.; Kashgarian, M.; Liu, B.; et al. Postglacial left slip rate and past occurrence of M ≥ 8 earthquakes on the western Haiyuan fault, Gansu, China. J. Geophys. Res. Solid Earth 1999, 104, 17633–17651. [Google Scholar] [CrossRef]
- Cavalié, O.; Lasserre, C.; Doin, M.P.; Peltzer, G.; Sun, J.; Xu, X.; Shen, Z.K. Measurement of interseismic strain across the Haiyuan fault (Gansu, China), by InSAR. Earth Planet. Sci. Lett. 2008, 275, 246–257. [Google Scholar] [CrossRef]
- Jolivet, R.; Lasserre, C.; Doin, M.P.; Guillaso, S.; Peltzer, G.; Dailu, R.; Sun, J.; Shen, Z.; Xu, X. Shallow creep on the Haiyuan Fault (Gansu, China) revealed by SAR interferometry. J. Geophys. Res. 2012, 117, B06401. [Google Scholar] [CrossRef]
- Zhang, P.; Molnar, P.; Burchfiel, B.C.; Royden, L.; Zhang, W.; Jiao, D.; Deng, Q.; Wang, Y.; Song, F. Bounds on the recurrence interval ofmajor earthquakes along the Haiyuan fault in north-central China. Seismol. Res. Lett. 1988, 59, 81–89. [Google Scholar]
- Zhang, Z.; Wang, L. Geological disasters in loess areas during the 1920 Haiyuan Earthquake, China. GeoJournal 1995, 36, 269–274. [Google Scholar] [CrossRef]
- Zhang, D.; Wang, G. Study of the 1920 Haiyuan earthquake-induced landslides in loess (China). Eng. Geol. 2007, 94, 76–88. [Google Scholar] [CrossRef]
- Zhuang, J.; Peng, J.; Xu, C.; Li, Z.; Densmore, A.; Milledge, D.; Iqbal, J.; Cui, Y. Distribution and characteristics of loess landslides triggered by the 1920 Haiyuan Earthquake, Northwest of China. Geomorphology 2018, 314, 1–12. [Google Scholar] [CrossRef]
- Zhang, P.; Min, W.; Deng, Q.; Mao, F. Paleoearthquake rupture behavior and recurrence of great earthquakes along the Haiyuan Fault, northwestern China. Sci. China Ser. D 2003, 46, 705–713. [Google Scholar] [CrossRef]
- Zhang, X.K.; Shi, Z.M.; Jiang, F.Y.; Zhu, L.Y.; Wang, X. Research on Late Tectonic Deformation Evolvement of Huaiyuan-Liupanshan Arc Fault and Its Surrounding Area. J. Geodesy Geodynam. 2011, 31, 20–24. [Google Scholar]
- Dolšek, M. Simplified method for seismic risk assessment of buildings with consideration of aleatory and epistemic uncertainty. Struct. Infrastruct. Eng. 2012, 8, 939–953. [Google Scholar] [CrossRef]
- Vecere, A.; Monteiro, R.; Ammann, W.J.; Giovinazzi, S.; Santos, R.H.M. Predictive models for post disaster shelter needs assessment. Int. J. Disaster Risk Reduct. 2017, 21, 44–62. [Google Scholar] [CrossRef]
- Uzielli, M.; Lacasse, S. Scenario-based probabilistic estimation of direct loss for geohazards. Georisk 2007, 1, 142–154. [Google Scholar] [CrossRef]
- Varnes, D.J. Landslide Hazard Zonation: A Review of Principles and Practice; UNESCO: Paris, France, 1984. [Google Scholar]
- Fell, R. Landslide risk assessment and acceptable risk. Can. Geotech. J. 1994, 31, 261–272. [Google Scholar] [CrossRef]
- Lee, E.M.; Jones, D.K. Landslide Risk Assessment; Thomas Telford: London, UK, 2004. [Google Scholar]
- Van Westen, C.J.; Trelirn, T.J. An approach deterministic landslide hazard analysis in GIS: A case study Manizales (Colombia). Earth Surf. Process. Landf. 1996, 21, 853–868. [Google Scholar] [CrossRef]
- Boore, D.M.; Atkinson, G.M. Ground-motion prediction equations for the average horizontal component of PGA, PGV, and 5%-damped PSA at spectral periods between 0.01 s and 10.0 s. Earthq. Spectra 2008, 24, 99–138. [Google Scholar] [CrossRef]
- Chen, N.; Lin, Z.J. A study on the dynamic relationship between the economy & gross population and its spatial distribution feature. Sci. Surv. Mapp. 2008, 31, 14–16. [Google Scholar]
- Newmark, N.M. Effects of earthquakes on dams and embankments. Geotechnique 1965, 15, 139–160. [Google Scholar] [CrossRef]
- Jibson, R.W. Regression models for estimating coseismic landslide displacement. Eng. Geol. 2007, 91, 209–218. [Google Scholar] [CrossRef]
- Wang, Y.; Song, C.; Lin, Q.; Li, J. Occurrence probability assessment of earthquake-triggered landslides with Newmark displacement values and logistic regression: The Wenchuan earthquake, China. Geomorphology 2016, 258, 108–119. [Google Scholar] [CrossRef]
- Yuan, R.; Deng, Q.; Cunningham, D.; Han, Z.; Zhang, D.; Zhang, B. Newmark displacement model for landslides induced by the 2013 Ms 7.0 Lushan earthquake, China. Front. Earth Sci. 2016, 10, 740–750. [Google Scholar] [CrossRef]
- Ebeling, R.M.; Fong, M.T.; Yule, D.E.; Chase, S.A.; Kale, R.V. Permanent Seismically Induced Displacement of Rock-Founded Structures Computed by the Newmark Program; Program No, ERDC TR-09-2; U.S. Army Corps of Engineers, Flood and Coastal Storm Damage Reduction Research and Development: Vicksburg, MS, USA, 2009.
- Romeo, R. Seismically induced landslide displacements: A predictive model. Eng. Geol. 2000, 58, 337–351. [Google Scholar] [CrossRef]
- Saygili, G.; Rathje, E.M. Empirical predictive models for earthquake–induced sliding displacements of slopes. J. Geotech. Geoenviron. Eng. 2008, 134, 790–803. [Google Scholar] [CrossRef]
- Xu, X.G.; Yao, L.K.; Li, C.H.; Wang, X.F. Predictive models for permanent displacement of slopes based on recorded strong-motion data of Wenchuan earthquake. Chin. J. Geotech. Eng. 2012, 4, 1131–1136. [Google Scholar]
- Campbell, K.W. Near-source attenuation of peak horizontal acceleration. Bull. Seismol. Soc. Am. 1981, 71, 2039–2070. [Google Scholar]
- Joyner, W.B.; Boore, D.M. Peak horizontal acceleration and velocity from strong-motion records including records from the 1979 Imperial Valley, California, earthquake. Bull. Seismol. Soc. Am. 1981, 71, 2011–2038. [Google Scholar]
- Yang, F.; Luo, Q.F.; Li, B.Q.; Che, W. Acceleration Peak Attenuation Relationship of Loess Region in Northwestern China on the Basis of Wenchuan Earthquake. J. Beijing Univ. Technol. 2011, 37, 1487–1492. [Google Scholar]
- Van Westen, C.J.; Van Asch, T.W.; Soeters, R. Landslide hazard and risk zonation-why is it still so difficult? Bull. Eng. Geol. Environ. 2006, 65, 167–184. [Google Scholar] [CrossRef]
- Ministry of Construction of the People’s Republic of China. Code for Investigation of Geotechnical Engineering; 2009-GB 50021 2001; Ministry of Construction of the People’s Republic of China: Beijing, China, 2009.
- Derbyshire, E.; Wang, J.; Meng, X. A treacherous terrain: Background to Nat. Hazards in northern China, with special reference to the history of landslides in Gansu Province. In Landslides in the thick Loess Terrain of North-West China; Wiley: New York, NY, USA, 2000. [Google Scholar]
- Zhuang, J.; Peng, J.; Wang, G.; Iqbal, J.; Wang, Y.; Li, W.; Xu, Q.; Zhu, X. Prediction of rainfall-induced shallow landslides in the Loess Plateau, Yan’an, China, using the TRIGRS model. Earth Surf. Process. Landf. 2017, 42, 915–927. [Google Scholar] [CrossRef]
- Zhuang, J.; Peng, J.; Wang, G.; Javed, I.; Wang, Y.; Li, W. Distribution and characteristics of landslide in Loess Plateau: A case study in Shaanxi province. Eng. Geol. 2018, 236, 89–96. [Google Scholar] [CrossRef]
- Cheng, H.T.; Liu, B.J.; Xie, Y.L. Stress-strain-time behavior of compacted loess. J. Chang’an Univ. 2008, 28, 6–9. [Google Scholar]
- Li, T.; Wang, P.; Xi, Y. The mechanisms for initiation and motion of Chinese loess landslides. In Progress of Geo-Disaster Mitigation Technology in Asia; Springer: Berlin/Heidelberg, Germany, 2013; pp. 105–122. [Google Scholar]
- Xu, L.; Dai, F.; Tu, X.; Tham, L.G.; Zhou, Y.; Iqbal, J. Landslides in a loess platform, North-West China. Landslides 2014, 11, 993–1005. [Google Scholar] [CrossRef]
- Dai, F.C.; Xu, C.; Yao, X.; Xu, L.; Tu, X.B.; Gong, Q.M. Spatial distribution of landslides triggered by the 2008 Ms 8.0 Wenchuanearthquake, China. J. Asian Earth Sci. 2011, 40, 883–895. [Google Scholar] [CrossRef]
- Ding, B.R.; Sun, J.J.; Du, K.; Luo, H. Study on the correction between effective peak ground acceleration and seismic intensity. Earthq. Res. Sichuan 2017, 37, 26–36. [Google Scholar]
- Gao, M.T.; Lu, S.D. The Discussion on Principles of Seismic Zonation of the Next Generation. Technol. Earthq. Disaster Prev. 2006, 1, 1–6. [Google Scholar]
- Refice, A.; Capolongo, D. Probabilistic modeling of uncertainties in earthquake-induced landslide hazard assessment. Comput. Geosci. 2002, 28, 735–749. [Google Scholar] [CrossRef]
- Baum, R.L.; Godt, J.W.; Savage, W.Z. Unsaturated zone effects in predicting landslide and debris-flow initiation. In AGU Fall Meeting Abstracts; H54B-06; American Geophysical Union: Washington, DC, USA, 2006; Volume 7. [Google Scholar]
- Godt, J.W.; Baum, R.L.; Savage, W.Z.; Salciarini, D.; Schulz, W.H.; Harp, E.L. Transient deterministic shallow landslide modeling: Requirements for susceptibility and hazard assessments in a GIS framework. Eng. Geol. 2008, 102, 214–226. [Google Scholar] [CrossRef]
- Xu, Q.; Tang, M.; Xu, K.; Huang, X. Research on space-time evolution laws and early warning-prediction of landslides. Chin. J. Rock Mech. Eng. 2008, 27, 1104–1112. [Google Scholar]


| Hardness | Very Hard | Hard | Moderate | Soft | Very Soft |
|---|---|---|---|---|---|
| φ (°) | 50 | 40 | 25 | 15 | 12 |
| c (MPa) | 0.18 | 0.14 | 0.06 | 0.05 | 0.04 |
| Material unit weight (kN/m3) | 23.5 | 22.0 | 20.0 | 19.5 | 17.0 |
| Landslide Density Per km2 | <0.005 | 0.005–0.01 | 0.01–0.02 | 0.02–0.03 | >0.03 |
| Degree of Risk | Very low | Low | Moderate | High | Very high |
| amax | <0.2 | 0.2–0.4 | 0.4–0.6 | 0.6–0.8 | >0.8 |
| Degree of Risk | Very low | Low | Moderate | High | Very high |
| Population Density | <50 | 50–100 | 100–150 | 150–200 | >200 |
| Risk Degree | Very low | Low | Moderate | High | Very high |
© 2019 by the authors. Licensee MDPI, Basel, Switzerland. This article is an open access article distributed under the terms and conditions of the Creative Commons Attribution (CC BY) license (http://creativecommons.org/licenses/by/4.0/).
Share and Cite
Zhuang, J.; Peng, J.; Zhu, X.; Huang, W. Scenario-Based Risk Assessment of Earthquake Disaster Using Slope Displacement, PGA, and Population Density in the Guyuan Region, China. ISPRS Int. J. Geo-Inf. 2019, 8, 85. https://doi.org/10.3390/ijgi8020085
Zhuang J, Peng J, Zhu X, Huang W. Scenario-Based Risk Assessment of Earthquake Disaster Using Slope Displacement, PGA, and Population Density in the Guyuan Region, China. ISPRS International Journal of Geo-Information. 2019; 8(2):85. https://doi.org/10.3390/ijgi8020085
Chicago/Turabian StyleZhuang, Jianqi, Jianbing Peng, Xinghua Zhu, and Weiliang Huang. 2019. "Scenario-Based Risk Assessment of Earthquake Disaster Using Slope Displacement, PGA, and Population Density in the Guyuan Region, China" ISPRS International Journal of Geo-Information 8, no. 2: 85. https://doi.org/10.3390/ijgi8020085