
Evaluation of Coating Film Formation Process Using the Fluorescence Method

Department of Mechanical Science and Technology, Gunma University, Gunma 376-8515, Japan
*
Author to whom correspondence should be addressed.
Coatings 2021, 11(9), 1076; https://doi.org/10.3390/coatings11091076
Submission received: 10 August 2021
/
Revised: 29 August 2021
/
Accepted: 30 August 2021
/
Published: 6 September 2021
(This article belongs to the Special Issue Current Perspective on the Study of Liquid-Fluid Interfaces: From Fundamentals to Innovative Applications)
Abstract
:In this paper, we invented a novel observation method of the coating film formation process using the fluorescence method. With this method, the temporal change in the coating film thickness can be evaluated quantitatively. In addition, since the thickness and flow of the coating film can be measured simultaneously, the detailed coating film formation process was clarified. In the experiment, the adhesion behavior of the spray-paint droplets when applied to a wall was investigated. The characteristics of coating films formed by the spray droplets, particularly the influence of injection pressure on the coating film formation, were determined using the fluorescence method. At the initial stage of the coating process, the coating area increased linearly. When the ratio of the coating area to the measurement range reached about 80%, the rate at which the coating area increased slowed down, and an overlap began. The amount of paint that adhered to the coating film formation could be estimated by calculating the overlap ratio. Moreover, the thickness and smoothness of the coating film were evaluated using the histogram data of the fluorescence intensity. The leveling process was discussed in relation to the standard deviation of the histogram data. In addition, the flow of the paint during the coating film formation was investigated using tracer particles, and the effect of the spray gun injection pressure on the leveling process was investigated. Changes in the film thickness and flow during the coating film formation process could be evaluated through fluorescence observation.
1. Introduction
Reducing the emission of volatile organic compounds (VOCs) generated in various industrial fields is crucial, due to its adverse effects on humans and the atmosphere. The World Health Organization (WHO) has defined organic compounds with a boiling point between 50 and 260 °C, such as toluene, xylene, and formaldehyde, as VOCs. Air pollution caused by suspended particulate matter (SPM) and photochemical oxidants is the problem caused by VOCs, which is still a serious situation. In addition, VOCs are involved in the generation of fine particles (PM 2.5) as a precursor. VOCs are primarily released during painting processes, because organic solvents, such as thinner, are used to dilute the paint. Thinner contains xylene, toluene, etc., which can easily be released into the atmosphere. In particular, spray coating is performed as a coating method for large machines, such as automobiles; however, paint consumption is enormous, and a large amount of VOCs are generated. In addition, VOC emissions from shipbuilding, building construction, and automotive production have been reported [1,2,3], and the effect on humans has been discussed [4,5].
To reduce VOC emission during the painting process, it is important to improve the adhesion efficiency of the paint and optimize the coating time. Therefore, clarifying the relationship between the characteristics of the paint spray and the paint surface quality is necessary. Coating process optimization technology could reduce paint consumption while maintaining surface quality [6,7,8]. Additionally, spray-coating modeling has been investigated as a means of predicting coating thickness [9]. Research has been conducted to understand the mechanism behind coating film formation using spray coating [10,11]. However, in conventional studies, observations have been made with the naked eye and with a camera, and only the area and shape of the paint covering the observation range have been measured. The coating thickness and paint flow during the coating film formation process have not been reported in previous studies. In this study, we investigated the coating process in which the atomized paint adheres to the coated surface. Further, we propose a methodology to determine the change in thickness and smoothness of the coating film quantitatively using the fluorescence method. Fluorescence has been used in various fields, such as biology, medicine, and combustion diagnostics in engineering [12]. However, fluorescence has not been previously applied as an evaluation method to elucidate the paint film formation mechanisms. In this study, the fluorescence method is newly applied to the coating technology.
2. Experimental Methods
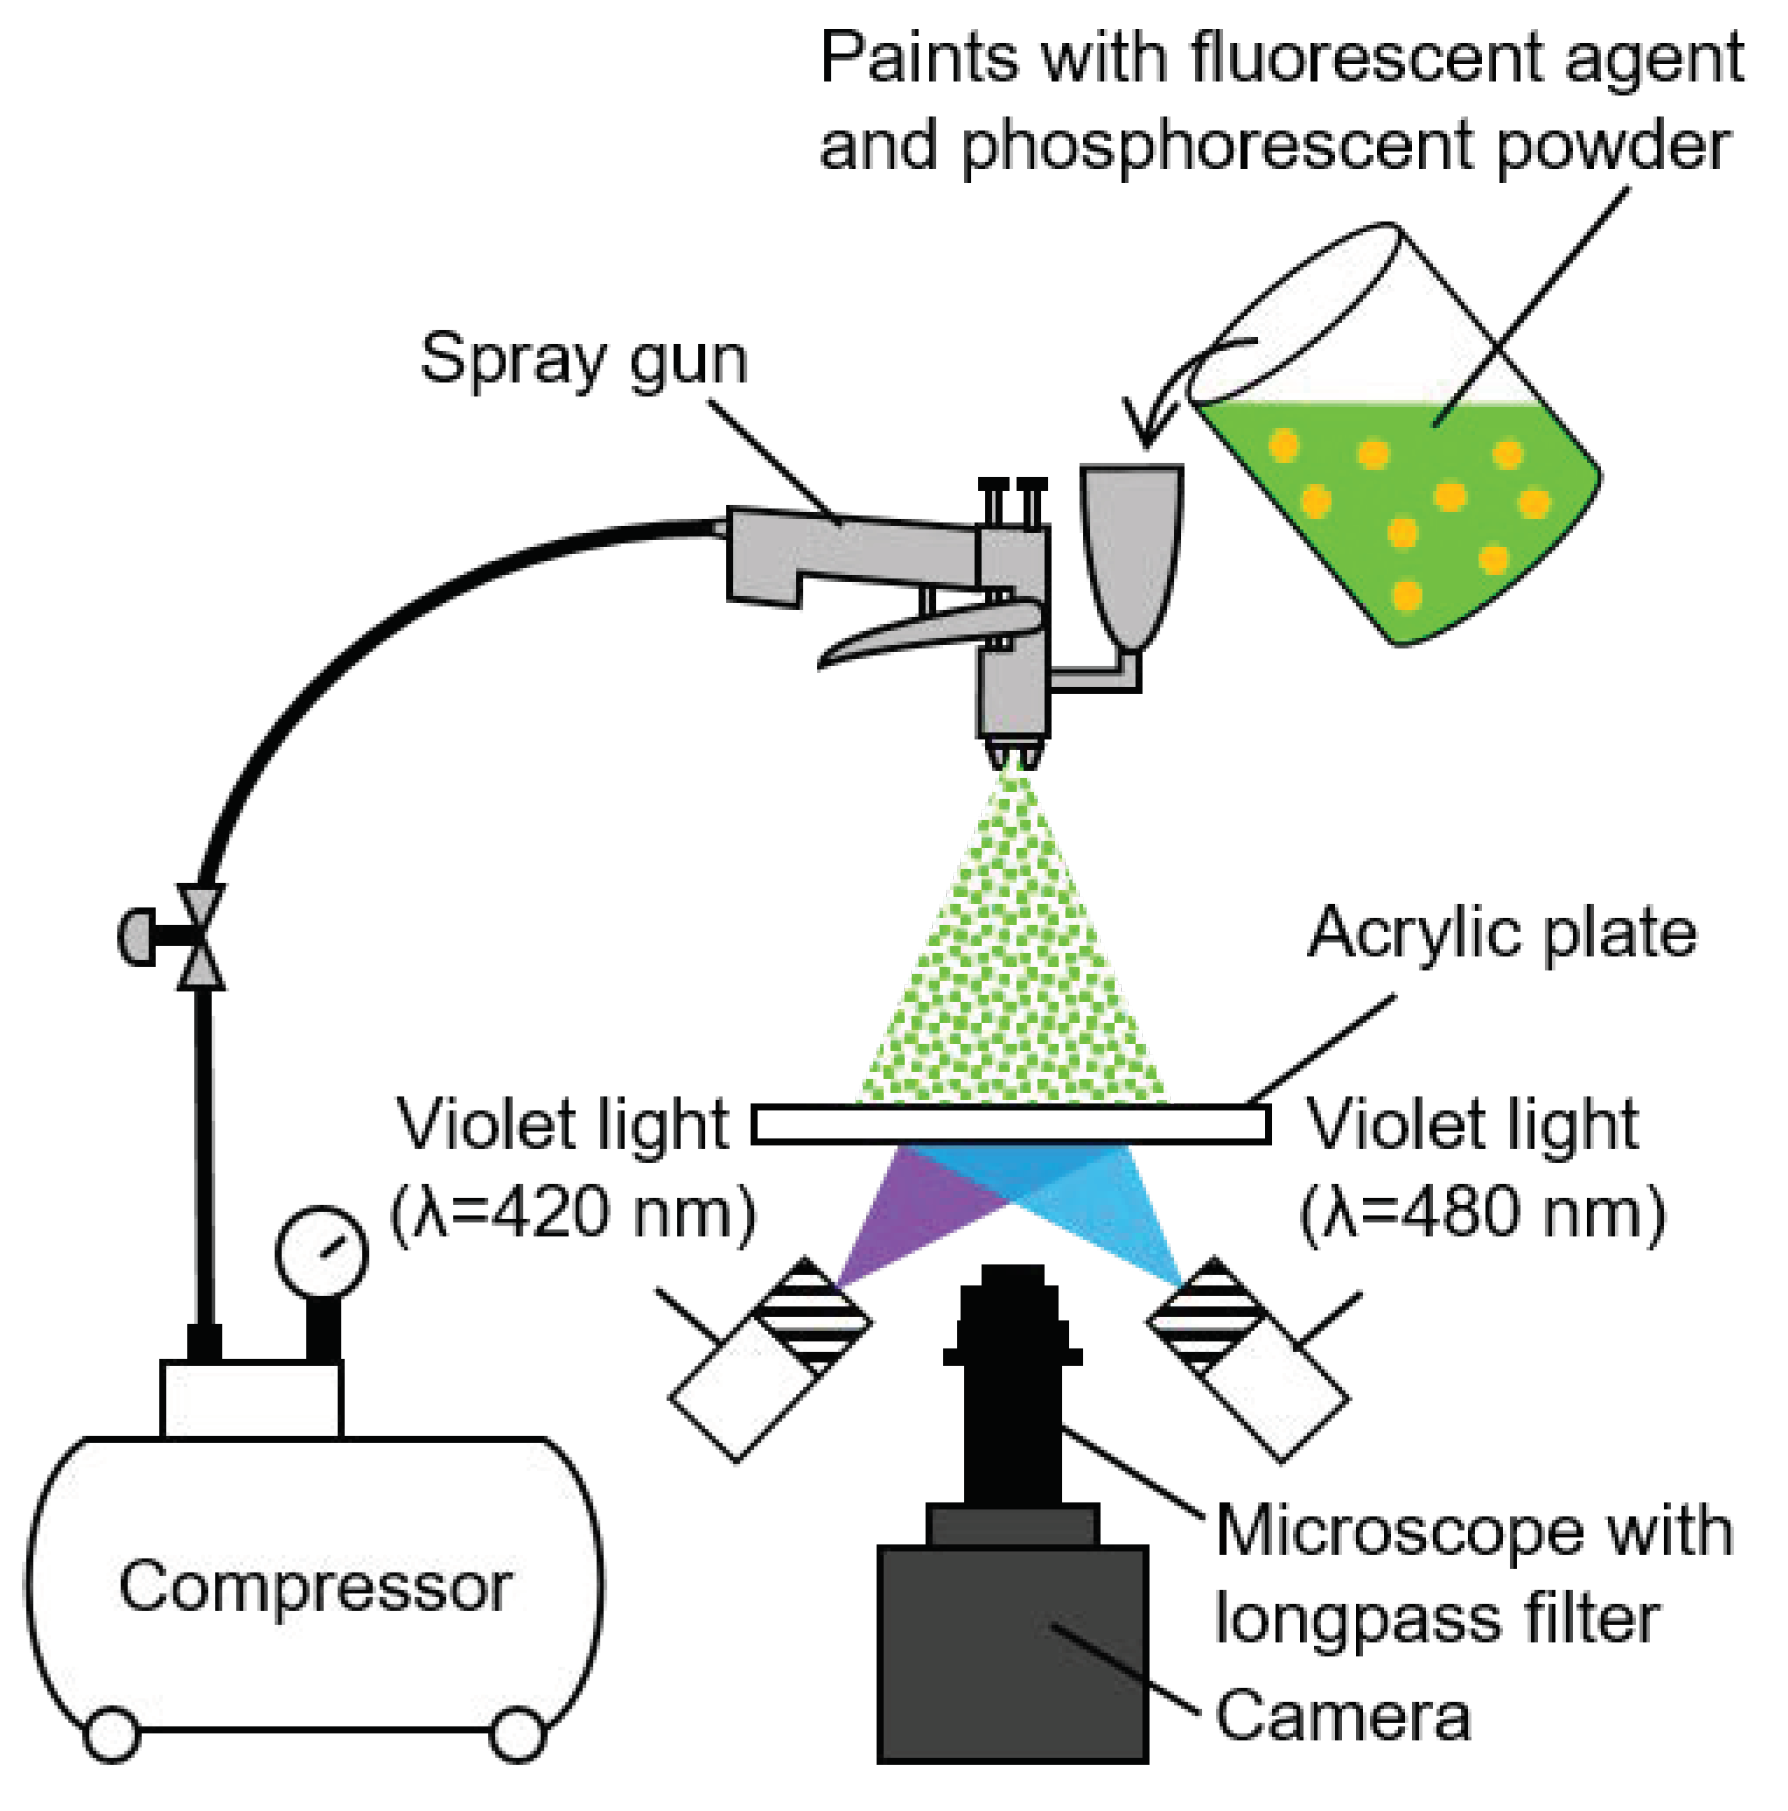
Figure 1 shows an outline of the experimental setup. The experimental equipment consisted of a paint sprayer that sprayed paint and an observation unit that observed how paint adheres to and forms a coating film. The gravity feed spray gun (CREAMY(KP)5A-12, Kinki Factory Co., Ltd., Osaka, Japan) was used. The nozzle diameter of the spray gun was 1.2 mm, and the injection pressure was set to Pin = 0.1, 0.2, and 0.3 MPa. The paints used in the experiment were colorless acrylic resin paints (Econet EB Two Pack Paints, Origin Electric Co., Ltd., Saitama, Japan), and their components are 40%–45% for acrylic polyol, 35%–40% for butyl acetate, and 15%–20% for diisobutyl ketone. Three types of viscosities were prepared by changing the amount of thinner. As a result of measuring each paint viscosity with an Iwata type viscosity cup, μ = 0.023, 0.033, and 0.037 Pa·s, respectively. Coumarin 153, which is a fluorescent agent, was used in order to assess the droplet adhesion behavior and the paint film formation. It was mixed with each paint at a ratio of 2.0 g/L. The absorption wavelength range of Coumarin 153 is 360 to 480 nm, the maximum absorption wavelength is 423 nm, and the maximum fluorescence wavelength is 530 nm. Phosphorescent powder was also mixed with the paint to measure the flow characteristics of the paint film. The wavelengths of lights used were 420 and 480 nm. The 420 nm light is near the absorption wavelength range of Coumarin 153. The phosphorescence from the powder was emitted by the 420 and 480 nm lights.
In the observation section, a transparent acrylic plate, with a length of 100 mm, a width of 100 mm, and a thickness of 3 mm, was installed as a painted surface at 300 mm downstream from the tip of the spray gun. Since the wavelength of light that can be transmitted through the transparent acrylic plate is about 400 nm or more, it was able to transmit the 420 and 480 nm lights used here. The paint mixed with the fluorescent agent and the phosphorescent powder was measured for fluorescence and phosphorescence by shining light of a specific wavelength from the underside of this acrylic plate.
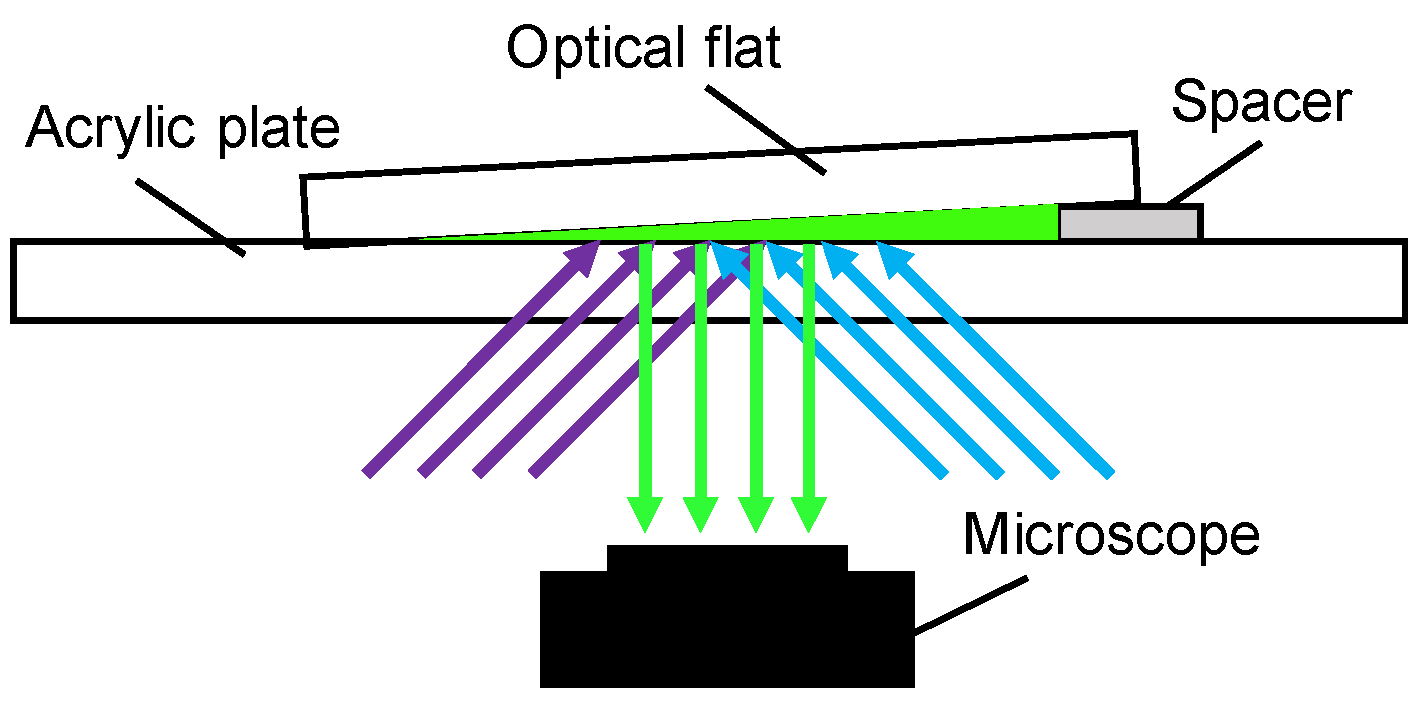
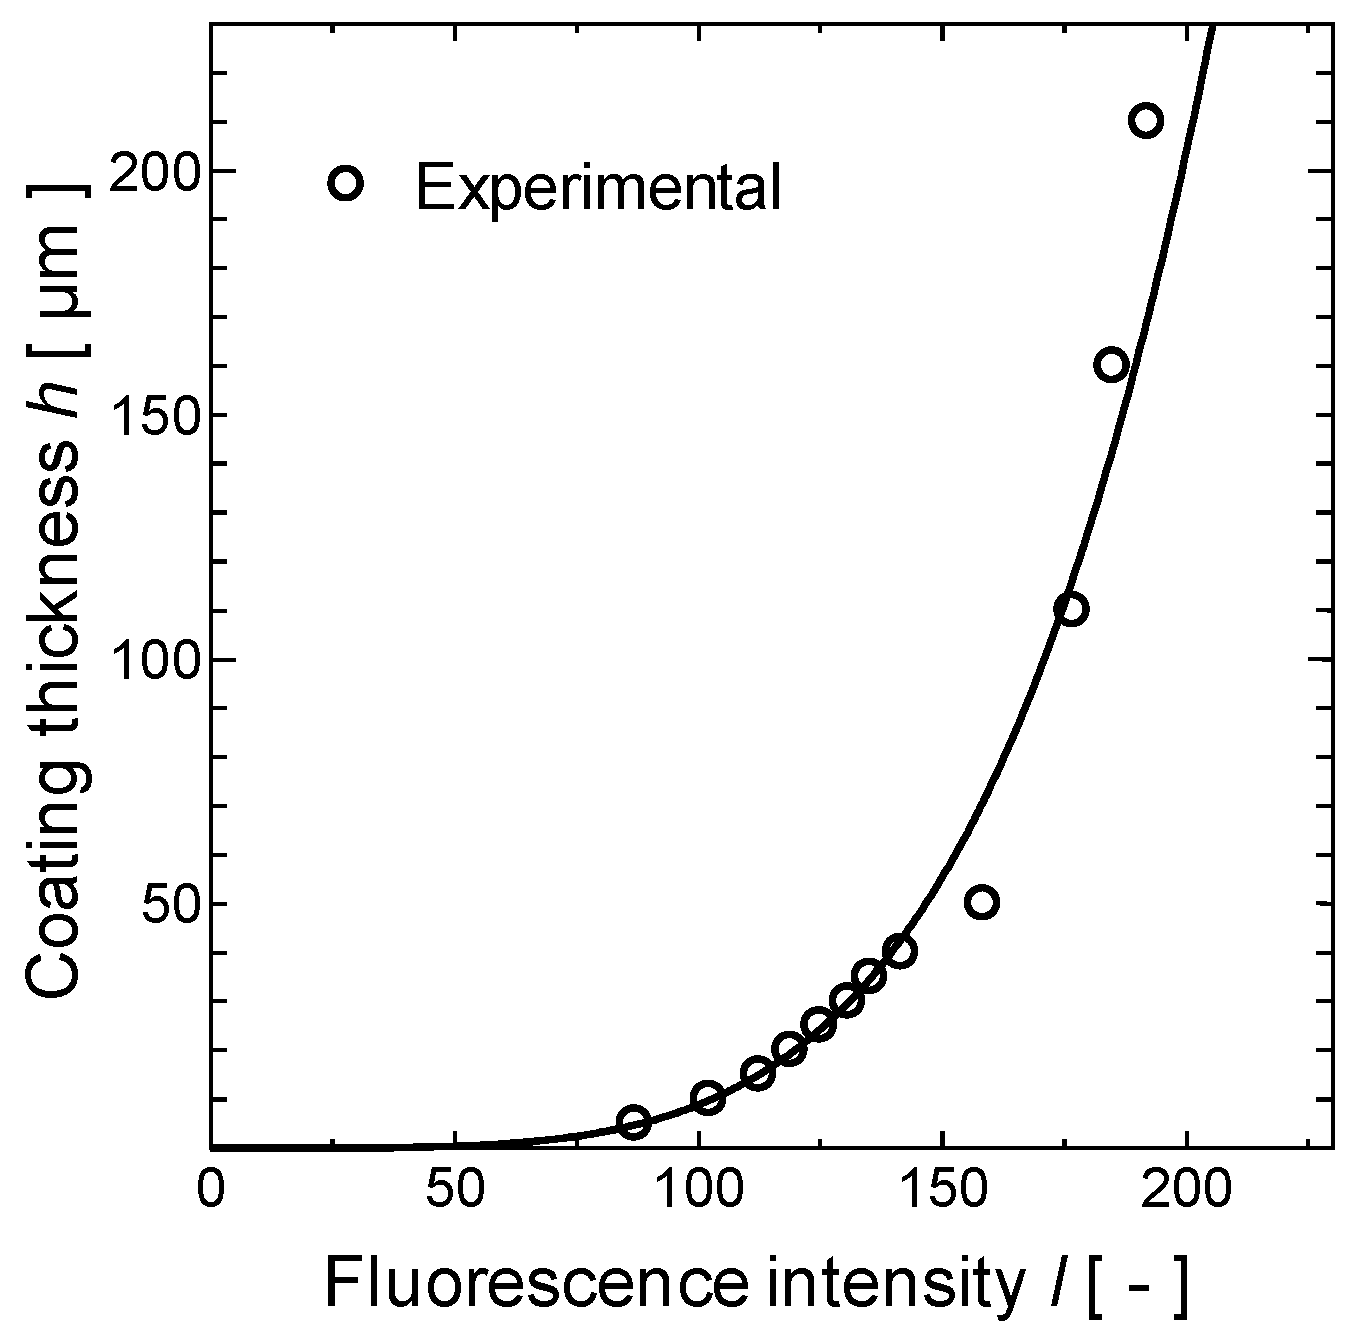
The coating film formation process for the paint sprayed on the acrylic plate was photographed using a digital camera (DMC-GH4, Panasonic Corporation, Osaka, Japan) fitted with a microscope (VZM1000, Edmund Optics, Tokyo, Japan). In addition, a long pass filter (Φ 25 mm 500 nm High-Performance Longpass Filter, Edmund Optics) for blocking light at a wavelength of 490 nm or less was inserted between the microscope and camera to block the violet light, and only the light of fluorescence and phosphorescence wavelengths was photographed. In order to measure the paint film thickness quantitatively, the fluorescence intensities were calibrated. Paint containing a fluorescent agent was sandwiched between two glass plates, as shown in Figure 2, and the fluorescence intensities with against the various gap distances between the glass and acrylic plate were obtained. Figure 3 shows the calibrated data. From these data, the relationship between the fluorescence intensity and the thickness of the paint film was ascertained.
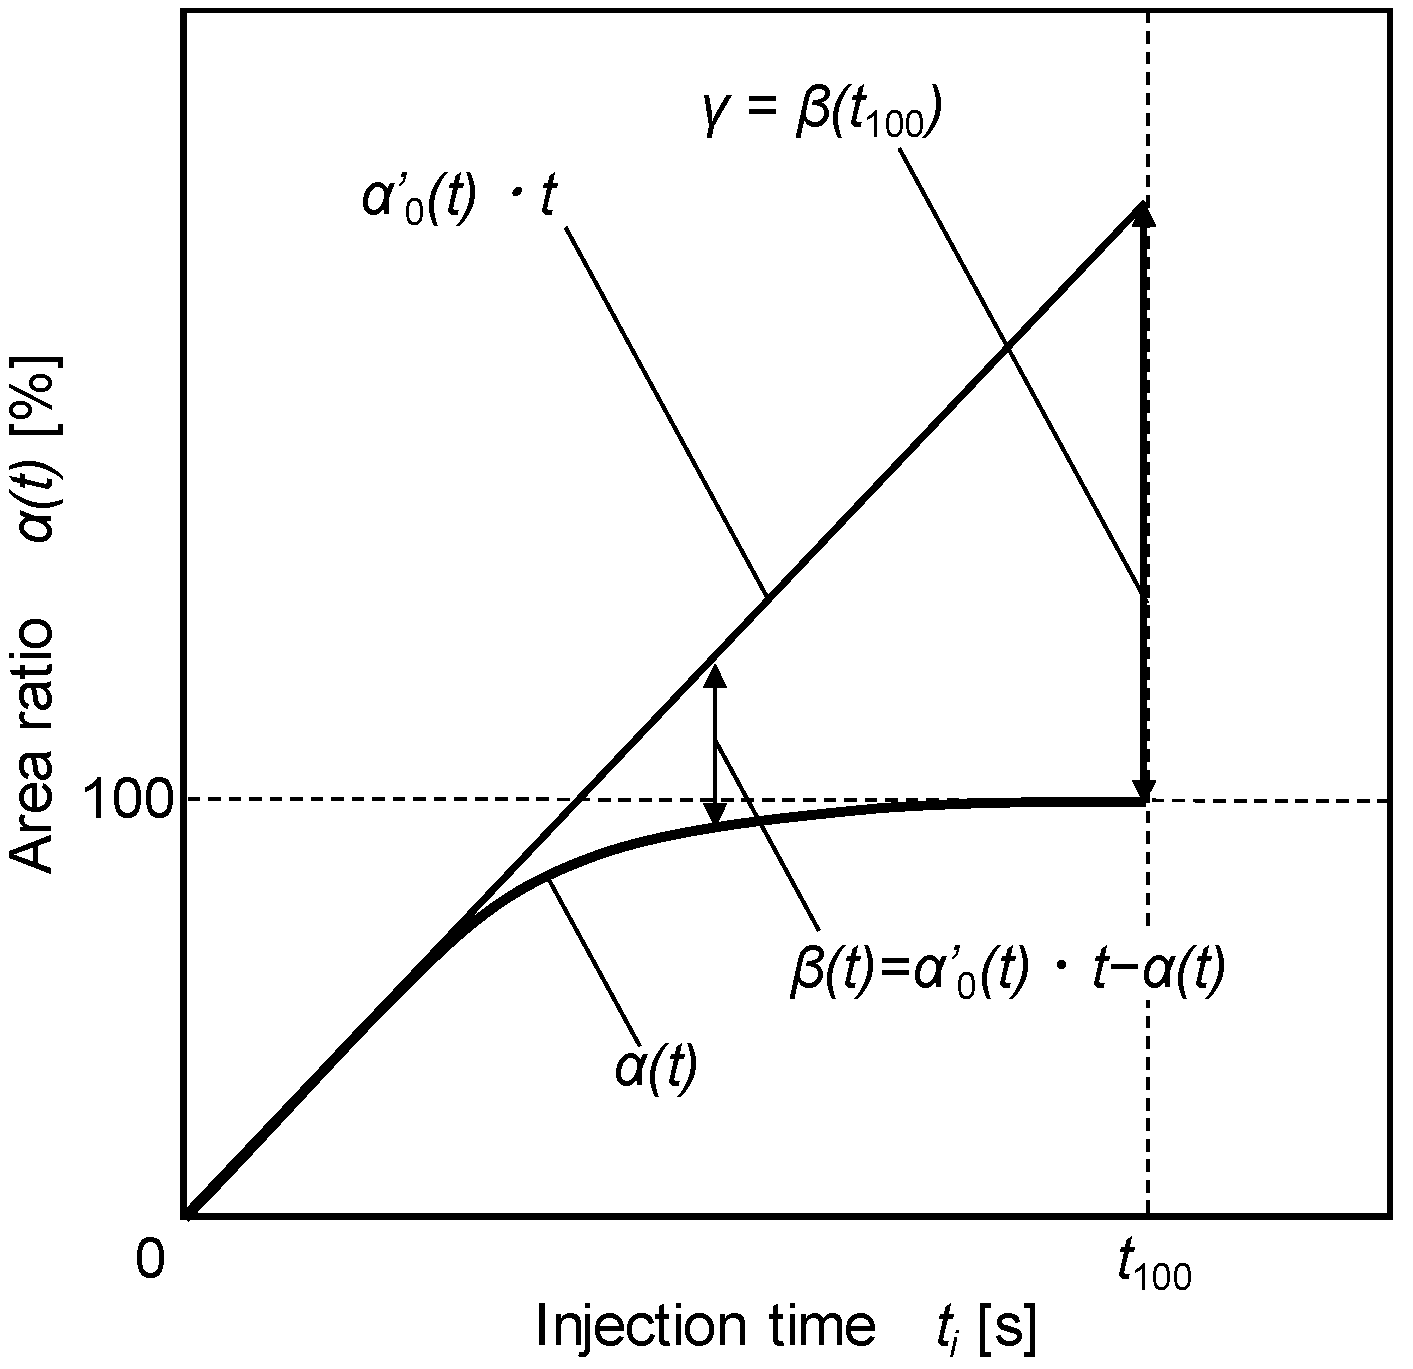
The obtained image was binarized to determine the adhesion area of the paint and the size distribution of the adherent droplets. In addition, to evaluate the film formation process, we defined the area ratio, α(t), and the overlap ratio, β(t), from a previous study [12]. Figure 4 shows an example of the time dependence of the area and overlap ratios. The area ratio is the ratio of the droplet adhesion area to the measurement range. The overlap ratio is the value obtained by subtracting α(t) from the value that multiplies the increase ratio, α’0, of the area ratio at the initial stage of the droplet adhesion by the elapsed time t[s]. If the droplets do not overlap, the area ratio is considered to increase as α′0·t, and the overlap ratio indicates how much extra paint is attached as compared with do not overlap case.
In addition, the temporal change in the coating film thickness was determined by measuring the fluorescence intensity distribution on across-section of the fluorescence image. Additionally, the smoothness of the coating film was evaluated by examining the standard deviation of the fluorescence intensity distribution over the entire fluorescence image.
3. Experimental Results
3.1. Fluorescent Images and Thickness of Adherent Paint Droplets
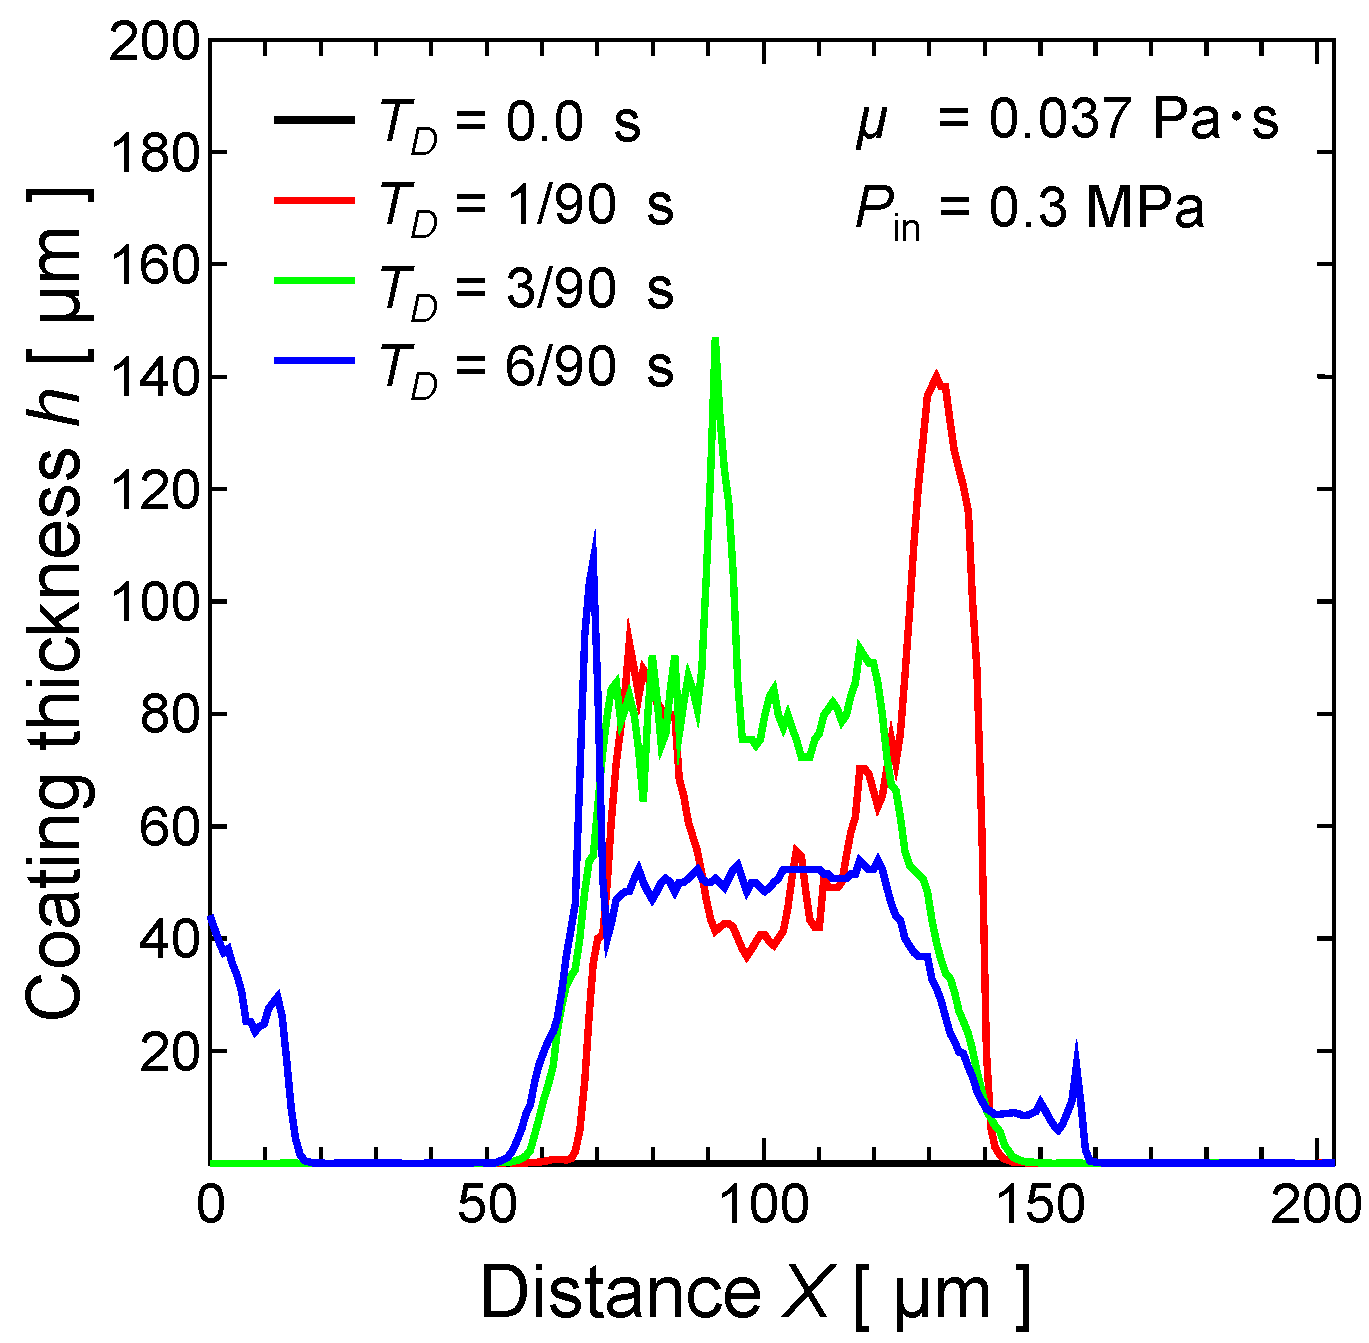
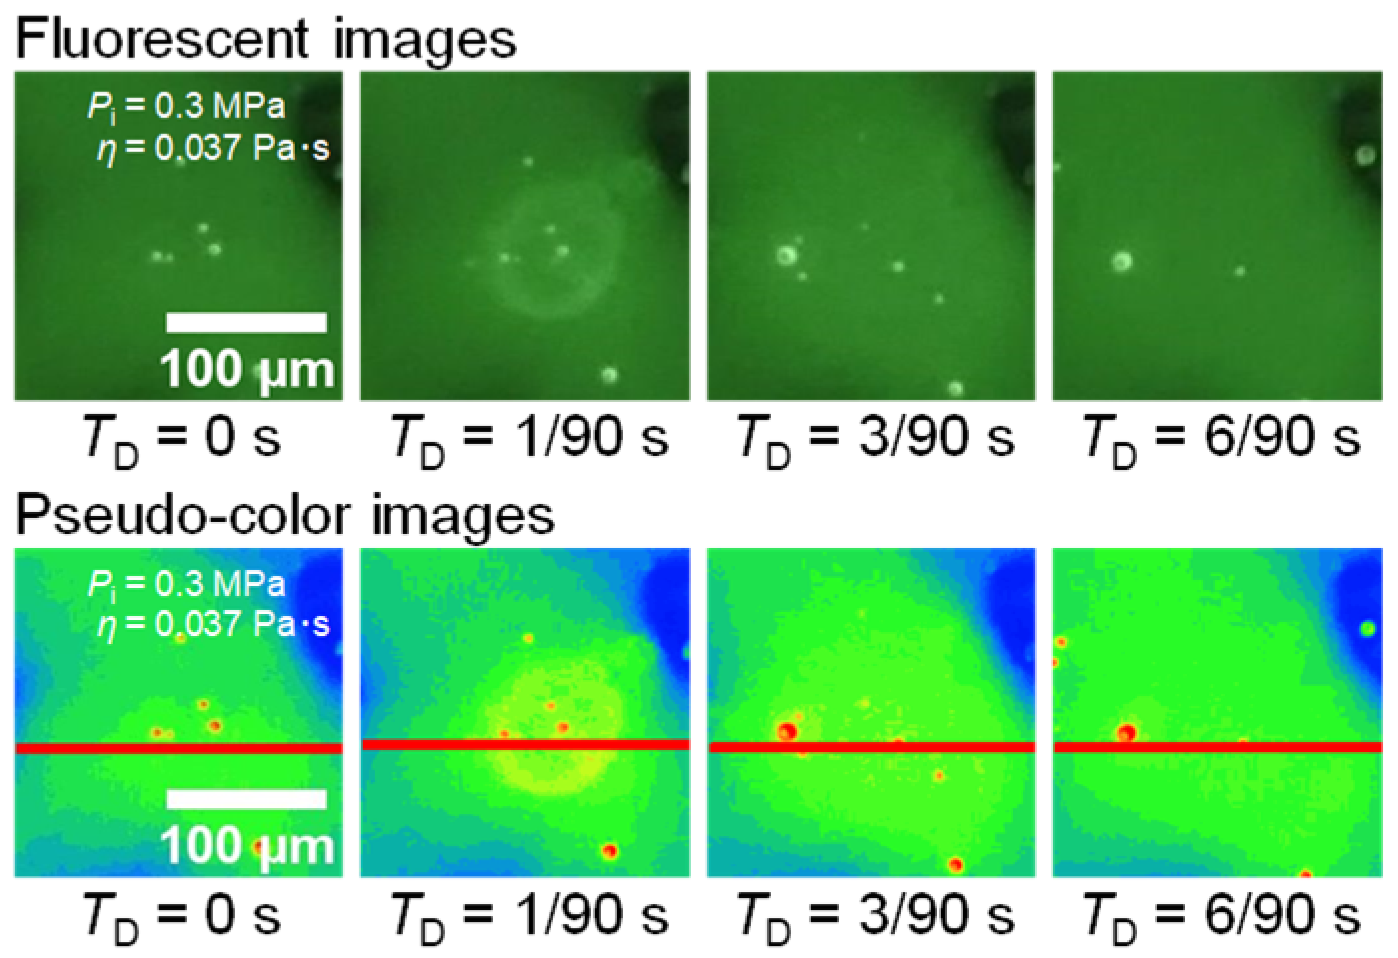
Figure 5 shows fluorescent and pseudo-color images of an adherent paint droplet, measured from time-lapse photography taken under the conditions of μ = 0.037 Pa·s and Pin = 0.3 MPa. It is shown that the area where the paint adheres becomes green. The red solid line represents the measurement position of the cross-sectional fluorescence intensity. Figure 6 shows the time change in the cross-sectional thickness of the droplets when adhering to the acrylic plate. To derive the film thickness, the aforementioned calibration data were used. The coating thickness, h, was calculated from the average fluorescence intensity using the calibration data. The horizontal axis is distance, X, and the vertical axis is coating thickness, h. TD = 0 s was defined as one frame before droplet impact, and the droplet behavior was measured at TD = 1/90, 3/90, and 6/90 s. It was confirmed that the center part of the droplet is thinner than the outer parts at TD = 1/90s. After adhesion, the center part becomes thick at TD = 3/90 s. This behavior is caused by the impact when the droplet adheres. Here, the high, spike-like values seen in the cases of TD = 3/90 s and 6/90 s are the parts of the bubbles existing in the adherent droplet. The presence of air bubbles resulted in a high value due to the increase in local thickness, as shown in the fluorescence images. Finally, the droplet thickness converged to about 50 μm at TD = 6/90 s. In addition, there was almost no difference in position between TD = 1/90 and TD = 6/90 s. Therefore, it was confirmed that the paint droplet adhering to the acrylic plate did not spread on the painted surface.
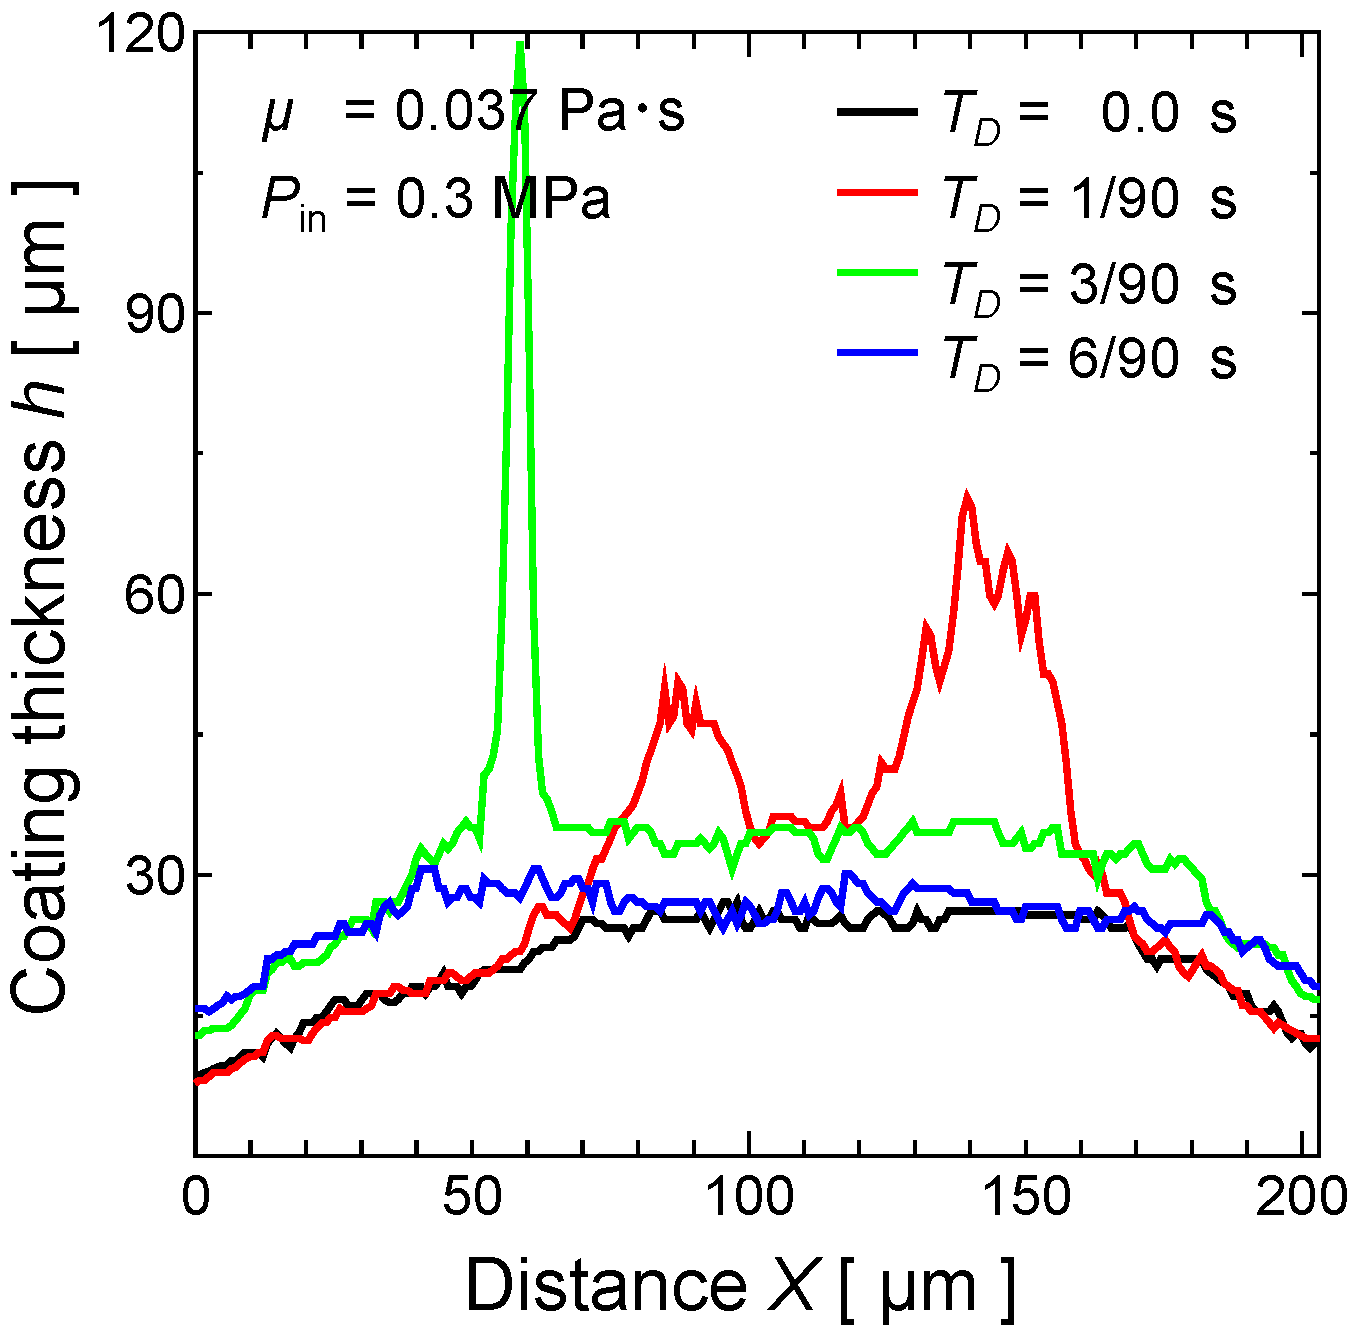
Figure 7 shows fluorescent and pseudo-color images of the droplet on the formed coating surface. Other conditions are the same as in Figure 5. Figure 8 represents the time change in the cross-sectional thickness of the droplet. It was confirmed that both ends of the droplet show a high value when the droplet adheres to the coating at TD = 1/90 s. However, the center part of the droplet did not become thick after adhesion. The spike-shaped part seen in the TD = 3/90 s data indicated the presence of air bubbles. The coating thickness before (TD = 0/90 s) and after (TD = 6/90 s) the droplet adhesion was compared. The coating thickness did not change in the range where the droplet adhered (70 < X < 170). However, the coating thickness increased in the range where the droplet did not adhere (1 < X < 70, 170 < X < 205). This result shows that the adherent droplet spread around and integrated with the coating. Using the fluorescence method, it is possible to analyze the change in the coating thickness in a short time (within minutes) by examining the fluorescence intensity distribution in the cross-section.
3.2. Observation of Coating Film Formation Process
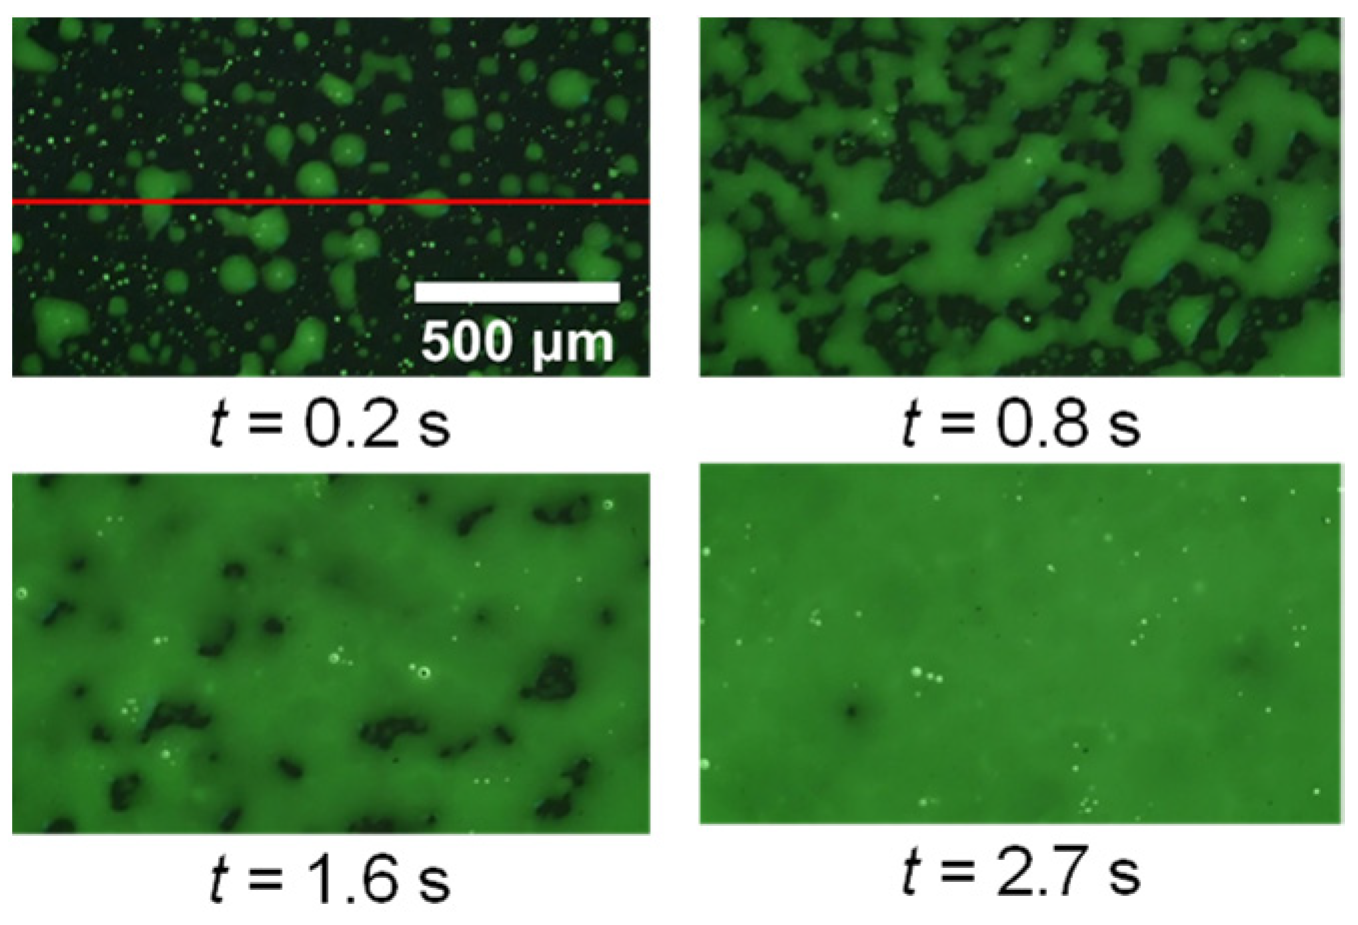
In the above section, we focused on one droplet, but in the following, we observe a wider range of coating films using fluorescence. Figure 9 shows a fluorescence image of a painted surface, taken under conditions of injection pressure, Pin = 0.2 MPa, and paint viscosity, μ = 0.033 Pa·s. The area where the paint adheres becomes green, the adhesion area increases with time, and the overall fluorescence intensity increases. The red solid line shown in the image at t = 0.2 s represents the measurement position of the cross-sectional fluorescence intensity.
In the past, the authors changed the injection pressure Pin to arbitrary values and examined the time change in the area and overlap ratios [12]. In the time change graph of the area and overlap ratios when changing the injection pressure, the increase ratio of the area ratio grows with the increase in the injection pressure. The higher the injection pressure, the shorter the time until α(t) = 100%. This was due to the increase in the paint flow rate per unit of time caused by the increase in injection pressure. The area ratio α(t) increases immediately after adhesion for any injection pressure, but increases gradually from around 50%. This was caused by the fact that the paint overlapped and began to adhere. The overlap ratio, β(t), shows a value close to 0, because there was almost no overlap of droplets at the beginning of the paint adhesion. However, it increased with time. In addition, the overlap ratio in the time (t = T100) it took for area ratio to reach 100%, with an injection pressure of Pin = 0.2, 0.3, and 0.4 MPa, was about 200%, 300%, and 350%, respectively. It was found that the paint, which was about 2.3 to 2.8 times the measurement range, had adhered prior to the film formation.
Figure 10 shows the cross-sectional film thickness distribution at each stage, in the case of injection pressure Pin = 0.2 MPa and viscosity μ = 0.033 Pa·s. The cross-sectional coating-thickness distribution was obtained by measuring the fluorescence intensity distribution on the line shown by the red solid line in Figure 9 and calculating the distribution of thickness from the calibration data of the fluorescence intensity and the coating thickness. It can be seen that the variation in coating thickness decreases with time and that a uniform and thick coating is formed. Thus, the temporal change in the coating film thickness can be examined from the distribution of fluorescence intensity.
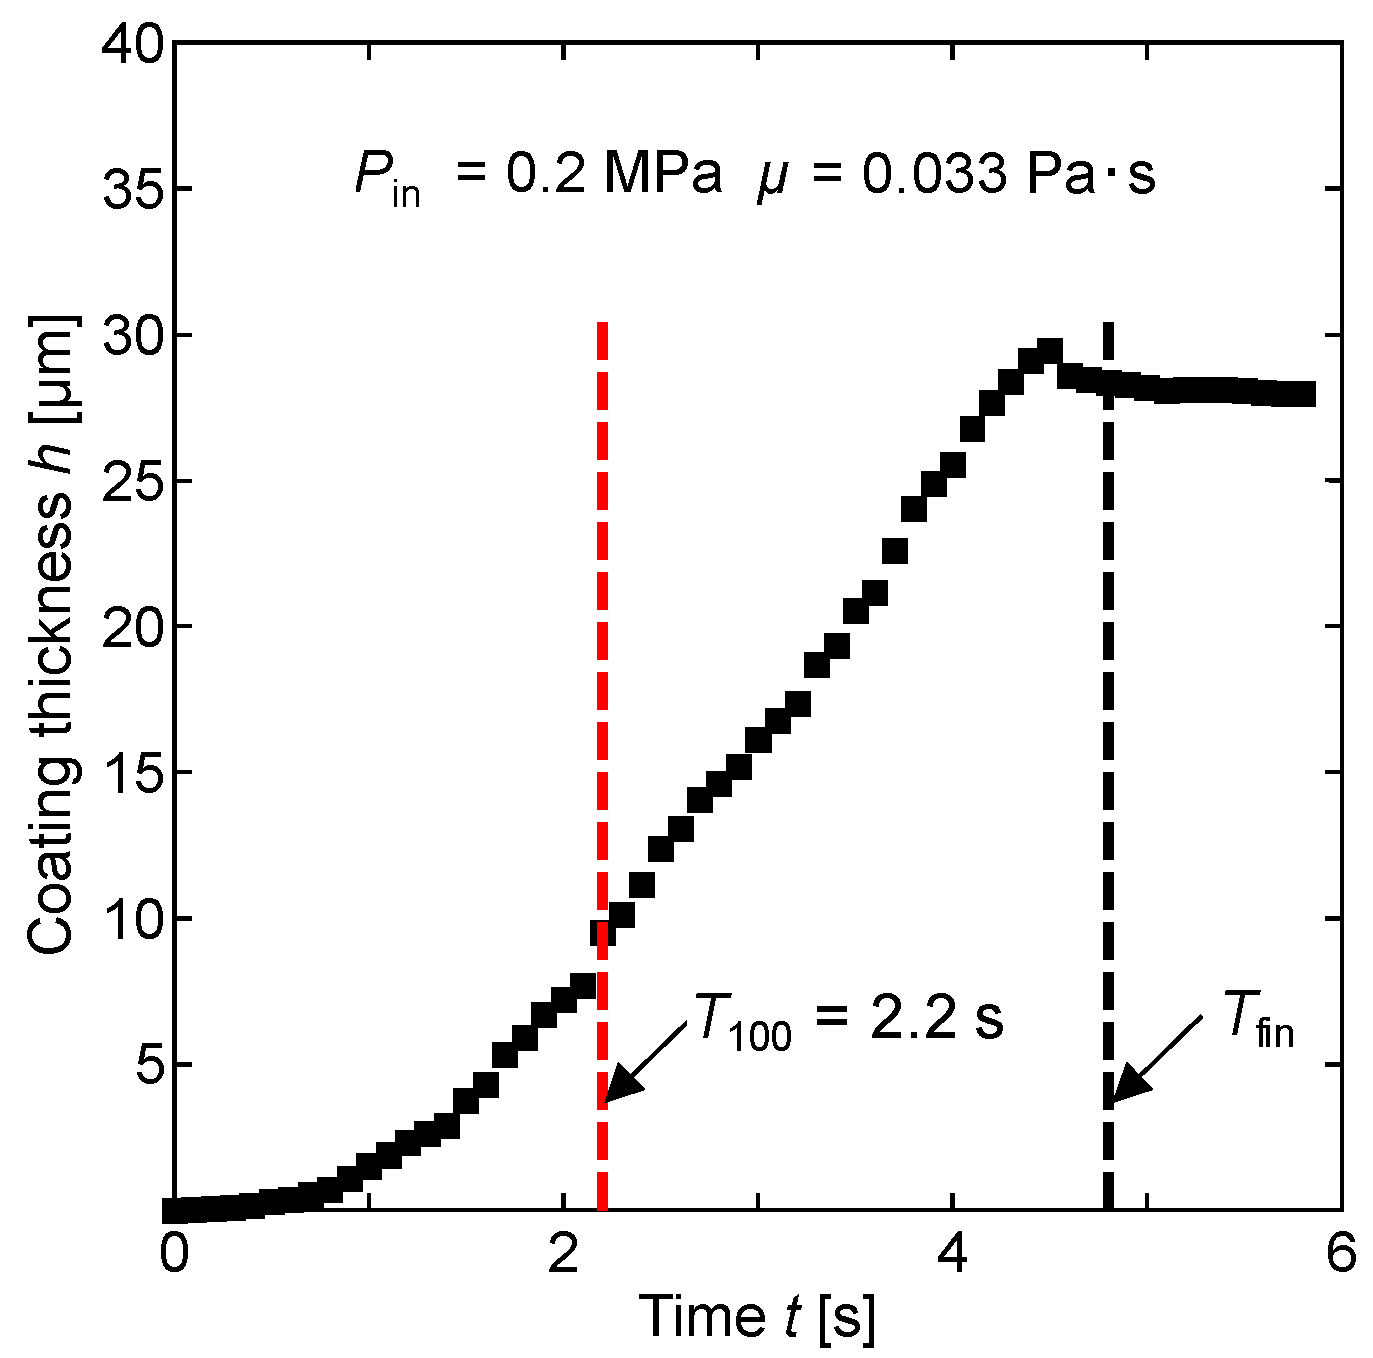
Figure 11 shows the temporal change in the coating thickness under the conditions of Pin = 0.2 MPa and μ = 0.033 Pa·s. The coating film thickness increased from the start of the spray coating. At the end of the spray coating (t = Tfin), the change in the coating thickness became flat.
3.3. Evaluation of Coating Surface Smoothness and Leveling Process
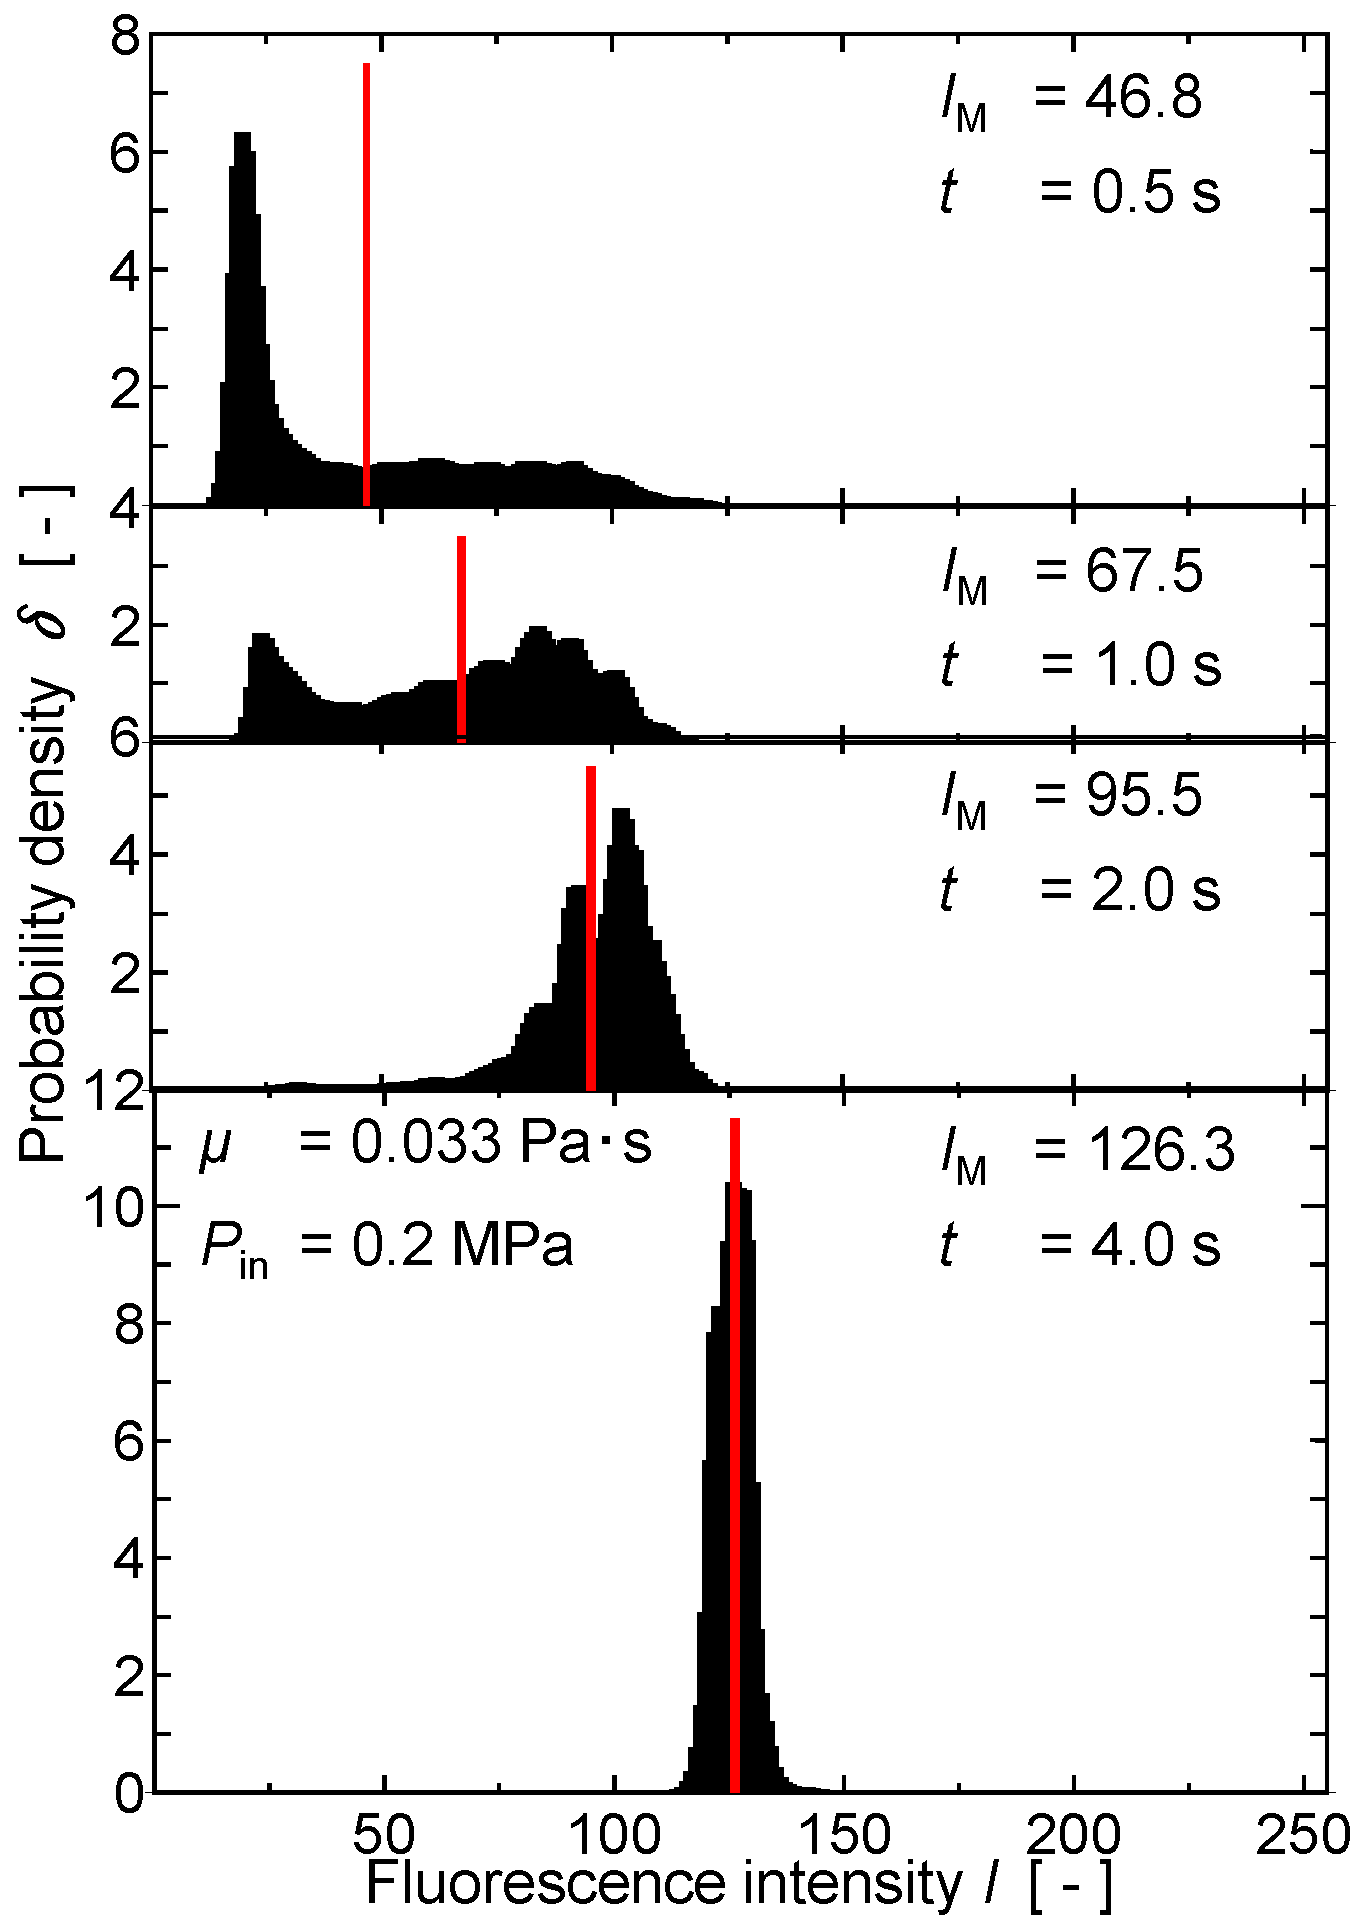
Leveling phenomena in the spray coating process were analyzed using the intensity distribution of the fluorescence image. To evaluate the surface smoothness, a histogram, or frequency distribution, of the tone values of the fluorescence image was produced. Figure 12 shows the histograms produced under the conditions of injection pressure Pin = 0.2 MPa and paint viscosity μ = 0.033 Pa·s. The horizontal axis of Figure 12 indicates the tone values of fluorescence intensity, which was changed from 0 to 256. The vertical axis indicates the probability density.
At the first stage of spray coating, the histogram has a wide range distribution. This result shows that fluorescence intensities have various tone values because the paint droplets adhered to the coating surface individually. The distribution becomes gradually narrower with an increase in the coating time, t. At the final stage, the distribution settles into a monodispersed shape. This means that the coating surface became flat. As described here, leveling phenomena can evaluate the width of the histogram. In this study, the standard deviation, σ [-], was used for estimating the coating surface smoothness.
The center of the distribution, IM, is shifted to the higher intensity side. This result shows that the average thickness of the coating film increased with the change in distribution shape. Therefore, the change in the average thickness of the coating film can be evaluated using the position of the center value.
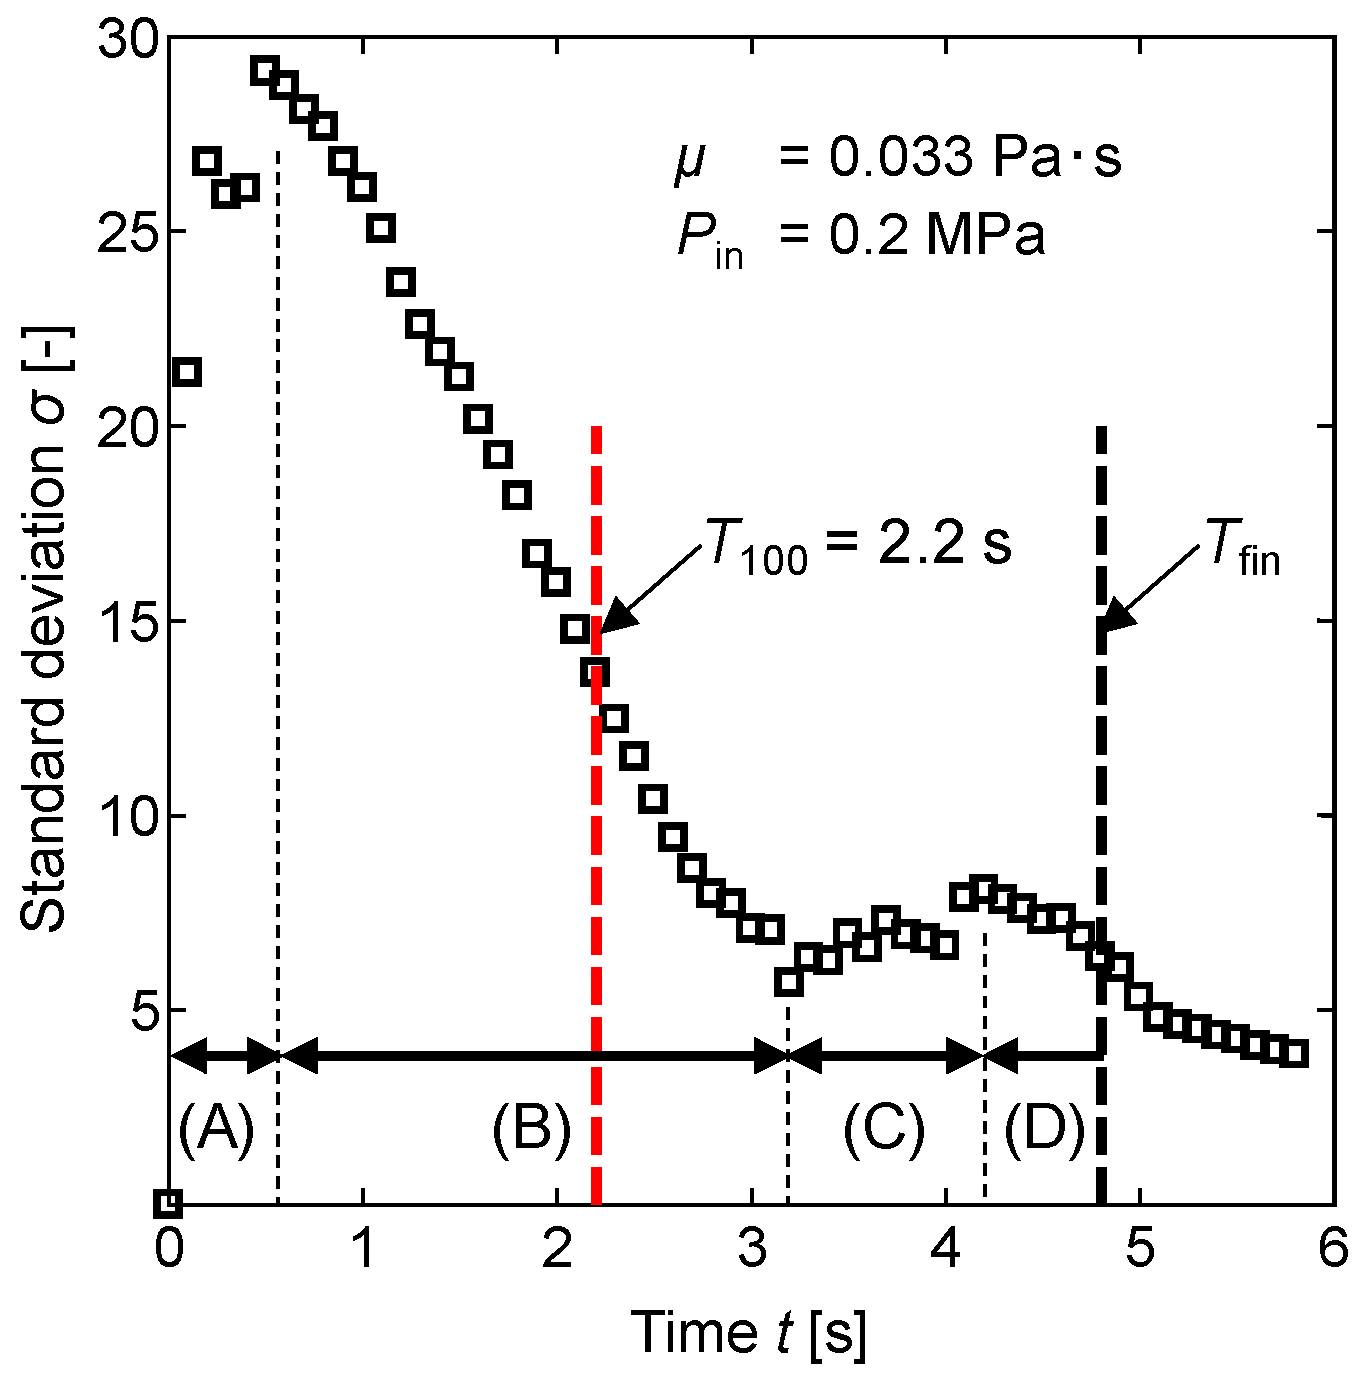
The standard deviation of the intensity distribution in the histogram was investigated. Figure 13 shows the temporal change in the standard deviation. As shown in Figure 11, the standard deviation increased after the start of the spray-droplet adhesion (part of (A) in Figure 13) and decreased in part (B) of Figure 13. In this part, the leveling phenomena between adherent droplets occurred via their coalescence. T100 indicates a point in time when the entire surface was covered by paint droplets. At the end of part (B), the coating surface became flat by the finish of leveling. However, in part (C), the standard deviation increased because the paint droplets overlapped on the coating surface. At the final stage of spray coating (in part (D)), the standard deviation decreased, gradually, with the progress of the leveling. In the figure, Tfin indicates the stop time of spray coating. As described above, the average thickness and smoothness of the coating film could be easily estimated using the fluorescence method. In particular, it was clearly shown that the standard deviation data from the fluorescence intensity distribution provided important information about the smoothness of the coating surface.
3.4. Influence of Injection Pressure and Paint Viscosity on Film Formation
Figure 14 shows the average thickness of the coating film, h [mm], under various amounts of injection pressure Pin. The Pin was changed from 0.1 to 0.5. It can be seen that the coating thickness increased uniformly until the end of injection, t = Tfin. The film thickness of Pin = 0.2 MPa was thicker than that of Pin = 0.1 MPa, because the injection flow rate of the former was greater than that of the latter.
In the case of Pin = 0.5 MPa, a thinner thickness value was maintained, even though the spray coating was sustained. The reason for this characteristic can be explained with reference to the airflow effect. In this study, the two-fluid atomizer was used for the spray formation. Therefore, strong airflow was generated at the coating surface under the high injection pressure condition. When atomized paint is stuck to the paint surface, paint flow is caused by the impact of adhesion and the contact of paint droplets. This flow affected the coating film formation and the quality of the paint surface. In this study, paint flow on the coating surface was visualized using the tracer particles in the paint.
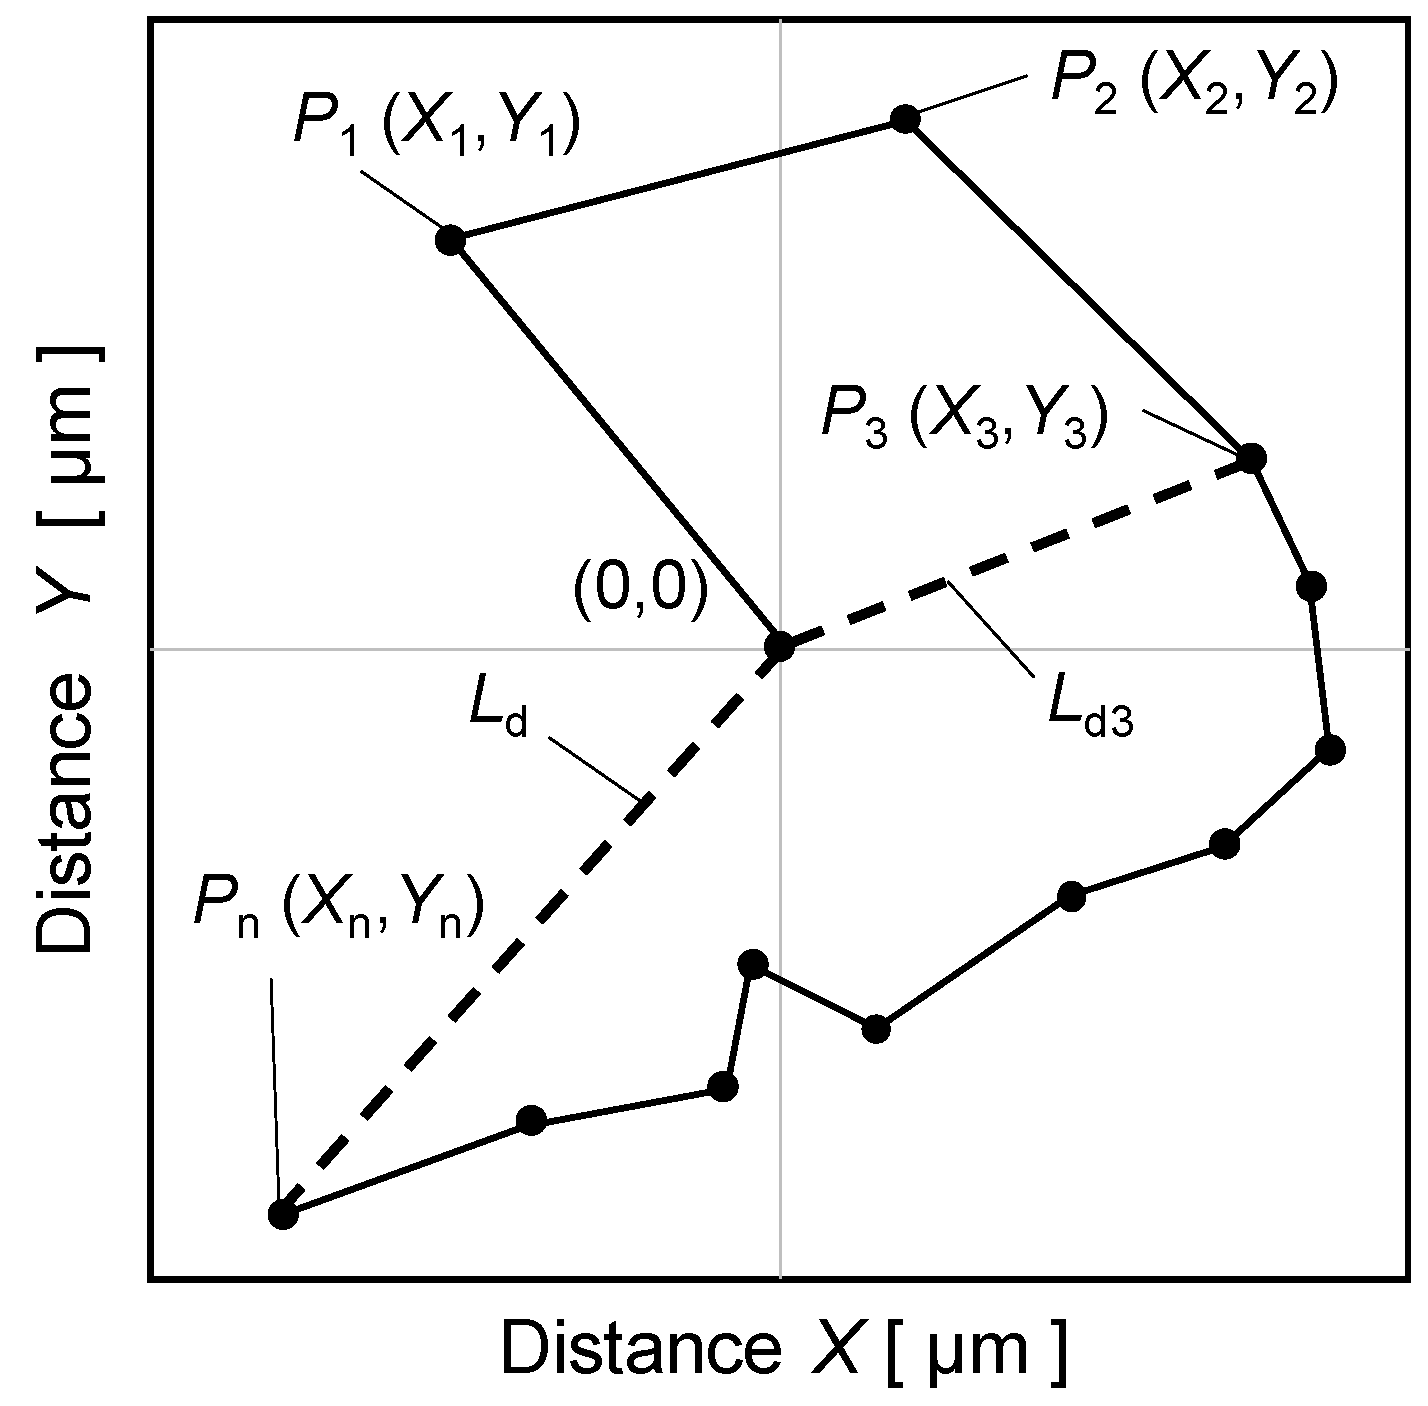
The first point where paint adhesion was defined as the origin (X0, Y0) = (0, 0). The length of the particle trajectory, Lp, and the absolute displacement, Ld, were measured under several experimental conditions. Figure 15 shows a schematic image of Lp (the black line) and Ld (the dashed line). Lp is the total distance the particle moved, and Ld is the linear distance from the original point to the end point after being moved by the flow. It was predicted that the flow would show random movement caused by the paint impact and leveling. Therefore, it was expected that Lp and Ld would become different values. If these values indicated almost the same number, then the flow caused by other forces would be generated. In our experiments, the time evolution of Lp and Ld was measured.
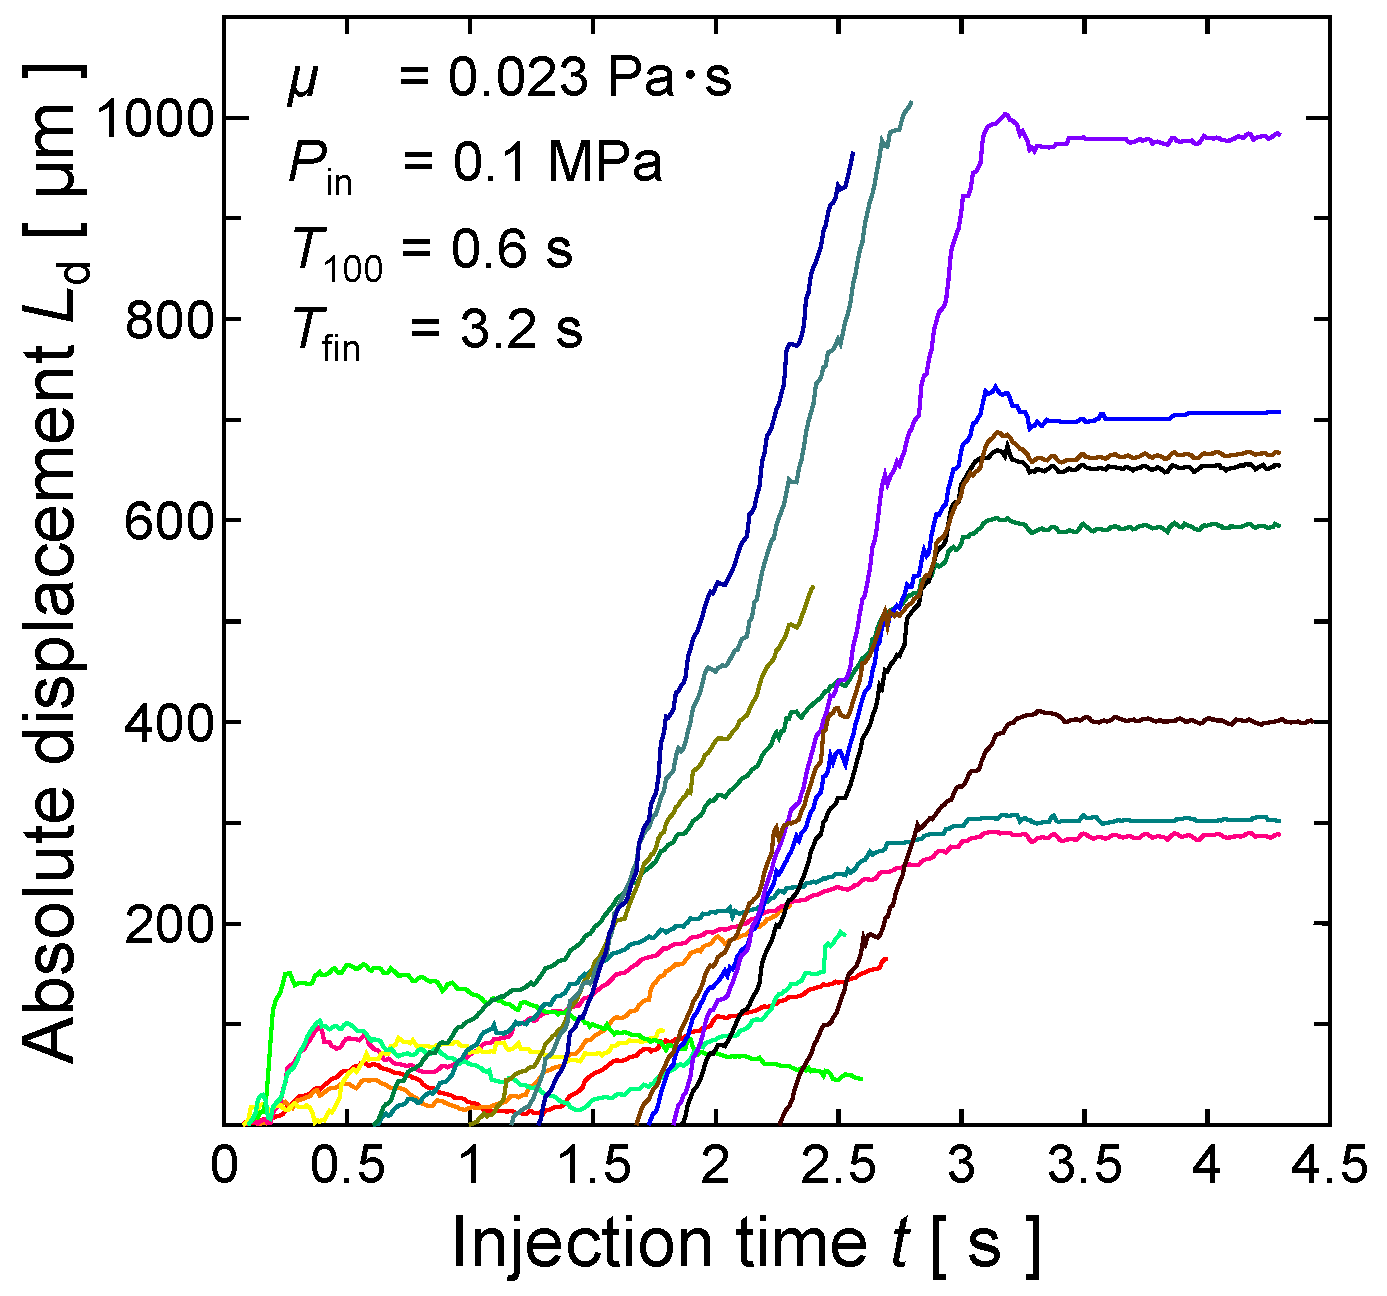
Figure 16, Figure 17, Figure 18 show the time evolution of the absolute displacement, Ld, using paint with a viscosity of μ = 0.023 Pa·s and an injection pressure of Pin = 0.1, 0.2, and 0.5 Pa, respectively. The horizontal axis represents the injection time, t s, and the vertical axis represents Ld. The point in time when the droplet starts to adhere is t = 0. Each plotline corresponds to one tracer particle.
As shown in Figure 16, the Ld of most droplets that adhered at a relatively early time became 100–150 μm, and, after that, Ld was maintained or decreased. This indicates the flow when the droplets that initially adhered began to coalesce to form a coating film. The paint droplet that first adhered to the surface did not move much. However, it moved when the droplet coalesced with other droplets.
However, the Ld of the droplet that adhered after t = 1.5 s increased steadily until t = Tfin. In addition, the Ld of some droplets that initially adhered increased to around t = 1.0 s, although the rate of increase was lower than that of the droplets that adhered later. These are the effects of the flow in the coating film. The Ld of the droplets that adhered later increased at the same rate, and a uniform flow occurred on the surface of the entire area.
The fastest flow was generated on the surface of the coating film because the droplets that adhered later had a higher rate of increase of Ld. In addition, the particles that initially adhered were closer to the wall surface than the particles that adhered later. Therefore, the particles moved at a lower velocity than the surface velocity. Some of the droplets that adhered at the initial stage, whose Ld had a low rate of increase from around t = 1.0 s, were caused by this movement.
As shown in Figure 17, the Ld of all the droplets increased steadily until t = Tfin. However, there was a difference in the rate of increase of Ld. The droplets that adhered later showed a higher rate of increase, and it was confirmed that the particles moved to a point away from the initial position—above Ld = 1200 μm. In accordance with this, a flow faster than Pin = 0.1 Pa was expected to occur. In addition, the slow flow was generated near the wall because the Ld of all particles increased, regardless of the time of adherence. The initially deposited paint was replaced by the latterly deposited paint as a result of this slow flow.
As shown in Figure 18, the Ld of all the droplets increased at the same rate. Therefore, the Ld of the droplets that initially adhered became larger than that of the droplets that adhered later. According to this result, a uniform flow was generated in the coating film. Even near the wall, the flow moved at the same velocity as the paint on the surface, if it was outside the boundary layer. Moreover, in this case, the replacement of the paint that adhered in the initial stage was performed more actively. The above results suggest that under the condition of a paint viscosity of μ = 0.023 Pa·s, a flow occurs in the coating film, and the higher the injection pressure, the greater the replacement of the paint that initially adheres to it. Therefore, we consider that the coating film flowed out of the observation range before it hardened, and the coating thickness did not increase. In addition, we consider this to be because the average film thickness does not increase under the conditions of μ = 0.023 Pa·s and Pin = 0.5 MPa, as shown in Figure 14.
4. Conclusions
In this study, we investigated the process of forming a coating film by changing the paint injection pressure. In addition, the thickness and smoothness of the coating film were investigated using the fluorescence method. The coating could be realized using the fluorescence method by mixing a fluorescent agent with the paint. The higher the injection pressure, the shorter the time until the coating was formed. The area ratio rises, linearly, immediately after the start of droplet deposition, but reached 100%, while decreasing the increase rate of the area ratio by overlapping. It was possible to estimate the amount of paint that overlapped and adhered using the overlapping ratio. The thickness of the coating could be calculated from the fluorescence intensity. Additionally, the smoothness of the coating film could be evaluated by examining the standard deviation of the fluorescence intensity. The thickness of the coating increased, linearly, from the start of droplet deposition to the end of spraying. The standard deviation increased near the onset of droplet deposition and then decreased until the time of film formation. At the end of the injection, the standard deviation decreased, and a very smooth coating was formed. The flow of the coating film formation was observed by tracking the fluorescent particles in the paint. We found that the higher the injection pressure, the more active the flow of the coating film. In this study, the thickness of the coating film and the flow of the formation process could be observed in detail at the same time using fluorescence observation. By using the methodology of this paper, it is possible to quantitatively analyze the coating film formation process. This method is applicable for various industrial processes, such as the painting of automobiles, ships and buildings. The conditions for forming a smooth and high-quality coating surface with a smaller amount of paint can be determined on the basis of data rather than empirical rules.
Author Contributions
Conceptualization, K.A.; investigation, A.Y., K.H. and K.A.; writing—original draft preparation, K.H.; writing—review and editing, A.Y. and K.A.; supervision, K.A. All authors have read and agreed to the published version of the manuscript.
Funding
This research received no external funding.
Institutional Review Board Statement
Not applicable.
Informed Consent Statement
Not applicable.
Data Availability Statement
Data is contained within the article.
Conflicts of Interest
The authors declare no conflict of interest.
References
- Celebi, U.B.; Vardar, N. Investigation of VOC Emissions from Indoor and Outdoor Painting Processes in Shipyards. Atmos. Environ. 2008, 42, 5685–5695. [Google Scholar] [CrossRef]
- Li, F.; Niu, J.; Zhang, L. A Physically-based Model for Prediction of VOCs Emissions from Paint Applied to an Absorptive Substrate. Build. Environ. 2006, 41, 1317–1325. [Google Scholar] [CrossRef]
- Julio, L.; Rivera, T.R. A Framework for Environmental and Energy Analysis of the Automobile Painting Process. Procedia CIRP 2014, 15, 171–175. [Google Scholar]
- Kim, B.; Yoon, J.; Choi, B.; Shin, Y.C. Exposure Assessment Suggests Exposure to Lung Cancer Carcinogens in a Painter Working in an Automobile Bumper Shop. Saf. Health Work 2013, 4, 216–220. [Google Scholar] [CrossRef] [PubMed] [Green Version]
- Mølgaard, B.; Viitanen, A.; Kangas, A.; Huhtiniemi, M.; Larsen, S.T.; Vanhala, E.; Hussein, T.; Boor, B.E.; Hämeri, K.; Koivisto, A.J. Exposure to Airborne Particles and Volatile Organic Compounds from Polyurethane Molding, Spray Painting, Lacquering, and Gluing in a Workshop. Int. J. Environ. Res. Public Health 2015, 12, 3756–3773. [Google Scholar] [CrossRef] [PubMed] [Green Version]
- Nwaogu, U.C.; Tiedje, N.S. Foundry Coating Technology: A Review. Mater. Sci. Appl. 2011, 2, 1143–1160. [Google Scholar] [CrossRef] [Green Version]
- Akafuah, N.K.; Poozesh, S.; Salaimeh, A.; Patrick, G.; Lawler, K.; Saito, K. Evolution of the Automotive Body Coating Process-A Review. Coatings 2016, 6, 24. [Google Scholar] [CrossRef] [Green Version]
- Slegers, S.; Linzas, M.; Drijkoningen, J.; D’Haen, J.; Reddy, N.K.; Deferme, W. Surface Roughness Reduction of Additive Manufactured Products by Applying a Functional Coating Using Ultrasonic Spray Coating. Coatings 2017, 7, 208. [Google Scholar] [CrossRef] [Green Version]
- Luangkularb, S.; Prombanpong, S.; Tangwarodomnukun, V. Material Consumption and Dry Film Thickness in Spray Coating Process. Procedia CIRP 2014, 17, 789–794. [Google Scholar] [CrossRef] [Green Version]
- Tanno, S.; Ohani, S. Mechanism of Paint Film Formation in Spray Coating. Kagaku Kogaku Ronbunshu 1977, 3, 593–599. [Google Scholar] [CrossRef]
- Tachi, K.; Okuda, C.; Oyama, Y. Shouichi Suzuki: Paint Film Formation Process in Spray Coating. J. Jpn. Soc. Color Mater. 1986, 59, 711–718. [Google Scholar] [CrossRef] [Green Version]
- Yano, A.; Oe, T.; Takaishi, K.; Amagai, K. Visualization of the Paint Film Formation Process During Spray Coating. Adv. Exp. Mech. 2019, 4, 43–48. [Google Scholar]
Figure 1.
Experimental setup.

Figure 2.
Experimental setup for calibrations of the relationship between fluorescence intensity and the coating film thickness.
Figure 2.
Experimental setup for calibrations of the relationship between fluorescence intensity and the coating film thickness.

Figure 3.
Calibration curve showing the coating film thickness in relation to the fluorescence intensity.
Figure 3.
Calibration curve showing the coating film thickness in relation to the fluorescence intensity.

Figure 4.
Model of coating formation [12] (adapted with permission from The Japanese Society for Experimental Mechanics).
Figure 4.
Model of coating formation [12] (adapted with permission from The Japanese Society for Experimental Mechanics).

Figure 5.
Fluorescent and pseudo-color images of the paint droplet.

Figure 6.
Coating thickness on a red line in Figure 5.
Figure 6.
Coating thickness on a red line in Figure 5.

Figure 7.
Fluorescent and pseudo-color images of the paint droplet.

Figure 8.
Coating thickness on a red line in Figure 7.
Figure 8.
Coating thickness on a red line in Figure 7.

Figure 9.
Fluorescence image of spray coating.

Figure 10.
Fluorescence intensity distribution on a line graph.

Figure 11.
Evolution of the coating thickness over time.

Figure 12.
Fluorescence intensity distribution.

Figure 13.
Standard deviation.

Figure 14.
Coating film thickness under various injection pressures Pin.

Figure 15.
Definition of Lp and Ld.

Figure 16.
Time evolution of Ld with injection pressure of Pin = 0.1 Pa.

Figure 17.
Time evolution of Ld with injection pressure of Pin = 0.2 Pa.

Figure 18.
Time evolution of Ld with injection pressure of Pin = 0.5 Pa.

Publisher’s Note: MDPI stays neutral with regard to jurisdictional claims in published maps and institutional affiliations. |
© 2021 by the authors. Licensee MDPI, Basel, Switzerland. This article is an open access article distributed under the terms and conditions of the Creative Commons Attribution (CC BY) license (https://creativecommons.org/licenses/by/4.0/).
Share and Cite
MDPI and ACS Style
Yano, A.; Hamada, K.; Amagai, K. Evaluation of Coating Film Formation Process Using the Fluorescence Method. Coatings 2021, 11, 1076. https://doi.org/10.3390/coatings11091076
AMA Style
Yano A, Hamada K, Amagai K. Evaluation of Coating Film Formation Process Using the Fluorescence Method. Coatings. 2021; 11(9):1076. https://doi.org/10.3390/coatings11091076
Chicago/Turabian StyleYano, Ayako, Kyoichi Hamada, and Kenji Amagai. 2021. "Evaluation of Coating Film Formation Process Using the Fluorescence Method" Coatings 11, no. 9: 1076. https://doi.org/10.3390/coatings11091076
Note that from the first issue of 2016, this journal uses article numbers instead of page numbers. See further details here.