
Selection of appropriate reference genes for RT-qPCR analysis under abiotic stress and hormone treatment in celery
- Published
- Accepted
- Received
- Academic Editor
- Genlou Sun
- Subject Areas
- Molecular Biology, Plant Science
- Keywords
- Abiotic stress, Celery, Expression stability, Hormone stimuli, Reference gene, RT-qPCR
- Copyright
- © 2019 Feng et al.
- Licence
- This is an open access article distributed under the terms of the Creative Commons Attribution License, which permits unrestricted use, distribution, reproduction and adaptation in any medium and for any purpose provided that it is properly attributed. For attribution, the original author(s), title, publication source (PeerJ) and either DOI or URL of the article must be cited.
- Cite this article
- 2019. Selection of appropriate reference genes for RT-qPCR analysis under abiotic stress and hormone treatment in celery. PeerJ 7:e7925 https://doi.org/10.7717/peerj.7925
Abstract
Celery is one of the most important vegetable crop and its yield and quality is influenced by many environmental factors. Researches on gene expression not only help to unravel the molecular regulatory mechanism but also identify the key genes in the biological response. RT-qPCR is a commonly used technology to quantify the gene expression. Selecting an appropriate reference gene is an effective approach to improve the accuracy of RT-qPCR assay. To our knowledge, the evaluation of reference genes under different treatments in celery has not been reported yet. In this study, the expression stabilities of eight candidate reference genes (ACTIN, eIF-4α, GAPDH, TBP, TUB-A, UBC, TUB-B, and EF-1α) under abiotic stresses (heat, cold, drought, and salt) and hormone treatments (SA, MeJA, GA, and ABA) were detected. The expression stabilities of candidate genes were compared and ranked by geNorm, NormFinder, BestKeeper, ΔCt, and RefFinder programs. The results calculated by different programs were not completely consistent. Considering the comprehensive analysis results, ACTIN was the most stable reference gene and TUB-B showed the worst expression stabilities under the selected abiotic stress and hormone treatments in celery. The reliability of reference genes was further confirmed by the normalization of CAT1 gene under drought stress. This study presented evidences and basis to select the appropriate reference genes under different treatments in celery.
Introduction
Celery (Apium graveolens L.), one plant of Apiaceae, is an important vegetable and its leaves are the mainly edible organs (Li et al., 2018). Nowadays, celery is commonly consumed for its abundant nutritional values (apigenin, vitamin C, and cellulose etc.) and low calorie contents (Dianat et al., 2015). The yield and quality of celery are influenced by many environmental factors (temperature, moisture, soil salinity, and hormone) (Golldack, Luking & Yang, 2011). During plant development, many environmental stresses disturb the physiological processes and affect the growth and development (Cattivelli et al., 2008; Kosova, Prasil & Vitamvas , 2008; Wang et al., 2012; Wang et al., 2014). Phytohormones are known to be plant growth regulators and play vital roles during plant development, such as gibberellic acid (GA), salicylic acid (SA), abscisic acid (ABA), and methyl jasmonate (MeJA) (Moons et al., 1997; Wang et al., 2015; Liu et al., 2016; Galimba et al., 2019). Under abiotic stress and hormone treatments, plants generate many responsive mechanisms to relieve environmental damages (Kosova, Vitamvas & Prasil , 2014). The molecular mechanisms including physical, physiological, and biochemical responses were associated with the expressions of certain genes (Wang, Vinocur & Altman, 2003). Researches on expressions of abiotic stress-related genes provided strategies to improve the stress resistance in molecular breeding (Brikis et al., 2018; Wang et al., 2019).
The gene expression analysis was commonly applied to understand the molecular regulatory mechanisms and identify the key genes in the current molecular biology (Bustin et al., 2005; Silva et al., 2019). Quantitative real time polymerase chain reaction (RT-qPCR) has become a recognized technology for quantifying the gene expression due to its advantages of high-throughput, high-sensitivity, high-veracity, and low-cost (Gachon, Mingam & Charrier , 2004; Bustin et al., 2005; Derveaux, Vandesompele & Hellemans , 2010; Miao et al., 2019). Nevertheless, many factors including enzymatic efficiency, RNA purity, and cDNA quality may affect the accuracy and credibility of RT-qPCR results (Vandesompele et al., 2002). Several strategies were applied to ensure the accuracy of RT-qPCR. Selection of one or more suitable internal control genes, also known as house-keeping genes, has become a frequently method to normalize the gene expression (Gutierrez et al., 2008).
The house-keeping genes have been identified in many species, including Arabidopsis (Czechowski et al., 2005), rice (Jain et al., 2006), and soybean (Libault et al., 2008). House-keeping genes, e.g., glyceraldehyde-3-phosphate dehydrogenase (GAPDH), ubiquitin C (UBC), actin (ACTIN), eukaryotic translation initiation factor 4α (eIF-4α), elongation factor-1α (EF-1α), TATA-box binding protein (TBP), and tubulin (TUB) were widely used as reference gene to standardize the expressions of target genes (Dheda et al., 2004; Galli et al., 2013; Li et al., 2016b). However, some studies also indicated that the expressions of certain house-keeping genes under different tissues or treatments were fluctuant (Barber et al., 2005; Borowski et al., 2014; Tian et al., 2015). The unstable reference gene would significantly influence the accuracy and reliability of target gene expression quantification. The suitable reference gene for RT-qPCR analysis of celery under different tissues and developmental stages has been identified in previous study (Li et al., 2016b). To our knowledge, the appropriate reference genes for RT-qPCR analysis of celery under abiotic stress and hormone treatment have not been reported yet. Considering the roles of gene expression in the molecular biology of celery, the comparison and selection of reference genes under various experimental treatments is necessary.
Here, eight known house-keeping genes, ACTIN, eIF-4α, GAPDH, TBP, TUB-A, UBC, TUB-B, and EF-1α were selected based on the previous studies (Tian et al., 2015; Li et al., 2016b; Wu et al., 2016). The expression stabilities of candidate reference genes under abiotic stresses (heat, cold, drought, and salt) and hormone treatments (GA, SA, ABA, and MeJA) were assessed by using geNorm (Vandesompele et al., 2002), NormFinder (Andersen, Jensen & Orntoft , 2004), BestKeeper (Pfaffl et al., 2004), ΔCt (Silver et al., 2006), and RefFinder programs (Xie et al., 2012). The gene encoding catalase in celery, CAT1, was selected to assess the reliability of candidate reference genes under drought treatment. The current study will provide useful information for selecting suitable reference genes to conduct RT-qPCR analysis in celery under abiotic stress and hormone stimuli.
Materials & Methods
Plant materials and experimental treatments
The seeds of celery cultivar ‘Jinnan Shiqin’ were germinated in a petri dish at room temperature. Celery seedlings were transferred into the plastic pots with 1:1 mixture of soil and vermiculite. Seedlings were grown in an artificial climatic chamber with the condition as previously described (Feng et al., 2018c). After 8 weeks of growth, the vigorous seedlings with consistent growth were selected for experimental treatments. As for heat and cold stresses, seedlings were placed in the light incubators with temperatures of 38 °C and 4 °C, respectively. For drought and salt stresses, seedlings were irrigated with 0.5 L of PEG 6000 (20%) and NaCl (0.2 M) solution, respectively (Tian et al., 2015). As for hormones treatments, celery leaves were sprayed with 0.5 L of GA (1.4 mM), SA (1.4 mM), ABA (0.1 mM), and MeJA (0.8 mM), respectively (Chan, 2012; Zhu et al., 2013; Li et al., 2016a). All of the treatments were performed with three biological replicates. Leaf blades were collected from untreated and treated celery plants after 2 h of treatments.
Preparation of RNA and cDNA
Total RNA was extracted from the celery samples by using Total RNA Kit (Tiangen, Beijing, China) based on manufacturer’s protocol. The concentration and quality of total RNA was measured by using a One-Drop™ spectrophotometer. The qualified RNA (1 µg) were used to synthesize cDNA by using the Prime-Script RT reagent kit (TaKaRa, Dalian, China) with a 20 µL system.
RT-qPCR analysis
Eight candidate celery genes, ACTIN, eIF-4α, GAPDH, TBP, TUB-A, UBC, TUB-B, and EF-1α, were used to screen the appropriate reference genes under different abiotic stresses and hormone treatments based on the celery transcriptome and genome data (Li et al., 2014; Li et al., 2016b; Feng et al., 2018a). The primer sequences of ACTIN, GAPDH, TBP, TUB-A, UBC were consistent with previous study (Li et al., 2016b). The gene sequences of eIF-4α, TUB-B, and EF-1α cloned from ‘Jinnan Shiqin’ were different from the previous study, which were listed in Table S1. The RT-qPCR primer sequences of TUB-B, eIF-4α, and EF-1α genes were re-designed by using Primer Premier 6.0 software. The gene information and primer sequences were listed in Table 1. The specificity and accuracy of primers were determined by the PCR assay and single peak in the melting curve of RT-qPCR assay.
| Gene | RT-qPCR primers (5′→3′) forward/reverse | Amplification efficiency (E%) | Correlation coefficient (R2) | References |
|---|---|---|---|---|
| eIF-4α | GTTCCTCTCGTGTGCTCATTACCA/ TCAACCAACATCCTGTCATCATCCTT | 93.8 | 0.999 | N/A |
| TUB-B | TGGTGGCACTGGATCTGGTATGG/ ACTTTCGGAGAAGGGAAGACTGAA | 98.2 | 0.999 | N/A |
| EF-1α | GCTCCAGTTCTTGATTGCCACACTA/ TCATCTTAACGAATCCAGCATCACCAT | 94.8 | 0.996 | N/A |
| ACTIN | AGAAGTCCTGTTCCAGCCGTCTT/ CGAACCACCACTGAGCACTATGTT | 100.7 | 0.998 | Li et al. (2016b) |
| GAPDH | CAAGGACTGGAGAGGTGGAAGAG/ GTGAGGTCAACAACTGAGACATCC | 96.8 | 0.998 | Li et al. (2016b) |
| TBP | CTGGAGCAAAGAGCGAACAACAAT/ GCAAGACCTTCAAGCCTGATGG | 109.7 | 0.996 | Li et al. (2016b) |
| TUB-A | CCTCACCACAGGTCTCAACTTCAG/ GGTGTAGGTTGGACGCTCAATGT | 92.0 | 0.992 | Li et al. (2016b) |
| UBC | AGGCTTGAGATTCGCTGTCTGTAA/ TATTCCTGGAGCTGGCTCACTGA | 101.9 | 0.992 | Li et al. (2016b) |
The 10-fold, 102-fold, 103-fold, 104-fold, 105-fold, and 106-fold diluted cDNA were used to calculate the amplification efficiency (E) and correlation coefficient (R2), respectively (Fig. S1). The 16-fold diluted cDNA was used for RT-qPCR analysis. RT-qPCR assay was performed with the SYBR Premix Ex Taq (TaKaRa, Dalian, China) with a 20 µL system. The reaction volume contained 10 µL of SYBR Green I Mix, 7.2 µL of deionized water, 2 µL of diluted cDNA, and 0.4 µL of forward and reverse primers. The program of RT-qPCR assay was followed our previous study (Feng et al., 2018c).
Data analysis
As for the primers of eIF-4 α, TUB-B, and EF-1α genes, the standard curves were established based on the Cq values of different dilution gradient with their corresponding logarithm of dilution multiples. The slope of standard curve was used to calculate the amplification efficiency (E) of primers, according to the formula: E% = (10[−1∕slope]-1) ×100% (Radonic et al., 2004). The amplification efficiency of other primers was reported in previous study (Li et al., 2016b).
The stabilities of candidate reference genes under different treatments were ranked based on the analysis results of geNorm (Vandesompele et al., 2002), NormFinder (Andersen, Jensen & Orntoft , 2004), BestKeeper (Pfaffl et al., 2004), ΔCt (Silver et al., 2006), and RefFinder (Xie et al., 2012). Nine Cq values were obtained from each sample, including three biological and three technical replicates. Before geNorm and NormFinder analysis, the raw Cq values should be calculated with the 2−ΔCt formula (ΔCt indicated the Cq value of the sample minus the minimum Cq value). The geNorm program calculated the M value of each gene, and two genes with the lowest M value were the most stable reference genes. The pairwise variation (Vn/n+1) in geNorm program indicated the optimal number of reference gene for the normalization of RT-qPCR. If the Vn/n+1 value <0.15, the optimal number of optimal internal reference genes is n; adversely, the optimal number of reference genes is n + 1. NormFinder ranked the candidate genes according to the stability value calculated by the expression variations of intragroup and the intergroup of each gene. In BestKeeper, the standard deviation (SD) and coefficient of variation (CV) were calculated based on the Cq values. BestKeeper ranked the stability of candidate genes according to the SD and CV values. The lowest SD and CV values indicated the most stable reference gene. The expression stabilities of ‘pairs of genes’ were compared by ΔCt program. Based on the analysis results of various programs, the stability of candidate reference genes were comprehensively evaluated and ranked by using RefFinder.
Validation of reference genes
Catalase was involved in plant regulatory mechanism under abiotic stress (Hu et al., 2010). Based on the protein sequence of AtCAT2 (GenBank accession number NP_195235.1) and our transcriptome and genome data, the celery CAT1 gene was identified and cloned from ‘Jinnan Shiqin’. The sequence of CAT1 has been submitted to GenBank (accession number: MN365877). The RT-qPCR primer of CAT1 was designed by using Premier 6.0 software according to the gene sequence (forward: 5′-TTCACCTTCCTCTTGGATGACATTGG-3′and reverse: 5′-GCTCCTCCGATCTTGATGGCTTC-3′). The RT-qPCR assay of CAT1 gene under drought treatment was conducted to validate the candidate reference genes. The relative expression level of CAT1 gene was normalized using various reference genes according to the 2−ΔΔCt method (Schmittgen & Livak, 2008).
Results
Selection of candidate reference genes
Eight genes, ACTIN, eIF-4α, GAPDH, TBP, TUB-A, UBC, TUB-B, and EF-1α were selected as candidate reference genes from celery. The specificity and efficiency of primers were confirmed by PCR amplification assay and melting curve of RT-qPCR. The single band corresponding to various reference genes was detected in the electrophoretogram with 1.5% agarose gel, respectively (Fig. S2). The melting curves showed that candidate reference genes had a single peak in RT-qPCR reaction (Fig. S3). The amplification efficiency (E) and correlation coefficient (R2) of the candidate genes meets the standard of RT-qPCR assay (90% <E % <110%; R2 > 0.99; Table 1) (Li et al., 2016b).
RT-qPCR results of candidate reference genes
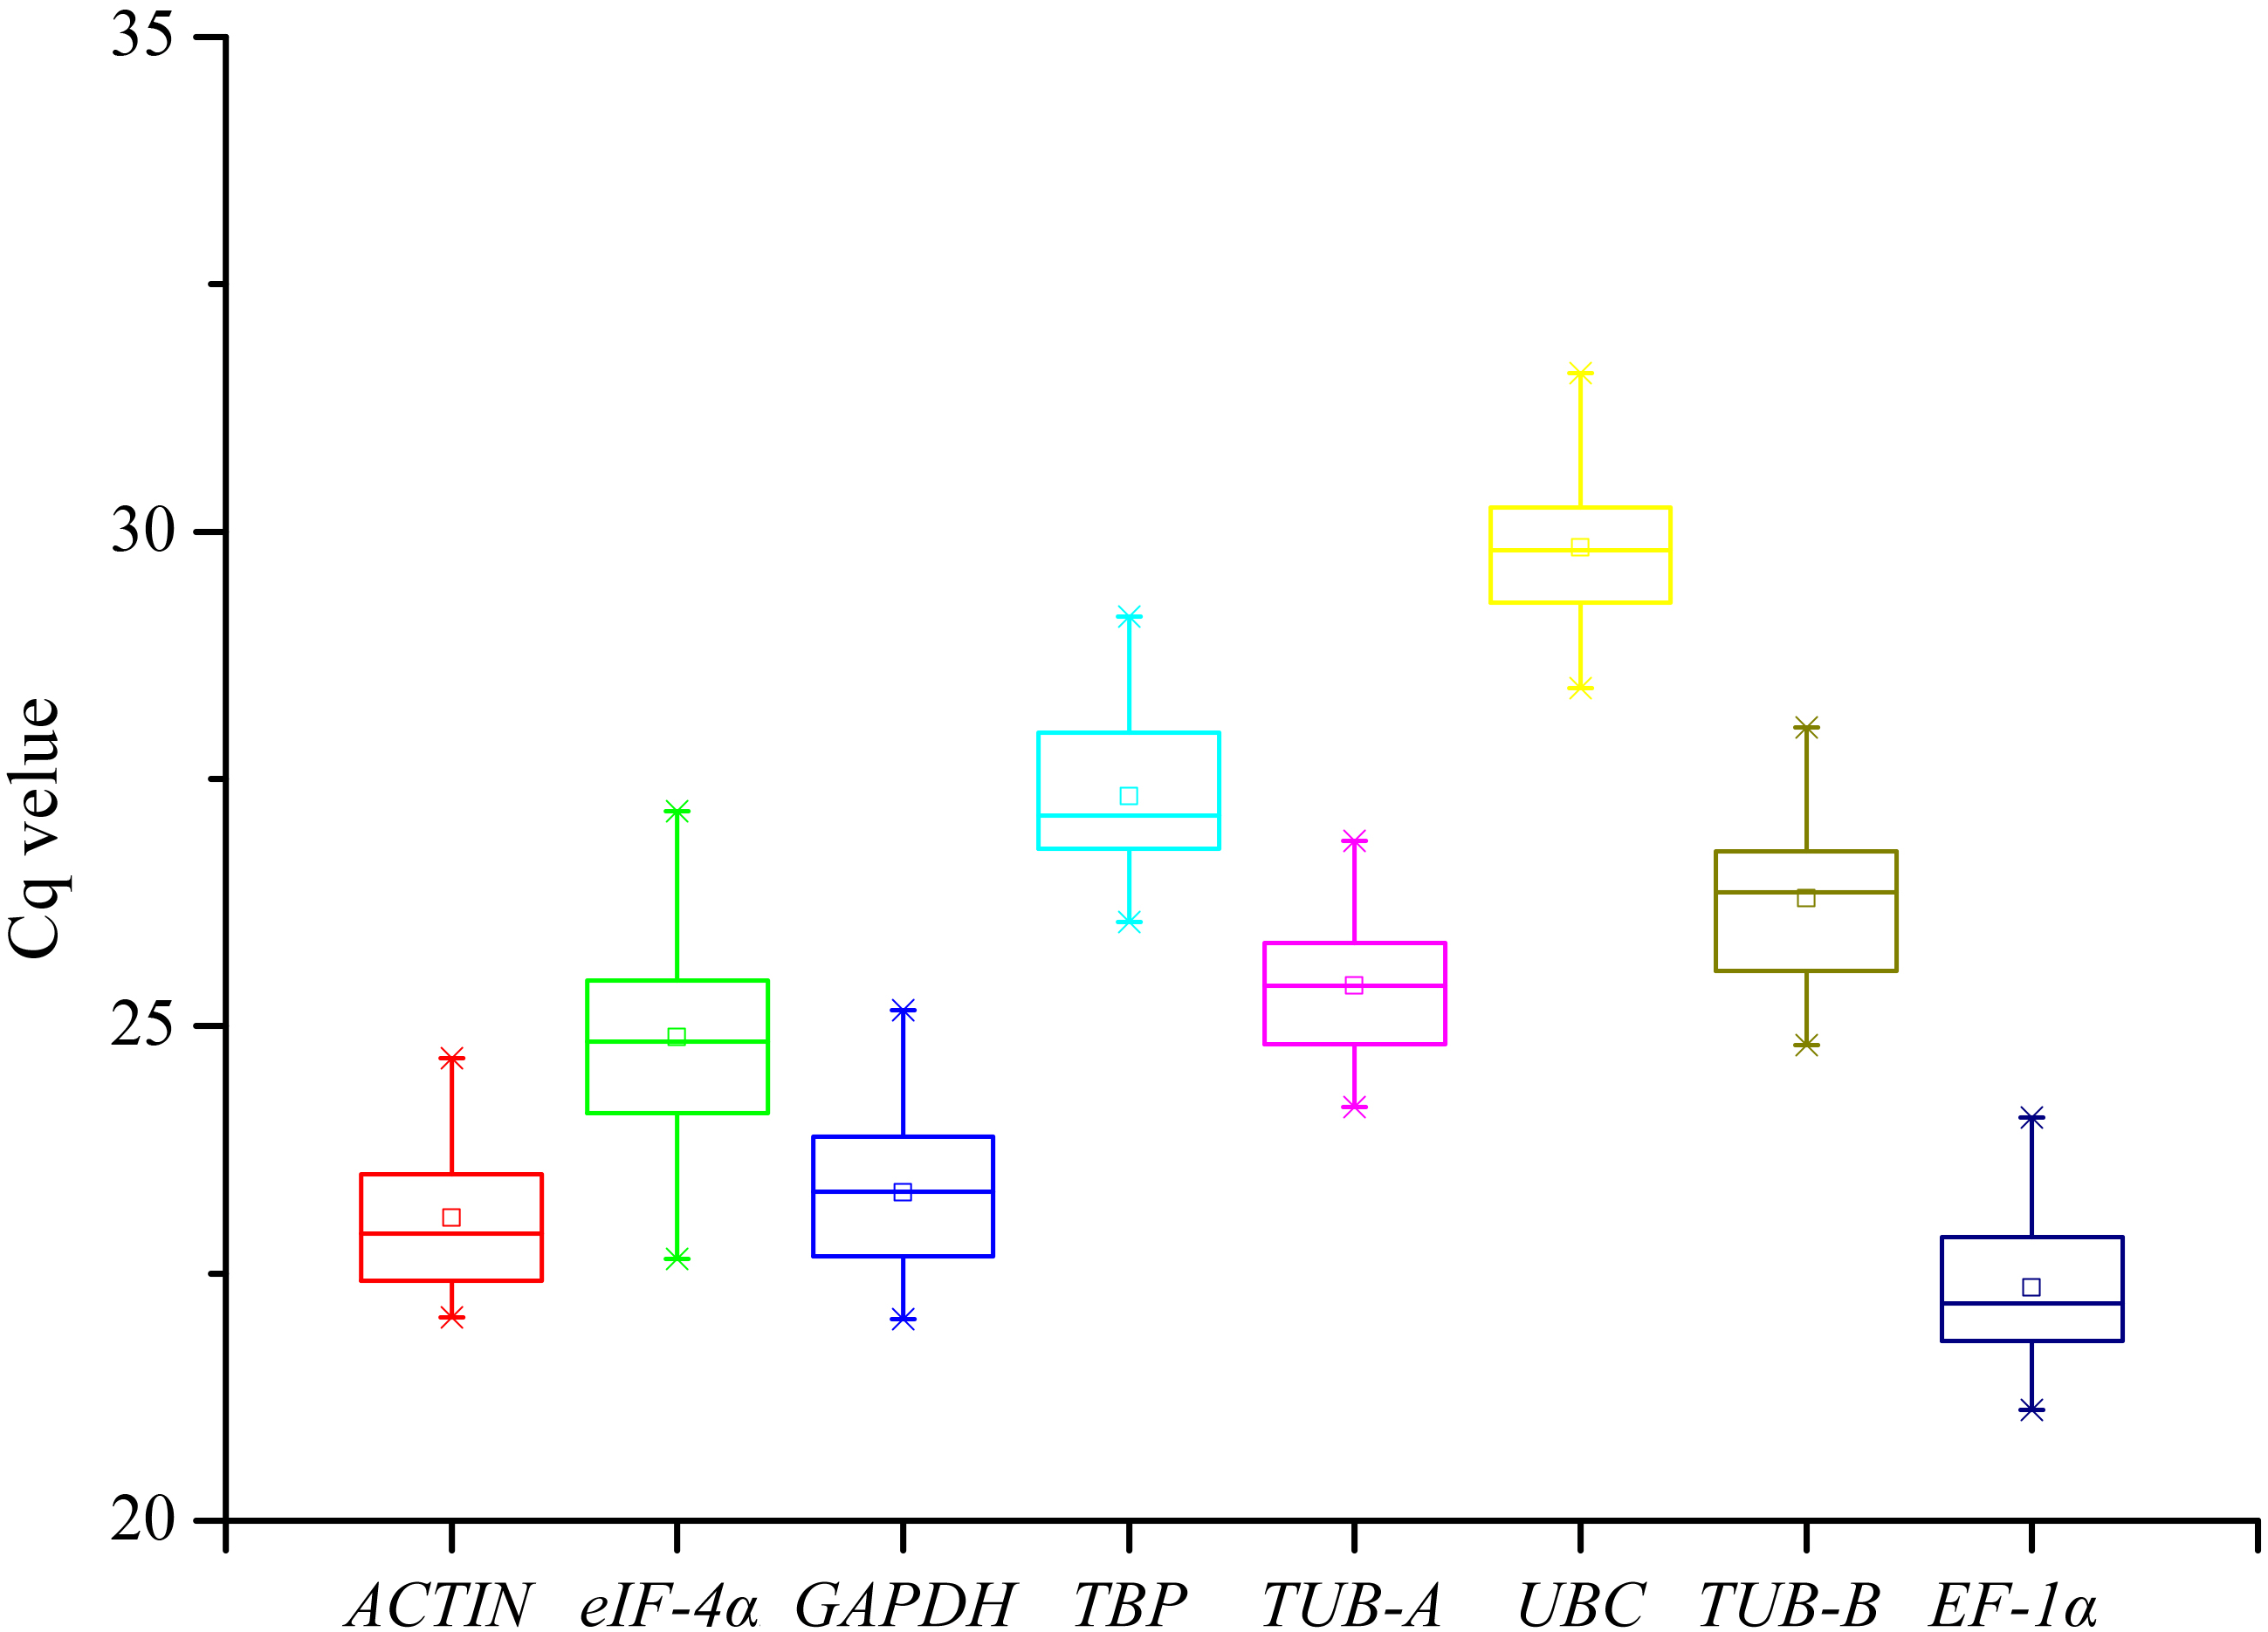
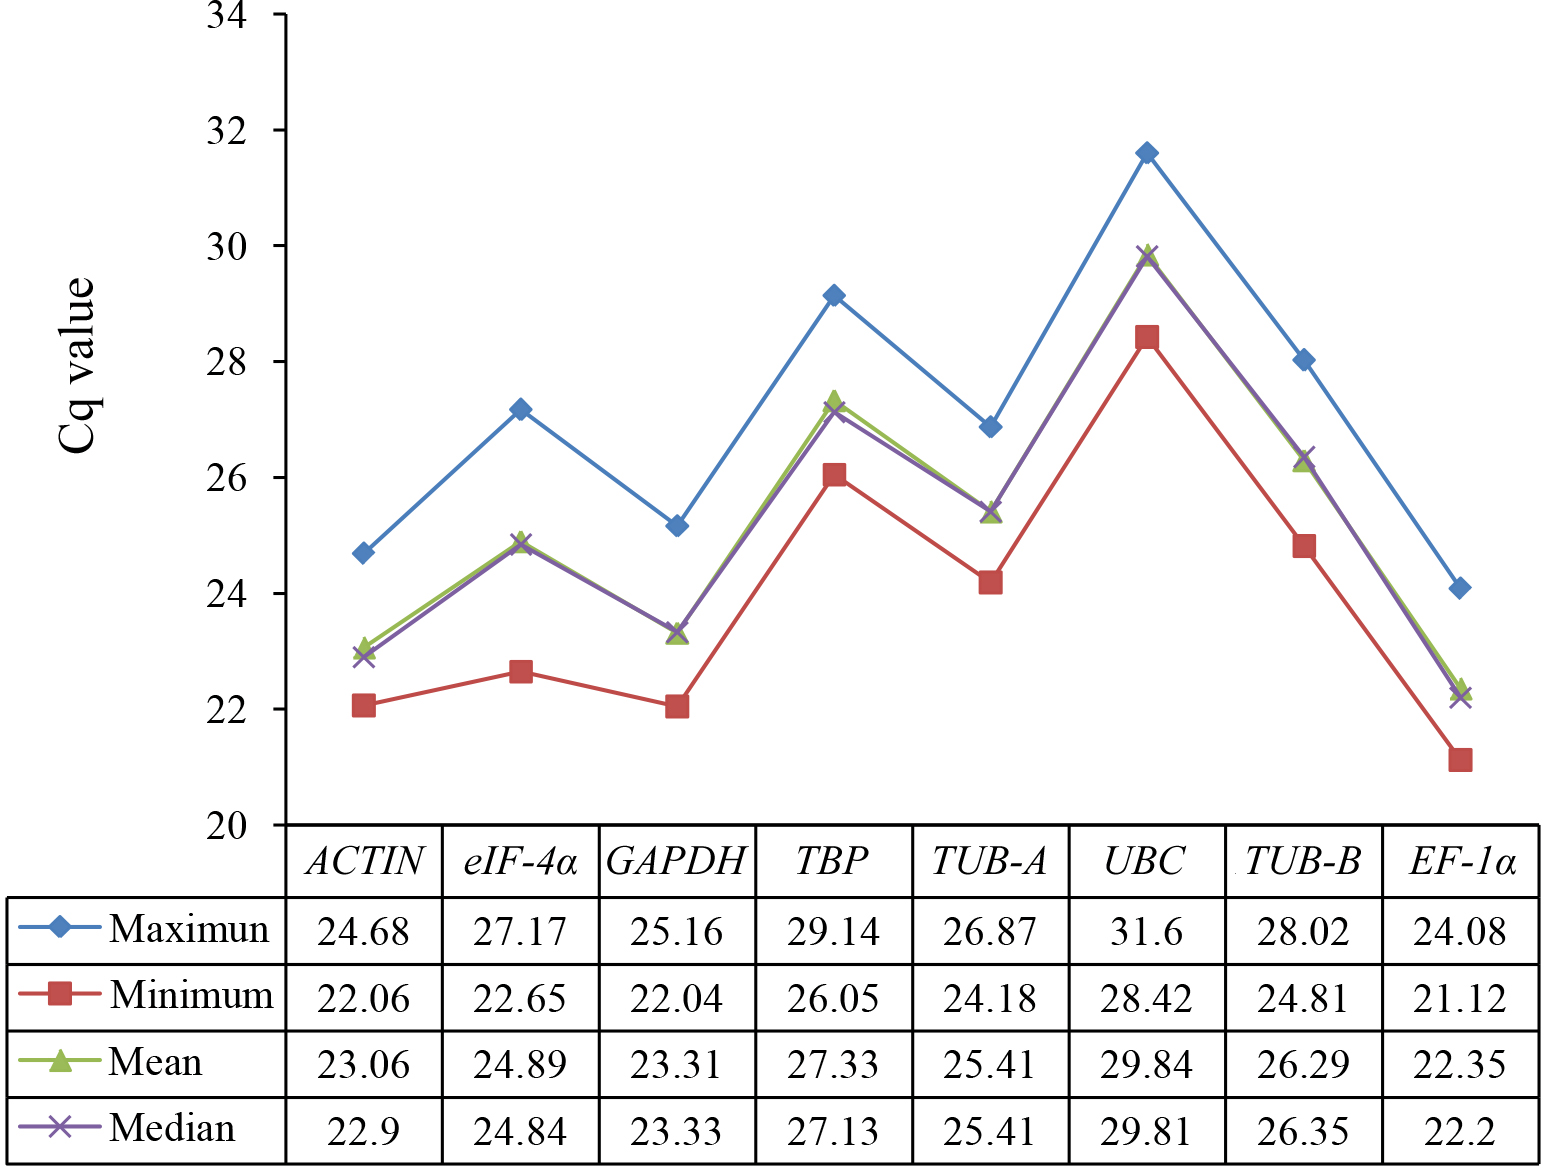
The gene expression levels were indicated with the Cq values in RT-qPCR assay. The raw Cq values of candidate reference genes were listed in Table S2 and their statistics were demonstrated in Fig. 1. The Cq values of 8 candidate reference genes under different treatments ranged from 21.12 (EF-1α under SA) to 31.60 (UBC under GA). Low Cq values represent high expression levels, whereas high Cq values represent low expression levels. The EF-1α showed the highest expression level with the lowest average Cq value (22.35), followed by ACTIN (23.06), GAPDH (23.31), eIF-4α (24.89), TUB-A (25.41), TUB-B (26.29), TBP (27.33), and UBC (29.84) (Fig. 2).
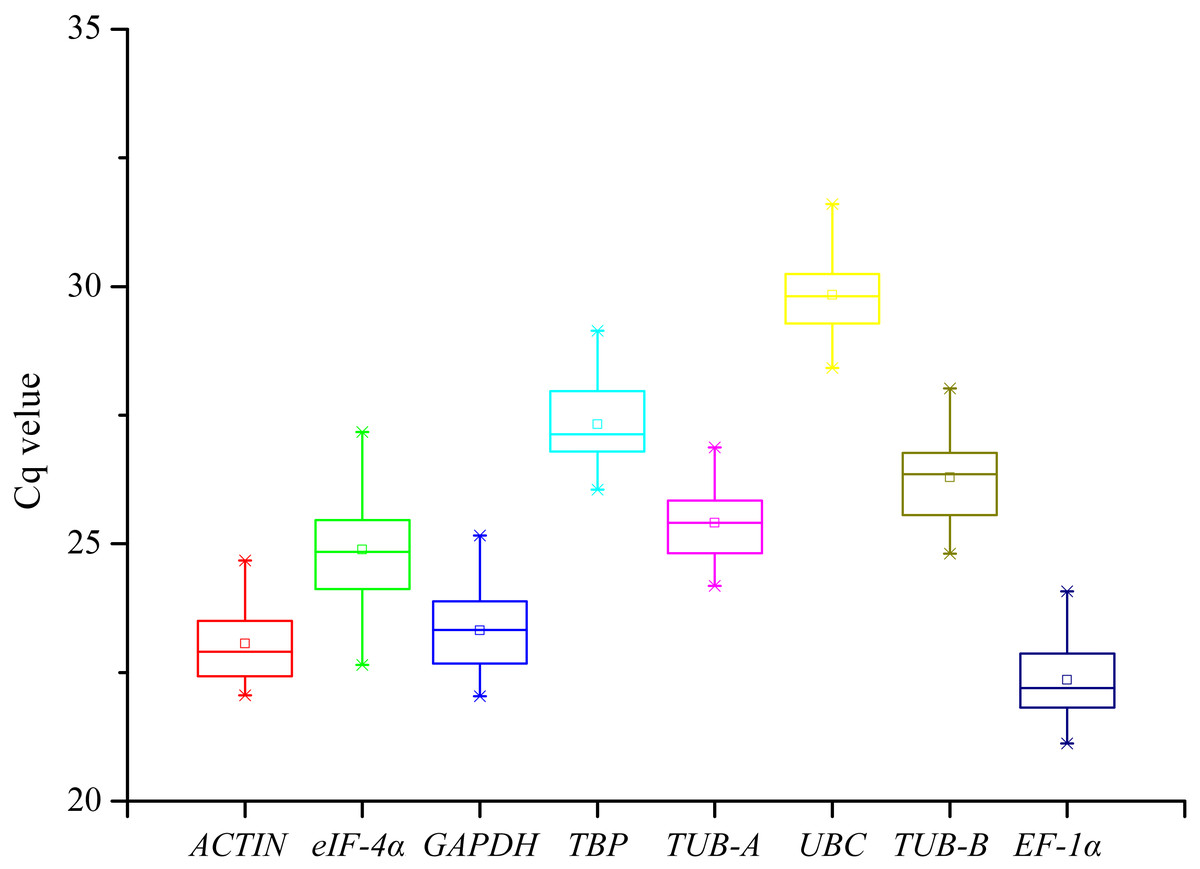
Figure 1: The distribution of Cq values of eight candidate reference genes in all samples from the RT-qPCR assay.
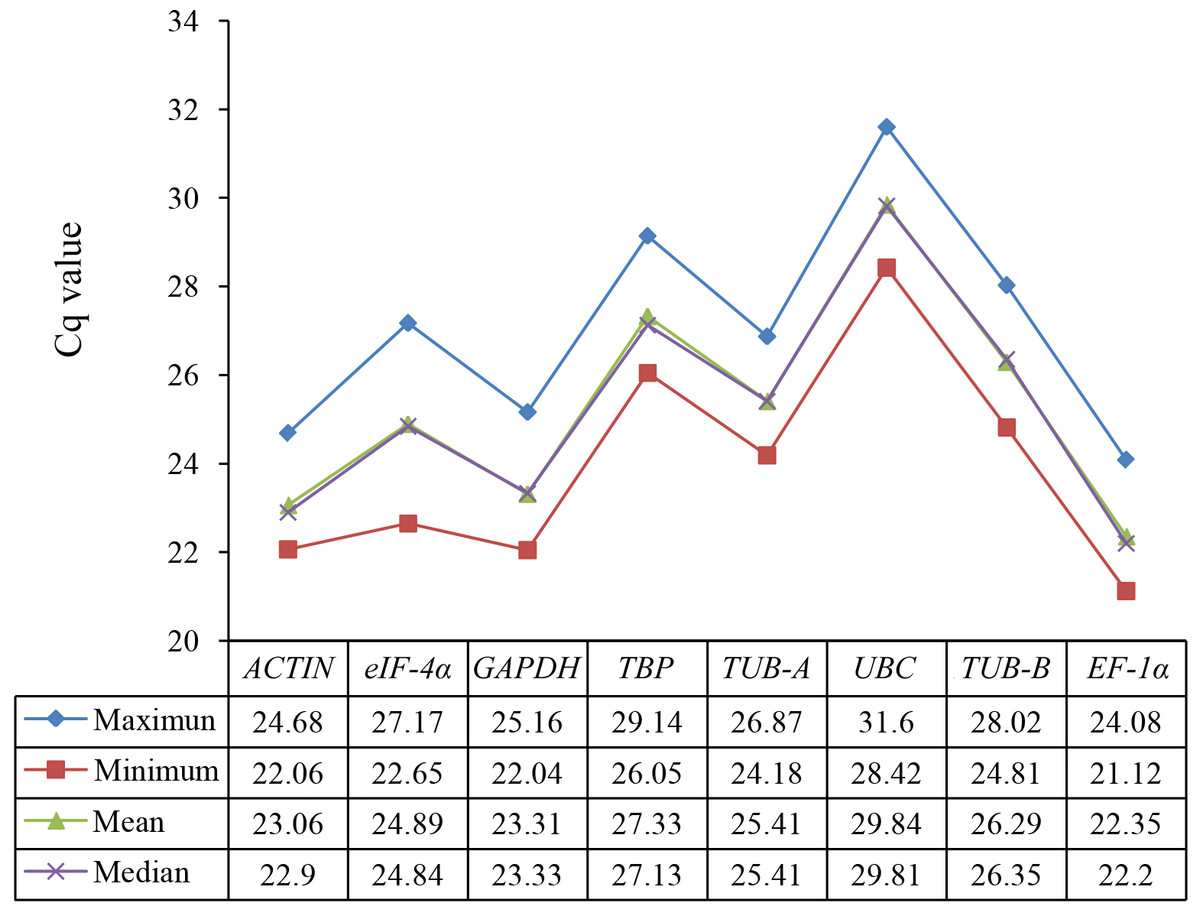
Figure 2: Statistic analysis (maximum, minimum, mean, and median) of Cq values of eight candidate reference genes in all samples.
Stability analysis of candidate reference genes
Five programs, geNorm, NormFinder, BestKeeper, ΔCt, and RefFinder were used to determine the expression stability of the celery candidate reference genes. To evaluate the gene stabilities under different treatments, celery plants were subjected with 8 treatments, abiotic stresses (heat, cold, drought, and salt) and hormone treatments (SA, MeJA, GA, and ABA). In addition to the stability analysis of single-treatment, these 8 treatments were also divided into three groups, namely abiotic stress (heat, cold, drought, and salt), hormone stimuli (GA, SA, ABA, and MeJA), and total (all treatments), for stability analysis.
geNorm analysis
geNorm program calculated the M values of candidate reference genes and ranked their stabilities based on the M values. The lowest M value represents the most stable expression stability. As shown in Table 2, the M value of reference genes under all treatments were less than the default limit (1.5), which indicated that their expression stability were satisfactory. EF-1α and TBP genes were the most stable reference genes with the lowest M value under cold, drought, SA, and GA treatments. Meanwhile, TBP was also showed the highest expression stability under heat and MeJA treatments. Under salt treatment, ACTIN and TUB-A showed the lowest M value and they were the most stable reference genes. As for the abiotic stress and total groups, the M values of ACTIN and EF-1α were the lowest, which indicated that they were the most stable reference genes (Table 3). As for the hormone stimuli group, TBP and GAPDH showed higher high expression stability than others. In the stability analysis of all three groups, TUB-B was the worst stable reference gene with the lowest M value.
| Treatments | Rank | geNorm | NormFinder | BestKeeper | ΔCt | RefFinder | |||||
|---|---|---|---|---|---|---|---|---|---|---|---|
| Gene | Stability | Gene | Stability | Gene | SD | CV | Gene | Stability | Gene | ||
| Heat | 1 | TBP | 0.27 | ACTIN | 0.12 | GAPDH | 0.67 | 2.84 | ACTIN | 0.50 | ACTIN |
| 2 | UBC | 0.27 | TUB-A | 0.13 | TUB-A | 0.72 | 2.77 | TUB-A | 0.52 | GAPDH | |
| 3 | GAPDH | 0.33 | GAPDH | 0.22 | UBC | 0.76 | 2.57 | GAPDH | 0.55 | TUB-A | |
| 4 | TUB-A | 0.44 | EF-1α | 0.31 | TBP | 0.76 | 2.78 | EF-1α | 0.62 | TBP | |
| 5 | ACTIN | 0.47 | TBP | 0.34 | ACTIN | 0.80 | 3.41 | TBP | 0.63 | UBC | |
| 6 | EF-1α | 0.52 | eIF-4α | 0.37 | EF-1α | 0.82 | 3.61 | UBC | 0.65 | EF-1α | |
| 7 | eIF-4α | 0.55 | UBC | 0.37 | eIF-4α | 0.99 | 3.95 | eIF-4α | 0.70 | eIF-4α | |
| 8 | TUB-B | 0.63 | TUB-B | 0.54 | TUB-B | 1.05 | 4.00 | TUB-B | 0.85 | TUB-B | |
| Cold | 1 | EF-1α | 0.20 | EF-1α | 0.04 | TUB-B | 0.47 | 1.77 | TBP | 0.35 | EF-1α |
| 2 | TBP | 0.20 | ACTIN | 0.05 | TUB-A | 0.49 | 1.89 | EF-1α | 0.35 | TBP | |
| 3 | ACTIN | 0.21 | TBP | 0.08 | EF-1α | 0.49 | 2.19 | ACTIN | 0.36 | ACTIN | |
| 4 | GAPDH | 0.24 | TUB-A | 0.16 | GAPDH | 0.51 | 2.17 | GAPDH | 0.42 | TUB-A | |
| 5 | UBC | 0.27 | UBC | 0.20 | UBC | 0.55 | 1.83 | TUB-A | 0.42 | GAPDH | |
| 6 | TUB-A | 0.30 | GAPDH | 0.20 | ACTIN | 0.58 | 2.50 | UBC | 0.43 | TUB-B | |
| 7 | eIF-4α | 0.37 | eIF-4α | 0.38 | TBP | 0.60 | 2.15 | eIF-4α | 0.61 | UBC | |
| 8 | TUB-B | 0.46 | TUB-B | 0.49 | eIF-4α | 0.84 | 3.34 | TUB-B | 0.74 | eIF-4α | |
| Drought | 1 | EF-1α | 0.18 | EF-1α | 0.03 | UBC | 0.22 | 0.73 | EF-1α | 0.38 | EF-1α |
| 2 | TBP | 0.18 | TBP | 0.09 | TUB-A | 0.33 | 1.27 | TBP | 0.38 | TBP | |
| 3 | ACTIN | 0.22 | ACTIN | 0.11 | TBP | 0.40 | 1.43 | ACTIN | 0.41 | ACTIN | |
| 4 | GAPDH | 0.25 | TUB-A | 0.21 | EF-1α | 0.43 | 1.86 | GAPDH | 0.47 | TUB-A | |
| 5 | TUB-A | 0.31 | GAPDH | 0.23 | ACTIN | 0.44 | 1.84 | TUB-A | 0.48 | UBC | |
| 6 | UBC | 0.35 | UBC | 0.28 | GAPDH | 0.47 | 1.94 | UBC | 0.52 | GAPDH | |
| 7 | eIF-4α | 0.43 | eIF-4α | 0.38 | TUB-B | 0.55 | 2.03 | eIF-4α | 0.64 | eIF-4α | |
| 8 | TUB-B | 0.50 | TUB-B | 0.45 | eIF-4α | 0.63 | 2.44 | TUB-B | 0.71 | TUB-B | |
| Salt | 1 | ACTIN | 0.22 | ACTIN | 0.08 | EF-1α | 0.54 | 2.40 | ACTIN | 0.43 | ACTIN |
| 2 | TUB-A | 0.22 | TBP | 0.13 | TUB-B | 0.59 | 2.22 | TBP | 0.45 | TUB-A | |
| 3 | EF-1α | 0.28 | TUB-A | 0.14 | TUB-A | 0.59 | 2.30 | TUB-A | 0.48 | EF-1α | |
| 4 | TBP | 0.32 | EF-1α | 0.17 | UBC | 0.60 | 2.00 | EF-1α | 0.48 | TBP | |
| 5 | GAPDH | 0.36 | UBC | 0.21 | ACTIN | 0.66 | 2.84 | UBC | 0.51 | UBC | |
| 6 | UBC | 0.37 | GAPDH | 0.25 | TBP | 0.81 | 2.95 | GAPDH | 0.52 | TUB-B | |
| 7 | eIF-4α | 0.46 | eIF-4α | 0.49 | GAPDH | 0.83 | 3.56 | eIF-4α | 0.77 | GAPDH | |
| 8 | TUB-B | 0.56 | TUB-B | 0.56 | eIF-4α | 1.09 | 4.37 | TUB-B | 0.86 | eIF-4α | |
| SA | 1 | EF-1α | 0.17 | EF-1α | 0.06 | UBC | 0.60 | 2.00 | ACTIN | 0.34 | TBP |
| 2 | TBP | 0.17 | ACTIN | 0.06 | TUB-B | 0.70 | 2.67 | TBP | 0.35 | EF-1α | |
| 3 | ACTIN | 0.18 | TBP | 0.07 | TBP | 0.74 | 2.69 | EF-1α | 0.35 | ACTIN | |
| 4 | GAPDH | 0.24 | TUB-A | 0.17 | ACTIN | 0.77 | 3.33 | TUB-A | 0.42 | UBC | |
| 5 | TUB-A | 0.28 | GAPDH | 0.22 | TUB-A | 0.79 | 3.07 | GAPDH | 0.44 | TUB-A | |
| 6 | UBC | 0.32 | UBC | 0.26 | EF-1α | 0.84 | 3.78 | UBC | 0.49 | GAPDH | |
| 7 | eIF-4α | 0.38 | eIF-4α | 0.36 | GAPDH | 0.86 | 3.68 | eIF-4α | 0.59 | TUB-B | |
| 8 | TUB-B | 0.46 | TUB-B | 0.44 | eIF-4α | 1.04 | 4.16 | TUB-B | 0.68 | eIF-4α | |
| MEJA | 1 | TBP | 0.28 | EF-1α | 0.09 | ACTIN | 0.69 | 3.00 | ACTIN | 0.46 | EF-1α |
| 2 | GAPDH | 0.28 | ACTIN | 0.09 | eIF-4α | 0.86 | 3.42 | EF-1α | 0.49 | ACTIN | |
| 3 | ACTIN | 0.32 | TBP | 0.21 | GAPDH | 0.76 | 3.27 | TBP | 0.52 | TBP | |
| 4 | EF-1α | 0.34 | GAPDH | 0.22 | TBP | 0.82 | 2.99 | GAPDH | 0.53 | GAPDH | |
| 5 | TUB-A | 0.40 | TUB-A | 0.35 | TUB-A | 0.96 | 3.79 | TUB-A | 0.65 | UBC | |
| 6 | eIF-4α | 0.47 | eIF-4α | 0.36 | UBC | 0.33 | 1.11 | eIF-4α | 0.68 | TUB-A | |
| 7 | UBC | 0.53 | UBC | 0.42 | TUB-B | 0.85 | 3.24 | UBC | 0.73 | eIF-4α | |
| 8 | TUB-B | 0.61 | TUB-B | 0.54 | EF-1α | 0.62 | 2.74 | TUB-B | 0.86 | TUB-B | |
| GA | 1 | EF-1α | 0.17 | EF-1α | 0.05 | TBP | 0.35 | 1.24 | EF-1α | 0.39 | EF-1α |
| 2 | TBP | 0.17 | ACTIN | 0.08 | EF-1α | 0.35 | 1.50 | ACTIN | 0.40 | TBP | |
| 3 | GAPDH | 0.23 | TBP | 0.11 | ACTIN | 0.38 | 1.58 | TBP | 0.41 | ACTIN | |
| 4 | ACTIN | 0.27 | GAPDH | 0.25 | GAPDH | 0.42 | 1.72 | GAPDH | 0.50 | GAPDH | |
| 5 | TUB-A | 0.37 | eIF-4α | 0.32 | TUB-A | 0.42 | 1.62 | TUB-A | 0.59 | TUB-A | |
| 6 | eIF-4α | 0.43 | TUB-A | 0.33 | TUB-B | 0.50 | 1.89 | eIF-4α | 0.59 | eIF-4α | |
| 7 | TUB-B | 0.47 | TUB-B | 0.35 | UBC | 0.54 | 1.76 | TUB-B | 0.61 | TUB-B | |
| 8 | UBC | 0.52 | UBC | 0.39 | eIF-4α | 0.57 | 2.22 | UBC | 0.65 | UBC | |
| ABA | 1 | EF-1α | 0.23 | EF-1α | 0.05 | UBC | 0.33 | 1.09 | EF-1α | 0.38 | EF-1α |
| 2 | GAPDH | 0.23 | TBP | 0.15 | GAPDH | 0.53 | 2.24 | TBP | 0.42 | GAPDH | |
| 3 | TBP | 0.27 | GAPDH | 0.20 | EF-1α | 0.54 | 2.40 | GAPDH | 0.45 | TBP | |
| 4 | ACTIN | 0.34 | TUB-A | 0.20 | eIF-4α | 0.59 | 2.30 | TUB-A | 0.46 | UBC | |
| 5 | TUB-A | 0.36 | ACTIN | 0.21 | TBP | 0.62 | 2.22 | ACTIN | 0.46 | TUB-A | |
| 6 | UBC | 0.42 | eIF-4α | 0.34 | TUB-A | 0.62 | 2.42 | UBC | 0.59 | ACTIN | |
| 7 | eIF-4α | 0.46 | UBC | 0.34 | ACTIN | 0.71 | 3.06 | eIF-4α | 0.60 | eIF-4α | |
| 8 | TUB-B | 0.49 | TUB-B | 0.36 | TUB-B | 0.77 | 2.94 | TUB-B | 0.60 | TUB-B | |
| Group | Rank | geNorm | NormFinder | BestKeeper | ΔCt | RefFinder | |||||||
|---|---|---|---|---|---|---|---|---|---|---|---|---|---|
| Gene | Stability | Gene | Stability | Gene | SD | CV | Gene | Stability | Gene | ||||
| Abiotic stress | 1 | ACTIN | 0.24 | ACTIN | 0.13 | TUB-A | 0.49 | 1.92 | ACTIN | 0.44 | ACTIN | ||
| 2 | EF-1α | 0.24 | TUB-A | 0.14 | UBC | 0.55 | 1.87 | TUB-A | 0.45 | TUB-A | |||
| 3 | TUB-A | 0.30 | GAPDH | 0.19 | EF-1α | 0.59 | 2.60 | GAPDH | 0.47 | EF-1α | |||
| 4 | GAPDH | 0.35 | TBP | 0.21 | GAPDH | 0.60 | 2.56 | TBP | 0.48 | GAPDH | |||
| 5 | TBP | 0.37 | EF-1α | 0.22 | TBP | 0.60 | 2.20 | EF-1α | 0.49 | TBP | |||
| 6 | UBC | 0.41 | UBC | 0.30 | TUB-B | 0.65 | 2.44 | UBC | 0.56 | UBC | |||
| 7 | eIF-4α | 0.48 | eIF-4α | 0.41 | ACTIN | 0.65 | 2.80 | eIF-4α | 0.68 | eIF-4α | |||
| 8 | TUB-B | 0.53 | TUB-B | 0.42 | eIF-4α | 0.92 | 3.68 | TUB-B | 0.69 | TUB-B | |||
| Hormone stimuli | 1 | TBP | 0.30 | EF-1α | 0.10 | UBC | 0.54 | 1.78 | EF-1α | 0.43 | EF-1α | ||
| 2 | GAPDH | 0.30 | ACTIN | 0.13 | TUB-A | 0.65 | 2.55 | ACTIN | 0.44 | ACTIN | |||
| 3 | EF-1α | 0.35 | TBP | 0.22 | EF-1α | 0.65 | 2.92 | GAPDH | 0.48 | TBP | |||
| 4 | ACTIN | 0.36 | GAPDH | 0.22 | ACTIN | 0.66 | 2.85 | TBP | 0.49 | GAPDH | |||
| 5 | TUB-A | 0.39 | TUB-A | 0.28 | TUB-B | 0.66 | 2.54 | TUB-A | 0.54 | TUB-A | |||
| 6 | eIF-4α | 0.45 | eIF-4α | 0.33 | eIF-4α | 0.72 | 2.86 | eIF-4α | 0.60 | UBC | |||
| 7 | UBC | 0.48 | UBC | 0.33 | TBP | 0.75 | 2.74 | UBC | 0.60 | eIF-4α | |||
| 8 | TUB-B | 0.53 | TUB-B | 0.40 | GAPDH | 0.77 | 3.29 | TUB-B | 0.67 | TUB-B | |||
| Total | 1 | ACTIN | 0.28 | ACTIN | 0.16 | TUB-A | 0.55 | 2.15 | ACTIN | 0.47 | ACTIN | ||
| 2 | EF-1α | 0.28 | EF-1α | 0.18 | UBC | 0.58 | 1.96 | EF-1α | 0.49 | EF-1α | |||
| 3 | TUB-A | 0.34 | GAPDH | 0.19 | EF-1α | 0.59 | 2.63 | GAPDH | 0.50 | TUB-A | |||
| 4 | GAPDH | 0.39 | TBP | 0.23 | ACTIN | 0.62 | 2.68 | TBP | 0.52 | GAPDH | |||
| 5 | TBP | 0.41 | TUB-A | 0.25 | TBP | 0.65 | 2.37 | TUB-A | 0.54 | TBP | |||
| 6 | eIF-4α | 0.48 | eIF-4α | 0.37 | GAPDH | 0.68 | 2.90 | eIF-4α | 0.66 | UBC | |||
| 7 | UBC | 0.53 | UBC | 0.40 | TUB-B | 0.70 | 2.65 | UBC | 0.68 | eIF-4α | |||
| 8 | TUB-B | 0.57 | TUB-B | 0.41 | eIF-4α | 0.80 | 3.20 | TUB-B | 0.70 | TUB-B | |||
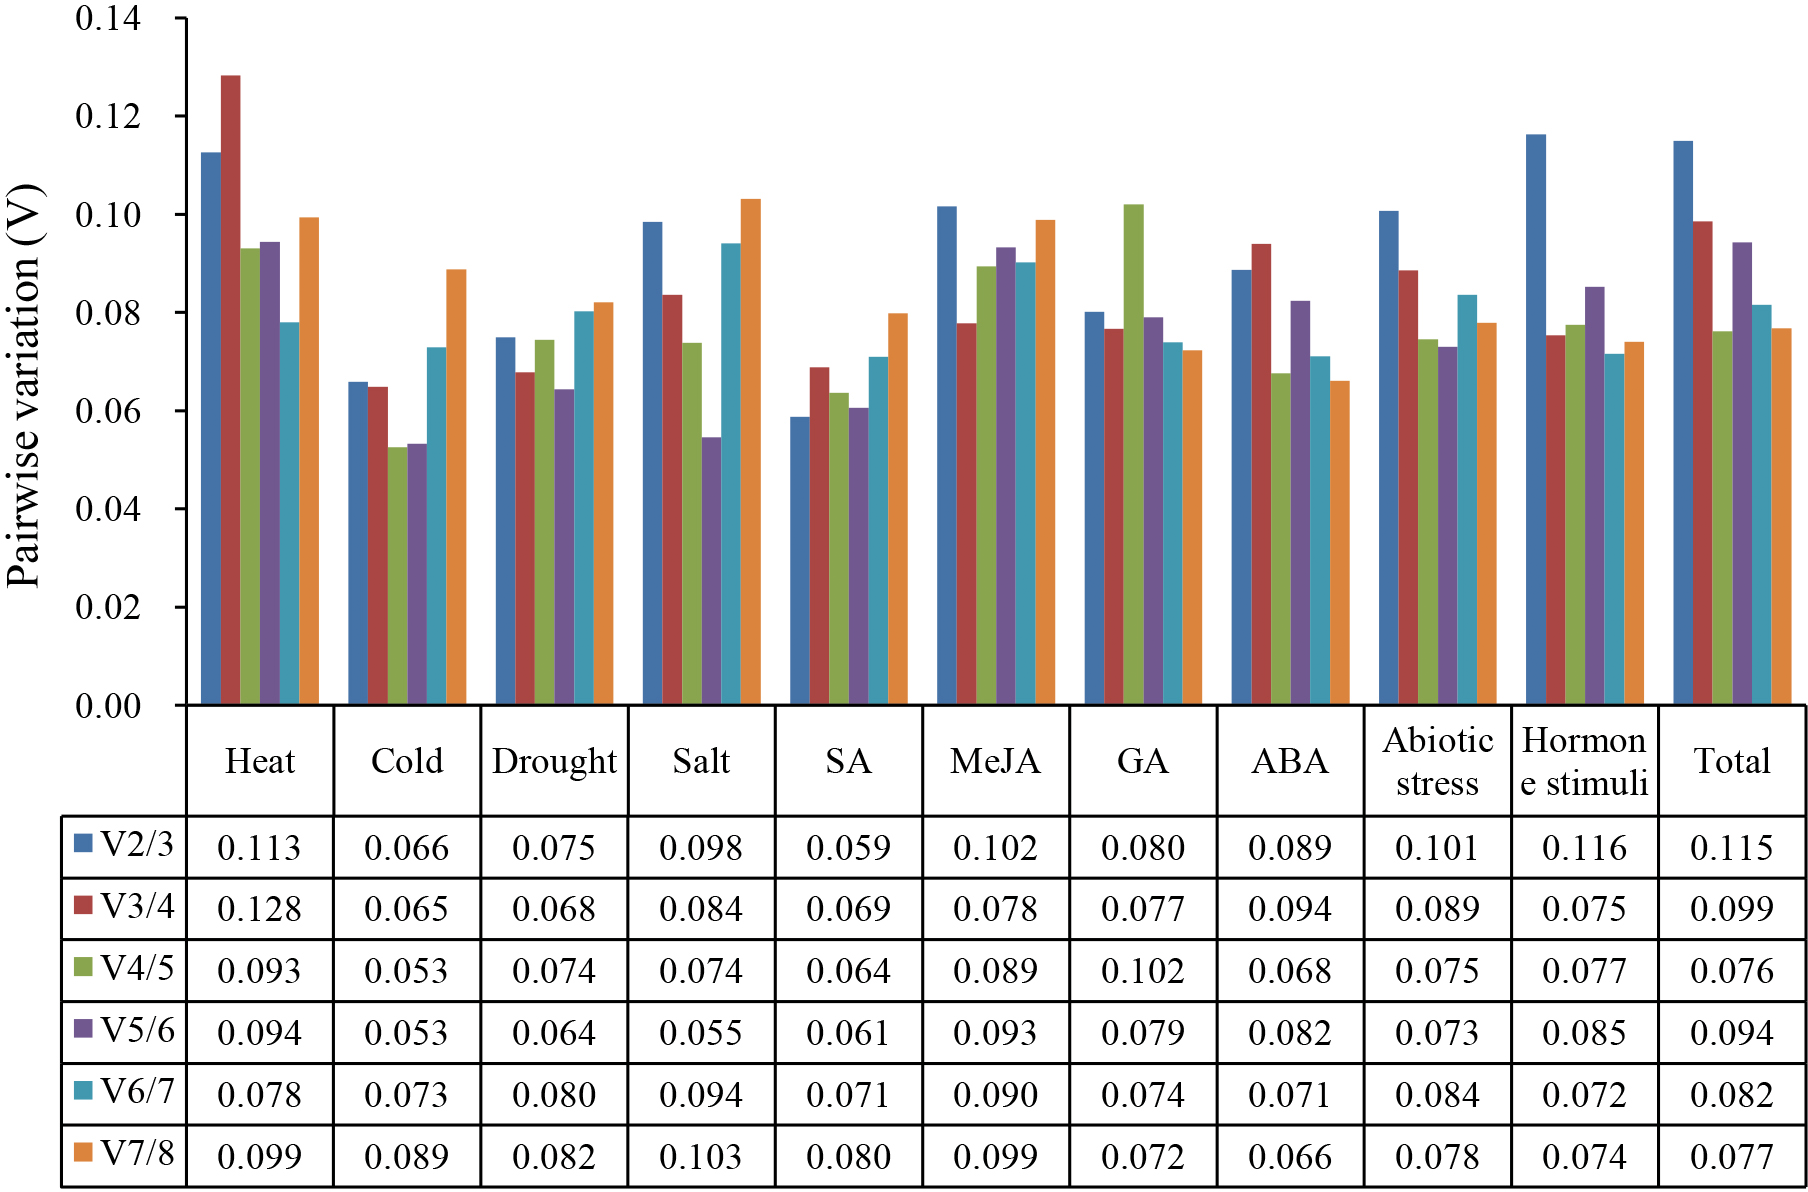
In RT-qPCR analysis, multiple reference genes can be selected to quantify the expression of the target gene with more accuracy. The pairwise variations (Vn/n+1) calculated by geNorm program were used to determine the optimal number of reference genes in the normalization. As shown in Fig. 3, the V2/3 values of eight single-treatment and the three treatment groups were less than 0.15. Therefore, two suitable reference genes were adequate for gene expression normalization under the above treatments.
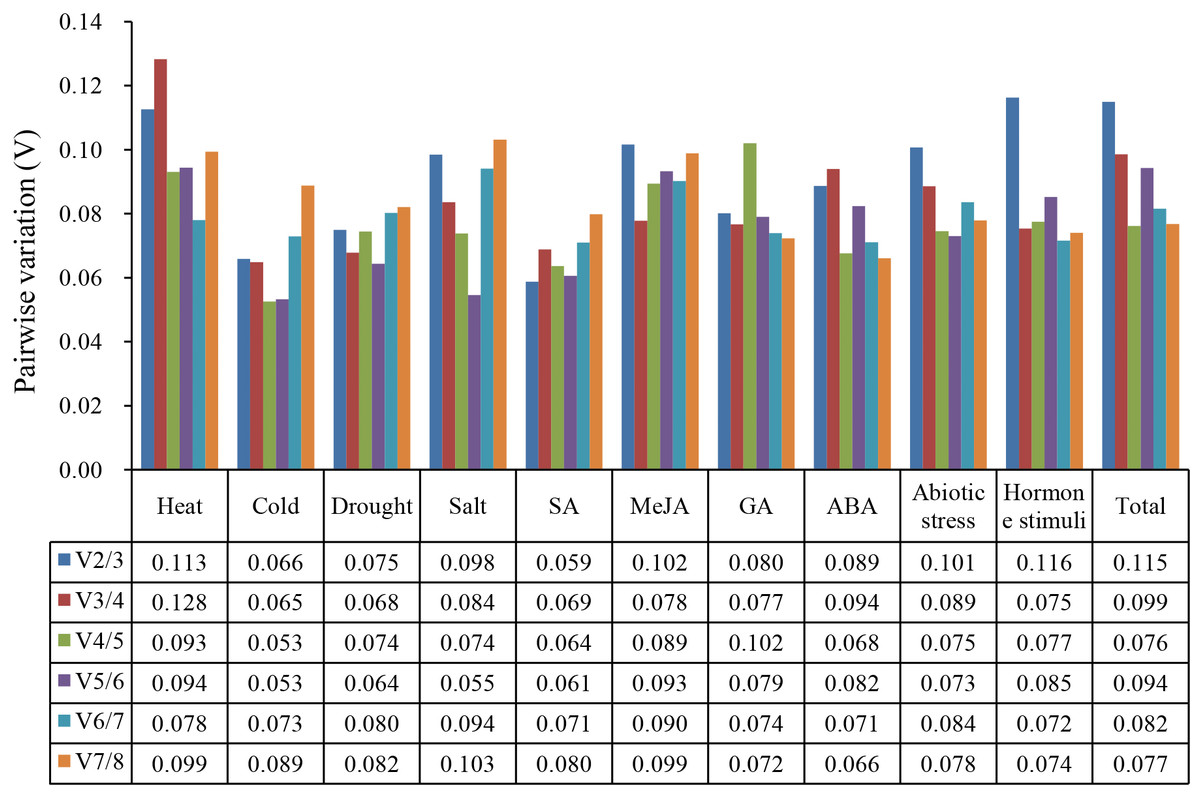
Figure 3: Calculation of optimal number of reference gene during gene normalization by pairwise variation from geNorm.
NormFinder analysis
NormFinder program ranked the reference genes based on the calculated stability values in different experimental designs. As shown in Tables 2 and 3, ACTIN was the most stable reference gene under heat and salt treatments, and EF-1α was the most stable gene under cold, drought and all tested hormone treatments. When performing stability analysis among multiple treatments, ACTIN was the most stable reference gene with the lowest stability value in both the abiotic stress group and the total group. As for the hormone stimuli group, the expression stability of EF-1α gene was the highest, followed by ACTIN gene. Similar to the geNorm analysis, eIF-4α, UBC, and TUB-B were the worst stable reference genes in the NormFinder analysis.
BestKeeper analysis
The BestKeeper program ranked the reference genes based on the SD and CV of Cq values in the RT-qPCR assay. Low SD and CV values represent the high expression stability. UBC was the most stable reference gene under drought, SA, and ABA treatments. EF-1α and ACTIN were the most stable reference genes under salt and MeJA treatments, respectively. As for the abiotic stress group and the total group, TUB-A showed the highest expression stability, and eIF-4α showed the lowest expression stability. UBC was the most stable reference gene and GAPDH was the least stable reference gene in hormone stimuli group.
ΔCt analysis
The expression stability of the eight candidate gene was calculated and ranked based on the ΔCt method. In single treatment, ACTIN was the most stable expressed reference gene under heat, salt, SA, and MEJA treatments, respectively. As for drought, GA, and ABA treatments, EF-1α gene was the best reference gene for gene normalization. The expression stability under different groups was also investigated. ACTIN gene showed the most expression stability under abiotic stress treatments. In hormone stimuli and total groups, the expressions of ACTIN and EF-1α genes showed the highest stabilities. In addition, ΔCt analysis results indicated that TUB-B was the worst reference gene under most treatments.
RefFinder analysis
Considering the results of all statistic methods, the stability of those celery candidate reference genes was comprehensively evaluated by RefFinder. As shown in Table 2, ACTIN gene was the most stable reference gene under heat and salt treatments. EF-1α showed the most stable expression under cold, drought, MEJA, GA, and ABA treatments. As for the stability analysis in different groups, ACTIN gene was the most stable reference gene and TUB-B was the worst stable reference gene in the abiotic stress, hormone stimuli, and total groups (Table 3).
Validation of reference genes
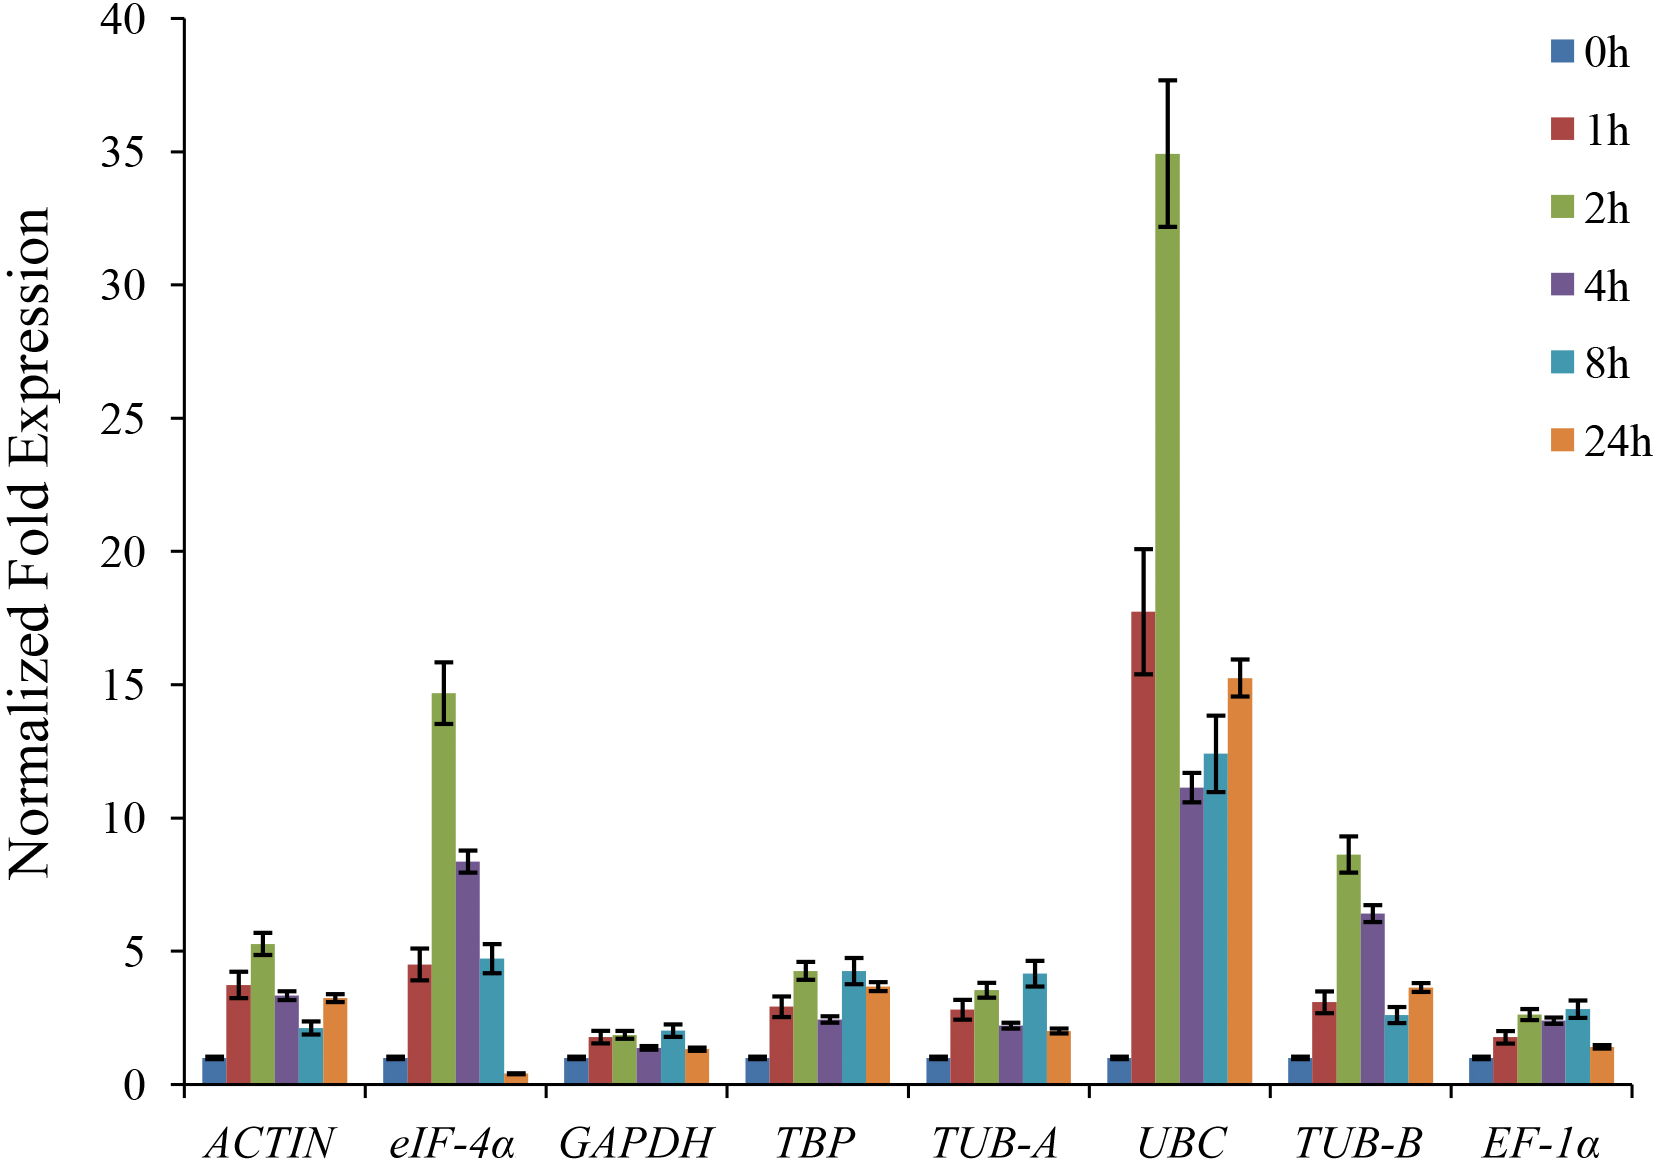
The CAT gene encoded the catalase, which is involved in the regulation of stress defense in plants (Willekens et al., 1997). The expression of the CAT gene could be induced by many abiotic stresses, including chilling, drought, and salt (Fadzillah et al., 1996; Kim et al., 2007). The celery CAT1 gene was cloned from the cDNA of ‘Jinnan Shiqin’ and sequenced. In this study, the relative expression level of CAT1 gene under drought stress was detected to validate the reference genes. As shown in Fig. 4, the expression levels of CAT1 gene normalized by various reference genes were different. The expression levels of CAT1 gene under drought stress were increased using ACTIN, GAPDH, TBP, TUB-A, UBC, TUB-B, and EF-1α as reference gene, respectively. When used the unstable reference gene eIF-4α for normalization, the expression of the CAT1 gene was decreased after 24 h of drought treatment.
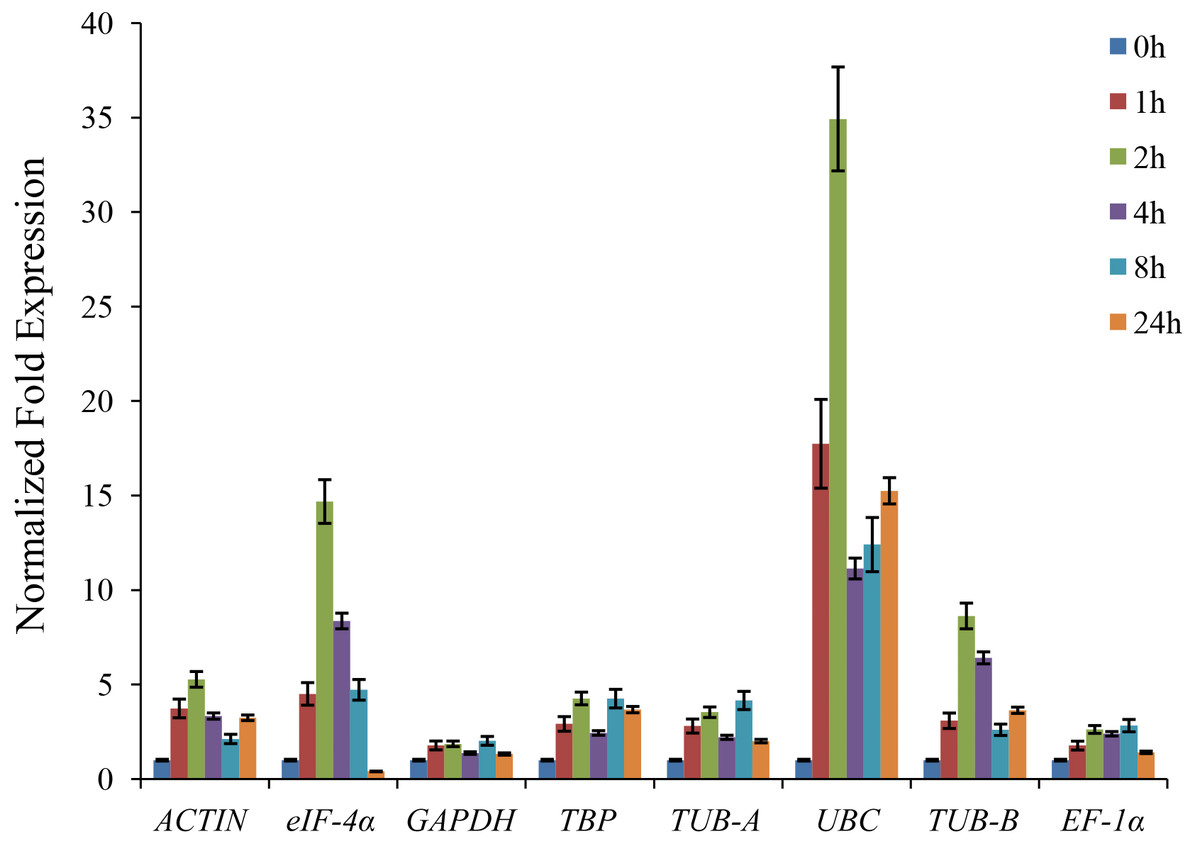
Figure 4: The relative expression levels of CAT gene normalized by different reference genes under drought stress.
Discussion
Gene expression plays important roles in plant development and environmental stimuli defense. Research on gene expression contributed to unravel the complex regulatory mechanisms in life cycle of plant (Feng et al., 2018b; Silva et al., 2019). Nowadays, RT-qPCR is a general technique to determine the expression level of target gene (Gachon, Mingam & Charrier , 2004). However, the accuracy of RT-qPCR results was affected by many factors. Using proper reference gene was an effective approach to improve the accuracy of gene normalization during RT-qPCR assay (Nicot et al., 2005; Gutierrez et al., 2008). A previous study has investigated the suitable reference genes among various tissues and development stages in celery (Li et al., 2016b). In the process of growth and development, celery also encounters many environmental stimuli, including biotic and abiotic stresses. Selection of suitable reference genes is crucial to normalize the gene expression under different conditions in celery. The current study evaluated the expression stabilities of various candidate reference genes under abiotic stress and hormone stimuli in celery.
In this work, the expression profiles of 8 candidate reference genes of celery (ACTIN, eIF-4 α, GAPDH, TBP, TUB-A, UBC, TUB-B, and EF-1 α) under different abiotic stress and hormone stimuli were determined and compared. These candidate genes were commonly used for the selection of appropriate reference genes under different treatments in other species (Tian et al., 2015; Li et al., 2016a; Lu et al., 2018). The specificity and amplification efficiency of primers were confirmed and met the basic requirements of RT-qPCR (Ramakers et al., 2003). In the RT-qPCR assay, the ranges of Cq values among various candidate reference gene were different. Based on the raw Cq values, EF-1α gene showed the highest transcript abundance and UBC gene showed the lowest transcript abundance.
In order to find the appropriate reference gene under different conditions, the expression stabilities of candidate genes were mainly evaluated and ranked by five methods, geNorm (Vandesompele et al., 2002), NormFinder (Andersen, Jensen & Orntoft , 2004), BestKeeper (Pfaffl et al., 2004), ΔCt (Silver et al., 2006), and RefFinder (Xie et al., 2012). Here, the stabilities ranking of these selected candidate reference genes of celery in five programs were not completely consistent, especially between BestKeeper and other programs. For example, the most stable reference genes under heat treatment recommended by geNorm, NormFinder, and BestKeeper were TBP, ACTIN, and GAPDH, respectively. In the cold treatment, TUB-B was the most stable reference gene under BestKeeper analysis but showed the worst stability under geNorm and NormFinder analyses. The ranking differences of various programs were mainly due to the variations in their algorithms (Ransbotyn & Reusch, 2006).
Based on the geNorm analysis, the pairwise variation values of V2/3 under all treatments were below the threshold (0.15), which indicated that two reference genes of celery were sufficient for the normalization of gene expression (Vandesompele et al., 2002). Considering the difference in various analysis methods, RefFinder was used to comprehensively evaluate the expression stability of candidate reference genes (Xie et al., 2012). ACTIN was the most recommended reference gene, and TUB-B was the worst stable gene under different treatments in celery. As the most stable reference gene in celery, ACTIN was also investigated to be the suitable reference gene in carrot and soybean under abiotic stress treatments (Jian et al., 2008; Tian et al., 2015). The ACTIN was the most stable gene at different development stages in carrot (Wang et al., 2016). It should be noted that the TUB-B investigated to be the most stable gene among tissues and developmental stages of celery (Li et al., 2016b), whereas our study indicated that TUB-B was the least stable gene under different treatments. This indicated that the stability of the same house-keeping gene was various under different conditions.
Celery generated physiological regulation through the expressions of specific genes during development and environmental stress. Plant accumulated amounts of hydrogen peroxide (H2O2) under stress conditions (Willekens et al., 1997). The CAT gene encoded the catalase, which is involved in the regulation of H2O2 level in plants. Previous study indicated that the expression of CAT gene was up-regulated under drought stress (Nie et al., 2015). To validate the reliability of reference genes, the relative expression level of CAT1 gene was normalized by using different reference genes. Except when using the unstable reference gene eIF-4 α, the expressions of CAT1 normalized by other reference genes were increased under drought treatment.
Conclusions
This work aims to select the appropriate reference gene under abiotic stress and hormone stimuli in celery. The stability of eight candidate reference genes under different treatments was evaluated and ranked by geNorm, NormFinder, BestKeeper, ΔCt, and RefFinder programs. The analysis results indicated that ACTIN was the most recommended reference gene under abiotic stress and hormone treatments in celery, whereas the TUB-B was the worst stable gene. The reliability of celery reference gene was verified by expression normalization of CAT1 gene under drought stress. In conclusion, the results in this study provided reference and basis for the selection of suitable reference genes under abiotic stress and hormone treatment in celery.