
Investigating the relationship between inbreeding and life expectancy in dogs: mongrels live longer than pure breeds
- Published
- Accepted
- Received
- Academic Editor
- Mahendra Tomar
- Subject Areas
- Veterinary Medicine, Zoology, Population Biology
- Keywords
- Pure breed dog, Cross-bred dog, Mongrel dog, Inbreeding coeficient, Lifespan, Dog, Survivability, Dog welfare, Genetic illness, Dog breeding
- Copyright
- © 2023 Mata et al.
- Licence
- This is an open access article distributed under the terms of the Creative Commons Attribution License, which permits unrestricted use, distribution, reproduction and adaptation in any medium and for any purpose provided that it is properly attributed. For attribution, the original author(s), title, publication source (PeerJ) and either DOI or URL of the article must be cited.
- Cite this article
- 2023. Investigating the relationship between inbreeding and life expectancy in dogs: mongrels live longer than pure breeds. PeerJ 11:e15718 https://doi.org/10.7717/peerj.15718
Abstract
This study aimed to investigate the establishment of relationship between inbreeding and life expectancy in dogs. A dataset of N = 30,563 dogs sourced from the VetCompass™ Program, UK was made available by the Royal Veterinary College, University of London, containing information about breed and longevity and was subject to survival analysis. A Cox regression proportional hazards model was used to differentiate survivability in three groups of dogs (mongrel, cross-bred and pure breed). The model was found highly significant (p < 0.001) and we found that mongrel dog had the highest life expectancy, followed by cross-bred dogs with only one purebred ancestor and purebred dogs had the lowest life expectancy. A second Cox regression was also found highly significant (p < 0.001) differentiating the lifespan of different dog breed and correlating positively the hazard ratio and the Genetic Illness Severity Index for Dogs (GISID). The results show that survivability is higher in mongrel dogs followed by cross-bred with one of the ancestor only as a pure breed, and pure breed dog have the highest morbidity level. Higher morbidity is associated with higher GISID scores, and therefore, higher inbreeding coefficients. These findings have important implications for dog breeders, owners, and animal welfare organizations seeking to promote healthier, longer-lived dogs.
Introduction
Dogs have been our faithful companions for thousands of years, their breeding and genetics have been the subject of growing concern in recent times. Dogs, the human’s best friends, have been domesticated from the wolf during the late Pleistocene more than 15,000 years ago (Horard-Herbin, Tresset & Vigne, 2014). Since the beginning of this process, we have understood that dogs could be useful to human activities in many ways, such as hunting, guarding, herding, waste disposal, warfare, entertainment, pest control, transport, clothing, and even food (Janssens et al., 2018). Having so many potential utilitarian roles led to specialization, and humans started to shape dogs accordingly. More recently, in the past 200 to 300 years shape standards were envisaged, and dog’s morphology was manipulated through closed population breeding (Axelsson et al., 2021). It was however, during the late 19th century, in Victorian Britain, that dog breeding standards started to be implemented, and the pedigree and pure blood concepts reached momentum (Worboys, Strange & Pemberton, 2018) by which modern dog had been ‘invented’.
The modern dog has a multitude of shapes, sizes, colors, and hair types, but also behaviors and personalities, adapted to human needs. The closed population breeding of dogs is a modern practice aiming at the fixation of traits of interest (Axelsson et al., 2021). This bottlenecking of gene flow has also, however, undesirable consequences, as each individual carries deleterious genes with the potential to cause harm and affect fitness and health of dogs (Mabunda et al., 2022). Most of these genes are recessive and can affect the phenotype in homozygosity only. Inbreeding decreases the genetic load and creates in the descendants’ genome long homozygous regions, increasing the potential for deleterious genes to express themselves (Bosse et al., 2019).
The deleterious defects in pure-breed dogs have long ago been identified, and the number of problems identified is growing. Hodgman (1963) identified thirteen conditions, having highlighted the most important being hip dysplasia, patella luxation, entropion, retinal atrophy, and the elongated soft palate. More recently Asher et al. (2009) and Summers et al. (2010), in two companion papers, identified almost 400. At present, the Online Mendelian Inheritance in Animals (OMIA) database, Nicholas & Tammen (2023) identifies 856 trait disorders in dogs.
The lifespan of dogs in relation to breeds and types has been presented and discussed (Patronek, Waters & Glickman, 1997; Salvin et al., 2012) and very recently Teng et al. (2022) produced lifetables based on a large UK population above 30,000 dogs. The enormous diversity of dog breeds, ranging between the 1 kg Chihuahua and the 75 kg Saint Bernard, the 30 cm of the Dachshund and the 85 cm of the Great Dane, determines some variation in the different breeds lifespan (Fleming, Creevy & Promislow, 2011). Several factors of variation have been identified by the different epidemiological studies investigating lifespan in dogs: weight (Adams et al., 2010), neutering status (Moore et al., 2001), breed (Teng et al., 2022), and breed purity (Proschowsky, Rugbjerg & Ersbøll, 2003).
Asher et al. (2009) and Summers et al. (2010) in their two companion papers introduced the Generic Illness Severity Index for Dogs (GISID), where the severity of disorders is sensibly scored. In addition, the authors provide an estimate of these scores for the most common breeds in the UK and also classify the different disorders (inherited defects) as conformation related (C), conformation exacerbated (CD), and not previously linked to conformation (D).
The present study used the lifespan data reported by Teng et al. (2022) to relate with the GISID scores obtained by Asher et al. (2009) and Summers et al. (2010). To investigate the establishment of a relationship between inbreeding and life expectancy in dogs. Understanding of such relationship will be helpful in the scientific management of dog breeding for achieving aparent health and welfare of dogs.
Materials & Methods
Data are open access (CC BY 4.0) and were retrieved from the Royal Veterinary College, University of London, repository (O’Neill, 2022). The sample includes all dogs under primary veterinary care at clinics participating in the VetCompass™ Program, UK during 2016 (i.e., dogs with at least one clinical record in 2016) (Teng et al., 2022). The dog breeds recognized by any of the Kennel Club (KC), the American Kennel Club, and the Australian National Kennel Council were considered purebred, while all others were considered crosses. Crosses with ancestors not belonging to a recognized breed were considered mongrels. A total of N = 30,563 entries were found in the original dataset, which after data cleansing and elimination of outliers, resulted in a sample of N = 30,470 dogs (n = 2,406 mongrel, n = 3,962 crossbred, and n = 24,102 pure breed).
Outliers were identified after data transformation for a standard normal distribution (a normal distribution with mean with value zero and standard deviation with value one), and when their z score was above 3 or below -3 standard deviations. Data entered a Cox-regression proportional hazards model for survival analysis with ‘Lifespan’ as the ‘time to event’ variable, and ‘Type of Dog’ (levels: ‘Mongrel’, ‘Cross Bred’, and ‘Pure Breed’) as the factor to analyze. There were no censored entries, and the ‘event’ is ‘Age at Death’ (years). An ANOVA with a least significant difference (LSD) test as post hoc was also used to differentiate means between ‘Type of Dog’.
The different pure breed dogs were then compared with the inherited defects in pedigree dogs, namely the disorders related (Asher et al., 2009), and not related (Summers et al., 2010) to breed standards. At this stage, some breeds in the original dataset were eliminated from analysis once to compare with Asher et al. (2009) and Summers et al. (2010) as to consider the breeds reported by these authors. The new dataset comprises N = 19,466 dogs distributed within breeds as shown in Table 1.
| Breed | n | Breed | n |
|---|---|---|---|
| Alaskan Malamute | 50 | Hungarian Vizsla | 44 |
| Basset Hound | 76 | Irish Setter | 39 |
| Beagle | 171 | Labrador | 2,501 |
| Bichon Frise | 338 | Lhasa Apso | 282 |
| Border Collie | 1,018 | Miniature Schnauzer | 211 |
| Border Terrier | 294 | Poodle Miniature | 102 |
| Boxer | 831 | Poodle Standard | 84 |
| Bull Mastif | 143 | Poodle Toy | 56 |
| Bull Terrier | 435 | Pug | 196 |
| Bulldog | 501 | Rhodesian Ridgeback | 68 |
| Cairn Terrier | 107 | Rottweiler | 505 |
| Cavalier King Charles Spaniel | 1,004 | Scottish Terrier | 201 |
| Chihuahua | 405 | Shar Pei | 149 |
| Cocker Spaniel | 1,063 | Shetland Sheep Dog | 61 |
| Collie (Rough) | 84 | Shih Tzu | 635 |
| Dalmatian | 149 | Springer Spaniel | 800 |
| Doberman | 148 | Staffordshire Bull Terrier | 2,344 |
| Dogue de Bordeaux | 152 | Tibetan Terrier | 71 |
| German Shepherd | 1,096 | Weimaraner | 129 |
| German Short-haired Pointer | 41 | West Highland Terrier | 1,103 |
| Golden Retriever | 511 | Whippet | 125 |
| Great Dane | 83 | Yorkshire Terrier | 1,060 |
The number of identified disorders in the different breeds (inherited defects), were divided by the average scores obtained by the application of the GISID (Asher et al., 2009; Summers et al., 2010) for C, CD, D, and Total, to obtain the variables ‘Rate C’, ‘Rate D’, ‘Rate CD’ and ‘Rate Total’ respectively. These new variables giving an average score per disorder entered a Cox-regression proportional hazards model for survival analysis with ‘Lifespan’ as the ‘time to event’ variable, ‘Breed’ as a factor, and the ‘Rate’ variables as covariates. Again, there were no censored entries, and the event considered is ‘Age at Death’ (years).
The models were tested via the −2 Log likelihood test and their parameters via, the Wald test. A cumulative survival plot was also produced for the first model.
Data were initially entered in a spreadsheet (Microsoft Excel for Microsoft 365 MSO, version 2204 Build 16.0.15128.20240, 64-bit) for cleansing and outlier detection and elimination. Descriptive statistics were also produced with this software. The Cox regression proportional hazards models were produced with the statistical package IBM Corp. SPSS Statistics, Armonk, NY, USA. Version: 28.0.1.1 (15).
Results
The descriptive statistics of the variables entered in the first model are shown in Table 2. The ANOVA test was highly significant (F = 211.84, 2df, p < 0.001) and all the means were significantly different (p = 0.032) between ‘Pure Breed’ and ‘Cross Bred’, and p < 0.001 for the other comparisons. The ANOVA table is presented as Table 3.
| Statistic | Mongrel | Cross bred | Pure breed |
|---|---|---|---|
| Observations | 2,406 | 3,962 | 24,102 |
| Minimum | 0.008 | 0.003 | 0.003 |
| 1st Quartile | 11.006 | 8.909 | 9.126 |
| Median | 13.569 | 12.049 | 11.723 |
| 3rd Quartile | 15.198 | 14.350 | 13.722 |
| Maximum | 20.561 | 21.884 | 21.539 |
| Mean | 12.761 | 11.225 | 11.086 |
| Standard deviation | 3.762 | 4.276 | 3.729 |
| Mean CI (95% upper) | 12.838 | 11.293 | 11.110 |
| Mean CI (95% lower) | 12.684 | 11.158 | 11.062 |
| Source | Type III sum of squares | df | Mean square | F | Sig. |
|---|---|---|---|---|---|
| Corrected Model | 6,140.12 | 2 | 3,070.06 | 211.84 | <0.001 |
| Intercept | 1,733,638.69 | 1 | 1,733,638.69 | 119,626.32 | <0.001 |
| Dog group | 6,140.12 | 2 | 3,070.06 | 211.84 | <0.001 |
| Error | 441,531.33 | 30,467 | 14.49 | ||
| Total | 4,294,503.46 | 30,470 | |||
| Corrected Total | 447,671.45 | 30,469 |
The first model differentiating mongrel, cross bred and pure breed dogs was found to be highly significant (-2 Log Likelihood 567,623, χ2 = 595, 2 df, p < 0.001) and the parameter was also significant (Wald 585, with 2 degrees of freedom, p < 0.01). The full model parameterization is shown in Table 4.
| β | Wald | df | p-value | eβ | eβ 95% CI | ||
|---|---|---|---|---|---|---|---|
| Lower | Upper | ||||||
| Cross | −0.177 | 105.474 | 1 | <.001 | 0.838 | 0.810 | 0.867 |
| Mongrel | −0.494 | 527.621 | 1 | <.001 | 0.610 | 0.585 | 0.637 |
Notes:
The model is highly significant (−2 Log Likelihood 567,623, χ2 = 595, 2 df, p < 0.001). The parameter ‘Type of dog’ is significant (Wald 585, 2 df, p < 0.01). ‘Pure breed’ is the baseline type of dog.
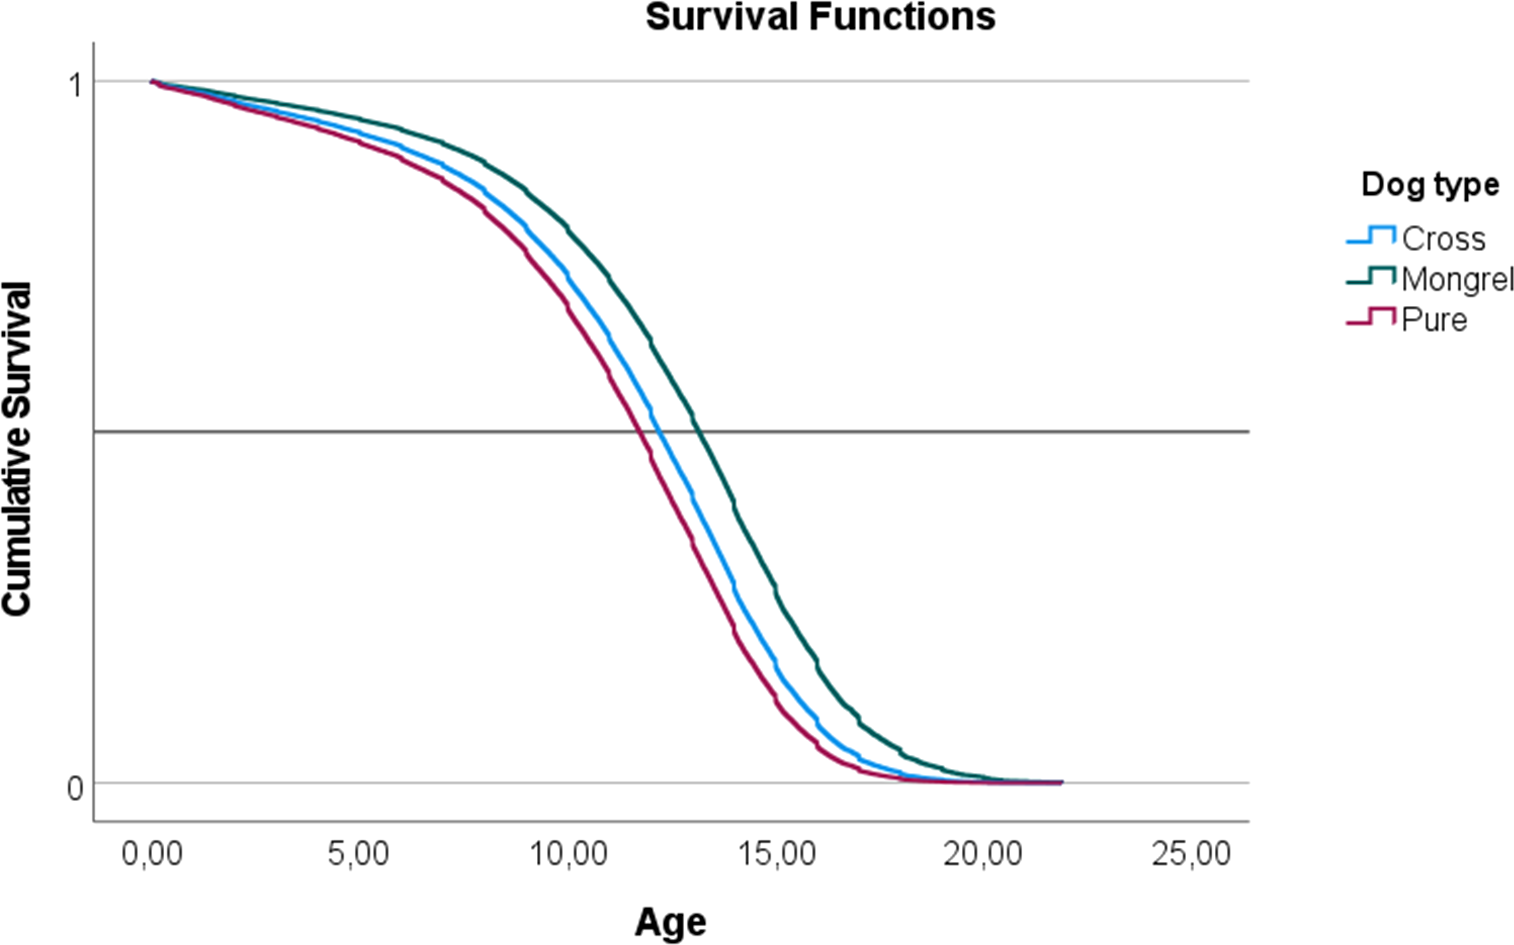
In a Cox proportional hazards model, a negative parameter is indicative of a decrease in the hazard ratio (HR) and an increase in survival in relation to the baseline. The exponential of the parameter (eβ) indicates the HR effect size and is interpreted as multiplicative effects on the hazard. Therefore, a cross bred dog has a negative β, indicative of a decrease in the HR in relation to a ‘Pure Breed’ of eβ = 0.838 or 17.2%. ‘Mongrel’ dogs also have lower HR in relation to pure breed and the effect size is larger when compared to ‘Cross Bred’. The decrease in the HR in mongrel dogs is 39%. These effects are evident in the survival functions plotted in Fig. 1.
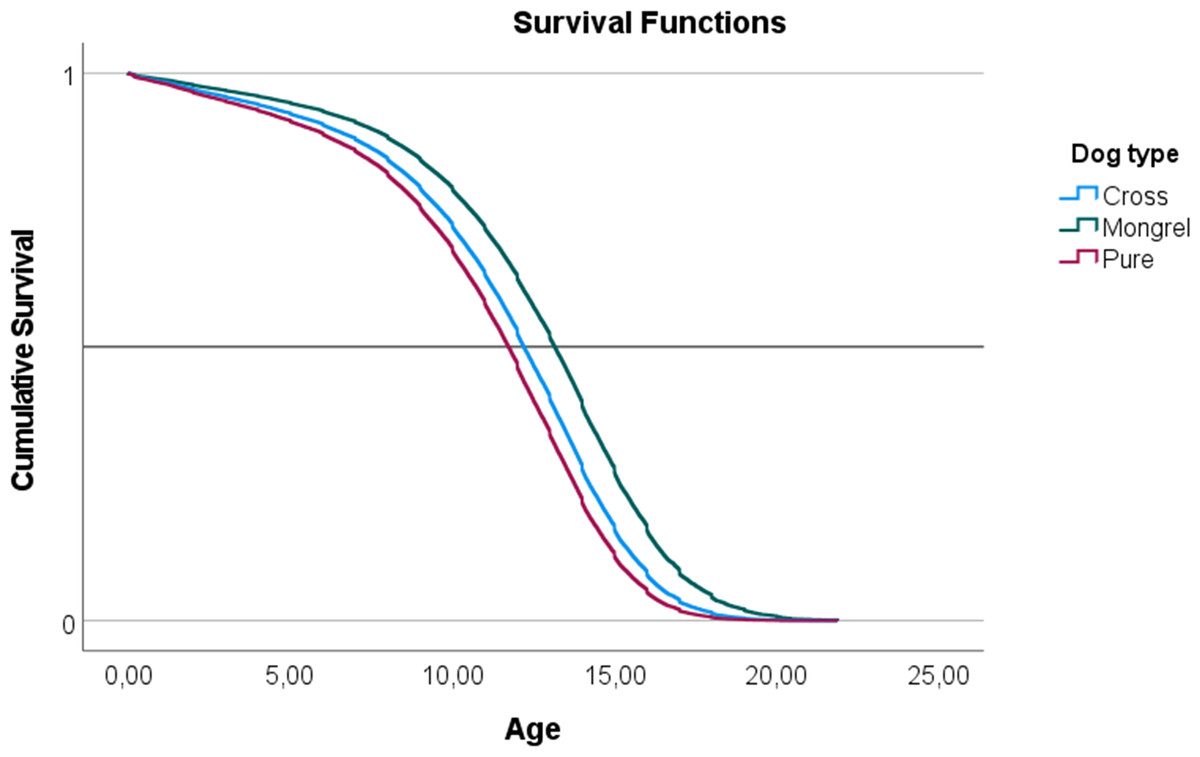
Figure 1: Representation of the survival functions of the Cox-regression proportional hazards model, modeling the survivability of three ‘Types of dog’ (mongrel, cross-bred, and pure breed).
The second model differentiating dog breeds and using the ‘Rates’ calculated from the GISID was also found to be significant (-2 Log Likelihood 335,993, χ2 = 5,013 with 43 df, p < 0.001). The variable ‘Breed’ is significant (Wald 4314, with 42 df, p < 0.01), as it is the covariate ‘Total Ratio’ (Wald 64.58, with 1 df, p < 0.001). The full model parameterization is shown in Table 5.
| β | Wald | df | p-value | Exp(β) | Exp (β) 95% CI | ||
|---|---|---|---|---|---|---|---|
| Lower | Upper | ||||||
| Covariate Rate Total | 0.162 | 64.58 | 1 | <0.001 | 1.175 | 1.130 | 1.223 |
| Breed Dogue de Bordeaux | −12.105 | 44.271 | 1 | <0.001 | 6−6 | 1.565−7 | 1.960−4 |
| Whippet | −2.419 | 39.009 | 1 | <0.001 | 0.089 | 0.042 | 0.190 |
| Rhodesian Ridgeback | −1.941 | 24.433 | 1 | <0.001 | 0.144 | 0.067 | 0.310 |
| Staffordshire Bull Terrier | −1.806 | 40.143 | 1 | <0.001 | 0.164 | 0.094 | 0.287 |
| Tibetan Terrier | 0.483 | 13.633 | 1 | <0.001 | 1.621 | 1.255 | 2.096 |
| Bull Mastiff | 0.795 | 20.258 | 1 | <0.001 | 2.214 | 1.566 | 3.129 |
| Shetland Sheepdog | 1.546 | 61.335 | 1 | <0.001 | 4.691 | 3.186 | 6.907 |
| Pug | 1.599 | 411.244 | 1 | <0.001 | 4.950 | 4.241 | 5.777 |
| Bull Terrier | 1.629 | 102.357 | 1 | <0.001 | 5.101 | 3.720 | 6.995 |
| Poodle Miniature | 1.666 | 38.626 | 1 | <0.001 | 5.292 | 3.129 | 8.950 |
| Poodle Toy | 1.798 | 41.540 | 1 | <0.001 | 6.037 | 3.494 | 10.429 |
| Labrador | 1.874 | 57.486 | 1 | <0.001 | 6.514 | 4.013 | 10.575 |
| West Highland Terrier | 1.983 | 68.114 | 1 | <0.001 | 7.265 | 4.536 | 11.634 |
| Irish Setter | 2.103 | 78.054 | 1 | <0.001 | 8.187 | 5.135 | 13.053 |
| Basset Hound | 2.107 | 127.733 | 1 | <0.001 | 8.225 | 5.707 | 11.853 |
| Cavalier King Chrles Spaniel | 2.205 | 204.593 | 1 | <0.001 | 9.071 | 6.705 | 12.270 |
| German Shorted-Hair Pointer | 2.210 | 65.239 | 1 | <0.001 | 9.119 | 5.333 | 15.592 |
| Chihuahua | 2.286 | 182.833 | 1 | <0.001 | 9.832 | 7.059 | 13.693 |
| Dalmatian | 2.329 | 99.287 | 1 | <0.001 | 10.270 | 6.495 | 16.239 |
| Springer Spaniel | 2.423 | 85.607 | 1 | <0.001 | 11.278 | 6.750 | 18.841 |
| Collie (Rough) | 2.431 | 82.005 | 1 | <0.001 | 11.376 | 6.721 | 19.255 |
| Hungarian Vizsla | 2.444 | 82.177 | 1 | <0.001 | 11.519 | 6.791 | 19.539 |
| Cairn Terrier | 2.474 | 63.367 | 1 | <0.001 | 11.865 | 6.453 | 21.815 |
| Border Collie | 2.512 | 73.124 | 1 | <0.001 | 12.334 | 6.935 | 21.938 |
| Shih Tzu | 2.548 | 83.657 | 1 | <0.001 | 12.779 | 7.402 | 22.059 |
| Poodle Standard | 2.642 | 68.117 | 1 | <0.001 | 14.036 | 7.496 | 26.285 |
| Bichon Frise | 2.706 | 92.274 | 1 | <0.001 | 14.963 | 8.615 | 25.987 |
| German Shepard | 2.746 | 156.512 | 1 | <0.001 | 15.582 | 10.134 | 23.959 |
| Shar Pei | 2.813 | 349.604 | 1 | <0.001 | 16.662 | 12.407 | 22.377 |
| Alaskan Malamute | 3.012 | 132.368 | 1 | <0.001 | 20.334 | 12.172 | 33.969 |
| Cocker Spaniel | 3.030 | 96.623 | 1 | <0.001 | 20.698 | 11.312 | 37.871 |
| Scottish Terrier | 3.037 | 77.295 | 1 | <0.001 | 20.845 | 10.591 | 41.024 |
| Lhasa Apso | 3.346 | 89.761 | 1 | <0.001 | 28.381 | 14.205 | 56.705 |
| Beagle | 3.356 | 112.241 | 1 | <0.001 | 28.661 | 15.406 | 53.320 |
| Golden Retriever | 3.488 | 83.652 | 1 | <0.001 | 32.730 | 15.499 | 69.118 |
| Miniature Schnauzer | 3.747 | 87.736 | 1 | <0.001 | 42.381 | 19.351 | 92.823 |
| Great Dane | 3.912 | 235.326 | 1 | <0.001 | 50.010 | 30.337 | 82.440 |
| Doberman | 3.935 | 162.363 | 1 | <0.001 | 51.146 | 27.923 | 93.682 |
| Boxer | 3.983 | 130.334 | 1 | <0.001 | 53.691 | 27.096 | 106.387 |
| Weimaraner | 4.088 | 99.726 | 1 | <0.001 | 59.640 | 26.734 | 133.048 |
| Rottweiler | 4.247 | 151.288 | 1 | <0.001 | 69.930 | 35.540 | 137.596 |
| Bulldog | 4.446 | 201.831 | 1 | <0.001 | 85.273 | 46.178 | 157.466 |
Notes:
‘Rate Total’ is a calculated rate based on the Genetic Illness Severity Index for Dogs. The model is highly (−2 Log Likelihood 335,993, χ2 = 5,013 with 43 df, p < 0.001). The variable ‘Breed’ is significant (Wald 4,314, with 42 df, p < 0.01), as it is the covariate ‘Total Ratio’ (Wald 64.58, with 1 df, p < 0.001). Yorkshire Terrier is the baseline breed.
In the second model, the lower the parameter associated with the breed, the higher the HR. Therefore, the breed Dogue de Bordeaux is the breed with the lower HR and higher survivability, while the bulldog has the higher HR and the lower survivability. The breed Yorkshire Terrier is the baseline, therefore negative parameters are associated with lower HR, and positive parameters with higher HR, in relation to this breed. As the model includes forty three breeds any plot of the survival function becomes impossible to read, therefore it is not presented for this model.
The covariate ‘Total Ratio’ indicates that for an additional unit in the ratio, the HR is added by a factor of 17.5% while holding age constant. In other words, the higher the GISID, the higher the death hazard, therefore the lower the survivability. A negative correlation between GISID and survivability becomes, therefore, established within this model.
Discussion
An increase in dog’s inbreeding coefficients is associated with a lower lifespan. In decreasing order, dogs with longer lifespan are ‘Mongrel’ (mean 12.761 years), followed by ‘Cross Bred’ (11.225 years), and ‘Pure Bred’ (11.086 years). These results were reiterated by the Cox-regression, with a decrease in the HR in relation to pure breed dogs of 17.2% and 39% respectively for cross-bred and mongrel dogs.
Some previous studies have reported this relationship. In a study based on questionnaires filled by members of the Danish Kennel Club and representing a sample of 2,928 dogs, Proschowsky, Rugbjerg & Ersbøll (2003) reported differences between mixed breed (median and interquartile range (IQR) 11 [8, 13]) and several breeds with median varying between 7 and 11. These results were subject to a Kruskal-Wallis test and significant differences were found, however, no post hoc tests are reported and, therefore, the statement that differences between pure-breed and cross-bred dogs exist is not robust. Also, a study in Britain (Michell, 1999) using questionnaires, reports that mongrel dogs are between those with larger lifespans (median 14.0). This study, however, does not provide any inferential statistical test and anchors the statement in descriptive statistics only. Patronek, Waters & Glickman (1997) report statistical evidence of significant differences between mixed breeds and pure breeds (medians 8.5 and 6.7 years, respectively), using a large sample (23,535 dogs) of data collected in veterinary hospitals in the USA and Canada. Despite the high credibility of the study, there is no definition of what a mixed breed is; it could eventually be a mongrel, a cross between two pure breeds, or a cross between a mongrel and a pure breed.
Inbreeding is known by agglomerating homozygotic recessive genes in the genome of individuals (Mooney, Yohannes & Lohmueller, 2021), and particularly in pure-breed dogs, it has been shown that higher inbreeding coefficients are associated with higher morbidity (Bannasch et al., 2021; Yordy et al., 2020), due to a larger accumulation of deleterious genes associated with the most common disorders (O’Neill et al., 2014).
The novelty in the present study is the clear differentiation between groups that are not pure breeds. This differentiation allows the definition of three groups with expected different inbreeding coefficients and therefore allows the clear establishment of a relationship between expected inbreeding coefficients and lifespan. Being pure-breed dogs bred in a closed population, they have higher inbreeding coefficients than mongrels; and cross-bred dogs with no more than one pure breed ancestor have, obviously, intermediate inbreeding coefficients. The present study reports results based on a continuous variable allowing the comparison and the report of significantly different means in the three groups of dogs. Previous studies report median values only.
The lifespan differences between breeds have been the objective of study and are well documented, e.g., Bannasch et al. (2021), O’Neill et al. (2013), Teng et al. (2022) and Yordy et al. (2020). The common report in lifespan differences between dog breeds is the size or weight of the breed. Larger dogs are reported to have higher morbidity, e.g., Bannasch et al. (2021), Greer, Canterberry & Murphy (2007), Michell (1999) and O’Neill et al. (2013). This trend is not evident in the present study.
The limitations of this study are associated with the sample. The sample is based on dogs that attended veterinary practices in the UK, and for which both born, and death dates are known. The generalization of the results for other geographies must be done carefully. Also, not all dogs in the UK have records in veterinary practices and many that have records eventually don’t show born and/or death dates. The sample may, therefore, be somehow biased.
Nevertheless, ethical dog breeding must be implemented with respect for dog welfare. Broeckx (2020) revised and elected two points of action: reduce the frequency of disorders and increase genetic diversity. For example in a study (Douglas, Mata & Menem, 2015) of policy comparison between the British Kennel Clube (BKC) and the German Kennel Club, Verband für das Deutsche Hundewesen (VDH) it was demonstrated that it is possible to tackle some of the most common problems faced by pure breeding by reducing the frequency of the disorder. Canine hip scoring can effectively be used in selection programs to reduce the incidence of hip dysplasia. By adopting VDH’s system of mandatory hip scoring of breeding parents and only allowing those with low scores to breed, it was demonstrated that it is possible to reduce faster, hip scores in populations of pedigree dogs when compared with the BKC’s voluntary system.
Conclusions
It was hypothesized that morbidity in dogs may be associated with inbreeding coefficients. The results of this study confirm the hypothesis, showing that survivability is higher in mongrel dogs followed by cross-bred with one of the ancestor only as a pure breed, and for the last pure breed dogs have the highest morbidity levels. Higher morbidity was associated with higher GISID scores, and therefore, higher levels of homozygotic recessive genes in the genomes of the individuals, and inbreeding coefficients should be reduced for better survivability. Future research may be directed to dog breeding, to decrease inbreeding coefficients and control deleterious genes.