
Comparing the phosphorus use efficiency of pre-treated (organically) rock phosphate with soluble P fertilizers in maize under calcareous soils
- Published
- Accepted
- Received
- Academic Editor
- Muhammad Riaz
- Subject Areas
- Agricultural Science, Plant Science, Soil Science
- Keywords
- Acidulated rock phosphate, Enrich compost, Humic acid, Calcareous soils, Phosphorus use efficiency
- Copyright
- © 2021 Mussarat et al.
- Licence
- This is an open access article distributed under the terms of the Creative Commons Attribution License, which permits using, remixing, and building upon the work non-commercially, as long as it is properly attributed. For attribution, the original author(s), title, publication source (PeerJ) and either DOI or URL of the article must be cited.
- Cite this article
- 2021. Comparing the phosphorus use efficiency of pre-treated (organically) rock phosphate with soluble P fertilizers in maize under calcareous soils. PeerJ 9:e11452 https://doi.org/10.7717/peerj.11452
Abstract
In calcareous soils, phosphorus (P) availability to plant is impaired due to the formation of insoluble complexes with calcium and magnesium. Therefore, this study was executed to compare the P use efficiency (PUE) of four different P sources [rock phosphate (RP), acidulated rock phosphate (ARP), single super phosphate (SSP) and di ammonium phosphate (DAP)] alone or pre-treated with organic amendments (farm yard manure (FYM) enriched compost, simple compost and humic acid (HA)) along with control in maize crop under calcareous soils. All treatments irrespective of P sources received 90 kg P2O5 ha−1. Phosphorus application regardless of its sources and combination with organic amendments significantly improved maize growth, yield as well as P uptake and PUE. Rock phosphate when applied alone was recorded inferior but its performance significantly improved with compost or its pre-addition with FYM and HA, that further enhanced upon acidulation. Maize grain yield increased by 21, 22.2, 67.9 and 94% with RP, ARP, ARP enriched compost and ARP+ compost respectively, over control. Similarly, PUE of DAP improved from 31.7 to 43.1 and 39 with sample and enriched compost correspondingly. Post-harvest soil and grain P were at par for SSP, ARP and DAP alone or in conjugation with organic amendments when averaged across the amendments. These results suggested that pretreatment of P sources with organic amendments is an economical and more feasible approach to improve maize yield and PUE. Moreover, on-farm acidulation of RP may give at par results with SSP and DAP with cheaper rate and hence recommended for P management in maize in alkaline calcareous soils.
Introduction
Plants need essential nutrients in the optimum range to complete their life cycle. These nutrients are either supplied through rain, weathering of soil minerals or irrigation, fertilization, or organic matter decay. The fastest route of nutrient availability is via decomposition of organic matter (Akcura et al., 2019; Bohn, Mcneal & O’Conner, 1985). However, nutrients availability not only depends on soil properties but also on climatic conditions. Soils of arid and semi-arid regions are low in organic matter and thus can’t provide adequate amounts of nutrient to plants for the completion of growth cycle. Under such conditions, soil is supplemented with organic and mineral fertilizers (Naeem et al., 2021; Ludibeth, Marina & Vicenta, 2012; Johnson, Swedell & Rothman, 2012). These practices not only overcome the grain shortages but also reduce financial stress on the farmers by overwhelming the cost of fertilizers.
Alkaline soils are most deficient in nitrogen (N) and phosphorus (P), and as a result the yield of edible cereal like maize and wheat is far lower than the potential under these soils (Adnan et al., 2018). An ample supplementation of P in early growth stages is important for higher crop yield, as restricted supply of P limits the crop growth (Grant et al., 2001). The mineral P added as chemical fertilizers also makes insoluble complexes either with aluminum in acidic soils or calcium and magnesium in alkaline soil (Makinde, 2007; Ayeni, Adeleye & Adejumo, 2012), and become unavailable to plants (Merino et al., 2010). However, soil supplementation with organic manures in integration with mineral fertilizers will not only enhance nutrients availability; but will also improve soil conditions and crop yield. It is evident from the studies that blended application of organic and in-organic P sources proved to be an effective technique in boosting up inorganic P fertilizers (Klammsteiner et al., 2020; Whalen & Chang, 2001). The locally prepared low cost organo-mineral fertilizers have been reported to improve soil health both in terms of fertility and physical conditions (Hussain, Abid & Raza, 2004). However, it is a challenging task to locally develop sustainable low input agricultural systems that not only improve soil fertility but also enhance the crop yield.
Humic acid (HA) consists of carbon, oxygen, nitrogen and hydrogen (Seleiman et al., 2021; Jerzykiewicz et al., 2002; Senesi, 1990). It may also contain sulphur and P in variable amounts depending on the source. Like most natural polymers, HA have complex structures and contain a number of biologically active functional groups including carboxylic acid, phenolic, hydroxyl, methoxyl and amine groups (Sposito, 2008). In soil, HA is formed through the chemical and biological humification of plant and animal matter. There is conclusive evidence that quite small amounts of certain organic substances (highly dispersed humic acid, some aromatic compounds and organic acids) have a definite, positive effect on the growth and development of the plant (Fahad et al., 2019a, 2019b; Rafiullah et al., 2021; Kononova, 2013). Similarly, composting is a biological process in which microorganisms convert organic wastes into soil like materials called humus. Compost is a rich source of soil nutrients especially in N and P. It is truly beneficial to soil health as it improves in soil structure, water storage, nutrient supply, soil microbial activity and also improves in soil fertility and productivity (Turan, 2020; Allison, 1973; Johnston, 1986).
Majority of experiments that have been conducted to date on the effect of different P sources over yield but very little is known about the pre-treating/blending of different P sources with organic amendments like HA and composts. Thus, the present study was conducted to compare the economic feasibility and effectiveness of commercial (SSP and DAP) and natural (RP and ARP) P fertilizers alone or in pre-treatment with HA, enriched and sample compost in relation to soil PUE and yield of maize crop under calcareous soils.
Materials and Methods
Experimental site
A field experiment was conducted to study the effect of different P sources (RP, ARP, SSP and DAP) alone and pretreated with organic amendments (HA, Enriched compost and compost) along with control on yield and P uptake of maize at agronomic research farm (34.02, 71.48), The University of Agriculture, Peshawar. The soil of the experimental site was alkaline (pH = 7.4), calcareous (16.9%), non-saline (EC = 0.17 d Sm−1) in nature and silt loam in texture. It was low in organic matter (0.76%) and AB-DTPA extractable P (3.33 mg kg−1).
Preparation of P fertilizers
FYM compost
Fresh animal dung having 50% moisture was mounded on the ground and covered with a plastic sheet. It was mixed after each 15 days and if necessary some amount of water was added to it until the final odorless FYM compost with black color was formed. It was tested for pH, EC, organic C, nitrogen and phosphorus content.
Rock phosphate and its acidulation
The ground RP was obtained from Hattar Industrial state, Haripur and was analyzed for total P content. This RP was utilized as such or in the acidulated form called acidulated rock phosphate (ARP) equivalent to SSP. The acidulation of RP was done by treating 100 kg RP with 30 kg H2SO4 in the presence of 60 L water and ARP equivalent to commercial SSP fertilizer was formed (Matiullah & Rafique, 2012; Naseer & Muhammad, 2014).The paste of RP and acids were then retained for 14 days to complete of the reaction. After that the paste was passed through a sieve to get wet granules. These granules were then dried at room temperature for later use.
Extraction of humic acid from coal
Humic acid (HA) was extracted from coal according to a modified procedure of Hai & Mir (1998) and Khattak, Ul-Ain & Iqbal (2013). A 5 kg ground coal was treated with 1.5 L concentrated HNO3, 0.5 L H2SO4 and 20 L water in a plastic bucket for 24 h and was stirred intermittently with a rod. In order to settle down all suspended particles, reactants (mixture of acid and coal) were allowed to stand for another 24 h. The supernatant was decanted. The pH of the reactants was then raised by the gradual addition of 0.5 N NaOH untill it reached 11.5. The solution was then allowed to stand overnight and then centrifuged next day. Acidification of the filtrate was done by adding 0.5 N HCl until the pH reached 2.0. The solution containing HA suspended particles were again centrifuged. The semi-solid HA was dried at 50 °C in a oven to prepare dry solid humid acid.
Enriched composts
For preparation of enriched compost, a fresh farmyard manure (FYM) was collected from dairy farm of the University of Agriculture Peshawar and was spread on land for two days in order to evaporate excess water. Black polyethylene sheet was spread on a 3 m2 clean plain area and 100–150 kg of FYM was mixed at the rate of 2% P with RP, ARP, SSP or DAP for preparing enriched composts of the given P sources. The manures and additives were mixed homogenously and were covered by black polyethylene sheet in order to conserve heat produced during thermophillic stage of compost and to reduce the odor produced during composting.
Preparation of humic acid-complexed P fertilizers
A solution of humic acid (HA) was prepared in slight alkaline condition to facilitate its dissolution and was sprayed on the granules of ARP, SSP and DAP. The P sources and HA were mixed in such ratios that the final product would supply 90 kg P2O5 and 5 kg HA ha−1. The coated ARP, SSP and DAP were left to dry and absorbs the HA, and then applied to soil at the time of sowing.
Experimental description
The experiment was laid out in randomized complete block design (RCBD) with factorial arrangement. Sixteen (16) treatments along with control were replicated three times. Azam variety of maize was sown at the rate of 30 kg ha−1 on 15th June, 2019 in 3 × 5 m3 plots and then plants were thinned after 3 weeks of emergence. All treatments were treated with basal dose of 150 kg N ha−1 as a urea inclusive of N obtained from organic amendments. Hoeing and weeding were done manually. However, weedicides were also sprayed for controlling weeds. Standard agronomic practices were applied to all experimental units uniformly throughout the whole growing season.
Agronomic attributes
Biological yield (kg ha−1)
Biological yield was quantified by weighing dry plants harvested from whole plot and then converted into kg ha−1 as follows (Eq. (1)):
Grain yield (kg ha−1)
Grain yield was measured by the shelling of dry ears obtained from whole plot and then it was converted into kg ha−1 (Eq. (2)).
Harvesting index (%)
For determination of harvest index the following formula was used (Eq. (3)):
Soil and plant analysis
Surface soil samples (0–20 cm) were collected at three stages (before sowing, at boot stage and postharvest stage) for evaluating the treatments role in P status of the soil. Soil organic matter was determined by the procedure according to Nelson & Sommers (1983). Extractable P in soil was quantified on spectrophotometer according to the procedure of Soltanpour & Schwab (1977). The pH and EC of the soil was determined in 1:5 soil water suspensions by the methods of MeClean (1982), and Richards (1954), respectively. Plant P content was determined by using the protocol described by Jones, Wolf & Mills (1991) While, P use efficiency was determined by the method described by Johnston & Syers (2009) via the following formula (Eq. (4)):
Statistical analysis
Statistical analysis of data was performed through analysis of variance (ANOVA) technique as suggested by Steel & Torrie (1981) according to factorial randomized complete block design (RCBD). The means were compared with least significant difference (LSD) at p < 0.05 via computer software Statistix 8.1.
Results and discussion
Biological yield (kg ha−1)
Application of different phosphate fertilizers significantly increased biological yield of maize as shown in Table 1. Maximum biological yield of 9,150 kg ha−1 was produced by DAP which was statistically different from the rest of inorganic fertilizers. The SSP and ARP produced statistically similar biological yield of 8,703 kg ha−1 and 8,620 kg ha−1 respectively. Among the chemical fertilizers RP produced minimum biological yield but it was higher than control plot (6,099 kg ha−1).
| Amendment | Phosphorus source | Mean | |||
|---|---|---|---|---|---|
| RP | ARP | SSP | DAP | ||
| Control | - | - | - | - | 6,099 d |
| No amendment | 7,144 | 7,625 | 7,895 | 8,426 | 7,773 c |
| Compost | 8,800 | 9,316 | 9,606 | 10,047 | 9,442 a |
| Enriched compost | 8,623 | 9,102 | 8,940 | 9,508 | 9,043 a |
| Humic acid | 7,935 | 8,436 | 8,370 | 8,619 | 8,340 b |
| Mean | 8,125 c | 8,620 b | 8,703 b | 9,150 a | |
Note:
LSD for P and S levels at p < 0.05 is 423 kg ha−1 whereas for interaction is NS. RP, ARP, SSP and DAP stand for rock phosphate, acidulated rock phosphate, single super phosphate and di-ammonium phosphate, respectively. The means followed by different letters in each column are significantly different from each other at = 0.05.
When averaged across amendments, the maximum biological yield of 9,442 kg ha−1 was observed for simple compost treated plots which slightly declined with P enriched compost. It should be noted that for P sources with compost the amount of P applied was 10 t ha−1 whereas, in case of enriched compost its amount was 2 t ha−1, Thus, it is certified that the bulk of compost could be reduced by five times through its enrichment without any remarkable reduction in plant growth and yield. HA combined with chemicals fertilizers improved biological yield but their effectiveness was not enough like compost and enriched compost.
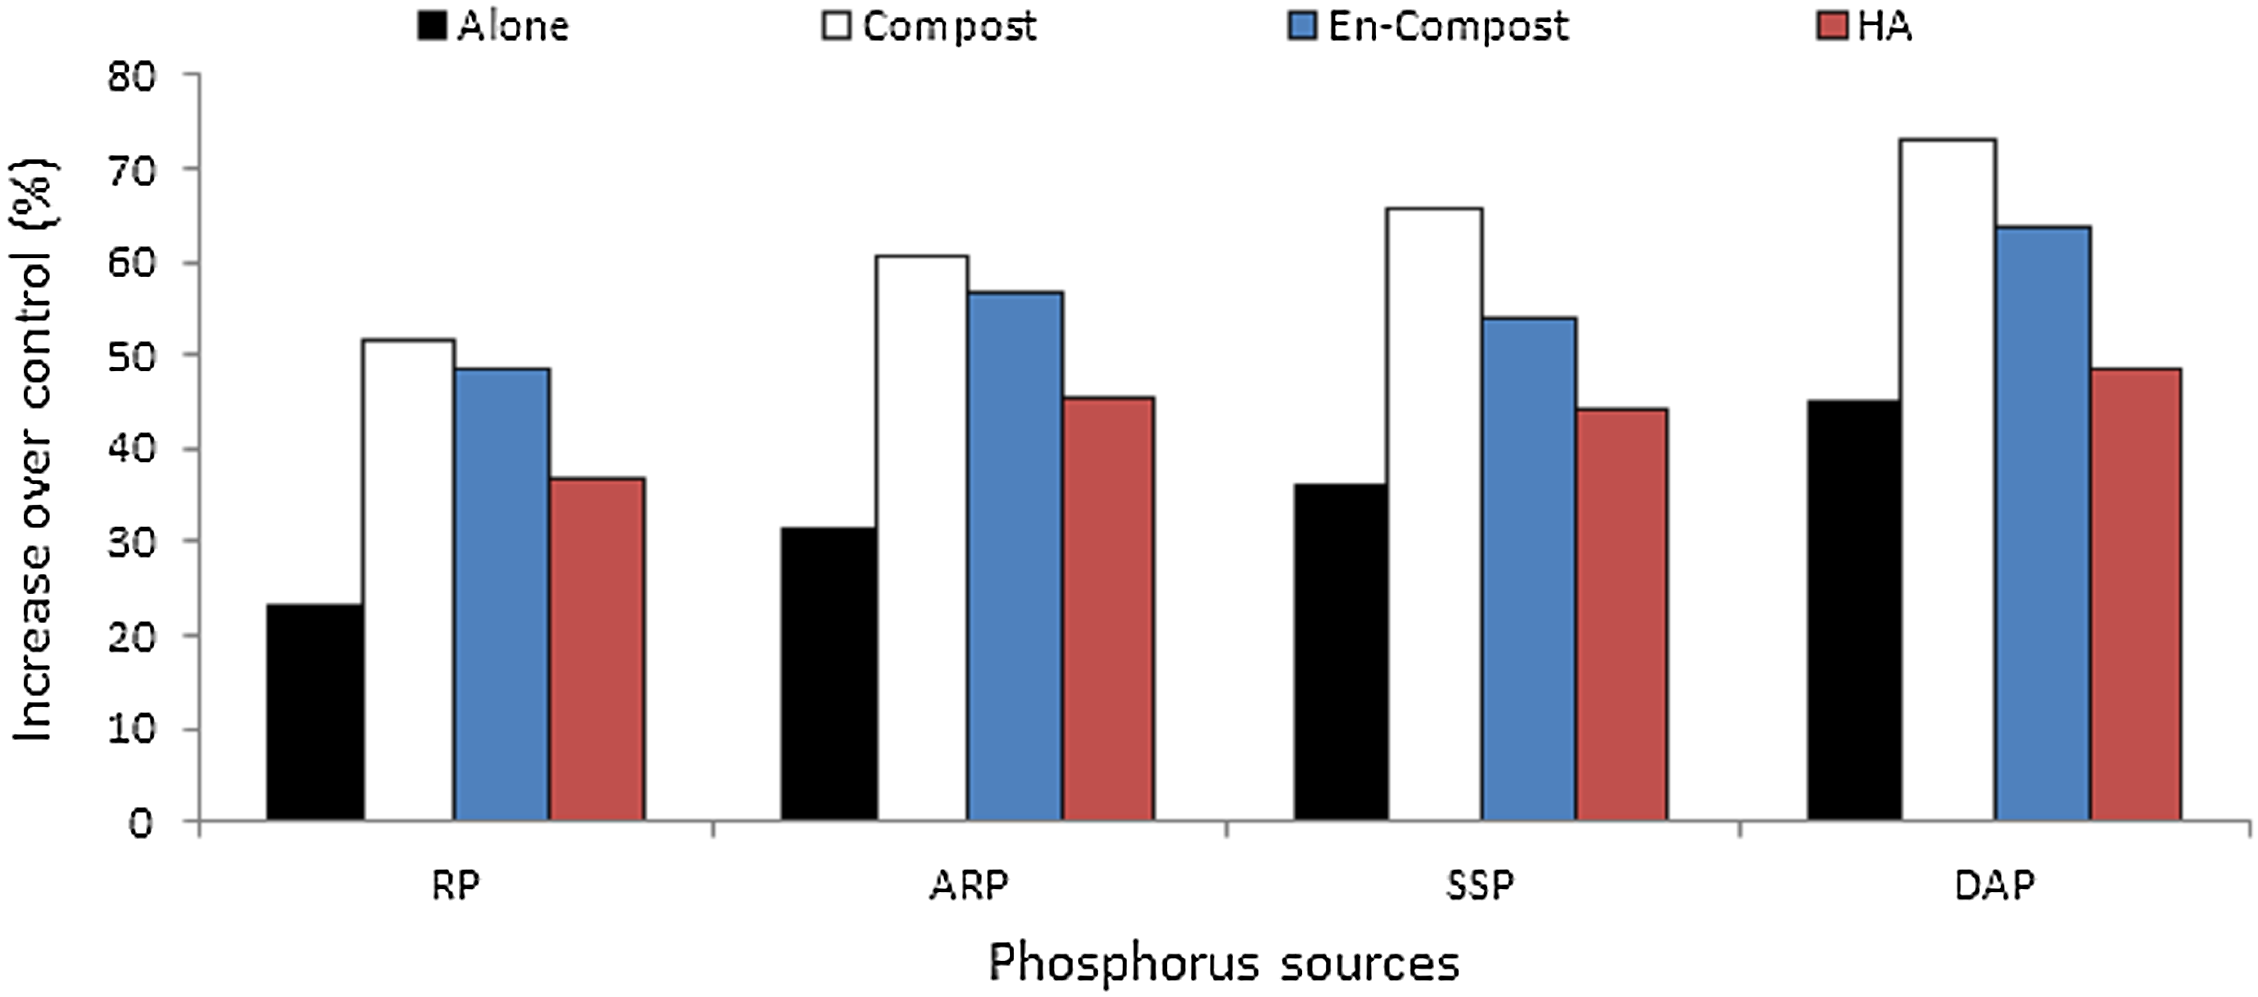
In case of integrated use of inorganic and organic fertilizers the remarkable biological yield of 10,047 kg ha−1 was obtained at DAP + compost treated plots which was significantly higher than the rest of treatment combination. The SSP + compost and ARP + compost receiving plots have also produced the biological yield of 9,606 and 9,316 kg ha−1 respectively (Fig. 1). The RP applied alone was not effective but its effectiveness was pronounced when applied in combination with compost or P enriched composts.
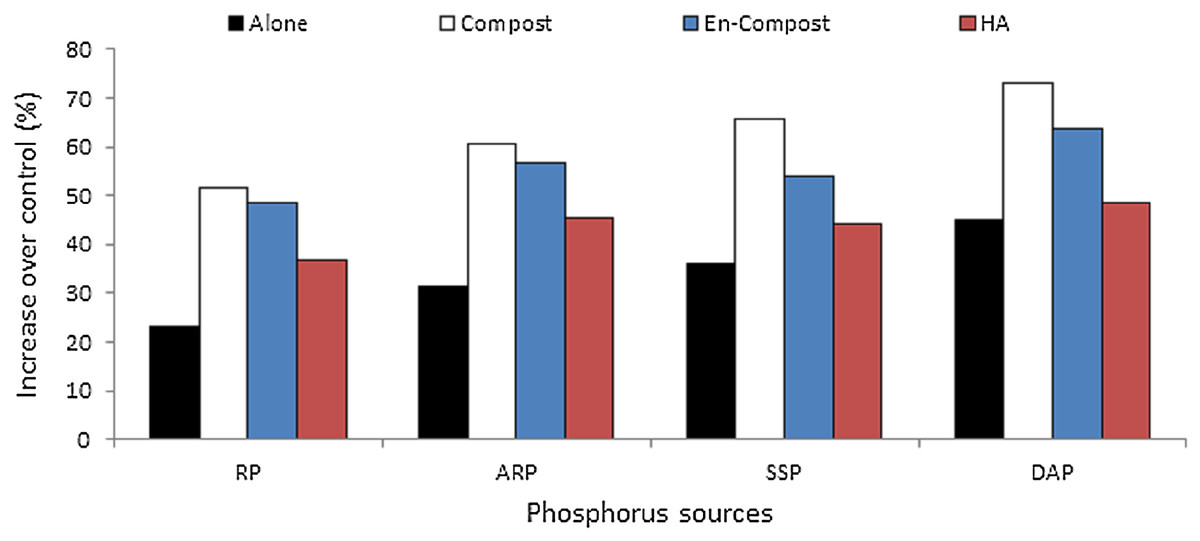
Figure 1: Increase in biological yield (%) of maize over control as affected by various sources of P fertilizers applied alone or in combination with different organic amendments.
Grain yield (kg ha−1)
Grain yield of maize significantly increased with both sole application of chemical fertilizers and their combination with organic amendments (Table 2). The plots treated with sole DAP produced grain yield of 3,256 kg ha−1 that was higher than control (1,839 kg ha−1) but produced superior grain yield of 3,877 kg ha−1 when DAP was applied with compost. This treatment (DAP + compost) showed the highest grain yield among all the applied treatments indicating that the growth and yield of the present crops is associated with solubility of P from the applied fertilizers. The ARP and SSP produced statistically similar grains yield of 2,986 kg ha−1 and 2,935 kg ha−1 respectively, those were 62.36% higher than control. The grain yield further increased when ARP and SSP were applied with different types of compost. The sole application of SSP increased grain yield by 40% but rose up to 60% when applied in combination with compost (Fig. 2). Similarly ARP applied alone showed 30% increase in grain yield over control but it was further enhanced when applied with compost suggesting that local acidification is as effective as SSP fertilizer.
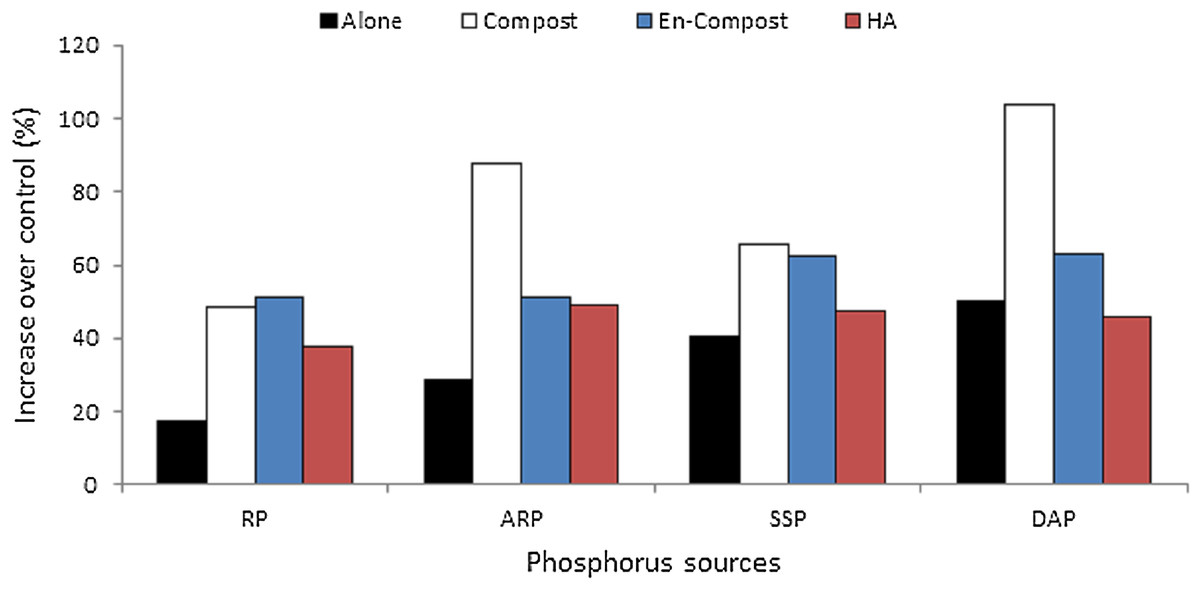
Figure 2: Increase in grains yield (%) of maize over control as affected by various sources of P fertilizers applied alone or in combination with different organic amendments.
| Amendment | Phosphorus source | Mean | |||
|---|---|---|---|---|---|
| RP | ARP | SSP | DAP | ||
| Control | - | - | - | - | 1,839 e |
| No amendment | 2,229 | 2,448 | 2,677 | 2,861 | 2,554 d |
| Compost | 2,827 | 3,569 | 3,153 | 3,877 | 3,357 a |
| Enriched compost | 2,878 | 3,088 | 3,105 | 3,514 | 3,146 b |
| Humic acid | 2,621 | 2,840 | 2,807 | 2,772 | 2,760 c |
| Mean | 2,639 c | 2,986 b | 2,935 b | 3,256 a | |
Note:
LSD for P and S levels at p < 0.05 is 192.3 kg ha−1 whereas for interaction is NS. RP, ARP, SSP and DAP stand for rock phosphate, acidulated rock phosphate, single super phosphate and di-ammonium phosphate, respectively. The means followed by different letters in each column are significantly different from each other at = 0.05.
Harvesting index (%)
Analysis of variance regarding harvest index (HI) showed significant differences for phosphorus sources applied alone or in combination with organic amendments (Table 3). When data were averaged across inorganic p sources, maximum HI (35.4%) was noted for DAP followed by ARP (34.9%) and SSP (33.4%) but minimum was calculated for RP applied alone (32.6%) which was better than control (30.2%). Similarly, data revealed that in case of organic P amendments higher HI (35.5%) was observed for compost followed by enriched compost (34.8%). Plots treated with HA gave a HI of 33.1% which was comparatively lower than compost and enriched compost.
| Amendment | Phosphorus source | Mean | |||
|---|---|---|---|---|---|
| RP | ARP | SSP | DAP | ||
| Control | - | - | - | - | 30.2 c |
| No amendment | 31.2 | 32.2 | 34.0 | 34.1 | 32.9 b |
| Compost | 32.3 | 33.9 | 37.2 | 38.5 | 35.5 a |
| Enriched compost | 33.3 | 34.0 | 34.8 | 37.0 | 34.8 ab |
| Humic acid | 33.1 | 33.6 | 33.5 | 32.1 | 33.1 ab |
| Mean | 32.5 b | 33.4 ab | 34.9 ab | 35.4 a | |
Note:
LSD for P and S levels at p < 0.05 is 1.12 whereas for interaction it has also NS, RP, ARP, SSP and DAP stand for rock phosphate, acidulated rock phosphate, single super phosphate and di-ammonium phosphate, respectively. The means followed by different letters in each column are significantly different from each other at = 0.05.
Cost benefit ratio
The benefit cost ratio (CBR) analysis of maize crop and fertilizers are presented in (Table 4). Maximum benefit of Rs. 98,762 and 98,762 ha−1 were obtained from DAP + enriched compost and DAP + compost, respectively. However, their cost benefit ratio were too low (3.1 and 5) compared to ARP enriched compost having net return of 95,540 and CBR of 10.3. The sole RP though had a higher BCR (46.4) but its net return was as low as Rs. 74,637 ha−1. Any treatment combination who’s CBR is greater than 3.0 has considered economical but its benefit should be also kept in mind. The two fertilizers having the same benefit net return then the fertilizer with high CBR would be selected. Similarly, the difference in net return between DAP and ARP enriched compost was too low that’s why, ARP enriched compost is recommended under existing soil and climatic conditions.
| Treatments | Yield | Income | Cost | Benefit | C:B ratio | ||||||
|---|---|---|---|---|---|---|---|---|---|---|---|
| Stover yield | Grain yield | Stover | Grains | Total | fertilizer | amed. | Total | ||||
| RP | 0 | 4,916 | 2,229 | 4,916 | 71,328 | 76,244 | 1,607 | 0 | 1,607 | 74,637 | 46.4 |
| RP | Compost | 5,973 | 2,827 | 5,973 | 90,464 | 96,437 | 1,607 | 16,070 | 17,677 | 78,760 | 4.5 |
| RP | E. Com | 5,745 | 2,878 | 5,745 | 92,096 | 97,841 | 1,607 | 4,018 | 5,625 | 92,216 | 16.4 |
| RP | H. Acid | 5,314 | 2,621 | 5,314 | 83,872 | 89,186 | 1,607 | 2,000 | 3,607 | 85,579 | 23.7 |
| ARP | 0 | 5,177 | 2,448 | 5,177 | 78,336 | 83,513 | 5,262 | 0 | 5,262 | 78,251 | 14.9 |
| ARP | Compost | 4,653 | 3,569 | 4,653 | 114,219 | 118,872 | 5,262 | 16,070 | 21,332 | 97,540 | 4.6 |
| ARP | E. Com | 6,014 | 3,088 | 6,014 | 98,805 | 104,820 | 5,262 | 4,018 | 9,280 | 95,540 | 10.3 |
| ARP | H. Acid | 5,596 | 2,840 | 5,596 | 90,880 | 96,476 | 5,262 | 2,000 | 7,262 | 89,214 | 12.3 |
| SSP | 0 | 5,218 | 2,677 | 5,218 | 85,664 | 90,882 | 12,500 | 0 | 12,500 | 78,382 | 6.3 |
| SSP | Compost | 6,453 | 3,153 | 6,453 | 100,896 | 107,349 | 12,500 | 16,070 | 28,570 | 78,779 | 2.8 |
| SSP | E. Com | 5,835 | 3,105 | 5,835 | 99,349 | 105,184 | 12,500 | 4,018 | 16,518 | 88,667 | 5.4 |
| SSP | H. Acid | 5,563 | 2,807 | 5,563 | 89,813 | 95,377 | 12,500 | 2,000 | 14,500 | 80,877 | 5.6 |
| DAP | 0 | 5,565 | 2,861 | 5,565 | 91,552 | 97,117 | 15,652 | 0 | 15,652 | 81,465 | 5.2 |
| DAP | Compost | 6,170 | 3,877 | 6,170 | 124,053 | 130,224 | 15,652 | 16,070 | 31,722 | 98,502 | 3.1 |
| DAP | E. Com | 5,994 | 3,514 | 5,994 | 112,437 | 118,432 | 15,652 | 4,018 | 19,670 | 98,762 | 5.0 |
| DAP | H. Acid | 5,847 | 2,772 | 5,847 | 88,693 | 94,540 | 15,652 | 2,000 | 17,652 | 76,888 | 4.4 |
Note:
Calculated valued based on: stover Rs. 1/kg, maize grains Rs. 32/kg, RP Rs. 5/kg, compost Rs. 2,000/ton, HA Rs.120/kg H2SO4 Rs. 70/l, DAP Rs. 80/kg, SSP Rs. 25/kg.
Soil organic matter (%)
Data regarding soil organic matter (SOM) as affected by sole application of chemical fertilizers or in combination with different amendments are shown in Table 5. Higher SOM was observed at DAP (0.94%) followed by ARP (0.83%) and SSP (0.82%) while minimum was observed in control plot (0.43%). When data were averaged across the P amendments, significantly higher SOM was observed in plots treated with simple compost. The SOM observed for enriched compost was 0.93% while for HA treated plots was 0.66%. The ARP + compost produced at par SOM with other conventional fertilizers.
| Amendment | Phosphorus source | Mean | |||
|---|---|---|---|---|---|
| RP | ARP | SSP | DAP | ||
| Control | - | - | - | - | 0.43 d |
| No amendment | 0.52 | 0.56 | 0.57 | 0.59 | 0.56 c |
| Compost | 0.87 | 1.19 | 1.16 | 1.37 | 1.15 a |
| Enriched compost | 0.83 | 0.95 | 0.85 | 1.10 | 0.93 b |
| Humic acid | 0.65 | 0.60 | 0.71 | 0.68 | 0.66 c |
| Mean | 0.72 b | 0.83 ab | 0.82 ab | 0.94 a | |
Note:
LSD for P and S levels at p < 0.05 for amendment is 0.16% and for interaction it has NS. RP, ARP, SSP and DAP stand for rock phosphate, acidulated rock phosphate, single super phosphate and di-ammonium phosphate, respectively. The means followed by different letters in each column are significantly different from each other at = 0.05.
Soil phosphorus concentration at boot stage and after harvest (mg kg−1)
The ABDTPA extractable phosphorus in soil at boot stage and after harvesting the crop as influenced by the application of organic and inorganic fertilizers are shown in Tables 6 and 7, respectively. There were no significant differences among the sources for soil phosphorus at boot stage but they were higher than control. When the data were averaged across P amendment maximum soil P concentration (6.28 mg kg−1) at boot stage was observed for plot receiving compost followed by P enriched composts (6.22 mg kg−1). These treatments were statistically different from HA treated plot having P contents of 5.37 mg kg−1.
| Amendment | Phosphorus source | Mean | |||
|---|---|---|---|---|---|
| RP | ARP | SSP | DAP | ||
| Control | - | - | - | - | 3.42 c |
| No amendment | 4.87 | 5.21 | 5.39 | 5.47 | 5.23 b |
| Compost | 5.28 | 6.93 | 6.34 | 6.54 | 6.27 a |
| Enriched compost | 6.27 | 6.03 | 6.52 | 6.07 | 6.22 a |
| Humic acid | 4.92 | 5.67 | 5.63 | 5.23 | 5.37 b |
| Mean | 5.34 a | 5.96 a | 5.97 a | 5.83 a | |
Note:
LSD for P and S levels at p < 0.05 for amendment is 0.81 mg kg−1 and for interaction it has NS. RP, ARP, SSP and DAP stand for rock phosphate, acidulated rock phosphate, single super phosphate and di-ammonium phosphate, respectively. The means followed by different letters in each column are significantly different from each other at = 0.05.
| Amendment | Phosphorus source | Mean | |||
|---|---|---|---|---|---|
| RP | ARP | SSP | DAP | ||
| Control | - | - | - | - | 2.17 e |
| No amendment | 3.73 | 4.07 | 3.77 | 4.99 | 4.14 d |
| Compost | 5.17 | 5.91 | 5.90 | 6.15 | 5.78 a |
| Enriched compost | 4.96 | 5.43 | 5.57 | 5.63 | 5.40 b |
| Humic acid | 4.70 | 4.76 | 4.50 | 4.41 | 4.59 c |
| Mean | 4.64 b | 5.04 a | 4.93 ab | 5.29 a | |
Note:
LSD for P and S levels at p < 0.05 for amendment is 0.39 mg kg−1 and for interaction it has NS. RP, ARP, SSP and DAP stand for rock phosphate, acidulated rock phosphate, single super phosphate and di-ammonium phosphate, respectively. The means followed by different letters in each column are significantly different from each other at = 0.05.
Post-harvest soil AB-DTPA extractable P was significantly altered by applied treatments. The soil P significantly increased with the sole application of chemical fertilizers or applied with different organic amendments. When data were averaged across fertilizer types, maximum P (5.29 mg kg−1) was noted for DAP followed by ARP (5.04 mg kg−1). Minimum P concentration (2.17 mg kg−1) was observed for control. Similarly, highest P contents of 5.59 mg kg−1 was observed with the addition of compost followed by different P enriched composts (5.57 mg kg−1). Addition of HA did not improve soil P compared to composts. Interactive effect demonstrated that soil P was highly improved (6.02 mg kg−1) with DAP + compost followed by DAP enriched compost. As DAP is considered highly soluble then other P sources (mineral) hence, it added more P to soil with the combination of compost.
Phosphorus concentrations in grains and stalk (%)
Data regarding phosphorus concentration in grains and stalk as affected by organic and inorganic P fertilizers are presented in Tables 8 and 9 correspondingly. Chemical fertilizers didn’t show any significant effect for grain P concentration in maize. However, when data were averaged across different P amendments significant differences were observed. Higher P content (0.20%) was observed for the compost treated plots which was statistically higher than that observed for P enriched composts (0.18%).
| Amendment | Phosphorus source | Mean | |||
|---|---|---|---|---|---|
| RP | ARP | SSP | DAP | ||
| Control | - | - | - | - | 0.11 c |
| No amendment | 0.13 | 0.15 | 0.13 | 0.16 | 0.14 b |
| Compost | 0.17 | 0.20 | 0.20 | 0.22 | 0.20 a |
| Enriched compost | 0.17 | 0.21 | 0.19 | 0.16 | 0.18 a |
| Humic acid | 0.16 | 0.14 | 0.13 | 0.16 | 0.15 b |
| Mean | 0.16 a | 0.17 a | 0.16 a | 0.17 a | |
Note:
LSD for P and S levels at p < 0.05 for amendment is 0.20 mg per kg and for interaction it has NS. RP, ARP, SSP and DAP stand for rock phosphate, acidulated rock phosphate, single super phosphate and di-ammonium phosphate, respectively. The means followed by different letters in each column are significantly different from each other at = 0.05.
| Amendment | Phosphorus source | Mean | |||
|---|---|---|---|---|---|
| RP | ARP | SSP | DAP | ||
| Control | - | - | - | - | 0.13 d |
| No amendment | 0.15 | 0.18 | 0.20 | 0.19 | 0.18 c |
| Compost | 0.22 | 0.25 | 0.27 | 0.32 | 0.27 a |
| Enriched compost | 0.17 | 0.21 | 0.23 | 0.27 | 0.22 b |
| Humic acid | 0.17 | 0.19 | 0.25 | 0.24 | 0.21 bc |
| Mean | 0.18 c | 0.21 bc | 0.24 ab | 0.26 a | |
Note:
LSD for P and S levels at p < 0.05 for amendment is 0.039% and for interaction it has NS. RP, ARP, SSP and DAP stand for rock phosphate, acidulated rock phosphate, single super phosphate and di-ammonium phosphate, respectively. The means followed by different letters in each column are significantly different from each other at = 0.05.
Significant differences were observed among the P sources for stalk P content in maize. Averaging the data across fertilizers, maximum P concentration of 0.26% was observed at DAP followed by SSP (0.24%) which were statistically different from treatments fertilized with ARP (0.21%) and RP (0.18%), however, they were higher than control plots (0.13%). When data were averaged across P amendments, compost treated maize plants absorbed optimum P (0.27%) than other P amendments and it was statistically higher than the rest of treatment combination. In Enriched compost fertilized plots, plants absorbed slightly higher P (0.23%) than sole chemical fertilizers.
Phosphorus use efficiency (%)
Phosphorus use efficiency (PUE) was significantly affected by various P sources either applied alone or in combination with different amendments (Table 10). Maximum PUE was observed for DAP (36.17 kg kg−1) followed by SSP (33.7 kg kg−1) and ARP (32.02 kg kg−1) while the minimum PUE (23.12 kg kg−1) was observed for control. When data were averaged across organic source, maximum PUE was observed for sample compost (37.29 kg kg−1) which was statistically different from all other amendments. Although P enriched compost had closely similar PUE value 34.95 kg kg−1 suggesting that chemical fertilizers enriched with compost has responsive effect because they may release much phosphorus to the soil which is the key factor in organic agriculture for improving yield and yield related components. The HA treated plots resulted a PUE of 30.66 kg kg−1 indicating that it had also additional beneficial P value when applied with chemical fertilizers, it may be meaningful in releasing more P from in-organic sources.
| Amendment | Phosphorus source | Mean | |||
|---|---|---|---|---|---|
| RP | ARP | SSP | DAP | ||
| Control | - | - | - | - | 22.30 e |
| No amendment | 25.03 | 27.20 | 29.74 | 31.78 | 28.44 d |
| Compost | 31.41 | 35.03 | 39.66 | 43.07 | 37.29 a |
| Enriched compost | 31.97 | 34.30 | 34.49 | 39.04 | 34.95 b |
| Humic acid | 29.12 | 31.56 | 31.18 | 30.79 | 30.66 c |
| Mean | 29.38 c | 32.02 b | 33.77 b | 36.17 a | |
Note:
LSD for P and S levels at p < 0.05 for amendment is 2.19 kg kg−1 and for interaction it has NS. RP, ARP, SSP and DAP stand for rock phosphate, acidulated rock phosphate, single super phosphate and di-ammonium phosphate, respectively. The means followed by different letters in each column are significantly different from each other at = 0.05.
Discussion
Biological and grain yield of maize showed a significant response to the application of mineral phosphorus and in combination with compost except rock phosphate. The increment in the yield of cereals crops was recorded due to the application of P fertilizers (Bilen, Bilen & Turan, 2019; Huang et al., 2011). Amano (1989) reported similar findings of higher harvest index of maize with the application of phosphorus fertilizer. However, Osinama (1995) reported no significant differences in grain yield, stover yield and harvest index with different application of the P fertilizers. This could happen due to the slow release of P from the composts (Zhang et al., 2013) and the availability of enough P to plant for long time can ensure better root system resulted in maximum growth, yield and P uptake (Table 2). Alkhader, Rayyan & Rusan (2013) also applied four different levels of phosphorus fertilizers on lettuce both in field as well as in glass house experiments and found that among all the treatments RP produced lowest plant growth and yield as compared to others P sources. When data were averaged across the organic amendments grain yield was higher than chemical fertilizers. As we know that compost and P enriched compost are considered soil conditioner which can improve soil health. Good and optimal supply of phosphorus can enhanced root activities which help plants in exploring soil nutrients and retained more soil moisture. That is why, control plot produced uneconomical grain yield which haven’t utilize sufficient nutrients required by the plants for its proper nourishment. Jamal et al. (2018) summarized from their experiment that 90 kg ha−1 P applied along with 500 g of HA resulted optimum yield of wheat crop. With the increase of biological yield, grain yield was also enhanced because of the optimum levels of nutrients were taken up by the crop (Alkhader, Rayyan & Rusan, 2013). Our results are also supported by Qin et al. (2010) and Jiang & Xie (2009), who concluded that zero tillage with phosphorus amendments has a significant increase in the grain yield of crop compared to conventional tillage. These findings are also aligned with Mashori et al. (2013) suggesting that RP integrated with SSP and FYM enhanced maize growth, biological yield, leaf P content and uptake. The production of rice was positively affected by mineral fertilizers amendments (Turan, 2019; Lan et al., 2012).
The application of mineral fertilizers enhanced the P fraction on the surface of soil (Adnan et al., 2020; Jiang & Xie, 2009). That’s why, post-harvest soil and grain P concentrations were statistically similar for SSP, ARP and DAP when averaged across the amendments. Similarly, the HA compost and enriched compost gave at par results when averaged across the fertilizer types, indicating that any phosphate fertilizer applied with amendments could improve the soil P level and its uptake by plant (Tables 7 & 8). These results were in line with Mashori et al. (2013), who concluded that RP integrated with SSP and FYM enhanced maize growth, dry matter, leaf P content and uptake. Our results are also in agreement to many researchers (Turan et al., 2019; Jiang & Xie, 2009). With the maintaining of organic matter on the surface of soil enhanced the fertility of soil. Organic fraction of soil significantly enhanced the acidifying nature of soil, thus, enhanced the availability of soluble P (Huang et al., 2012). Organic materials increased the soil organic matter from 1.17 to 2.85 kg ha−1 and reduced the oxidation stability of SOM (Wang, Miao & Li, 2015; Li et al., 2017; Sayyed et al., 2019; Adnan et al., 2019). Organic section of soil enhanced soil fertility (Zhang et al., 2011). Our result contrasts with the result of Huang & Yuan (1994) who reported the decrease of organic phosphorus with the amendments of mineral P and no tillage surface. Moreover, we observed an increase in soil P resulting from an increase in soil organic P, which is also in line with Tiecher, Dos Santos & Calegari (2012).
The soil P content at boot stage of the maize crop has shown an influential effect with the application of mineral P. This agrees with the findings of Zhang et al. (2006). Lan et al. (2012) and Lee, Lee & Kim (2004) reported that the application of fertilizer significantly enhanced the accumulation of P fraction in soil. Our results are also supported by Sharif, Khattak & Sarir (2002) who reported that HA addition to the soil generally reduce P fixation and increase the recovery of P. Similarly, Zhang et al. (1994) observed that in the rice field, organic P linearly increase with the amendments of P fertilizers. Improvement in grain P concentration of maize crops is in line with Khan et al. (2020) who reported that as the level of organic substitution increased from 25–75%, the phosphorus content exhibit a progressive increase. Roy & Tripathi (1987) also reported increase in nutrient content and uptake with increasing application of P. Our results oppose the findings of Ibrahim et al. (2011) who reported linear decrease in P uptake with the increments of fertilizer P. According to Jamal et al. (2018), application of different levels of P and HA either applied alone or in combination significantly increased soil P concentration over control. Our results contrasts with Zhang et al. (2006) who determined the limitation of extractable P in paddy soil under calcareous condition, but in line with Adeyemi et al. (2020) and Lan et al. (2012) who observed significant increase in labile organic P and total organic P concentration with application of P. These findings were in consistency with Waldrip-Dail et al. (2009) who reported that P values increased as the crop gradually matured. Phosphorous use efficiency showed a remarkable result for the integrated application of mineral and organic P and these findings were also studied by Ademba et al. (2015) who reported that integrated use of phosphate fertilizers and manure applications significantly improved maize yield and PUE. The excess P application can increase the risk of P movement to surface and groundwater (Grant et al., 2005) and thus PUE decreases.
Conclusions
ARP performed similar to SSP and DAP either applied alone or in combination with composts and HA for most of studied traits. The performance of sole RP was inferior but improved by addition of compost, HA or it’s pretreatment with organic amendments—(i.e. sample and RP-enriched compost). Phosphate fertilizer (DAP/SSP) in integration with composts significantly improved the yield and PUE of maize as compared to other treatments. Plant growth and yield though was comparatively lower in different P enriched compost treated plots but still it could be considered economical and feasible as the bulk of compost was reduced by 10 times. These findings imply that, the PUE and economic feasibility of natural/chemical P fertilizers can be improved by either their integrated application or pre-treatment with organic amendment and shall be practiced for improved crop productivity under calcareous soils.