
Evaluation of effective quantum yields of photosystem II for CO2 leakage monitoring in carbon capture and storage sites
- Published
- Accepted
- Received
- Academic Editor
- Maria Gavrilescu
- Subject Areas
- Biophysics, Ecology, Plant Science, Environmental Impacts
- Keywords
- Carbon capture and storage, CO2 leakage, Chlorophyll fluorescence, Hyperspectral sensing, Index evaluation score
- Copyright
- © 2021 He et al.
- Licence
- This is an open access article distributed under the terms of the Creative Commons Attribution License, which permits unrestricted use, distribution, reproduction and adaptation in any medium and for any purpose provided that it is properly attributed. For attribution, the original author(s), title, publication source (PeerJ) and either DOI or URL of the article must be cited.
- Cite this article
- 2021. Evaluation of effective quantum yields of photosystem II for CO2 leakage monitoring in carbon capture and storage sites. PeerJ 9:e10652 https://doi.org/10.7717/peerj.10652
Abstract
Vegetation monitoring can be used to detect CO2 leakage in carbon capture and storage (CCS) sites because it can monitor a large area at a relatively low cost. However, a rapidly responsive, sensitive, and cost-effective plant parameters must be suggested for vegetation monitoring to be practically utilized as a CCS management strategy. To screen the proper plant parameters for leakage monitoring, a greenhouse experiment was conducted by exposing kale (Brassica oleracea var. viridis), a sensitive plant, to 10%, 20%, and 40% soil CO2 concentrations. Water and water with CO2 stress treatments were also introduced to examine the parameters differentiating CO2 stress from water stresses. We tested the hypothesis that chlorophyl fluorescence parameters would be early and sensitive indicator to detect CO2 leakage. The results showed that the fluorescence parameters of effective quantum yield of photosystem II (Y(II)), detected the difference between CO2 treatments and control earlier than any other parameters, such as chlorophyl content, hyperspectral vegetation indices, and biomass. For systematic comparison among many parameters, we proposed an indicator evaluation score (IES) method based on four categories: CO2 specificity, early detection, field applicability, and cost. The IES results showed that fluorescence parameters (Y(II)) had the highest IES scores, and the parameters from spectral sensors (380–800 nm wavelength) had the second highest values. We suggest the IES system as a useful tool for evaluating new parameters in vegetation monitoring.
Introduction
Carbon capture and storage (CCS) technology, which has been developed in many countries over the last two decades, is a potentially useful and promising way to reduce anthropogenic CO2 emissions (IPCC, 2005, Pachauri & Meyer, 2014; European Commission & European Communities, 2011; Cartier, 2020). CO2 leakage probability is low when CCS site selection, characterization, and project design are appropriately undertaken. Moreover, the guidance documents from the Storage Directive (European Commission & European Communities, 2011) provide a legislative framework for appropriate project design to ensure permanent and safe CO2 storage (Pruess, 2011; Chen et al., 2017). Nevertheless, potential CO2 leakages from deep storage sites through injection wells, abandoned wells, geological faults, or fractures should not be ignored (IPCC, 2005; Jones et al., 2014; Jiang et al., 2015). Consequently, sensitive and effective monitoring of CO2 leakage is essential for safe and successful CCS applications (IPCC, 2005; Pearce et al., 2014; Vrålstad et al., 2018).
Conventionally, many buried CO2 sensors would be used to detect CO2 leakage because the location of leakage is unpredictable. Therefore, it is costly to monitor a large area (Noble et al., 2012). As an alternative, vegetation monitoring has been suggested to detect leakage across a large area in a cost-effective manner (Vodnik et al., 2002; Pfanz et al., 2004; Patil, 2012; Noble et al., 2012). Plants grown near a leak are known to be negatively affected by increased CO2 concentrations in the soil. Therefore, considerable changes in leaf color, chlorophyl content, plant height, and biomass can be observed within a few days to months after leakage (Beaubien et al., 2008; Krüger et al., 2011; Sharma et al., 2014; Lake et al., 2016a). Among those CO2-affected plant parameters, chlorophyl content was suggested to be a more appropriate parameter than biomass because it can be measured using nondestructive methods such as spectral sensors. However, the change in chlorophyl content due to elevated soil CO2 is generally observed 7–15 days after the initiation of CO2 leakage (Patil, 2012; Zhang et al., 2016; He et al., 2019a), showing that it is not an early indicator. Moreover, chlorophyl content change could not differentiate CO2 stress from other environmental stresses in the field (Sharma et al., 2014). Hyperspectral sensors were introduced in this field of study because they can detect various symptoms of plant stress by measuring an extensive range of reflectance signatures. CO2 and water stress were detected in the visible to near-infrared regions (VNIR: 380–800 nm) with normalized difference vegetation index (NDVI) and infrared regions (SWIR: 800–1,400 nm) with normalized difference water index (NDWI), respectively (Male et al., 2010; Lakkaraju et al., 2010; Wimmer et al., 2011). In the USA, Male et al. (2010) demonstrated that spectrometer payloads aboard unmanned aerial vehicles were successful in detecting CO2 leakage in the large artificial gassing site of the Zero Emissions Research and Technology (ZERT) project. In the UK, Jiang et al. (2015) detected CO2 leakage using a spectroradiometer in an artificial soil gassing and response detection (ASGARD) site, and in Australia, Feitz et al. (2014) observed a change in plant spectral responses under CO2 stress at the Ginninderra experiment station. However, these studies reported that the change in hyperspectral parameters was evident within 7–14 days. This indicates that the parameters from spectral sensing could not detect CO2 leakage in the early stages. In order to overcome the low sensitivity of these parameters, photosynthetic process-based parameters were tested to determine whether they are more sensitive to CO2 leakage detection. The photosynthetic rate, stomatal conductance, and transpiration rate were reported to decrease within 1–4 days in soil with high CO2 (>40%) conditions (Lake et al., 2016b; Zhang et al., 2016; He et al., 2019b). Consequently, they are potential early indicators for detecting CO2 leakage. However, the measurements of these parameters are generally laborious and require time-consuming procedures (Lake et al., 2016b; Zhang et al., 2016).
Recently, chlorophyl fluorescence parameters derived from photochemistry have been suggested as sensitive indicators for the early detection of plant responses to environmental stresses such as drought, salinity, diseases, and extreme temperature (Jiang et al., 2006; Roháček, Soukupová & Barták, 2008; Živčák et al., 2008; Li et al., 2013). Empirical fluorescence parameters, such as maximum quantum yield of photosystem II (Fv/Fm) and non-photochemical quenching (NPQ), have been proposed as the most sensitive indicators to detect plant responses to stress. However, Fv/Fm and NPQ measurement should be conducted in leaves adapted in the dark for at least 30 min before measurements are taken (Baker, 2008; Narayan, Misra & Singh, 2012; Murchie & Lawson, 2013). Thus, Fv/Fm and NPQ are not suitable for the rapid detection of plant stresses, especially under field conditions. Recently, advancements in fluorometer technology have supported the measurement of these parameters under natural light conditions, that is Y(II), which gives the proportion of absorbed light that is used in photosystem II photochemistry. Y(II) has been suggested as valuable indicators of plant stress because it does not have the limitation of leaf dark adaptation (Murchie & Lawson, 2013). Although the accurate measurement of Y(II) is still challenging under natural conditions, a new advanced monitoring pulse-amplitude-modulation fluorometer (MONI-PAM) would be a reliable tool for measuring Y(II) during daylight periods (Porcar-Castell et al., 2008). Y(II) was reported to detect plant drought stress after 1–2 days of treatment in a laboratory study (Li et al., 2013). Although the application of chlorophyl fluorescence parameters has rarely been reported in CO2 leakage monitoring, we firstly hypothesize that the fluorescence parameters of Y(II) derived from photochemical processes could be a useful indicator to quickly detect CO2 leakage, because the photosynthesis process is known to be affected by elevated soil CO2 (Zhang et al., 2015).
However, early detection is only one of the criteria to be a good indicator. The best parameter should not only detect CO2 leakage early but also discriminate CO2 stress from other environmental stresses, such as drought or heat. At the same time, it might cover large areas of monitoring at a relatively low cost (Male et al., 2010; Noble et al., 2012; Murchie & Lawson, 2013). To select the optimal indicator for CO2 leakage monitoring, there is a need to have a systematic comparison among suggested plant indicators for detecting CO2 leakage.
This study is composed of two parts. In the first part, we conducted a greenhouse experiment to simulate CO2 leakages. The aims were to (1) examine the possibility of chlorophyl fluorescence parameters for detecting CO2 leakage; (2) identify the parameters that could be used to distinguish CO2 and water stresses. In the second part, based on the results from our experiment and by synthesizing extensive findings from other studies, we developed a framework to evaluate indicators to provide the guideline for selecting the optimal parameter for CO2 leakage monitoring (Male et al., 2010; Noble et al., 2012; Lake et al., 2013)
Materials and Methods
Soils, plants, and injection pot
The greenhouse experiment was conducted at the campus of Kyung Hee University, South Korea (37°14′24″ N, 127°5′2″ E) (He et al., 2019b). The soils used in this experiment were a 1:1 (v/v) mixture of potting and mineral soils. Commercial potting soil was procured from the Korea Association of Seedbed Media in South Korea. Mineral soil was collected from the Environmental Impact Evaluation Test Facility in South Korea (36°57′44″ N, 127°28′3″ E). This facility is an artificial gassing site that was established to develop environmental management techniques for soil, groundwater, atmosphere, and ecosystems in CO2 storage sites. The basic physicochemical properties are summarized in Table 1. Three-leaf stage kale (Brassica oleracea var. viridis), purchased from West Suwon Agricultural Products Inc. (Suwon, South Korea), was prepared for the experiment. Kale was selected as our testing plant for the following reasons: (1) it is known to be sensitive to environmental stress (Tang et al., 2014), and (2) the leaves are sufficiently large to be covered by the chambers of measurement devices.
| Soil | pH | TN | TC | Composition (%) | |||||
|---|---|---|---|---|---|---|---|---|---|
| -g kg−1 soil- | Zeolite | Pearlite | Vermiculite | Coco peat | Peat moss | Other | |||
| Potting | 6.5 | 6.3 | 390.3 | 4.1 | 7.3 | 6.6 | 68.0 | 14.7 | 0.3 |
| Clay | Silt | Sand | |||||||
| Mineral | 5.3 | 0.5 | 3.7 | 8 | 25 | 67 | |||
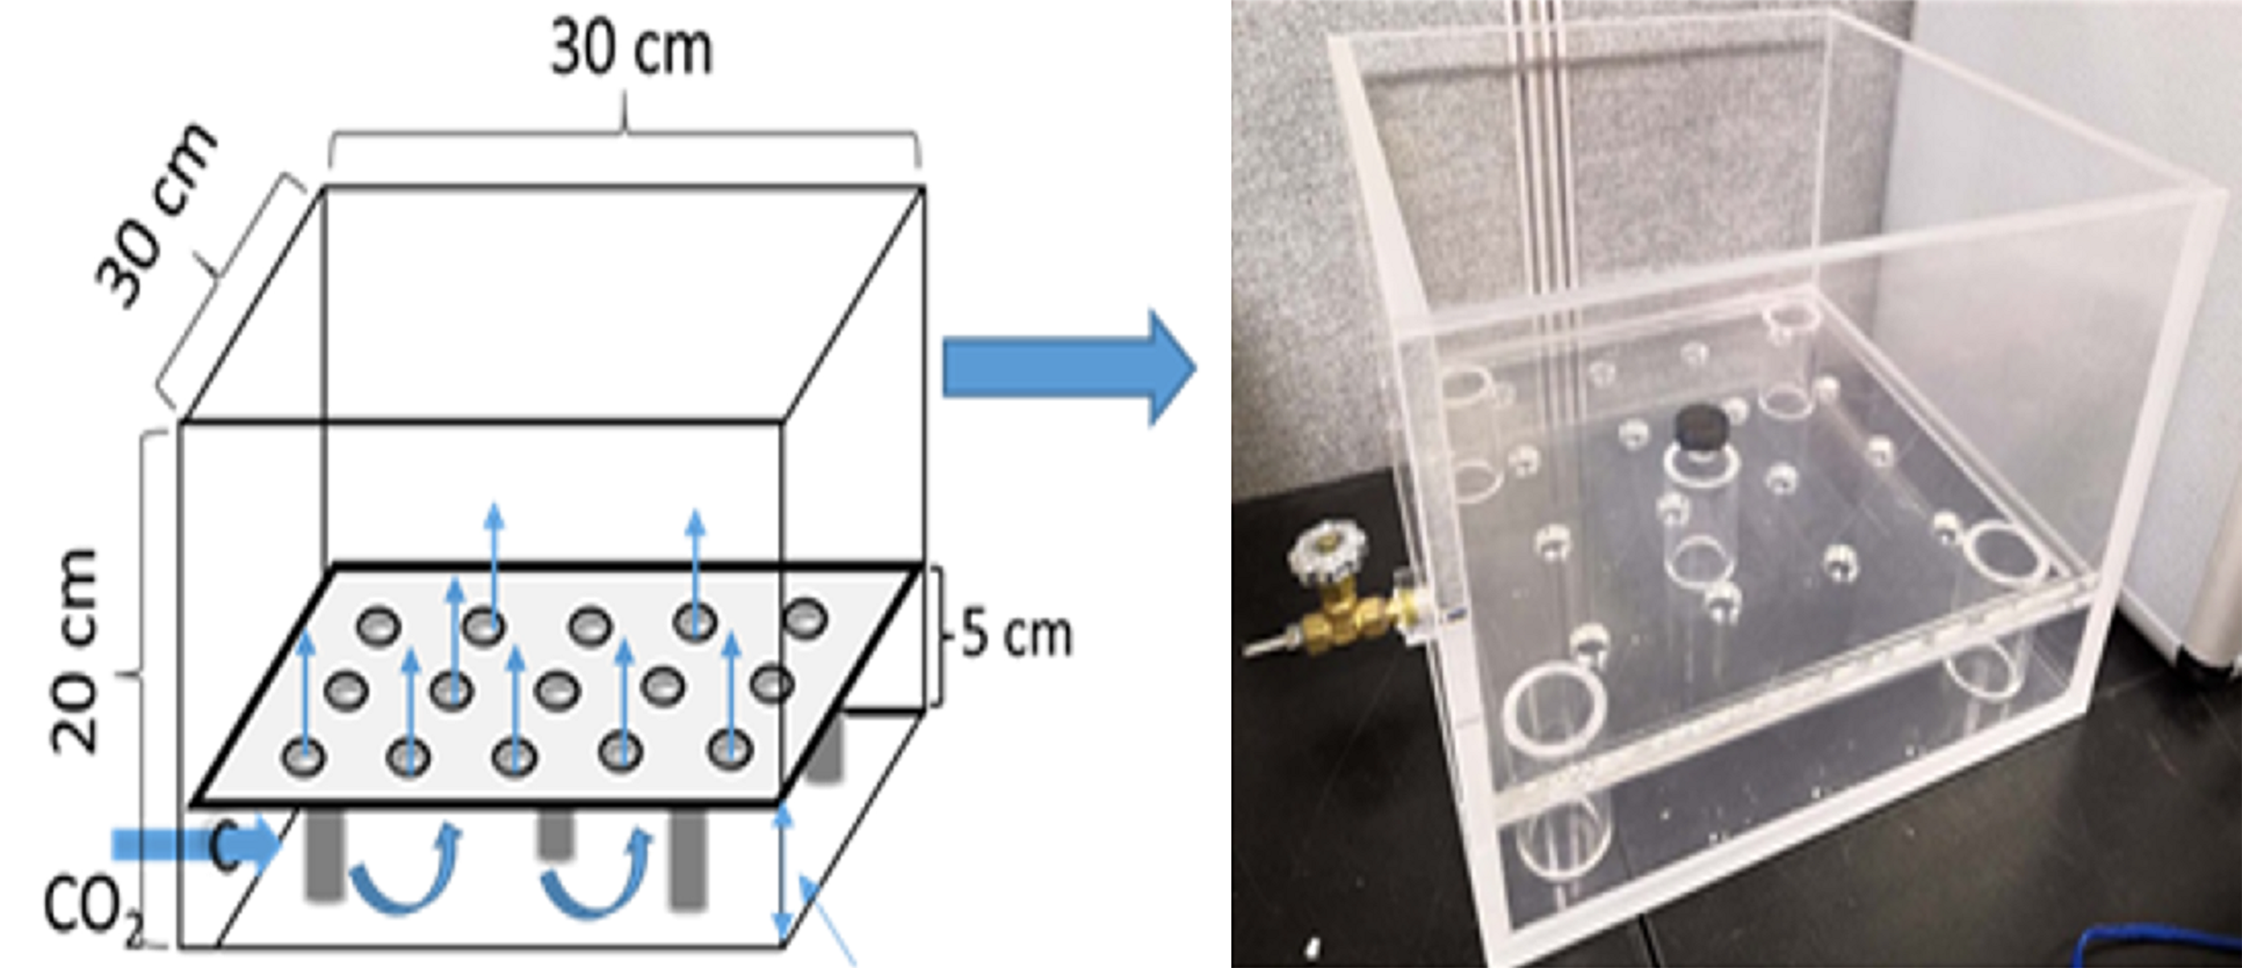
A specially designed acrylic pot consisted of an upper soil chamber (15 × 30 × 30 cm, i.e., height × length × width, respectively) and bottom injection space (5 × 30 × 30 cm, i.e., height × length × width, respectively) (Fig. 1). A clapboard between the soil and gassing chambers had 16 holes drilled into it and was covered with mesh (pore diameter: 250 µm) for optimal gas diffusion. The soil chamber was filled with 8 kg of soil mixture to a depth of 15 cm. Seedlings were transplanted into the soil chamber with 12 plants per pot on September 13, 2018.
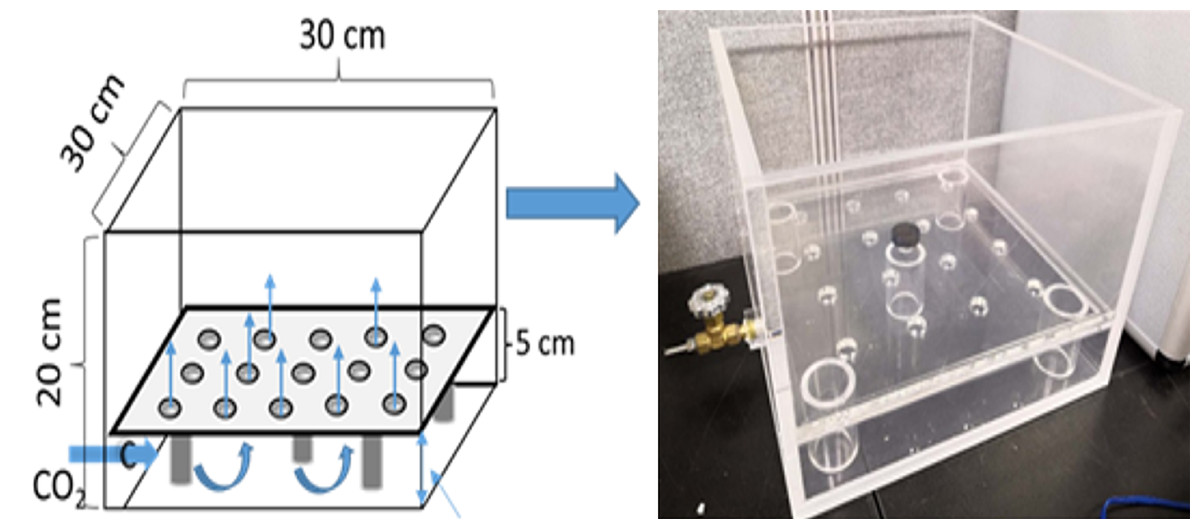
Figure 1: The design diagram and photo of the injection pot.
Treatment design
Three CO2 treatments included 10%, 20%, and 40% soil CO2 concentrations (labeled 10% CO2, 20% CO2, and 40% CO2, respectively). Pure CO2 gas was continuously injected into the gassing pots from October 10 to 20, 2018. The soil CO2 concentrations were adjusted by controlling the injection flow rate using a flow meter. A control plot was prepared without any CO2 injection. Soil water contents in the CO2 treatments and control were maintained at 55–65% of soil water-holding capacity (WHC) by watering daily at 500–800 ml per pot during the experimental period. To differentiate the plant responses to CO2 stress to those with water stress, we prepared a water stress treatment (WATER) and water stress with 40% CO2 treatment (WATER + CO2). Soil water contents in the WATER and WATER + CO2 treatments were maintained at 25–35% of WHC by watering daily at 100–150 ml per pot. These soil water contents were considered to be a mild water stress condition for kale (Li et al., 2013; Xavier et al., 2017). Each treatment included three replicated pots. During the experimental period, the ambient temperature was 19 ± 3 °C during the day and 6 ± 3 °C at night. The greenhouse remained open and two fans were used to prevent ambient CO2 accumulation which might affect the plant leaf level CO2 concentration (He et al., 2019b).
Measurement of soil CO2, O2 concentrations, and water content
The CO2 and O2 concentrations were measured daily using a portable GA5000 gas sensor (for CO2%) ranging from 1 to 100% (volume with ±1% accuracy) (Geotechnical Instruments UK Limited, Coventry, UK) at 10 cm depth. Soil water content (% volumetric basis) was measured daily using a Decagon 5TM soil moisture sensor (Decagon Devices, Inc., Washington, DC, USA).
Plant measurements
The overall visual changes in the plants in each treatment were recorded by taking photographs every 2 days. Measurements of reflectance signature, photosynthetic parameters, chlorophyl content, and chlorophyl fluorescence parameters were measured on the third to the fifth fully expanded leaves. These selected leaves were in a similar developmental stage, which would minimize variation due to different physiological ages of the leaves (Mendelssohn, McKee & Kong, 2001). Plant measurements were conducted between 10:00 am and 16:30 pm on October 10, 13, 15, and 18 (i.e., 0, 3, 5, and 8 days after experiment onset, respectively), 2018. The hyperspectral reflectance signatures from wavelengths 350 to 2500 nm (spectral resolution: 3 nm VNIR, 30 nm SWIR) were measured using ASD FieldSpec Pro (Malvern Panalytical Ltd. Cambridge, Malvern, UK). Leaf level measurements were conducted on 10 leaves in each pot. The spectral signatures were converted to readable reflectance values using the ViewSpecPro software (Vision 6.2; ASD, Inc., Falls Church, VA, USA). The vegetation indices, including the NDVI, photochemical reflectance index (PRI), and enhanced vegetation index (EVI), were calculated to monitor leaf pigment changes according to the equations in Table 2. The NDVI is a popular vegetation index, which has been shown to be strongly related to chlorophyl light interception (Tucker, 1979; Hatfield et al., 2008). On the other hand, the PRI is an indicator of changes in carotenoid pigments, which could also imply environmental stress (Gamon, Peñuelas & Field, 1992; Penuelas et al., 1997). The EVI is an alternative index to assess vegetation greenness and has also been used to detect CO2 leakage (Bateson et al., 2008). Furthermore, the NDWI and modified normalized difference water index (mNDWI) were correlated with the water content of plants (Xu, 2006; Male et al., 2010; Gautam et al., 2015), and were also calculated following the equations in Table 2.
| Indices | Formula | References |
|---|---|---|
| NDVI | (R800* – R670)/(R800 + R670) | Tucker (1979) |
| EVI | 2.5 × ((R800 − R670)/(R800 + 6 × R670 − 7.5 × R470 + 1)) | Huete et al. (2002) |
| PRI | (R570 − R531)/(R531 + R570) | Gamon, Peñuelas & Field (1992) |
| NDWI | (R860 − R1,240)/(R860 − R1,240) | Gao (1996) |
| mNDWI | (R1,280 − R1,450)/(R1,280 + R1,450) | Xu (2006) |
Note:
Chlorophyll content was measured for 10 leaves in every pot using a chlorophyl meter (SPAD 502plus; Konica Minolta, Tokyo, Japan). This is a well-known method for estimating leaf chlorophyl concentration (Süß et al., 2015). The measurement head of the SPAD emits light with peak wavelengths at 650 nm and 940 nm when it clips a leaf. Part of the light was absorbed by chlorophyl, while the transmittance light was measured by a photodiode detector to calculate the relative chlorophyl content automatically (Süß et al., 2015).
The conventional photosynthetic parameters (i.e., photosynthetic rate (Pn), stomatal conductance (Gs), and transpiration rate (Tr)) were measured in three to five leaves per pot using an infrared gas analyzer by portable devices, LI-6400 and LI-6800 (LI-COR, Lincoln, NE, USA). The measurements were made with a red-light source at 1,000 µmol m–2 s–1 photosynthetic photon flux density (PPFD), which was near the plant photosynthetic saturation point (Kalaji et al., 2018; Casanova-katny, Barták & Gutierrez, 2019).
Chlorophyll fluorescence was measured using the WinControl-3 controlled MONI-PAM Fluorometer system (Heinz-Walz, Eifeltrich, Germany). The MONI-PAM system comprised three emitter-detector heads (MONI-head/485). These units can measure three leaves simultaneously because each head is an independent fluorometer. The head can provide an actinic light pulse up to 1500 μmol m−2 s−1 PPFD (Porcar-Castell et al., 2008; Janka et al., 2015). The MONI-PAM device measured the maximal fluorescence yield (Fm′), steady-state fluorescence yield (Fs′), and photosynthetically active radiation (PAR) on six leaves in each pot. The fluorescence parameters of Y(II) was calculated to estimate the plant stress responses by the formula: Y(II) = (Fm′ – Fs′)/Fm′ (Maxwell & Johnson, 2000; Murchie & Lawson, 2013; Janka et al., 2015). Y(II) was analyzed using a modified regression method by plotting the light response curve of Y(II) to PAR for each leaf (Sven, Mates & John, 2014; Casanova-katny, Barták & Gutierrez, 2019). The leaf level PAR values were adjusted by controlling the emitter-detector head to emit actinic light pulse incrementally (i.e., 100, 200, 300, 450, 650, 800, 1,200, and 1,500 µmol m−2 s−1). The Y(II) values was obtained from the curve at PAR = 1,000 μmol m−2 s−1.
After the injection stopped, plants were harvested and oven-dried at 70 °C for 3 days to measure biomass.
Evaluation of plant parameters
The indicator evaluation score (IES) was developed to compare the efficiencies of the parameters for CO2 leakage monitoring. Based on extensive reviews, we set up four criteria for IES, including early detection, CO2 specificity, field applicability, and cost (Male et al., 2010; Patil, 2012; Al-Traboulsi et al., 2012; Noble et al., 2012; He et al., 2019a). The scores in each criterion, ranging from 1 to 5, were allocated for each parameter based on the evaluation standards in Table 3.
| Score | CRITERIA | |||
|---|---|---|---|---|
| Early detection | Initial day for observing plant changes (day) | Differentiate control and CO2 (≥10%) stress treatment | ||
| 5 | ≤1 | Y* | ||
| 4 | 2–4 | Y | ||
| 3 | 5–7 | Y | ||
| 2 | 8–10 | Y | ||
| 1 | >10 | Y | ||
| *Y: The parameters differentiate the control and CO2 stress treatments (P < 0.05). | ||||
| CO2 specificity | Differentiate water stress treatment from | |||
| 5 | CO2 (≥10%) stress and water + CO2 stress* | |||
| 4 | Water + CO2 stress | |||
| 3 | CO2 (≥10%) stress | |||
| 2 | Control | |||
| 1 | N** | |||
| *The parameters differentiate water stress treatment from compared treatments (P < 0.05); **N: The parameter cannot detect water stress. | ||||
| Field applicability | Nondestructive | Remotely detectable | Automatic monitor | Continuous monitor |
| 5 | Y* | Y | Y | Y |
| 4 | Y | Y | Y | N** |
| 3 | Y | Y | N | N |
| 2 | Y | N | N | N |
| 1 | N | N | N | N |
| *Y: the parameter meets the criterion; **N: the parameter does not meet the criterion. | ||||
| Cost | Average cost of device and time | |||
| 5 | Low* | |||
| 4 | Low + medium** | |||
| 3 | Medium*** | |||
| 2 | Medium + high**** | |||
| 1 | High***** | |||
| *Low: low device (<$5,000) and low time (<3 min). | ||||
| **Low + medium: (1) low device and medium time (4–20 min) or (2) low time and medium device ($5,000–$30,000). | ||||
| ***Medium: (1) medium device and medium time, (2) low device and high time, or (3) low time and high device. | ||||
| ****Medium + high: (1) medium device and high time (>20 min) or (2) medium time and high device (>$30,000). | ||||
| *****High: high device and high time. | ||||
The first criterion of early detection was identified by the timing of when the parameter differentiated control and elevated soil CO2 treatment (Table 3). The time intervals for scoring were defined based on the observations of the timing with which plants respond to elevated soil CO2 concentrations in previous gassing studies (Patil, 2012; West et al., 2015; Lake et al., 2016b; He et al., 2019b). As 10% soil CO2 was reported as a threshold level to negatively affect plants (Al-Traboulsi et al., 2012; Jones et al., 2015; West et al., 2015), the timing for the significant difference between CO2 (≥10%) and control was used for scoring. Therefore, the parameter with a score of 5 was defined as capability to detect CO2 leakage within 1 day. Subsequently, the parameters with scores of 4, 3, 2, and 1 can detect leakage within 2–4 days, 5–7 days, 8–10 days, and >10 days, respectively (Patil, 2012; West et al., 2015; Lake et al., 2016b; He et al., 2019b).
The second criterion of CO2 specificity was identified by the ability to detect the difference between water and soil CO2 stresses, or between water and water + CO2 stresses. The identification of CO2 specificity was based on previous studies that reported similar responses of plants to water and CO2 stresses (≥40%) in the early stage of treatments (Lake et al., 2016b; Kim et al., 2017). Hence, the parameter, that differentiates water and CO2 stresses, could be expected to be CO2-specific. The parameter with a score of 5, in this criterion (Table 3), was defined by its capability to discriminate water stress from both 40% CO2 and water + CO2 stress (Bellante et al., 2014). On the other hand, the parameter with a score of 4 can differentiate water and 40% CO2 stress. The one with a score of 3 can differentiate water stress from mild CO2 stress (10% CO2). The parameter with a score of 2 can detect CO2 (≥10%) and water stresses but cannot differentiate both, while that with a score of 1 can only detect CO2 stress.
The third criterion of field applicability was identified by examining whether the parameter meets the four sub-standards, which are nondestructive, remotely detectable, automatic, and continuous measurements (Table 3). The selection of sub-standards of field applicability for each parameter was based on the literature and product catalogs (He et al., 2019a, 2019b; Li et al., 2013; Male et al., 2010; https://www.walz.com; https://www.malvernpanalytical.com). The nondestructive sampling of plants allows sustainable monitoring of CO2 leakage from plants (Noble et al., 2012). The remotely detectable parameters allow coverage of a large area (Male et al., 2010). Automatic and continuous measurements are helpful for ease of data collection and long-term monitoring in CCS sites (Male et al., 2010). The parameter with a score of 5 can meet four sub-standards, while the parameters with scores of 4, 3, 2, and 1 meet three, two, one, and none of the sub-standards, respectively.
The fourth criterion, cost, was identified by the average cost of sensor devices and time spent taking the measurement and data process (Table 3). The cost of devices was based on literature and sensor catalogs (Kim et al., 2019; Noble et al., 2012; https://www.walz.com; https://www.malvernpanalytical.com; https://licor.co.za) and the time cost for measurements was also referenced from above catalogs. In order to compare cost, the price of the device was categorized into three levels: low (<$5000), medium ($5000–$30,000), and high (>$30,000), following the extensive review by Noble et al. (2012), and the catalogs by the leading producers of sensors (https://www.walz.com; https://www.malvernpanalytical.com). In a similar manner, time for sampling and data processing was categorized into three levels, that is, low (<3 min), medium (4–20 min), and high (>20 min) (Noble et al., 2012). The parameter with a score of 5 (marked as low) requires that both the cost of device and time are classified as low level (Table 3). The parameter with a score of 4 (marked as low + medium) should be at least one low cost in device or time and one in medium cost in device or time. This included two conditions: (i) low price and medium time; (ii) low time and medium price (Table 3). The parameter with a score of 3 (marked as medium) should be the average cost of the device price and time at the medium level. This included three conditions: (i) medium cost in both device and time; (ii) low device price and high cost in time; and (iii) high device price and low cost in time. The parameter with a score of 2 (marked as medium + high) should be two conditions: (i) medium price and high time; and (ii) medium time and high price. The parameter with a score of 1 (marked as high) is high cost for both device and time (Table 3).
Finally, the IES value is calculated by adding the scores in the four criteria, following the equation:
(1) where Vi is the score in the four criteria (n = 4) of early detection, CO2 specificity, field applicability, and cost.
Statistical analysis
The light response curve of Y(II) to PAR for each leaf was processed in MATLAB R2014a (The MathWorks Inc., Natick, MA, USA). Analysis of variance (ANOVA) of Y(II), NDVI, PRI, EVI, NDWI, mNDWI, Pn, Gs, Tr, chlorophyl content, and biomass among the control, CO2, WATER, and WATER + CO2 treatments were analyzed using SAS 9.1 (SAS Institute Inc., Cary, NC, USA). The least-square means were used to test for significant differences among treatments at the 5% probability level. All results are reported as mean ± standard error.
Results and discussions
Soil conditions and morphological changes in plants
In the 10%, 20%, and 40% CO2 treatments, soil gas concentrations were maintained at target levels during the experimental period (Table 4). Soil O2 concentrations decreased in all the CO2 treatments. This inference is consistent with the findings by Patil, Colls & Steven (2010), who found that the injected CO2 can replace soil O2. The photographs showed that the appearance of leaf chlorosis occurred in all the CO2 treatments on day 5, and yellow leaves significantly increased in the higher CO2 soil concentration treatments (Fig. 2). These results indicated that our experimental system was adequate for examining the effects of soil with different CO2 concentrations on plants.
| Treatments | Soil CO2 (%) | Soil O2 (%) | Water content (WHC%) |
|---|---|---|---|
| Control | <1.0 | 21.4 (±0.02) | 54.6 (±3.8) |
| 10% CO2 | 10.2 (±0.27) | 20.1 (±0.05) | 54.8 (±3.7) |
| 20% CO2 | 19.9 (±0.28) | 19.0 (±0.07) | 55.1 (±4.8) |
| 40% CO2 | 40.0 (±0.29) | 14.4 (±0.8) | 56.0 (±5.4) |
| WATER | <1.0 | 21.5 (±0.01) | 31.8 (±2.9) |
| WATER + CO2 | 39.9 (±0.25) | 14.4 (±0.11) | 31.9 (±4.3) |
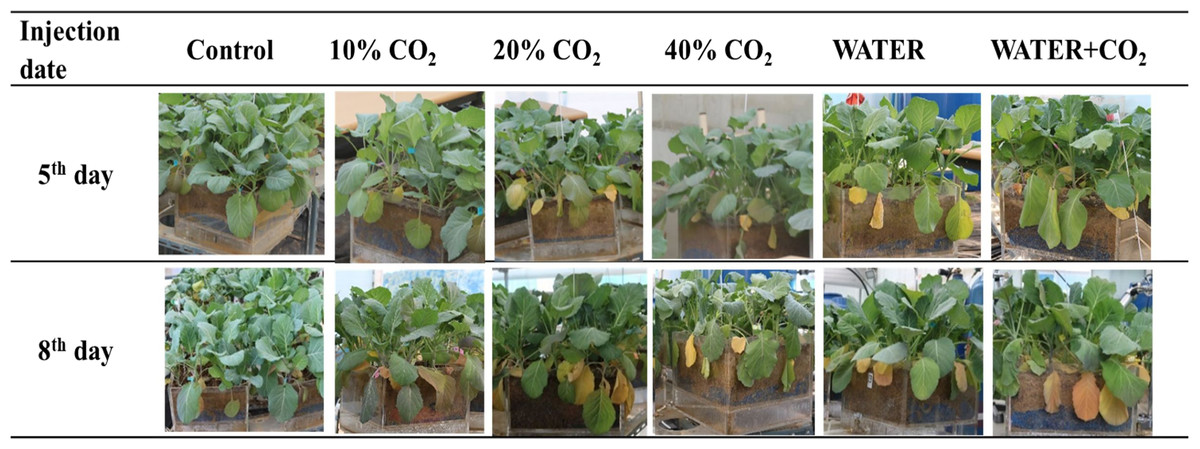
Figure 2: Plant visible changes in each treatment.
The “injection date” in the 5th day and 8th day mean that the photos were taken at 5 and 8 days after CO2 injection started, respectively. The treatments included control, 10% CO2, 20% CO2, 40% CO2, water stress (WATER) and water stress combined CO2 stress (WATER + CO2).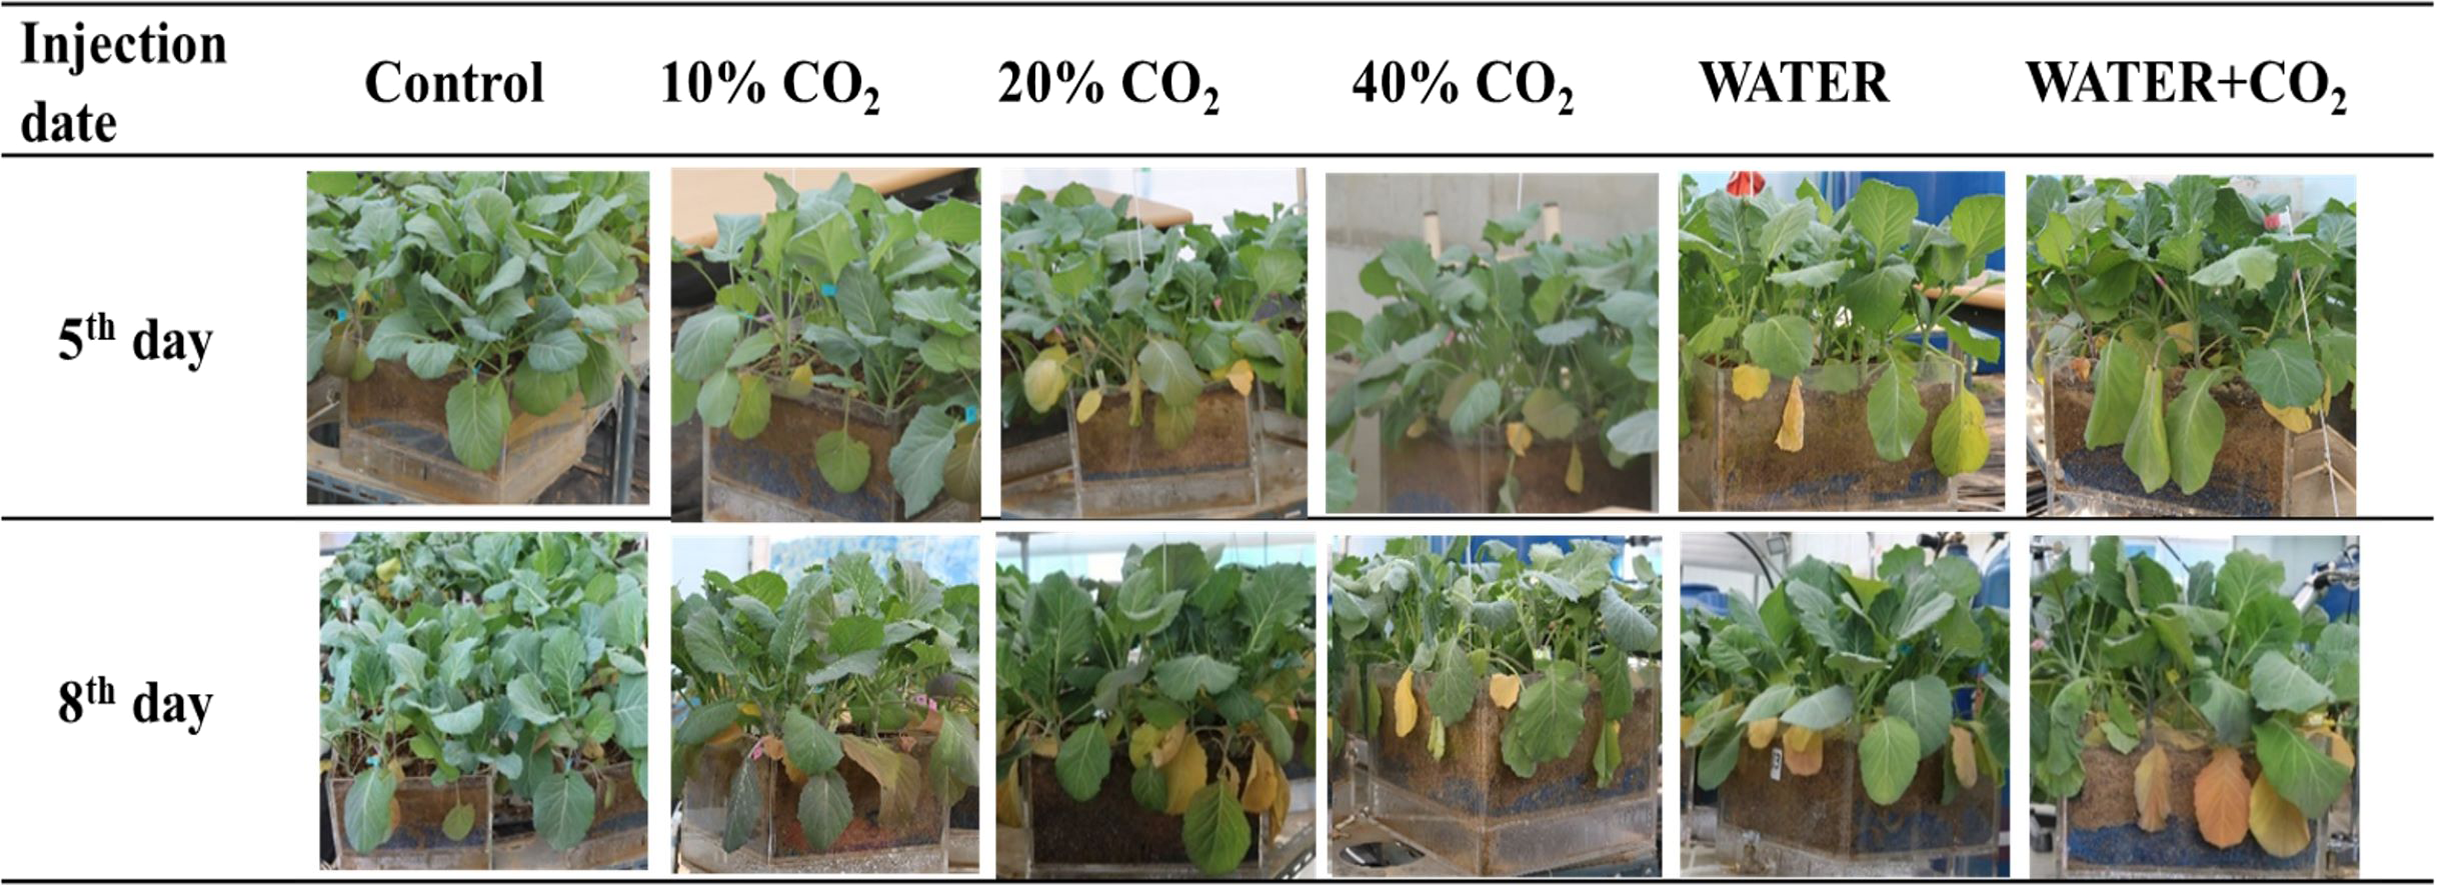
In the WATER and WATER + CO2 treatments, soil water content was maintained at the target levels during the experimental period (Table 4). The leaves in both treatments slightly wilted and drooped (Fig. 2). This indicated that those plants were subjected to water stress (Naser et al., 2010; Xavier et al., 2017). The photographs showed that water stress also induced leaf chlorosis (Fig. 2). The number of yellow leaves in the WATER + CO2 treatment was greater than those in the WATER treatment (Fig. 2), which implies that the effects of the combination of water and CO2 stresses on plants were worse than those of water stress.
Parameters for early detection of CO2 leakage
The timing for the first differentiation between the control and CO2 treatments varied for different parameters. The hyperspectral reflectance parameters of NDVI, EVI, and PRI (within the pigment absorption bands) changed on day 8 in all CO2 treatments compared to the control (Fig. 3), while chlorophyl content first changed on day 5 in the 40% CO2 treatments (Fig. 4). These results imply that NDVI, EVI, PRI, and chlorophyl content can be used to monitor ecosystem changes by CO2 leakage, but their responses were not quick enough to detect CO2 leakage. Although the reflectance and chlorophyl parameters have been widely used to monitor CO2 leakage points in artificial gassing sites and natural CO2 spring areas (Bateson et al., 2008; Male et al., 2010; Patil, 2012; Feitz et al., 2014), the primary purpose of these parameters was not to detect CO2 leakage but to monitor overall changes in plants due to leakage.
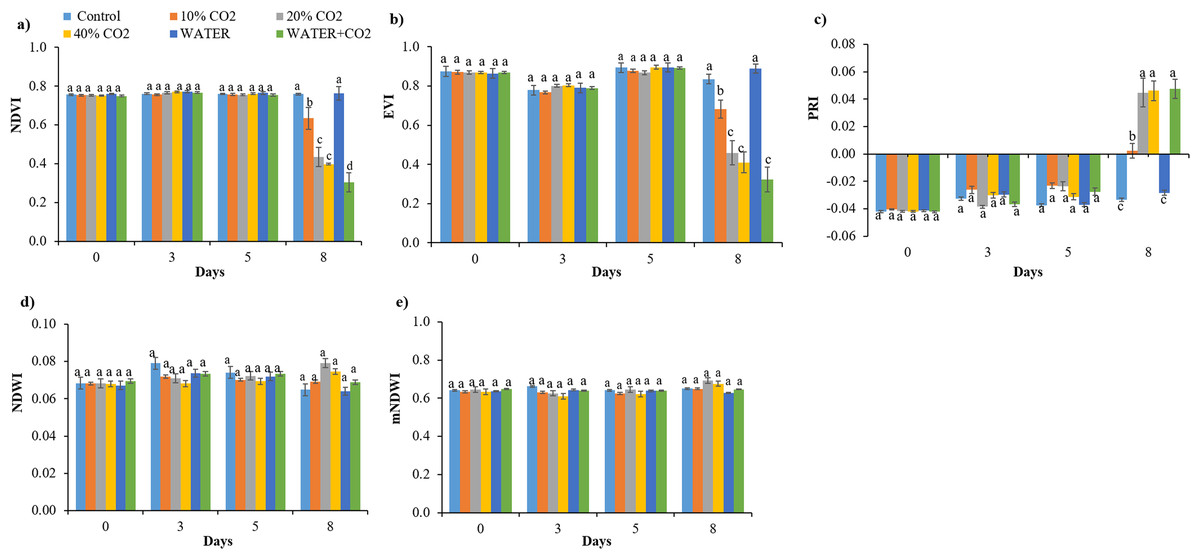
Figure 3: Values of vegetation indices of NDVI (A), EVI (B), PRI (C), NDWI (D), and mNDWI (E) in each treatment.
Vertical lines represent the standard error (n = 30), and values for the same date with the same letter are not significantly different at a 5% significance level.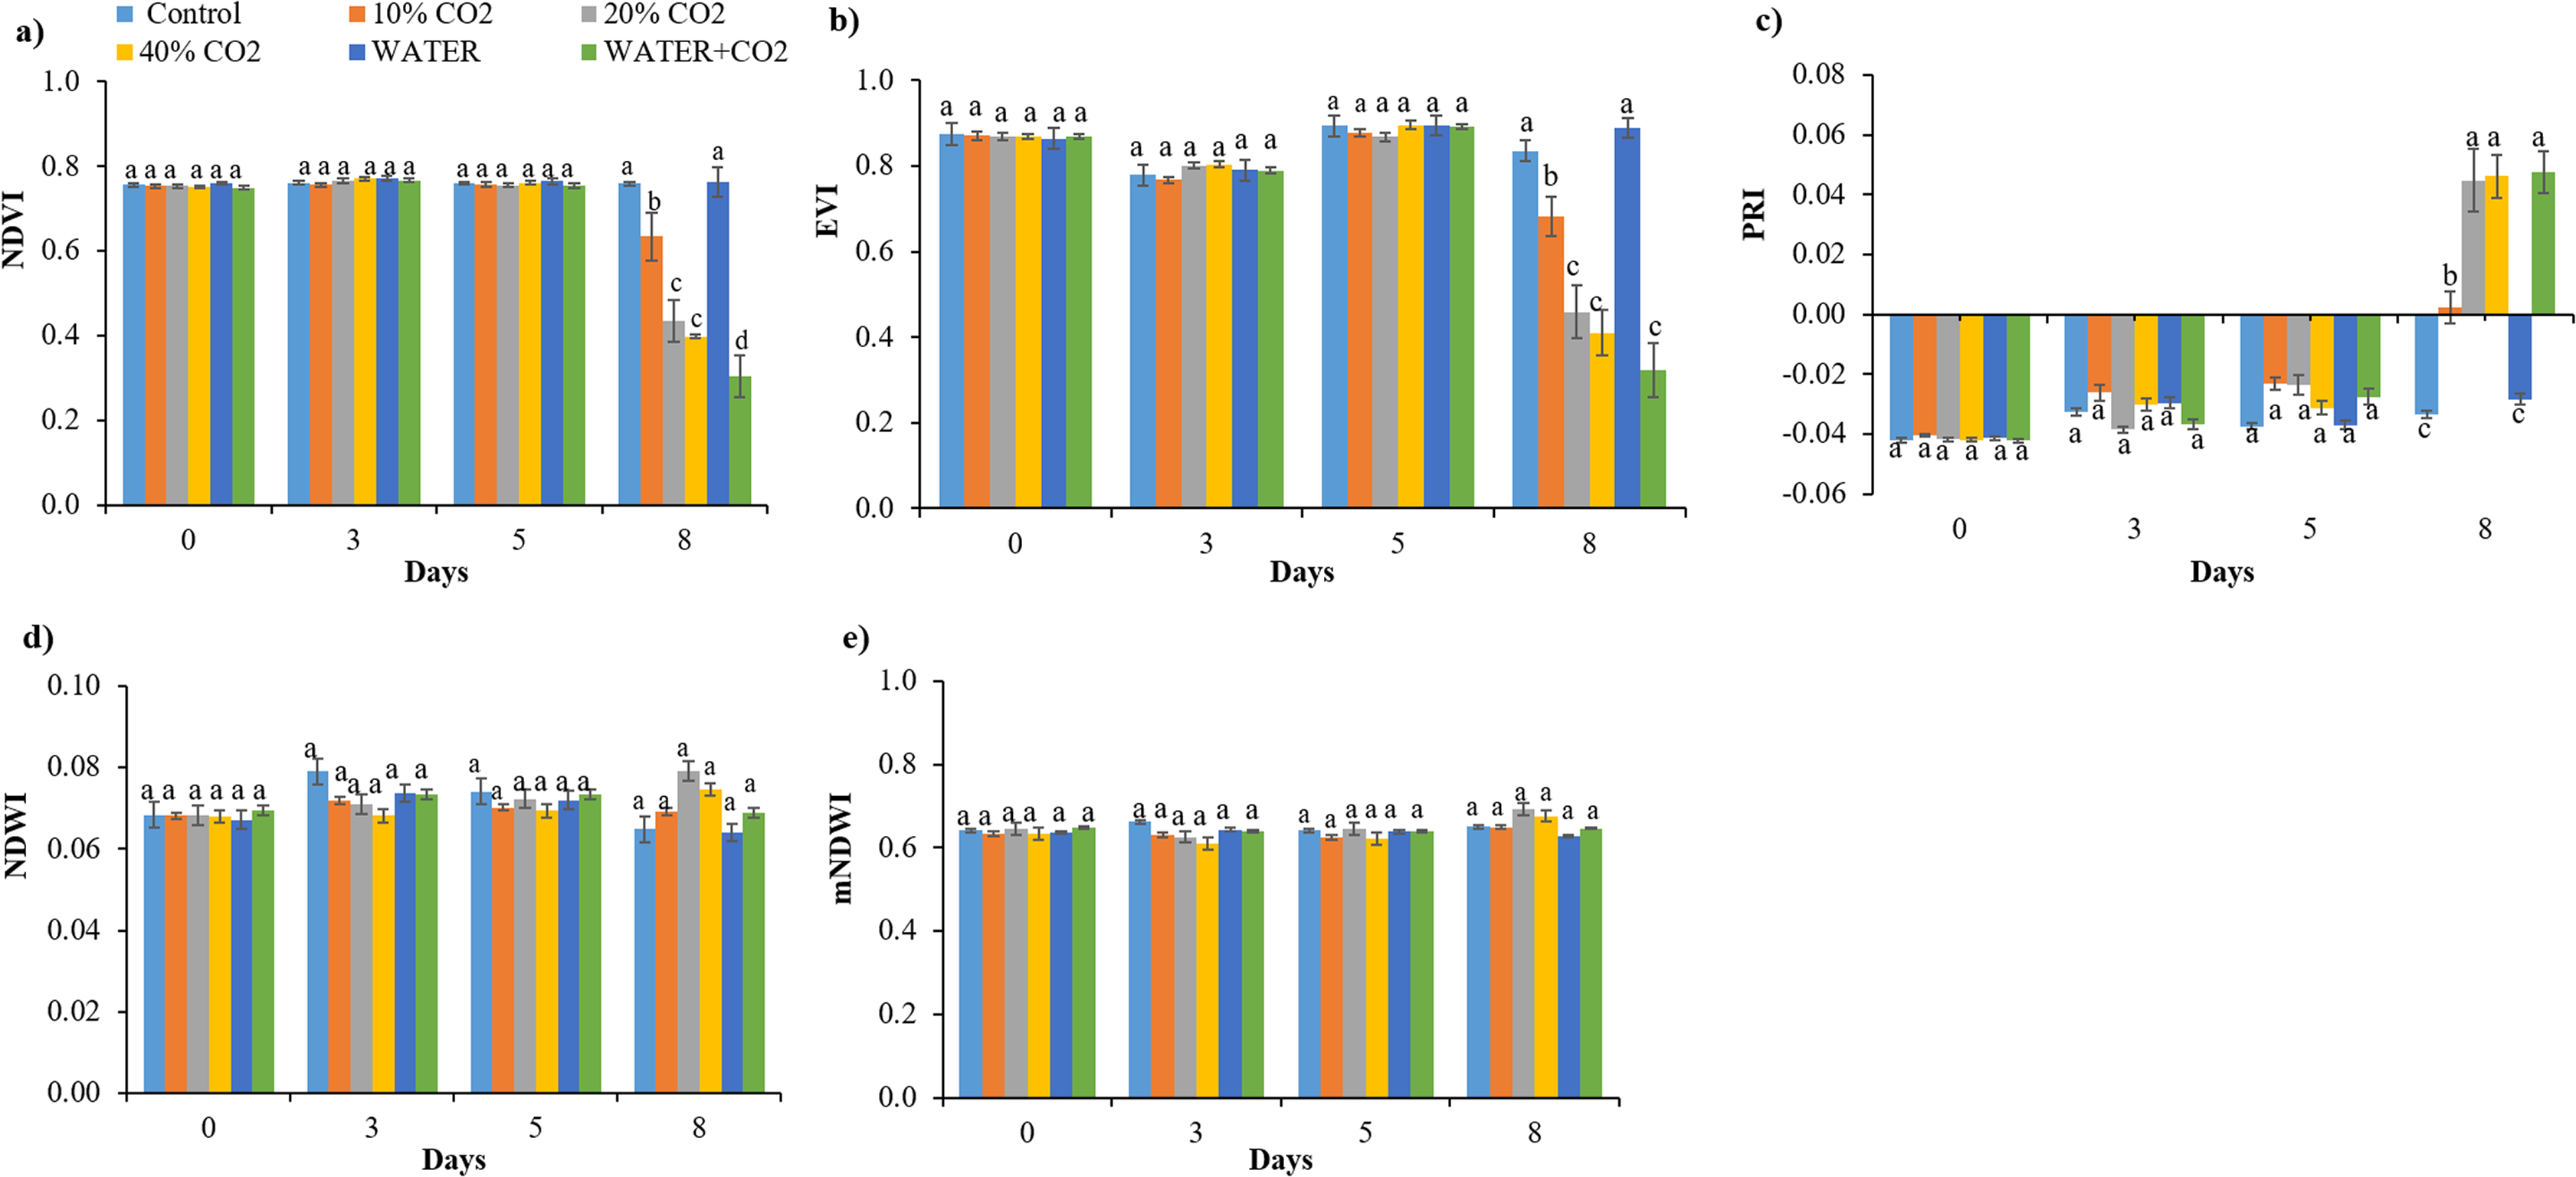
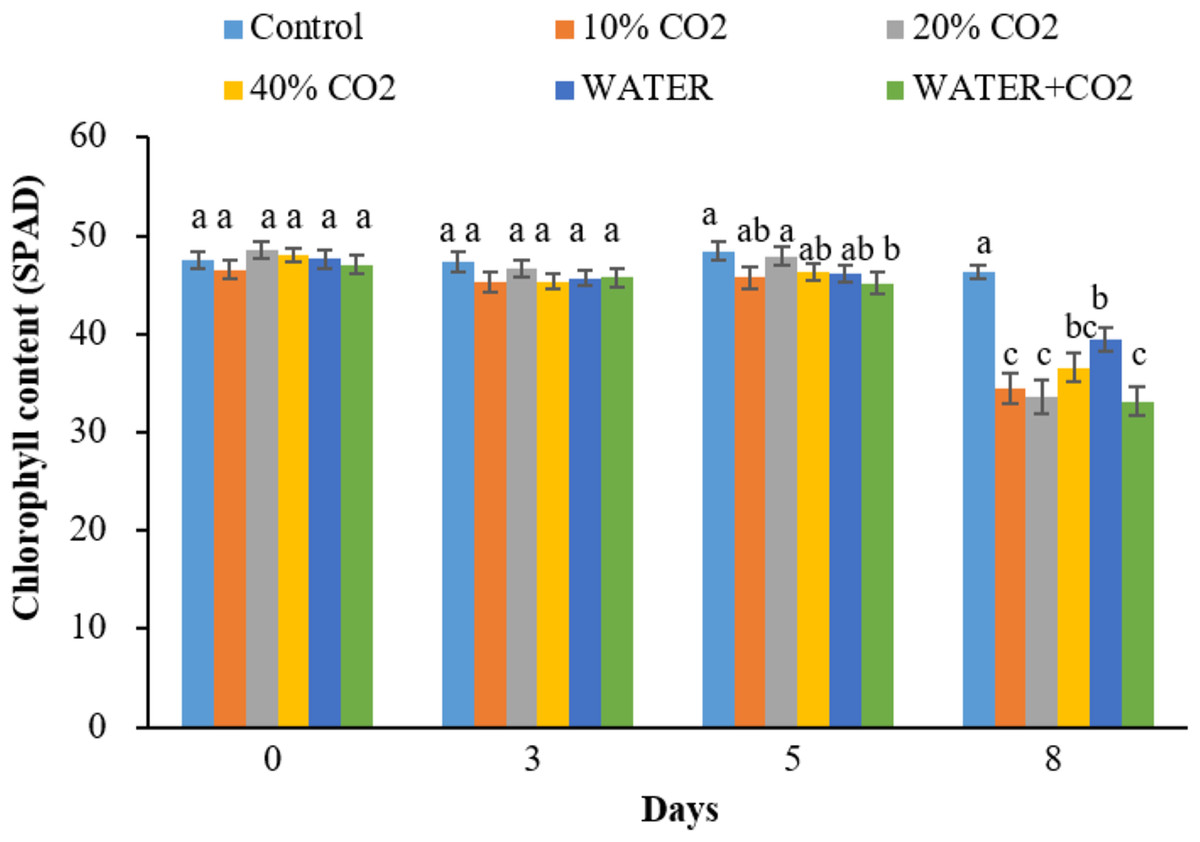
Figure 4: Chlorophyll contents change in each treatment over time.
Vertical lines represent the standard error (n = 10), and values for the same date with the same letter are not significantly different at a 5% significance level.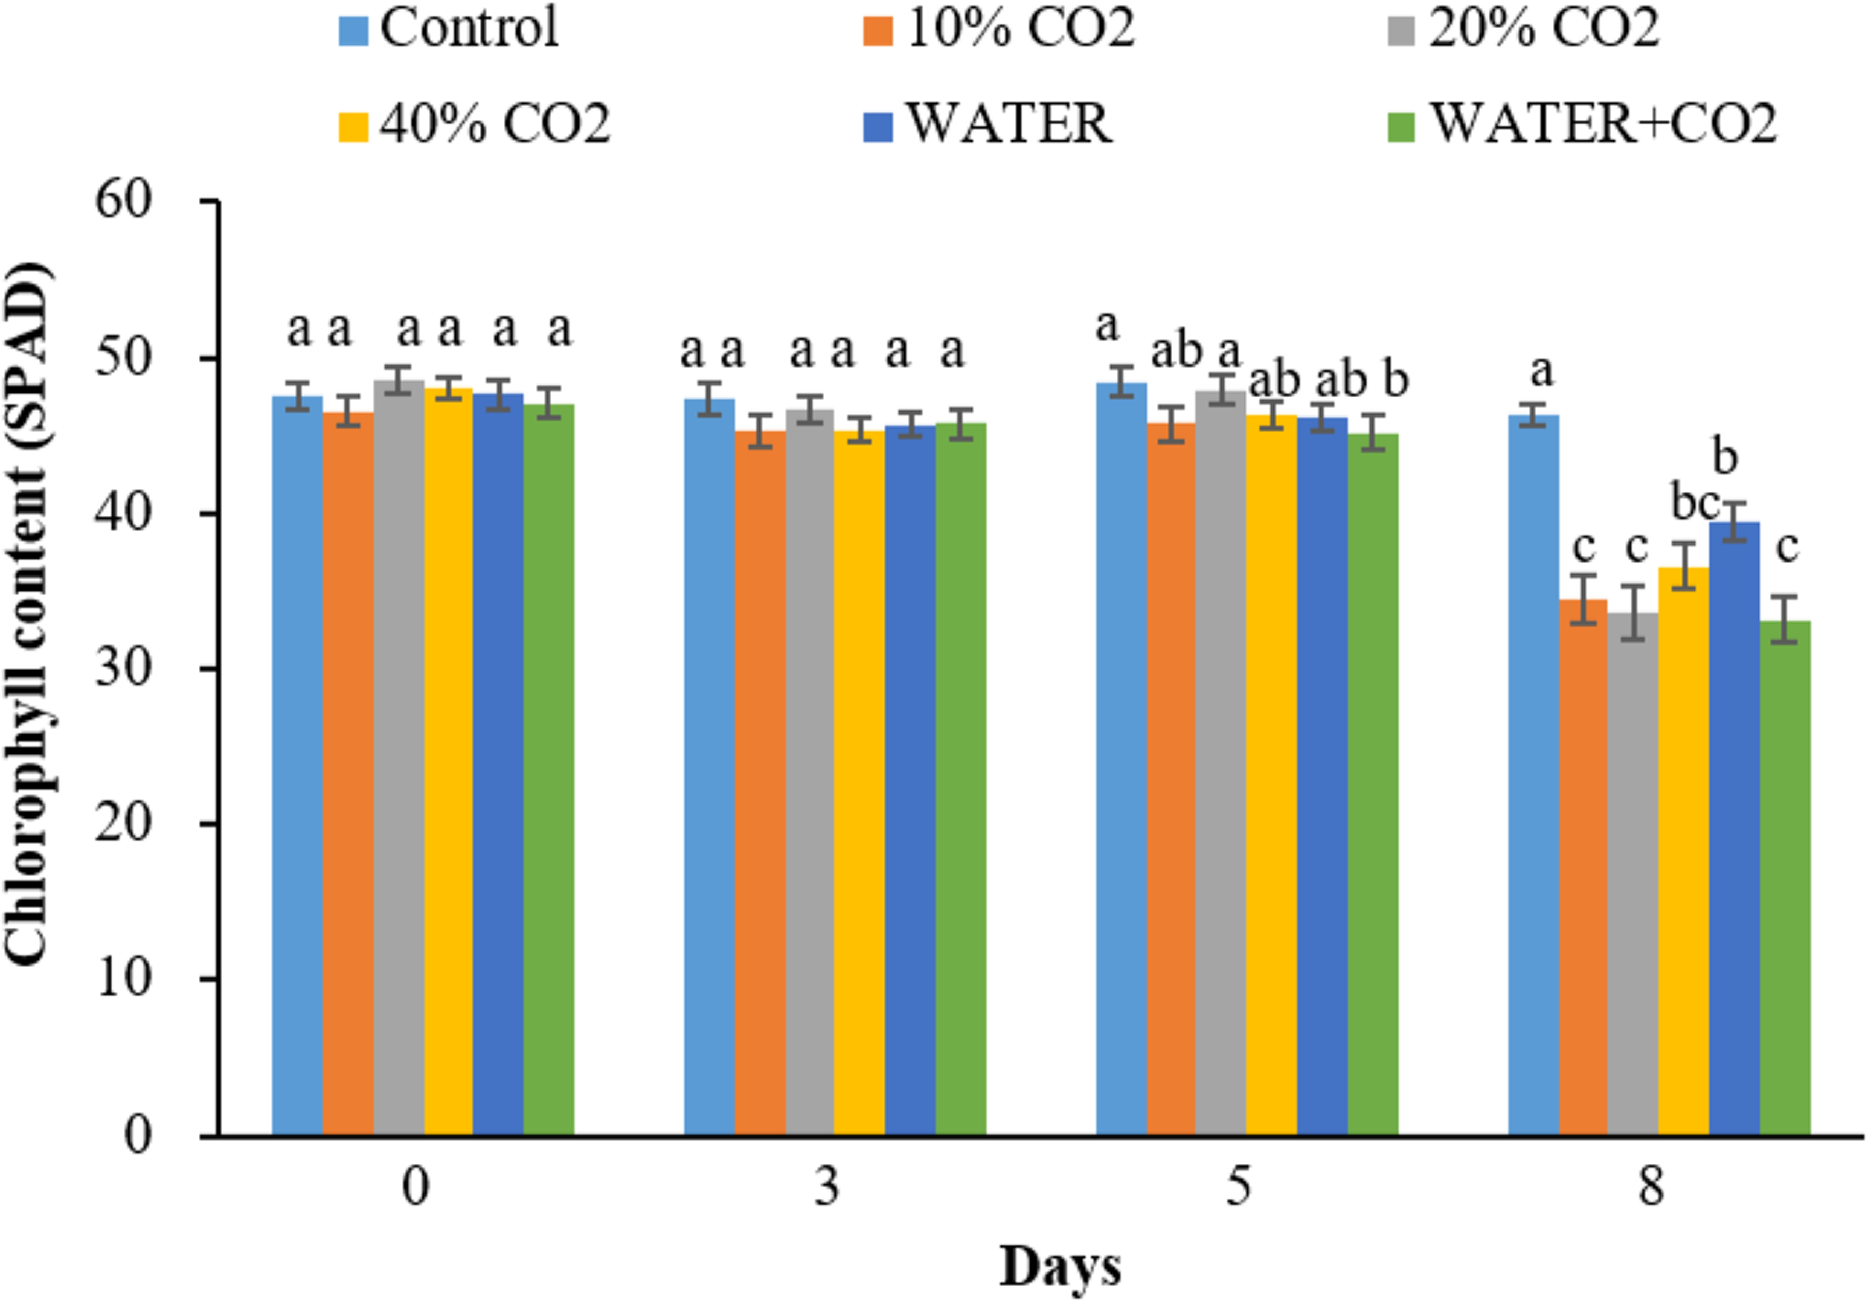
As hypothesized, the responses of photosynthetic parameters (Pn, Gs, and Tr) to the elevated soil CO2 concentration were earlier than the changes in reflectance parameters and chlorophyl content. The changes in all the CO2 treatments were first observed on day 3 compared to those in the control, and the significant difference continued until the end of injection (Fig. 5; Table 5). The recovery of Pn, Gs, and Tr in 10% CO2 treatment from day 5 might be related to the plant compensation effects to the stress (Lake et al., 2016b; He et al., 2019a, 2019b). However, the overall lower values in the CO2 treatments than control indicated that CO2 leakage had adverse effects on the overall photosynthetic processes, which was consistent with the observations of Zhang et al. (2016). They reported that Pn, Gs, and Tr decreased after 4 days of CO2 leakage. According to Lake et al. (2016b), elevated soil CO2 concentration inhibits root water uptake and triggers the excretion of abscisic acid to close stomata, which instantly affects leaf photosynthesis and transpiration. Similar effects of elevated soil CO2 on roots and leaves were also reported by He et al. (2019b).
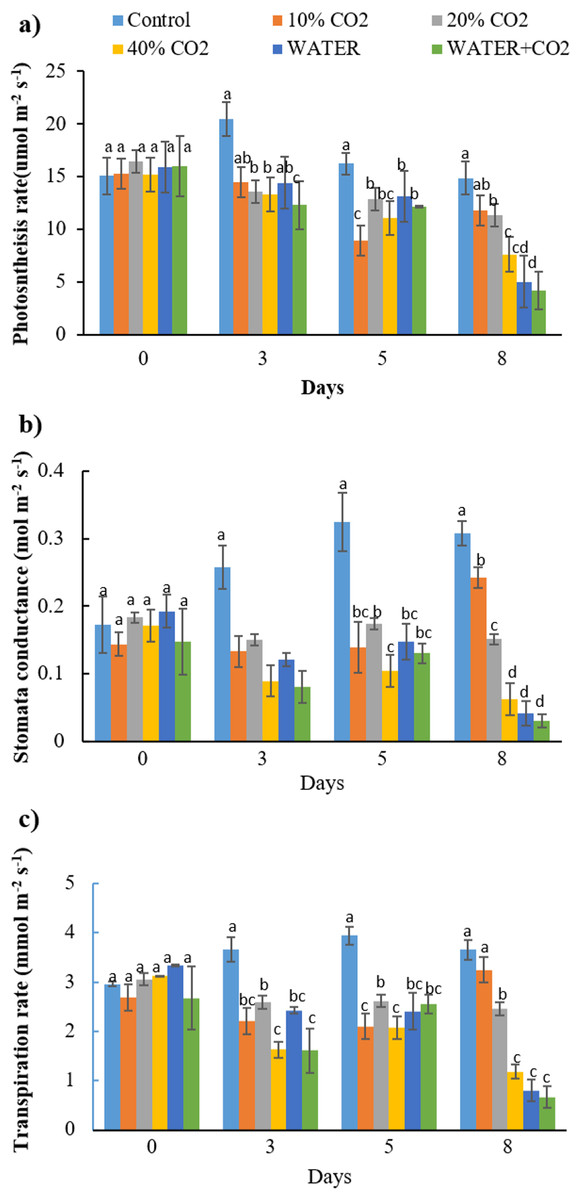
Figure 5: The changes of photosynthesis rate (A), stomata conductance (B), and transpiration rate (C) in each treatment (PAR = 1,000 μmol m−2 s−1).
The ambient CO2 concentration (400 ppm) was used during the measurement. Vertical lines represent the standard error (n = 3) and values for the same date with the same letter are not significantly different at a 5% significance level.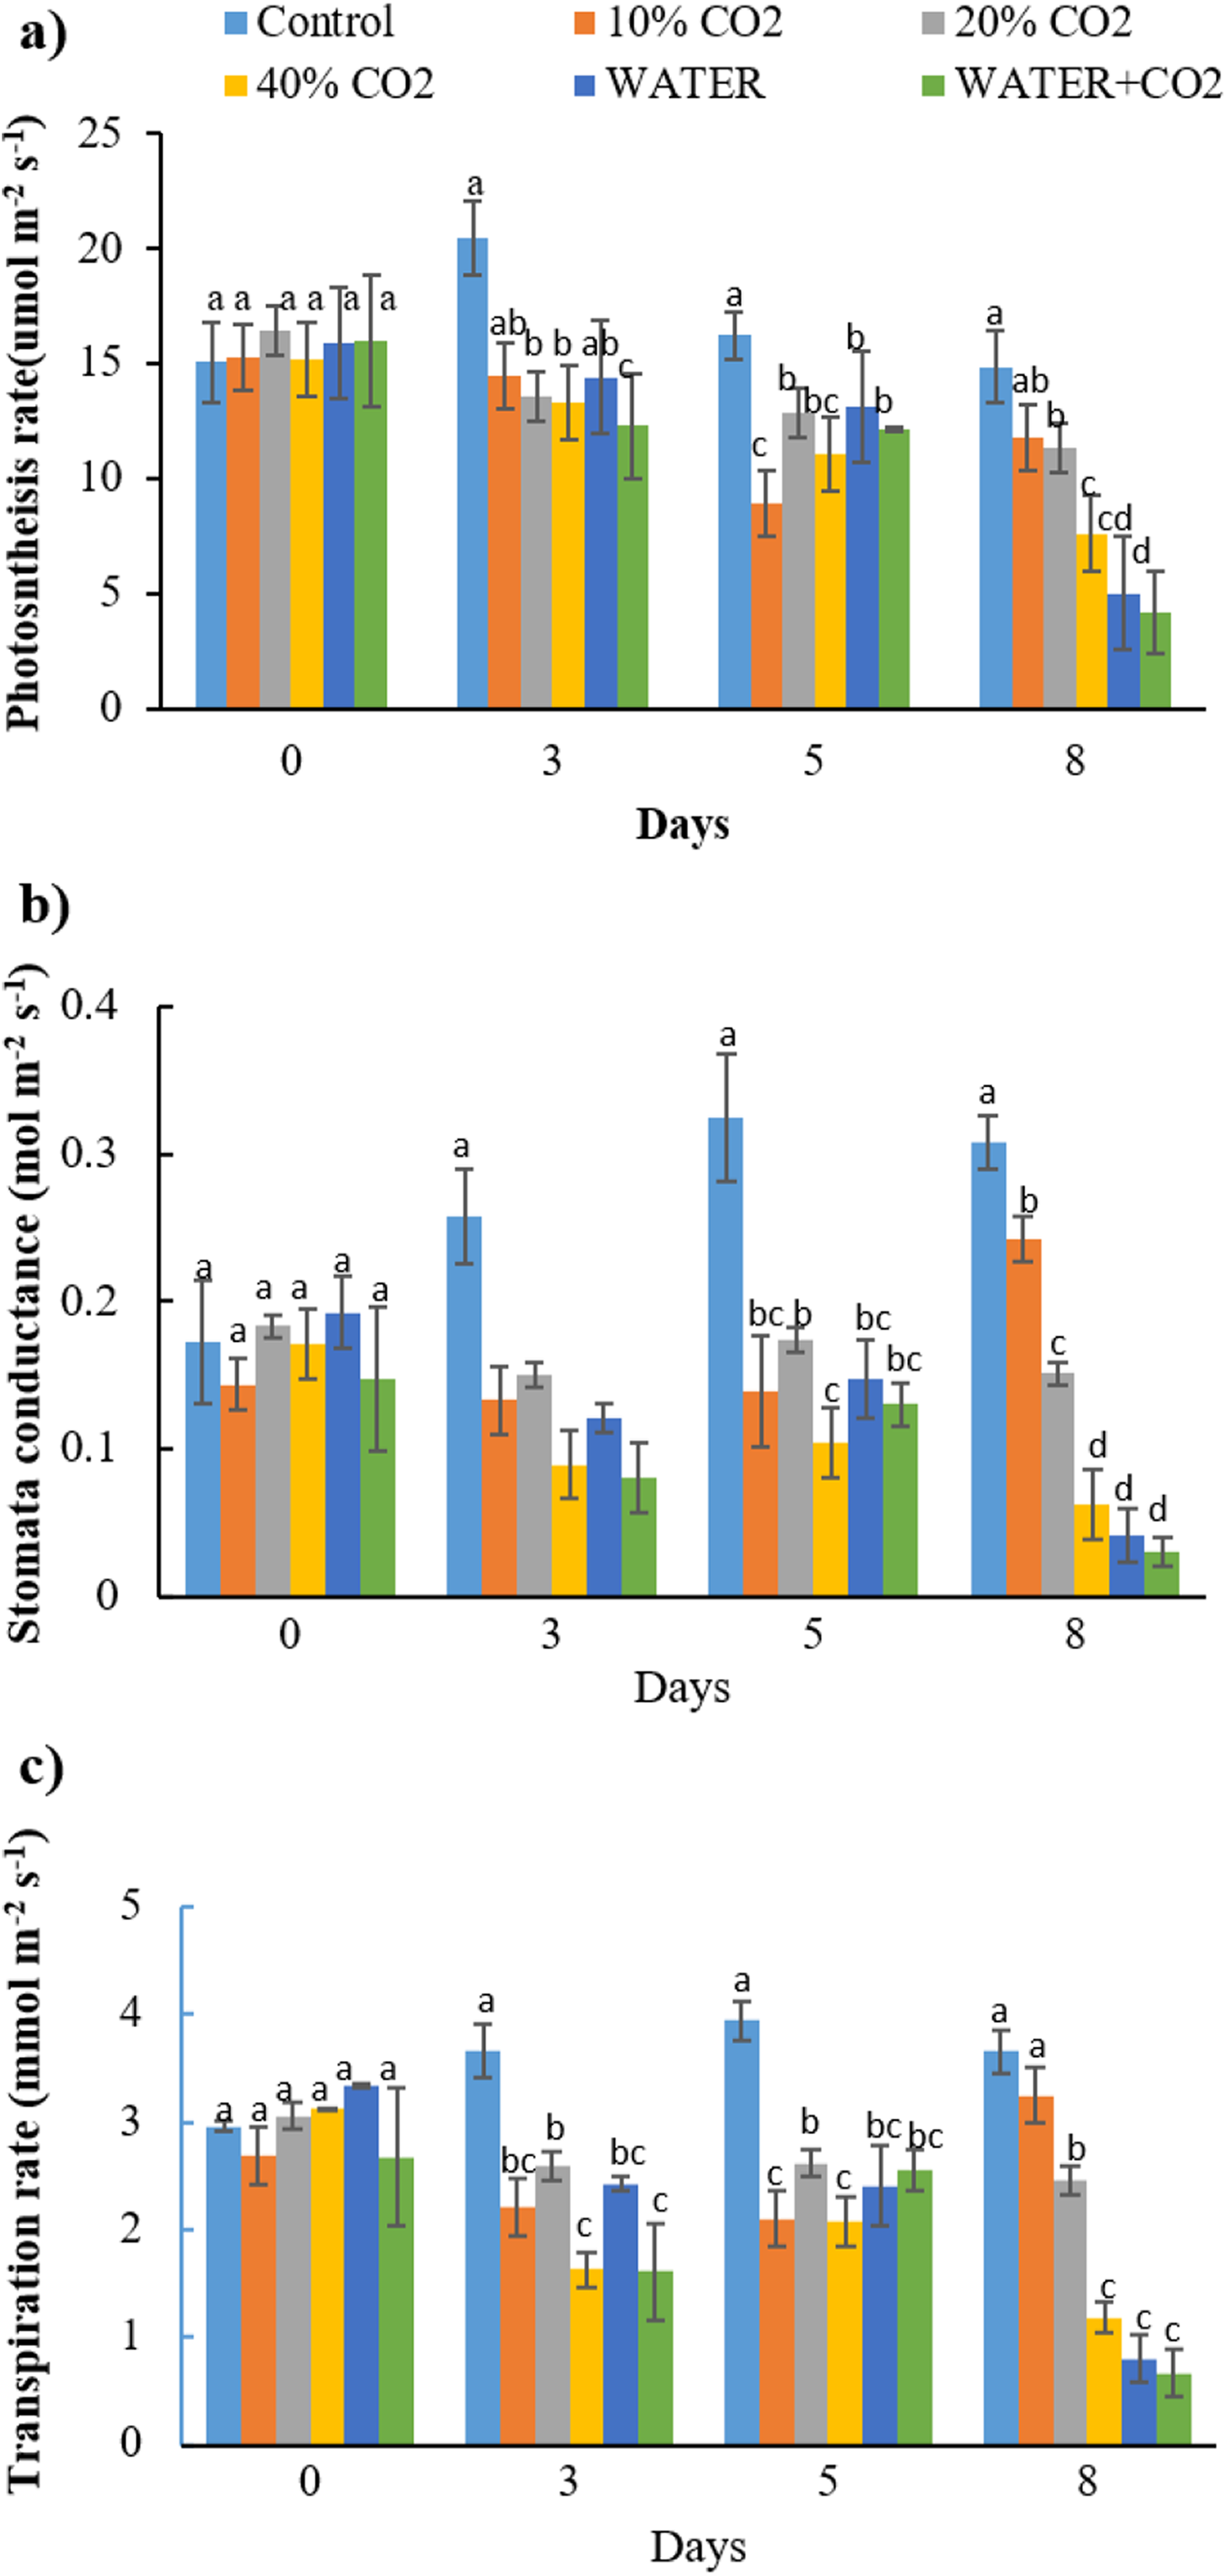
| Source | Treatment | Date | Date × treatment |
|---|---|---|---|
| NDVI | <0.0001 | <0.0001 | <0.0001 |
| EVI | <0.0001 | <0.0001 | <0.0001 |
| PRI | <0.0001 | <0.0001 | <0.0001 |
| NDWI | 0.3882 | 0.0009 | 0.0002 |
| mNDWI | 0.2987 | 0.0007 | 0.0003 |
| Chlorophyll content | <0.0001 | <0.0001 | <0.0001 |
| Pn | 0.0001 | <0.0001 | 0.0401 |
| Gs | <0.0001 | 0.1108 | 0.0002 |
| Tr | <0.0001 | 0.0003 | 0.0001 |
| Y(II) | <0.0001 | <0.0001 | <0.0001 |
| Biomass | 0.2726 | – | – |
Consistent with the photosynthetic process parameters, fluorescence parameters also showed early changes during the CO2 treatments (Figs. 5 and 6). On day 3, Y(II) in the 20% and 40% CO2 treatments were significantly lower than those in the control (Fig. 6). We consider Y(II) to be more sensitive than Pn, Gs, and Tr in detecting different levels of CO2 leakage because Y(II) differentiated 10% and 20% CO2 treatments on day 3, whereas Pn, Gs, and Tr did not.
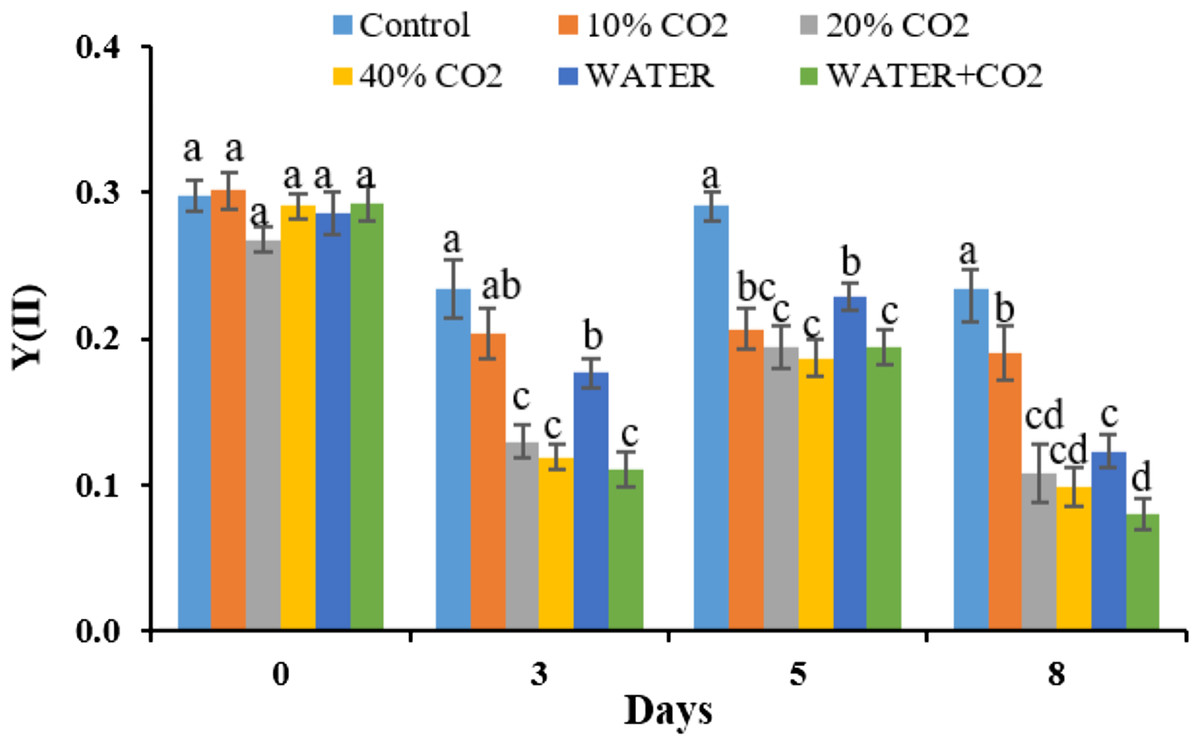
Figure 6: The changes of fluorescence parameters of Y(II) in each treatment (PAR = 1,000 μmol m−2 s−1).
Vertical lines represent the standard error (n = 6), and values for the same date with the same letter are not significantly different at a 5% significance level.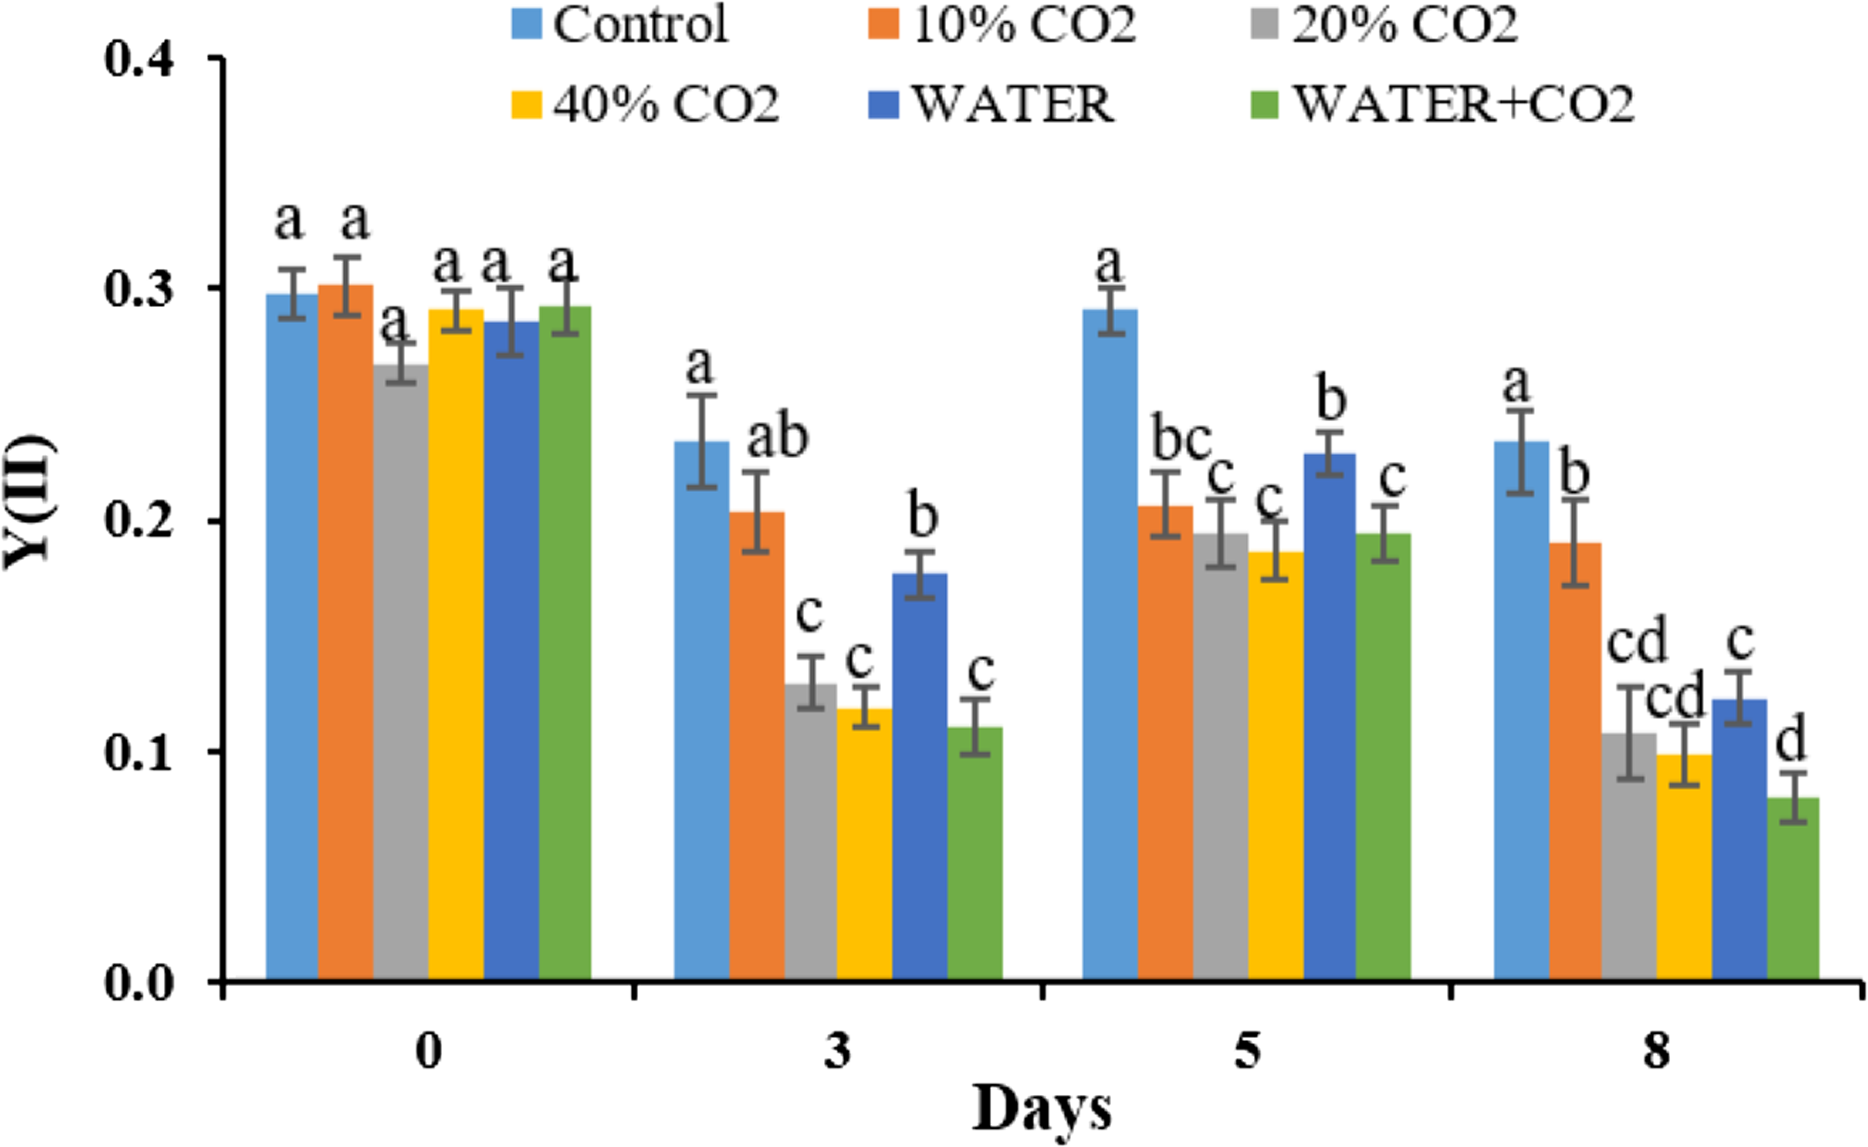
As expected, biomass did not change between the CO2 treatments and the control during this short-term incubation period. This indicates that the biomass is not helpful for early leakage detection and monitoring (Fig. 7). Consistent with our results, Kim et al. (2017) also reported no change in biomass after 10 days of 70% soil CO2 exposure.
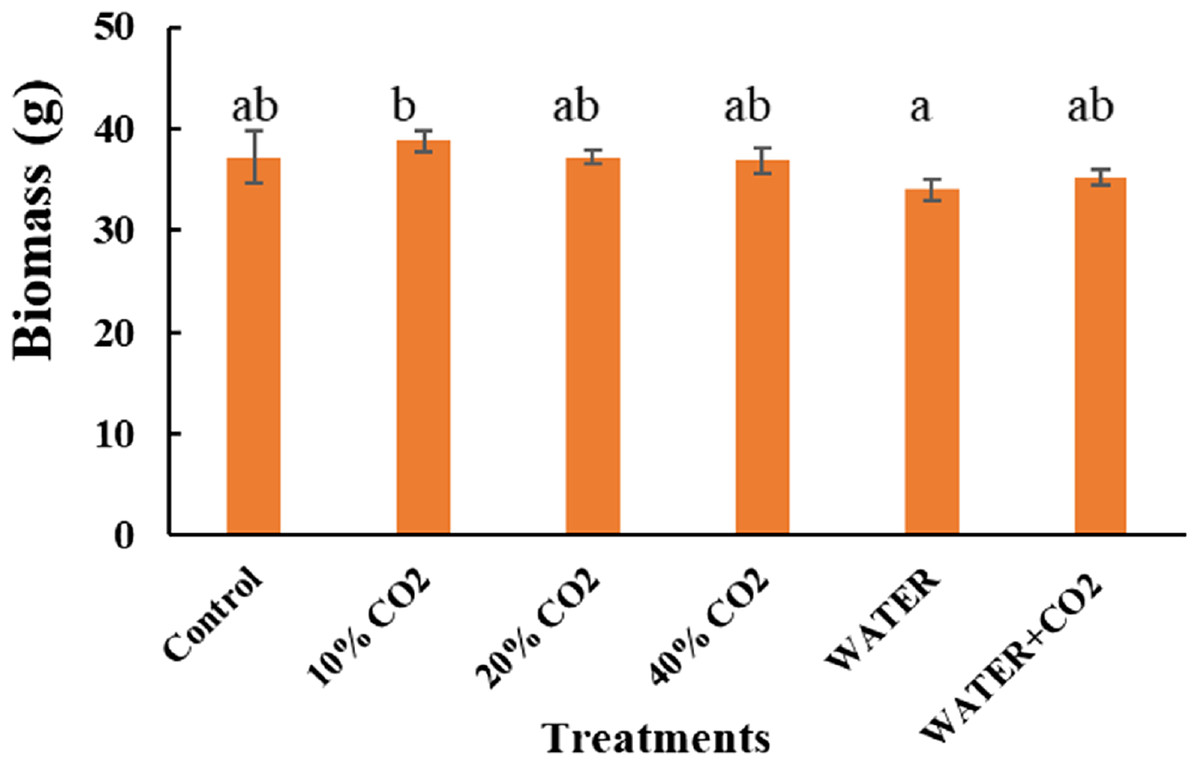
Figure 7: Plant biomass after injection stopped.
Vertical lines represent the standard error (n = 3), and values for the same date with the same letter are not significantly different at a 5% significance level.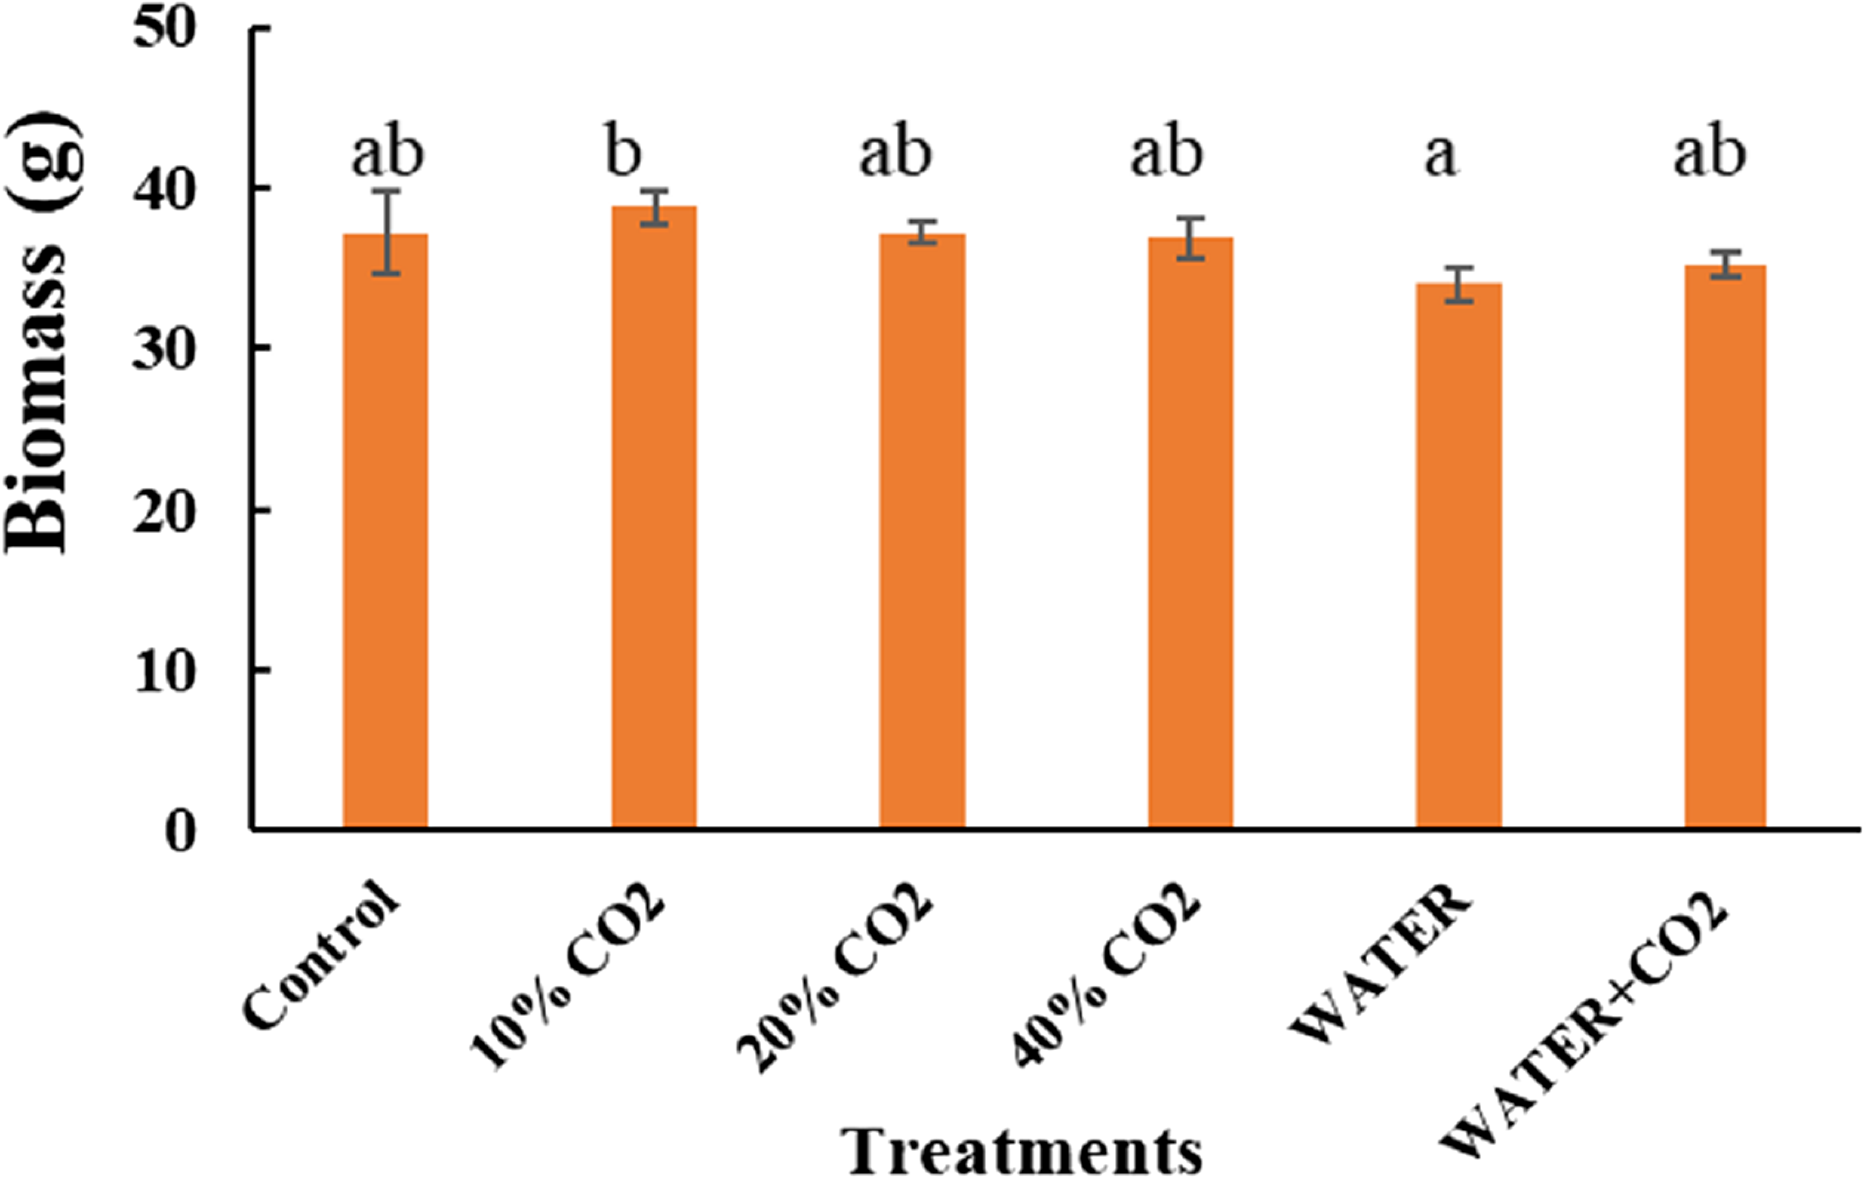
Synthesizing the timing of the changes in all the parameters by CO2 treatments, the earliest responding parameters were Pn, Gs, Tr, and Y(II) (Figs. 5 and 6). Compared to reflectance parameters (NDVI, EVI, and PRI) and chlorophyl content, which initially differentiated control and 40% CO2 treatment on days 5 and 8 (Figs. 3 and 4), respectively, the Pn, Gs, Tr, and Y(II) were 2–5 days earlier. Our results are consistent with those of Lake et al. (2016b) and Zhang et al. (2016), who reported that the effects of elevated soil CO2 concentration on Pn, Gs, and Tr appeared within 4 days, which was earlier than that in chlorophyl content, observed within 7–15 days (Lakkaraju et al., 2010; Smith et al., 2017; He et al., 2019a, 2019b). As our experiment was the first to test the possibility of using fluorescence parameters to detect CO2 leakage, there is no reference with which to compare our results. However, Rossini et al. (2015) reported that the effect of herbicide on chlorophyl fluorescence parameters was earlier than that on NDVI. In summary, we suggest that Pn, Gs, Tr, and Y(II) are early indicators of CO2 leakage monitoring.
CO2 specific parameters for differentiation of CO2 and water stresses
In the WATER treatment, the parameters of chlorophyl content, Pn, Gs, Tr, and Y(II) were significantly lower than those in the control from day 3 to day 8 (Figs. 4–6; Table 5), indicating that these parameters can be used as indicators for detecting water stress. These results of chlorophyl content, Pn, Gs, and Tr (Figs. 4 and 5) are consistent with previous observations that water stress would lead to leaf stomata closure and restrict CO2 diffusion into the chloroplast to affect photosynthesis (Kozlowsk, 1972). The Y(II) were also reported that can differentiate plants in moderate or excessive drought stresses from those in non-stressed conditions (Li et al., 2013; Guo & Tan, 2015; Xavier et al., 2017). Unexpectedly, leaf-level measured NDWI and mNDWI (within the water-absorption bands) failed to detect water stress (Fig. 3). This result is inconsistent with the findings of Male et al. (2010) that canopy-level measured NDWI observed leaf water content reduction in a pasture field after the long, hot summer. Compared to Male et al. (2010), we treated broadleaf plants with mild water stress over a short period (10 days). Ling et al. (2019) reported that the leaf-level spectral measurement may be affected by the stress status and plant species due to different leaf structures, age, and front or back sides of leaves. Hence, we argue that NDWI and mNDWI may not detect short-term mild water stress in plants.
The negative effects of water stress on plant chlorophyl content, Pn, Gs, Tr, and Y(II) could be similar to those of CO2 stress, at least in the initial stage, because the mechanism how underground CO2 influence plant is related to plants’ root water absorption. He et al. (2019b) reported that high soil CO2 could reduce root water absorption activity inducing leaf chlorophyl reduction. Lake et al. (2016b) explained the mechanism of how high soil CO2 influence plant photosynthesis. The similarity between water and CO2 stresses in early stage of exposure makes CO2 leakage monitoring using plant more difficult in the field. The Y(II), differentiated WATER from 40% CO2, and WATER from WATER+ CO2 (Fig. 6). This verifies that chlorophyl fluorescence would be very helpful in distinguishing plants living in the CO2 leakage area, which also suffered from water stress. Although chlorophyl content did not differentiate WATER from 40% CO2 and WATER from WATER + CO2, it differentiated 40% CO2 from WATER treatments. This still implies that this would be useful in distinguishing water stress from extreme CO2 stress in the field. On the other hand, the parameters of Pn, Gs, Tr had significant differences between any CO2 treatment (≥10%) and WATER treatment (Fig. 5), which indicates that they could differentiate the effects of mild CO2 leakage from water stress.
Field applicability and cost of the parameters
The field applicability of each parameter varied (Table 6). The fluorescence parameters of Y(II) and reflectance parameters of NDVI, EVI, PRI NDWI, and mNDWI had high field applicability because they can automatically and continuously monitor plant conditions without destruction (Delegido et al., 2011; Gautam et al., 2015; Janka et al., 2015) (Table 6). In particular, the reflectance parameters were remotely measurable in the artificial gassing sites by installing sensors on unmanned aerial vehicles (Male et al., 2010; Feitz et al., 2014). The photosynthetic parameters of Pn, Gs, and Tr and transmittance parameters of chlorophyll content had limited field applicability because these parameters were only measured at the leaf level, although the measurements would not destroy plants (Wu et al., 2014; Kim et al., 2017). Finally, biomass measurement destroyed plants and could not be remotely, automatically, and continuously detected, which had the lowest field applicability (He et al., 2016) (Table 6).
| Parameters | Measurement principles | Measurement devices | Nondestructive | Remotely detectable | Automatic monitor | Continuous monitor | References |
|---|---|---|---|---|---|---|---|
| NDVI | Reflectance | Spectrometer | Y | Y | Y | Y | Cheng et al. (2009), Delegido et al. (2011), Gautam et al. (2015), Kim et al. (2019), Male et al. (2010), Penuelas et al. (1997), Ryu et al. (2014); https://handheld.psi.cz; https://www.oceaninsight.com; http://en.li-ca.com |
| EVI | |||||||
| PRI | |||||||
| NDWI | |||||||
| mNDWI | |||||||
| Chlorophyll content | Transmittance | Photodiode detector | Y | N | N | N | Süß et al. (2015), https://www.specmeters.com, https://www.konicaminolta.com |
| Pn | Absorption of infrared radiation | Infrared gas analyzer | Y | N | N | N | Paul et al. (2017), Spangler et al. (2009), https://licor.co.za |
| Gs | |||||||
| Tr | |||||||
| Y(II) | Fluorescence emission | Fluorometer | Y | N | Y | Y | Janka et al. (2015), Porcar-Castell et al. (2008), Rossini et al. (2015), https://www.walz.com; https://fluorometers.psi.cz; https://www.hansatech-instruments.com |
| Biomass | Biomass | Oven and scale | N | N | N | N | He et al. (2016), https://www.thermofisher.com |
Although the range of the device prices is large and there could be cheap sensors that are not commercially manufactured, we took the median price for simplicity (the median value between the lowest and highest prices) to evaluate and compare the cost of sensors. Based on our evaluation standards (Table 3), the parameters with low device cost were chlorophyl content and biomass because their median device prices were <$5,000 (Table 7) (https://www.specmeters.com; https://www.konicaminolta.com). The parameters of NDVI, EVI, PRI, NDWI, mNDWI, and Y(II) had medium device cost because the median price of the spectrometer and fluorometer was approximately $26,000 (i.e., ranged from $1,000 to $50,000) and $23,000 (i.e., ranged from $6,000 to $40,000), respectively (Table 7) (https://www.walz.com; https://fluorometers.psi.cz; https://www.hansatech-instruments.com; https://handheld.psi.cz; https://www.oceaninsight.com; http://en.li-ca.com). Finally, the parameters with high device cost were Pn, Gs, and Tr because the price LI-6400 or LI-6800 generally ranged between $40,000 and $60,000 (Table 7) (https://licor.co.za).
| Parameters | Devices | Median device cost ($) | Time cost for sampling and data process (min/sample) | Average cost of device and time |
|---|---|---|---|---|
| NDVI | Spectrometer | Medium* | Medium** | Medium*** |
| EVI | ||||
| PRI | ||||
| NDWI | ||||
| mNDWI | ||||
| Chlorophyll content | Chlorophyll meter | Low | Low | Low |
| Pn | LI-6400/6800 | High | High | High |
| Gs | ||||
| Tr | ||||
| Y(II) | Fluorometer | Medium | Medium | Medium |
| Biomass | Oven | Low | High | Medium |
The parameter with low time cost was chlorophyl content because the total time for sampling and data processing ranged from a few seconds to 1 min (Table 7). The parameters with medium time cost were NDVI, EVI, PRI, NDWI, mNDWI, and Y(II). Their sampling times ranged from 10 s to 5 min (depending on sensor setup and user skills), and those of data processing time ranged from 3 min to 10 min (including MATLAB code writing) (Table 7). Finally, the parameters of Pn, Gs, and Tr and biomass had a high time cost due to the long sampling time (>20 min) (Table 7). After averaging the cost of device and time for each parameter, we can suggest chlorophyl content as a low-cost parameter for leakage monitoring (Table 7).
Indicator evaluation score of parameters and their applications
As our four criteria have equal importance, we did not give different weightings on them and we treated four criteria equal in mathematical way. So, the highest score means the best parameter. However, we did not only focus on the best score because we realize that the second or third best choices could also be useful in certain circumstances. Hence, we keep the scores of four criteria in the Table 8 and let users decide which would be the best choice of theirs depending on the conditions.
| Parameters | Early detection | CO2 specificity | Field applicability | Cost | IES |
|---|---|---|---|---|---|
| Y(II) | 4 | 5 | 4 | 3 | 16 |
| NDVI | 2 | 5 | 5 | 3 | 15 |
| EVI | 2 | 5 | 5 | 3 | 15 |
| PRI | 2 | 5 | 5 | 3 | 15 |
| NDWI | 1 | 1 | 5 | 3 | 10 |
| mNDWI | 1 | 1 | 5 | 3 | 10 |
| Pn | 4 | 2 | 2 | 1 | 9 |
| Gs | 4 | 2 | 2 | 1 | 9 |
| Tr | 4 | 2 | 2 | 1 | 9 |
| Chlorophyll content | 3 | 4 | 2 | 5 | 14 |
| Biomass | 1 | 1 | 1 | 3 | 6 |
The fluorescence parameters of Y(II) had the highest IES values (Table 8), which suggests that it is the most efficient parameters. They had high scores in the criteria of early detection, CO2 specificity, and field applicability, although the cost of measurement is considered to be medium (Table 8). Murchie & Lawson (2013) also suggested Y (II) as a useful indicator for field monitoring because it shows a rapid response to environmental stresses. Furthermore, the measurement of Y(II) does not require waiting for dark adaptation of plants, and thus has a fast detection. The second-highest IES values were the reflectance parameters of NDVI, EVI, and PRI (Table 8), which were still useful for CO2 leakage monitoring. NDVI, EVI, and PRI had the highest score in field applicability and have been successfully applied in field detection (Male et al., 2010; Wimmer et al., 2011; Feitz et al., 2014). The third-highest IES was the SPAD-measured chlorophyl content, which has the major advantage of low cost; however, it has limited applicability to the laboratory or greenhouse (Table 8). The photosynthetic parameters of Pn, Gs, and Tr and reflectance parameters of NDWI and mNDWI had relatively low IES values (Table 8); therefore, they were less efficient for CO2 leakage monitoring. Although Pn, Gs, and Tr were able to detect CO2 leakage early, they did not differentiate CO2 stress from other stresses. Moreover, the measurement can only be done at the leaf level, and the time and labor of measurement are not cost-effective. Compared to the photosynthetic parameters, NDWI and mNDWI can be applied to the field scale because they can cover large area of canopy by loading the sensor on the unmanned vehicles or drone. However, their ability to detect early leakage and accurately differentiate CO2 stress was minimal. Finally, biomass had the lowest IES value, which indicates that it is not suitable for CO2 leakage monitoring because it had the lowest scores in all the criteria except cost (Table 8).
Conclusion
In this study, we tested the possibility of using fluorescence parameters as a proper plant indicator to detect CO2 leakage. To the best of our knowledge, this is the first study to suggest chlorophyl fluorescence parameter as a useful plant indicator in CCS sites. This parameter was made convenient by the advanced fluorometer of MONI-PAM, which can detect fluorescence without dark adaptation. The Y(II) detected the treatment effect of soil at 10–40% CO2 concentrations early and differentiated CO2 and water stresses, establishing them as early and CO2 specific parameters for leakage monitoring.
The IES method developed to compare the ability and applicability of plant parameters for CO2 leakage monitoring, was sufficiently systematic to be used as a guideline for environmental management in CCS sites. Following the IES results, we suggest that the chlorophyl fluorescence parameters of Y(II) is the most efficient indicators for detecting CO2 leakage in the field. Although the reflectance parameters of NDVI, EVI, and PRI did not detect CO2 leakage early, they are still useful for the large-area monitoring of CO2 leakage points in CCS sites. The photosynthetic parameters and chlorophyl content were found to be unsuitable for field monitoring, but useful to measure the early response of plants to CO2 leakage in small-scale studies.
Supplemental Information
The data of leaf chlorophyl content, photosynthesis and fluorescence of each treatment measured during experimental period.
Give data show raw value of leaf chlorophyl content, photosynthesis and fluorescence measured by sensors. The treatments included control, 10% CO2 (10% soil CO2), 20% CO2 (20% soil CO2), 40% CO2 (40% soil CO2), water stress (WATER) and water stress with 40% CO2 treatment (WATER + CO2). The measuring date was October 10, 13, 15, and 18 (i.e., 0, 3, 5, and 8 days after experiment onset, respectively), 2018.
The leaf spectral reflectance data of each treatment measured during experimental period.
Give data show raw value of leaf spectral reflectance values measured by sensors. The treatments included control, 10% CO2 (10% soil CO2), 20% CO2 (20% soil CO2), 40% CO2 (40% soil CO2), water stress (WATER) and water stress with 40% CO2 treatment (WATER + CO2). The measuring date was October 10, 13, 15, and 18 (i.e., 0, 3, 5, and 8 days after experiment onset, respectively), 2018.