
Responses of branching reef corals Acropora digitifera and Montipora digitata to elevated temperature and pCO2
- Published
- Accepted
- Received
- Academic Editor
- Robert Toonen
- Subject Areas
- Conservation Biology, Marine Biology, Zoology, Climate Change Biology
- Keywords
- Ocean acidification, Ocean warming, Corals, Calcification rate, Endosymbiont species
- Copyright
- © 2020 Manullang et al.
- Licence
- This is an open access article distributed under the terms of the Creative Commons Attribution License, which permits unrestricted use, distribution, reproduction and adaptation in any medium and for any purpose provided that it is properly attributed. For attribution, the original author(s), title, publication source (PeerJ) and either DOI or URL of the article must be cited.
- Cite this article
- 2020. Responses of branching reef corals Acropora digitifera and Montipora digitata to elevated temperature and pCO2. PeerJ 8:e10562 https://doi.org/10.7717/peerj.10562
Abstract
Anthropogenic emission of CO2 into the atmosphere has been increasing exponentially, causing ocean acidification (OA) and ocean warming (OW). The “business-as-usual” scenario predicts that the atmospheric concentration of CO2 may exceed 1,000 µatm and seawater temperature may increase by up to 3 °C by the end of the 21st century. Increases in OA and OW may negatively affect the growth and survival of reef corals. In the present study, we separately examined the effects of OW and OA on the corals Acropora digitifera and Montipora digitata, which are dominant coral species occurring along the Ryukyu Archipelago, Japan, at three temperatures (28 °C, 30 °C, and 32 °C) and following four pCO2 treatments (400, 600, 800, and 1,000 µatm) in aquarium experiments. In the OW experiment, the calcification rate (p = 0.02), endosymbiont density, and maximum photosynthetic efficiency (Fv/Fm) (both p < 0.0001) decreased significantly at the highest temperature (32 °C) compared to those at the lower temperatures (28 °C and 30 °C) in both species. In the OA experiment, the calcification rate decreased significantly as pCO2 increased (p < 0.0001), whereas endosymbiont density, chlorophyll content, and Fv/Fm were not affected. The calcification rate of A. digitifera showed greater decreases from 30 °C to 32 °C than that of M. digitata. The calcification of the two species responded differently to OW and OA. These results suggest that A. digitifera is more sensitive to OW than M. digitata, whereas M. digitata is more sensitive to OA. Thus, differences in the sensitivity of the two coral species to OW and OA might be attributed to differences in the endosymbiont species and high calcification rates, respectively.
Introduction
The rise in atmospheric CO2 concentration due to anthropogenic emissions is causing ocean warming (OW) and ocean acidification (OA). Atmospheric CO2 levels are predicted to increase from 400 to 1,000 µatm, and the global mean sea surface temperature is expected to increase by up to 3 °C and surface ocean pH to decrease by 0.3 units relative to 1986–2005 by the end of the 21st century under the “business as usual” emissions scenario (IPCC et al., in press).
Corals are the dominant marine calcifiers in coral reefs and play important roles in supporting coral reef ecosystems (Knowlton, 2001; Wild et al., 2004). Some studies have shown that the calcification rate of corals has declined because of OW in the last few decades (Cooper et al., 2008; Tanzil et al., 2009; Cantin et al., 2010). The optimal temperature for the growth and calcification of corals is generally close to the maximum summer temperature in ordinary years at a given reef (reviewed by Pratchett et al. (2015). When the temperature rises to 1 °C above the local summer maxima, the mutualistic relationship between the host coral and its symbiotic algae (unicellular algae of the family Symbiodiniaceae (LaJeunesse et al., 2018) or endosymbionts) is disrupted, with host corals losing their endosymbionts and becoming bleached (Glynn & D’croz, 1990; Glynn, 1996). OW suppresses the calcification of reef-building corals by affecting their endosymbionts (Glynn, 1996; De’ath, Lough & Fabricius, 2009), although moderate increases in seawater temperature facilitate coral calcification (Inoue et al., 2012). The endosymbionts provide energy to the host coral through photosynthesis (Muscatine, McCloskey & Marian, 1981). As the temperature rises above the bleaching threshold, endosymbiont density and photosynthesis decline (Jones et al., 1998), reducing the availability of the algal-derived photosynthate that fuels coral calcification (Al-Horani, Al-Moghrabi & De Beer, 2003). The optimal temperature for coral calcification may vary according to the temperature regime and location of the reefs (Marshall & Clode, 2004). Generally, maximum skeletal growth has been found to occur at a normal seawater temperature during the warm season at individual locations, and skeletal growth rates begin decreasing when the sea surface temperature rises above these temperatures (Jokiel & Coles, 1977; Coles & Jokiel, 1978; Marshall & Clode, 2004; Pratchett et al., 2015). Acropora cervicornis, from the Caribbean, was also reported to have maximum growth rates when the temperature ranged from 28 °C to 30 °C, and growth rates decreased at both higher and lower temperatures (Shinn, 1966). The calcification rates of Acropora hyacinthus and Acropora muricata decreased by 90% when exposed to temperatures 2.5 °C above the maximum summer temperature in the Great Barrier Reef (Anderson et al., 2019). In the Great Barrier Reef, the calcification rates of massive Porites declined by 11.4% from 1990 to 2005 because of reduced skeletal extension, which linearly correlated with an increase in the sea surface temperature (De’ath, Lough & Fabricius, 2009).
Responses to OW may differ among coral species (Loya et al., 2001; Baird & Marshall, 2002; Bak, Nieuwland & Meesters, 2009; De’ath, Lough & Fabricius, 2009; Grottoli et al., 2018). This might be because of differences in endosymbiont species (Berkelmans & Van Oppen, 2006; Sampayo et al., 2008; LaJeunesse, Pettay & Sampayo, 2010), as different species of endosymbionts have different tolerance levels to heat stress (Fitt & Warner, 1995; Bhagooli & Hidaka, 2003; LaJeunesse et al., 2003; Berkelmans & Van Oppen, 2006; Fitt et al., 2009) or provide different quantities of photosynthate (Anthony et al., 2009; Cantin et al., 2009; Hughes & Grottoli, 2013; Schoepf et al., 2015; Tremblay et al., 2016). Berkelmans & Van Oppen (2006) showed that colonies of Acropora millepora containing different genera of endosymbionts had different heat tolerances on the Great Barrier Reef. Differences in the species of endosymbiont within a genus may also affect the heat tolerance of corals. For example, Fisher, Malme & Dove (2012) reported that coral species hosting a given species of endosymbionts were more susceptible to heat stress compared to those hosting other species in the Great Barrier Reef.
As CO2 in the ocean reacts with seawater, it lowers the pH and shifts the carbonate equilibria, decreasing the carbonate ion concentration and lowering the calcium carbonate saturation state or Ω (Millero, 1995; Caldeira & Wickett, 2003; Sabine et al., 2004; Feely, Doney & Cooley, 2009). Decreasing Ω in seawater may not directly affect coral calcification because calcification occurs in calcifying fluid isolated from ambient seawater (Cyronak, Schulz & Jokiel, 2016). OA may reduce the calcification of corals by affecting the physiology of the endosymbionts and host corals (Hoegh-Guldberg et al., 2007; Anthony et al., 2008; Anthony, Kleypas & Gattuso, 2011; Pandolfi et al., 2011; Crook et al., 2012; Iguchi et al., 2012; Albright et al., 2016). A decrease in seawater pH due to OA was linked to a slower calcification rate of corals (Cohen et al., 2009; Bates & Amat, 2010; Erez et al., 2011; Cyronak, Schulz & Jokiel, 2016). Some experimental studies showed that increasing the partial pressure of carbon dioxide (pCO2) from 300 (preindustrial concentration) to 560 µatm decreased the coral calcification and growth rate by up to 40% by inhibiting aragonite formation (Kleypas & Langdon, 2006; Dove et al., 2013). The response of coral calcification to OA is considered to occur through the inorganic precipitation of carbonate and biogenic processes such as the production of organic matrices that can affect the morphology of coral skeletons (Yellowlees, Rees & Leggat, 2008; Tambutté et al., 2015).
The sensitivity of coral calcification to OA may also vary among species (Comeau et al., 2014; Hoegh-Guldberg et al., 2018). For example, Comeau et al. (2014) incubated eight coral species in 280, 390, 550, 700, 1,000, and 2,100 µatm pCO2 to compare the taxon-specific sensitivities to OA. They included corals from different functional groups based on colony morphology (massive and branching), skeleton porosity (perforate and imperforate), and calcification rate. They found that fast-calcifying corals tended to be more sensitive to OA than slow-calcifying corals. The high sensitivity of faster-calcifying species to OA treatments may be explained by the large amount of energy required to export high concentrations of hydrogen ions from the calcifying medium and increase the carbonate ion concentration at the site of calcification (Movilla et al., 2012; Comeau et al., 2014). In the present study, we compared the response of two rapidly calcifying species, Acropora digitifera and Montipora digitata, to both OA and OW, which are branching and fast calcifying coral species (Heyward & Collins, 1985; Singh et al., 2019).
In the present study, we separately investigated the effect of OW and OA on the scleractinian corals A. digitifera and M. digitata, which are dominant reef corals in the shallow reefs of the Indo-Pacific, including the Ryukyu Archipelago (Veron, 2000). We predicted that these two species have different tolerances to OW, based on previous studies. Kayanne et al. (2002) reported that after severe heat stress in 1998, the percent cover of branching Montipora and branching Acropora decreased by 66% and 82%, respectively, in the lagoon of the Shiraho Reef, Okinawa, Japan, suggesting that the former was more heat-tolerant than the latter. We hypothesized that A. digitifera was more sensitive to OW than branching M. digitata and that M. digitata was less tolerant to OA than A. digitifera was, as previous studies suggested that corals and mollusks tolerant to OA were adversely affected by OW (Rodolfo-Metalpa et al., 2011; Okazaki, Swart & Langdon, 2013). We tested these hypotheses by conducting aquarium experiments and independently controlling the temperature and pCO2. We assessed the effect of OA and OW by investigating changes in the calcification rate of the corals and the density, chlorophyll content, and photosynthetic efficiency of their endosymbionts.
Materials and Methods
The effects of OW and OA on the reef corals A. digitifera and M. digitata were evaluated in October 2013 and June 2016, respectively, in aquariums at Sesoko Station, Tropical Biosphere Research Center, University of the Ryukyus, Okinawa, Japan (26° 38′N, 127°51′E). The experiments were conducted 3 years apart, and the year lag may have affected the results of the experiments if the composition of the coral populations changed during this period. We considered that coral populations, including the two species, changed only slightly during the period, as severe disturbance to corals, such as heat stress, destructive typhoons, and coral disease, did not occur. The months when we conducted the experiments were also different, i.e., October and June, but we considered that the month difference did not affect the outcomes of the experiment much because the sea surface temperature in Okinawa is similar in these months (https://www.seatemperature.org/asia/japan/naha-shi.htm) and acclimation was properly conducted before the experiments (see below). Branches or colonies of A. digitifera and M. digitata were collected randomly from a shallow (2 m deep at high tide, light intensity of approximately 1,200 µmol m−2 s−1 during the daytime in the summer, and a pH of 8.1) fringing reef in front of Sesoko Station. We collected the corals with permission from the governor of Okinawa Prefecture, Japan (Nos. 25–18 and 28–21).
OW experiment
Fifteen branches each (approximately five cm in length) were collected from 15 different colonies of A. digitifera and M. digitata, which were at least 10 m apart on the fringing reef. The branches were maintained in an outdoor holding tank (2 ×1 × 0.3 m) with a running seawater supply under natural light conditions (300–400 µmol ⋅ m−2 ⋅ s−1 during the daytime in summer) for 5 days to confirm that the colonies were not damaged during collection and transfer. Subsequently, a coral nubbin (approximately two cm in length) was cut from each branch. Each nubbin was attached to plastic bolts (with a hexagon head of one cm each side) using instant glue (jelly-like Aron Alpha gel, Toagosei, Tokyo). The bolt was placed in a pit on a plastic rail. The nubbins were acclimatized in the tank for 2 weeks after fixation to the bolt until the coral tissues began to spread over the bolt head surface.
After acclimation in the outdoor tank, the coral nubbins were moved to 10-L aquariums in an indoor laboratory for the experiment, where running filtered fresh seawater (through a cartridge-type filer, pore size 1 µm) was continuously supplied to each aquarium at a mean rate of 180 mL/min, and the seawater overflowed for water change. We did not feed the corals during the experiment, but the effect of starvation appeared to be small because both species are autotrophic corals with small polyps (Conti-Jerpe et al., 2020). Two replicate aquariums were used for each temperature treatment (i.e., 28 °C, 30 °C, and 32 °C); the mean seawater temperature in the summer season (July and August) at the study site was 29.9 °C ± 0.8 ° C (± SD, N = 1,488) in 2016, when moderate coral bleaching occurred (Singh et al., 2019). All aquariums were maintained at 28 °C from days 1 to 16 after the nubbins were moved to the laboratory. After day 16, each replicate aquarium was allocated as either the control (28 °C), moderate (30 °C), or high (32 °C) temperature treatment. The seawater temperature in the moderate and high temperature treatments was increased by 1 °C per day using a heater (Microsave power heater 75 W; Everest, Osaka, Japan), which was placed in each aquarium and regulated by a temperature controller (Power Thermo ET-308; Kotobuki, Osaka, Japan) until the target temperature was reached, to avoid damaging the nubbins from a rapid increase in temperature. The temperature was increased when the Fv/Fm of each nubbin was not lower than 0.55 to avoid damage to the nubbins from the temperature increase. The nubbins were kept at 28 °C for 28 days in the control; at 28 °C for 16 days, 29 °C for 1 day, and 30 °C for 11 days in the moderate temperature treatment groups; and at 28 °C for 16 days, 29 °C, 30 °C, and 31 °C each for 1 day, and 32 °C for 9 days in the high temperature treatment groups. We exposed the nubbins for only 9 days to 32 °C because this value was close to the lethal temperature for Acropora corals at the study sites (Singh et al., 2019). To maintain a stable water temperature, the aquariums were placed within a larger container (19 × 84 × 120 cm) filled with seawater, and the seawater in the container was cooled by a chiller (ZC-700E; Zensui, Busan, Korea) when necessary. Four or six nubbins of each species were placed in each aquarium. All aquariums were subjected to a 12-h:12-h light:dark photoperiod (light from 0600 to 1,800 h) under metal-halide lamps (Funnel II; Kamihata, Hyogo, Japan) with a light intensity of 150–160 µmol ⋅ m−2 ⋅ s−1 during the light periods. Although the light intensity in the experiment was much lower than that in the natural environment, we considered the light intensity to be acceptable in our experiment because the nubbins of the two species grew positively, as in previous similar experiments (Iguchi et al., 2012; Iguchi et al., 2014; Ohki et al., 2013; Kavousi et al., 2015; Sekizawa et al., 2017). The temperature and light intensity were manually measured every day using a thermometer (CT-450 WR; CUSTOM, Osaka, Japan) and quantum meter (QSL2100; Biospherical Instruments, Inc., San Diego, CA, USA).
OA experiment
Three colonies each of A. digitifera and M. digitata, which were at least 10 m apart, were collected from the reef flat for the pCO2 experiment and treated similarly as the colony fragments used in the OW experiment until 5 days after collection. Next, 32 nubbins (approximately two cm in length) were cut from each donor colony. Each nubbin was attached to a plastic bolt and kept in an outdoor tank for 2 weeks for acclimation, as in the OW experiment.
The experiment was established with a precise pCO2 controlling system (Acidification Impact on CALcifiers System or AICAL; Iguchi et al., 2014). This system measured the pCO2 of the seawater and adjusted the pCO2 by controlling a feedback loop to achieve the desired pCO2 level. The acidified seawater was supplied at four different pCO2 concentrations, i.e., approximately 400 (for the control), 600, 800, and 1,000 µatm, in accordance with the near-future scenarios of the IPCC et al. (in press), with an exchange flow rate of around 150 mL/min. Two 10-L aquariums were prepared for each pCO2 treatment. Eight nubbins each from one donor colony were used in each treatment (a total of 24 nubbins for each species in each treatment), and the nubbins were placed in aquariums with a set pCO2. The temperature in each aquarium was set at 27 °C, which was close to the natural sea surface temperature in Okinawa during the experiment. The experimental period was 30 days. The seawater temperature was recorded hourly by temperature loggers (HOBO Pendant® Temperature/Light 64K Data Logger, Cape Cod, MA, USA). The daily mean temperature in each aquarium and mean temperature during the experiment were calculated from the daily means for each treatment. The light source and photoperiod were the same as those in the OW experiment. The light intensity was 110–140 µmol ⋅ m−2 ⋅ s−1 mol during the light period in the OA experiment, which was lower than in the OW experiment, but we considered the light intensity to be acceptable because the nubbins of the two species grew positively, as in previous similar experiments (Iguchi et al., 2012; Iguchi et al., 2014; Ohki et al., 2013; Kavousi et al., 2015; Sekizawa et al., 2017). The pCO2 in the aquarium was measured every day, and the total alkalinity (TA) and salinity were measured once every 6 days following the method by Sekizawa et al. (2017) as follows. Seawater samples (100 mL) were collected from each tank and fixed by immediately adding a saturated solution of HgCl2. The TA in the sample was determined in aliquots of 50 mL using the potentiometric acid titration method with an automated burette (Model ABU91; Radiometer, Copenhagen, Denmark) at 25 °C (Kawahata et al., 2000). Primary standardization of the instrument was performed using reference material solutions prepared by Kanso Technos Co. Ltd. (Osaka, Japan) using a procedure similar to that of the Certified Reference Material (CRM) preparation (Dickson, Afghan & Anderson, 2003). pH, bicarbonate ion concentration [HCO3−], carbonate ion [CO32−], CO2, and aragonite saturation (Ωarag) were calculated from pCO2, temperature, TA, and salinity using the CO2SYS program (Lewis & Wallace, 1998). The chemical and physical conditions of each treatment are summarized in Table 1.
| Targeted pCO2 | pCO2 (µatm) | Temperature (0C) | pHT | HCO−3 (µmol/kg) | CO32− (µmol/kg) | Ωarg | ΩCa |
|---|---|---|---|---|---|---|---|
| 400 µatm | 389 ± 22 (30) | 27.5 ± 0.5 (30) | 8.10 (30) | 1,728 ± 16 (5) | 216 ± 5 (5) | 3.5 ± 0.1 (5) | 5.3 ± 0.1 (5) |
| 600 µatm | 600 ± 35 (30) | 27.4 ± 0.6 (30) | 7.87 (30) | 1,847 ± 18 (5) | 164 ± 3 (5) | 2.7 ± 0.1 (5) | 3.9 ± 0.1 (5) |
| 800 µatm | 804 ± 43 (30) | 27.4 ± 0.6 (30) | 7.77 (30) | 1,934 ± 11 (5) | 135 ± 2 (5) | 2.2 ± 0.0 (5) | 3.3 ± 0.0 (5) |
| 1,000 µatm | 1,006 ± 55 (30) | 27.2 ± 0.8 (30) | 7.68 (30) | 1,988 ± 16 (5) | 114 ± 2 (5) | 1.9 ± 0.0 (5) | 2.8 ± 0.1 (5) |
Parameter measurements
Parameters for the calcification of corals, as well as the photosynthetic efficiency, density, and chlorophyll content of the endosymbionts, were measured using the same methods in both experiments. The calcification rate and photosynthetic efficiency were measured at the start and end of the experiments, whereas endosymbiont density and chlorophyll content were measured at the end of the experiments.
Calcification rate
The buoyant weight of the coral nubbins was measured to estimate the calcification rate (Jokiel, Maragos & Franzisket, 1978; Davies, 1989; Anthony et al., 2008). This measurement was performed once every 4 days in the OW experiment and once per week in the OA experiment using an analytical balance with an accuracy of 0.0001 g (Sartorius Weighing Technology GmbH, Göttingen, Germany). The calcification rate was calculated using the following formula:
Calcification rate (%) = [(Wa –Wb)/Wa] ×100,
where Wa and Wb were the initial and final weights of the coral nubbins, respectively.
The skeletal density of each species was estimated based on the Archimedean principle (Jokiel, Maragos & Franzisket, 1978; Hughes, 1987). In total, 30 nubbins were cut from one living colony of each species that had not experienced OW or OA. Each nubbin was placed in a 50-mL graduated cylinder, which was filled with 30 mL of seawater. The volume of the nubbin was estimated as the increase in the water volume in the cylinder. The buoyant weight of the nubbin was measured as described above. Skeletal density was calculated as the buoyant weight of the nubbins divided by the volume (mg/mL). Correction is necessary when the volume of the nubbin is measured at different temperatures (Jokiel, Maragos & Franzisket, 1978). In this study, the measured density was not corrected because the volume of all nubbins was measured at the same temperature of 27 °C.
Photosynthetic efficiency (Fv/Fm)
The photosynthetic fitness of the endosymbionts (maximum photosynthetic efficiency, Fv/Fm) was measured weekly using a pulse amplitude fluorescence yield system (Diving PAM underwater chlorophyll fluorometer, Walz, Germany) (Schreiber, Schliwa & Bilger, 1986) in both experiments. Coral nubbins were kept in a dark box for dark adaptation for 20–30 min (Iguchi et al., 2012). The minimum fluorescence was determined using 3 − m∕s pulses of a light-emitting diode (blue LED, peak emission at 470 nm), and the maximum fluorescence of each dark-adapted nubbin was measured using a 0.8-s saturation light pulse (Schreiber, Schliwa & Bilger, 1986).
Endosymbiont density and chlorophyll content
After the experiments were completed, 15 and 36 nubbins of each species were sampled from the OW and OA experiments, respectively, to measure the endosymbiont density and chlorophyll content as described by Nakamura, Van Woesik & Yamasaki (2005). Coral tissue was removed from each nubbin using filtered seawater and a waterpick (Doltz EW 1250; Panasonic, Osaka, Japan). A hemocytometer (Fuchs-Rosenthal: Hirschmann EM Technicolor, Eberstadt, Germany) was used to count the endosymbiont density under a light microscope (Olympus, Tokyo, Japan) at a magnification of 400X. Only healthy-looking endosymbionts were counted, whereas irregular-shaped and pale-colored cells were excluded. The surface area of the nubbin was estimated by the aluminum foil technique (Marsh, 1970), and endosymbiont density was standardized per unit surface area of the nubbin. For extracting chlorophyll, 90% acetone was added to the algal pellet and mixed well using a vortex (Genia™ Vortex Mixer Model, Scientific Industries, Bohemia, NY, USA). The extract solutions were incubated in the dark at 5 °C for 48 h until the measurement. To calculate the chlorophyll content, the absorbance at wavelengths of 630, 664, and 750 nm was measured with a spectrophotometer (Shimadzu UV-180 UV spectrophotometer, Kyoto, Japan). Chlorophyll-a and c 2 levels were determined as described by Jeffrey & Humphrey (1975):
CHL a = 11. 43 × A664 –0.64 × A630
CHL c 2 = 27. 09 × A630 –3.63×A664.
The chlorophyll content was standardized as chlorophyll per endosymbiont cell (µg/cell).
Genotyping of endosymbionts
Before the experiment, endosymbionts in each coral species were identified using three nubbins from each colony (n = 6 nubbins in total) to identify the genotypes of endosymbionts in natural colonies at the study sites. DNA from coral nubbins were preserved in 99% EtOH at −4 °C. We amplified the ribosomal internal transcribed spacer 2 (ITS2) region of the Symbiodiniaceae using primers ITSintfor2 and ITS2-reverse with Illumina sequencing adapters, according to Arif et al. (2014). The polymerase chain reaction conditions were as described by Arif et al. (2014). We prepared a library for the metabarcoding of Symbiodiniaceae using a Nextera XT Index Kit (Illumina, San Diego, CA, USA). Generated amplicons were purified using Ampure XP Beads (Beckman Coulter, Brea, CA, USA) and sequenced on an Illumina MiSeq platform (2 × 250 bp paired-end). Obtained fastq files were processed using the SymPortal analytical framework (Hume et al., 2019) to determine the Symbiodiniaceae genotypes. Genotypes were represented as ITS2 type profiles (specific sets of defining intragenomic ITS2 sequence variants [DIVs]). Raw data of DNA barcoding of Symbiodiniaceae were deposited in the DNA Data Bank of Japan (DDBJ) (Bioproject no. PRJDB10497).
Statistical analysis
A generalized linear model (GLM) fitted with the gamma distribution was performed with factorial logistic regression. This analysis is appropriate in cases in which the error distribution of a response variable is not normal (Zuur et al., 2009), as in the present data set. The effects of OA and OW were analyzed separately; coral species, OW or OA treatment, and interaction between species and treatments (OA or OW) were included as fixed model terms in each analysis. Pairwise comparisons were performed using Tukey’s honestly significant difference (HSD) test to detect differences among treatments and species after the GLM. Student’s t-test was conducted after examining the assumptions of the test, i.e., homoscedasticity and normality. To compare the sensitivity of the two species to OW and OA, when significance was detected among treatments in a species, reductions in the calcification rate, endosymbiont density, and Fv/Fm in each treatment compared to the control were calculated for each species. Thus, the difference between the means in the control and values for each nubbin in each treatment was divided by the means in the control. A GLM fitted with the gamma distribution was performed with factorial logistic regression to test for differences in the reduction in the calcification rate between species. Analyses were performed using the statistical software R with R Studio (Version 1.1.463, R Core Team, 2017). We used the R package rcompanion (Mangiafico, 2019); the function was “glht” in the “Muticomp” and “lsm” package (https://cran.r-project.org/web/packages/multcomp/citation.html).
Results
Calcification
M. digitata had significantly higher calcification rates than A. digitifera in the control treatments of both the OW and OA experiments (t-test, p < 0.0001 and p = 0.0002, respectively; Fig. 1). Calcification rate declined significantly in both species as temperature and pCO2 increased (GLM, p = 0.02 and p < 0.001, respectively; Fig. 1).
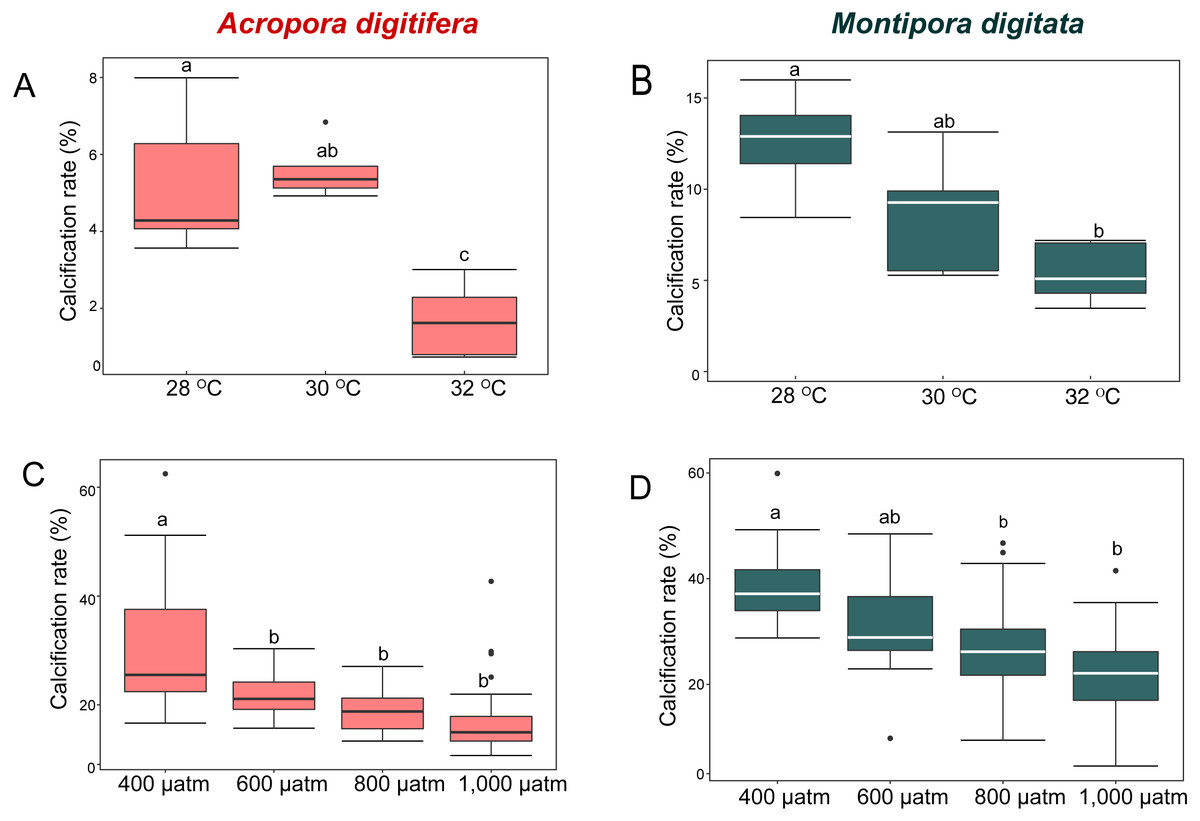
Figure 1: Calcification rates (percent changes in skeletal weight relative to the initial weight) of coral nubbins.
Boxplot of (A) A. digitifera and (B) M. digitata in OW experiment (n = 5 for each species in each treatment). (C) A. digitifera and (D) M. digitata in OA experiment (n = 8 for each species in each treatment). The lower and higher boundaries of the box indicate 25th and 75th percentile, respectively. The horizontal line within the box marks the median. Error bars above and below the box indicate the 10th and 90th percentiles. Dots denote outliers. Lowercase letters indicate no significant (same letters) or significant (different letters) differences (p < 0.05).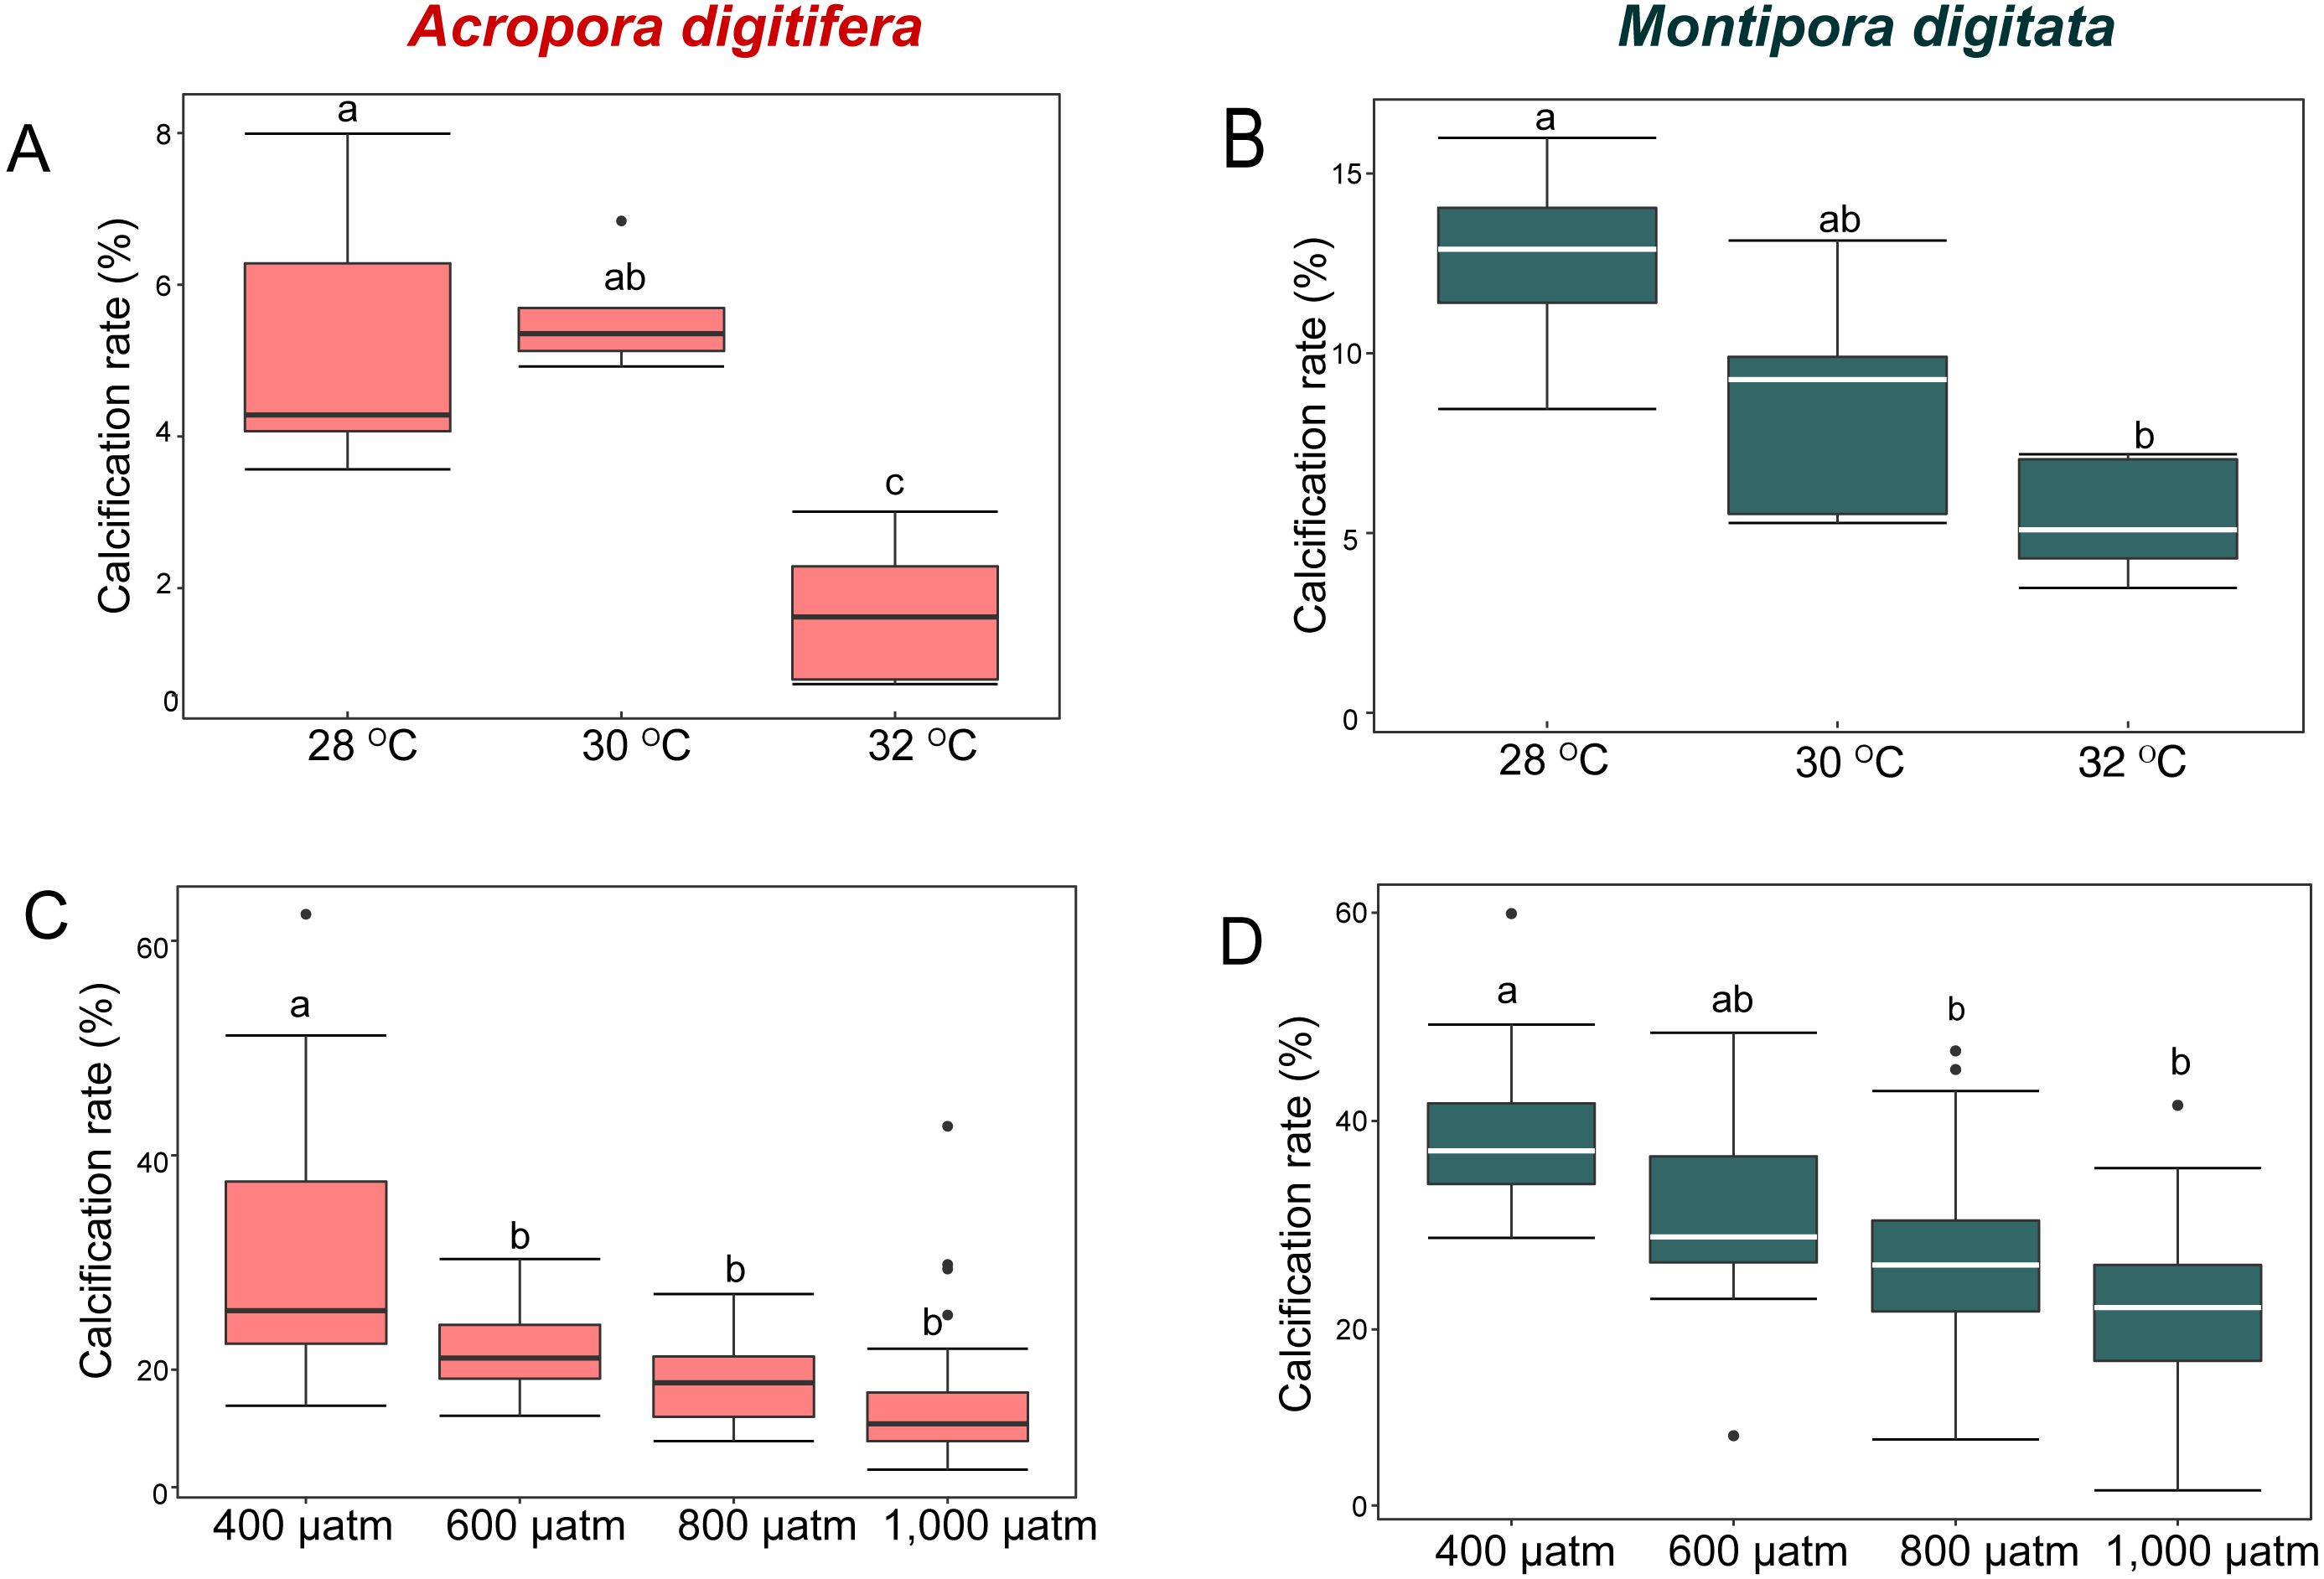
In the OW experiment, the post-hoc test indicated that the calcification rate in A. digitifera did not differ significantly between 28 and 30 °C (Tukey’s HSD, p = 0.8; Fig. 1A), but it was significantly lower at 32 °C than at 28 and 30 °C (Tukey’s HSD, p = 0.0002 and p < 0.0001, respectively; Fig. 1A). The calcification rate in M. digitata did not differ significantly between 28 and 30 °C, and between 30 and 32 °C (Tukey’s HSD, p = 0.09; Fig. 1B), but was significantly lower at 32 °C than at 28 °C (Tukey’s HSD, p = 0.002; Fig. 1B). The calcification rate decreased by approximately 70% from 28 to 32 ° C in A. digitifera, while it decreased by approximately 37% in M. digitata. Although the reduction in the calcification rate did not differ significantly among treatments for both species (GLM, p = 0.9; Figs. 1A & 1B), the species × treatment interaction had a significant effect on the rate (p = 0.007, Figs. 1A & 1B); the calcification rate rapidly decreased from 30 to 32 °C in A. digitifera but gradually decreased as temperature increased in M. digitata.
In the OA experiment, post-hoc analysis indicated that the calcification rate of A. digitifera was significantly higher at 400 µatm than in the other treatments, i.e., 600, 800, and 1,000 µatm (Tukey’s HSD, all p < 0.001; Fig. 1C), but it was not significantly different among 600, 800, and 1,000 µatm (Tukey’s HSD, p > 0.1; Fig. 1C). In contrast to A. digitifera, the calcification rate of M. digitata was lower at 800 and 1,000 than at 400 µatm (Tukey’s HSD, both p < 0.0001; Fig. 1D), and at 1,000 than at 600 µatm (Tukey’s HSD, p < 0.0001; Fig. 1D). The reduction in calcification rate was significantly different among treatments for both species (GLM, p < 0.0001; Figs. 1C & 1D), and the species × treatment interaction had a significant effect on the reduction in calcification rate (p < 0.0001, Figs. 1C & 1D); the calcification rate was less affected from 600 to 1,000 µatm in A. digitifera than in M. digitata.
Skeletal density
For A. digitifera and M. digitata, mean skeletal density was 1.47 ± 0.6 and 1.57 ± 0.8 g/cm3 (mean ± SD, each n = 30), respectively. There was a significant difference in skeletal density between species (t-test, p = 0.04; Fig. 2).
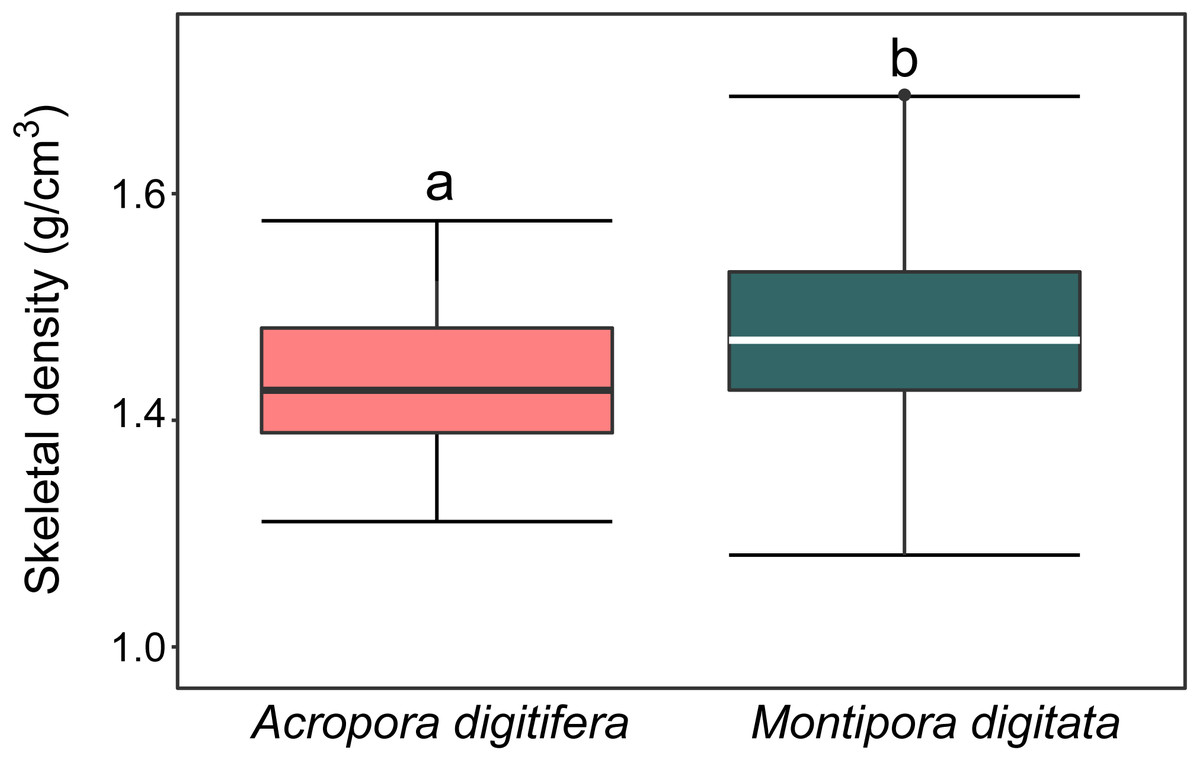
Figure 2: Boxplot of skeletal density (mg/mL) of coral nubbins of A. digitifera and M. digitata (n = 30 for each species, p = 0.003).
The lower and higher boundaries of the box indicate 25th and 75th percentile, respectively. The horizontal line within the box marks the median. Error bars above and below the box indicate the 10th and 90th percentiles. Lowercase letters indicate no significant (same letters) or significant (different letters) differences (p < 0.05).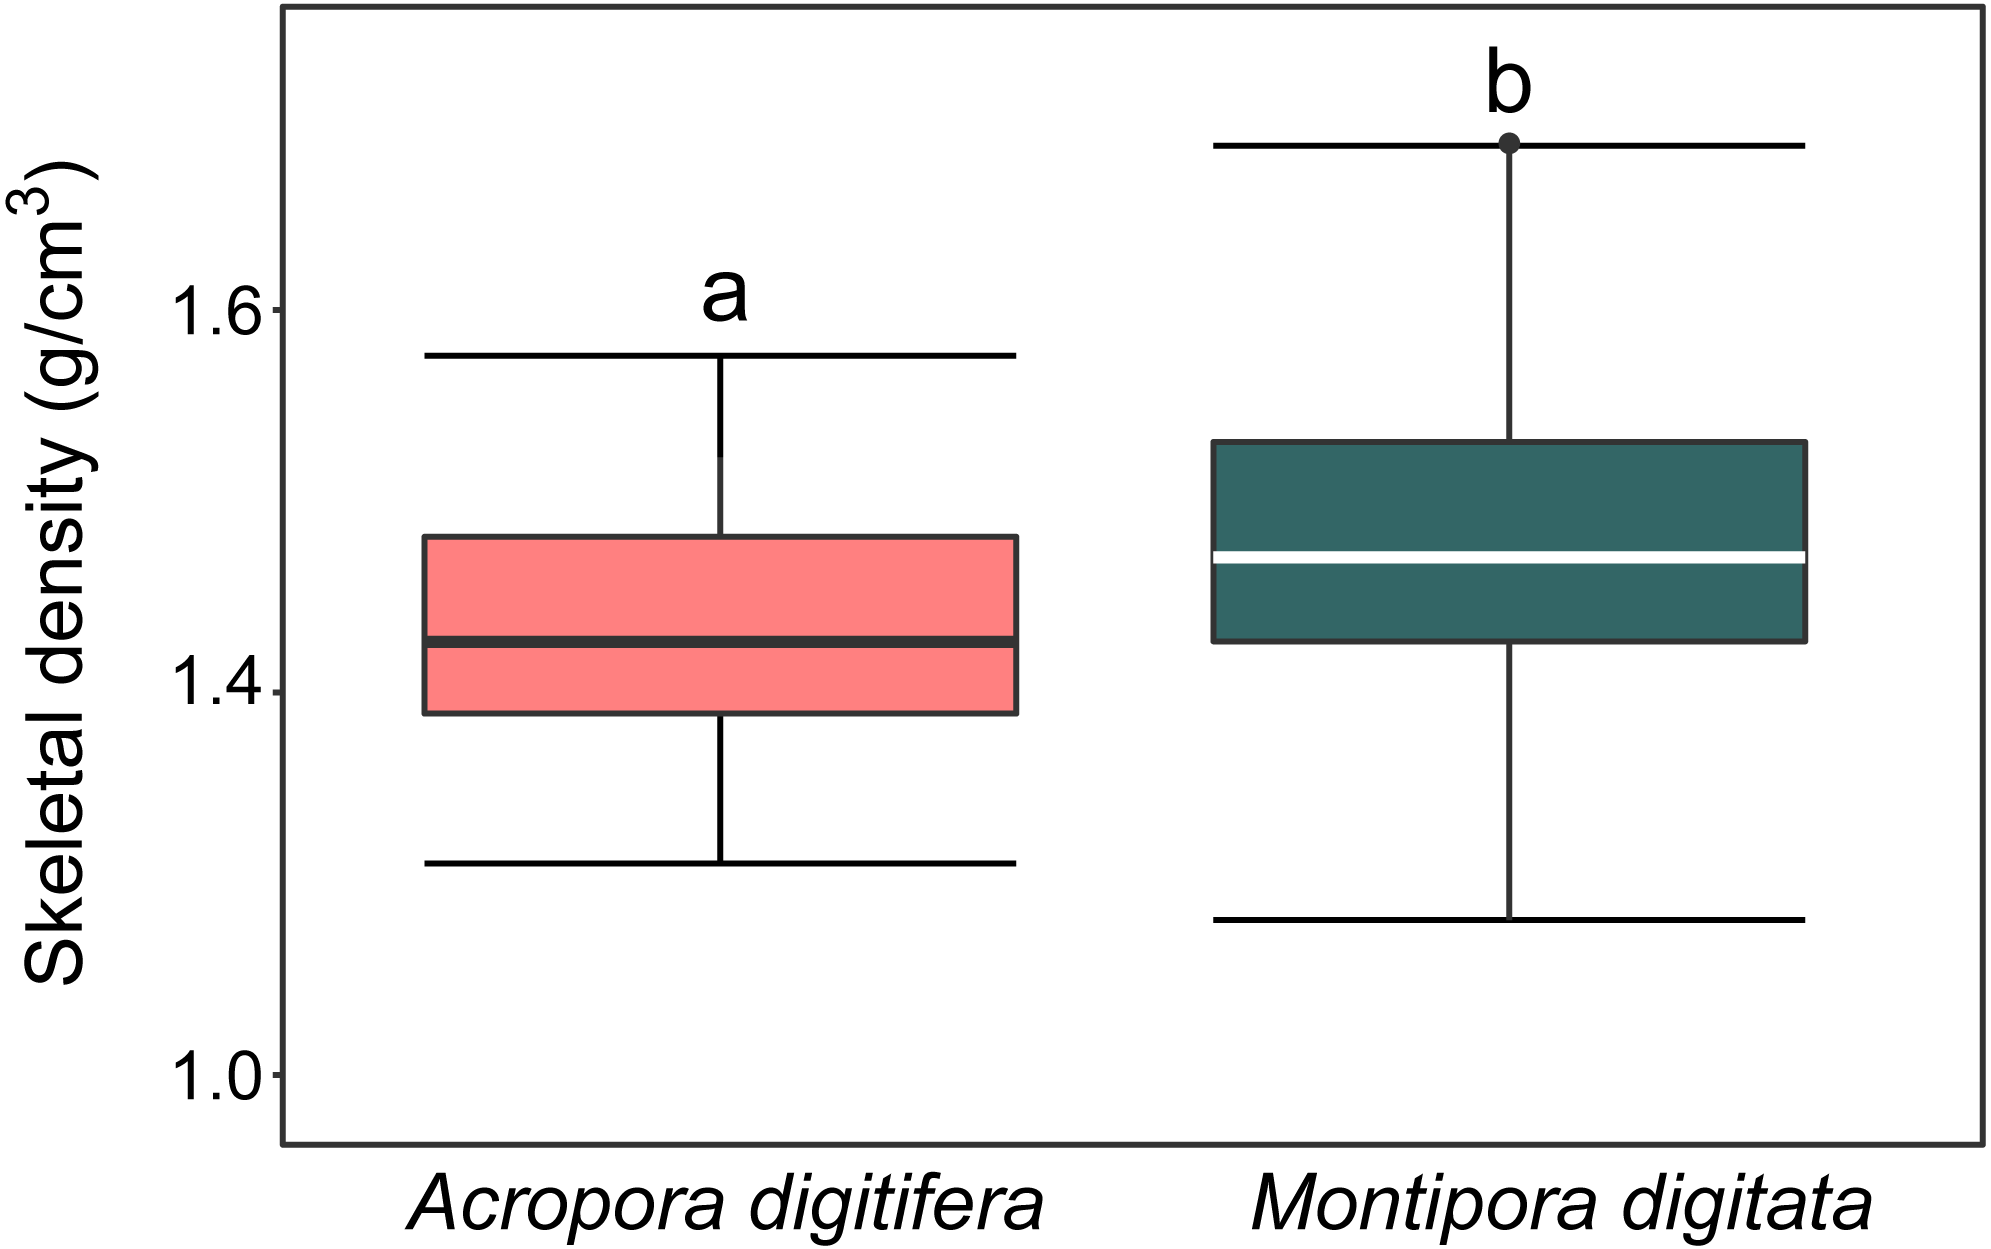
Endosymbiont density
In the OW experiment, endosymbiont density of A. digitifera and M. digitata in the control treatments were not significantly different (t-test, p = 0.7; Figs. 3A & 3B). Endosymbiont density decreased significantly in both species as temperature increased (GLM, p < 0.0001; Fig. 3A & 3B). Post-hoc test indicated that endosymbiont density of A. digitifera did not differ significantly between 28 and 30 °C (Tukey’s HSD, p = 0.4; Fig. 3A), but it was significantly lower at 32 °C than at 28 and 30 °C (Tukey’s HSD, p < 0.0001 and p = 0.001, respectively; Fig. 3A). In M. digitata, the density was significantly lower at 32 °C than at 28 and 30 °C (Tukey’s HSD, p < 0.0001 and p = 0.001, respectively; Fig. 3B). Although the reduction in endosymbiont density was not significantly different among treatments for both species (GLM, p = 0.6; Figs. 3A & 3B), the species × treatment interaction had a significant effect on the reduction in endosymbiont density (GLM, p = 0.007; Figs. 3A & 3B) showing similar trends as seen with the the calcification rate in the OW experiment.
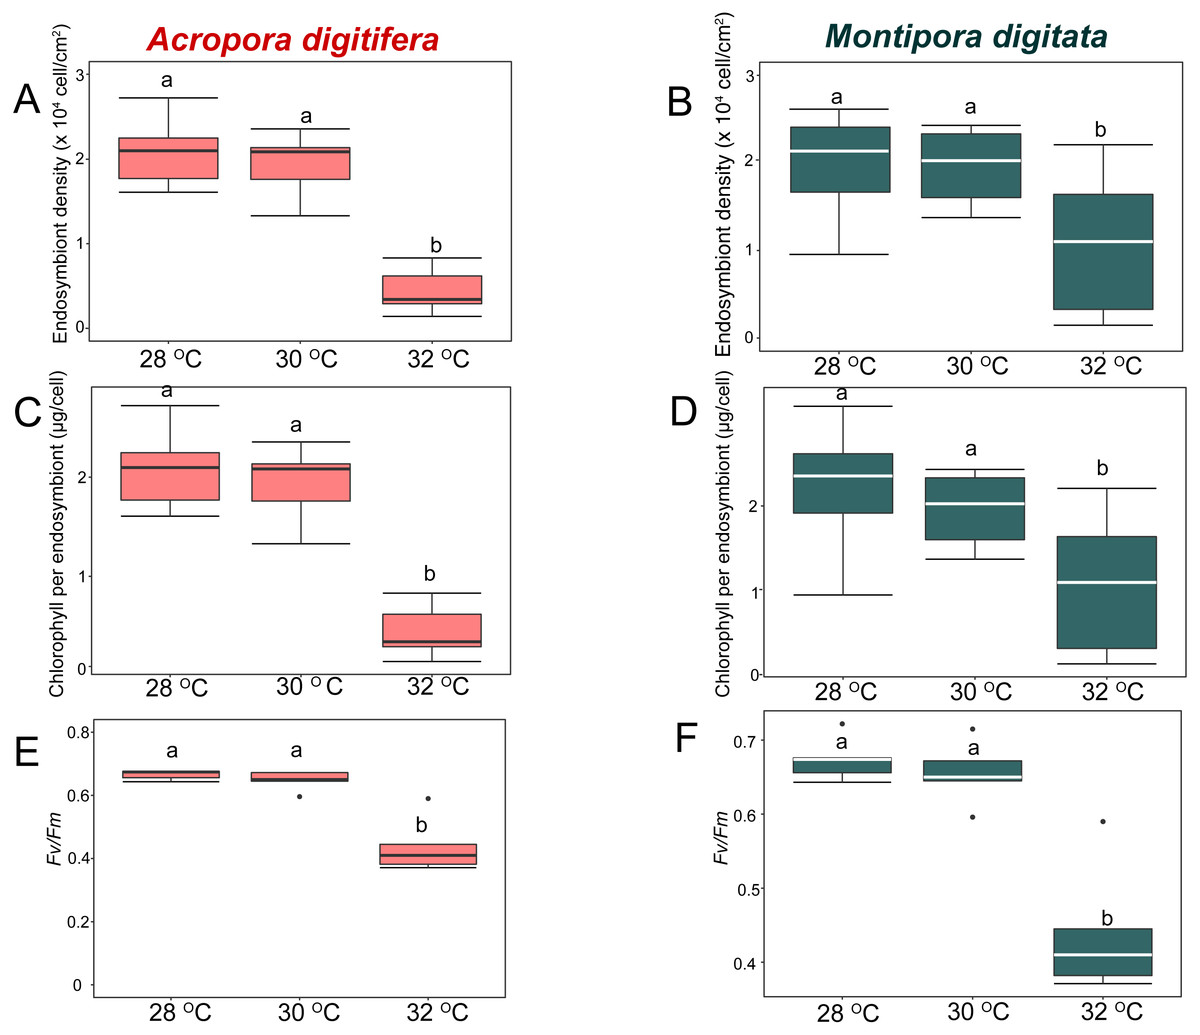
Figure 3: Boxplot of endosymbiont density (A, B), chlorophyll content (C, D), and photosynthetic efficiency (E, F) of Acropora digitifera (A, C, E) and Montipora digitata (B, D, F) in OW treatment (n = 5 for each species in each measurement).
The horizontal line within the box marks the median. Error bars above and below the box indicate the 10th and 90th percentiles. Dots denote outliers. Lowercase letters indicate no significant (same letters) or significant (different letters) differences ( p < 0.05).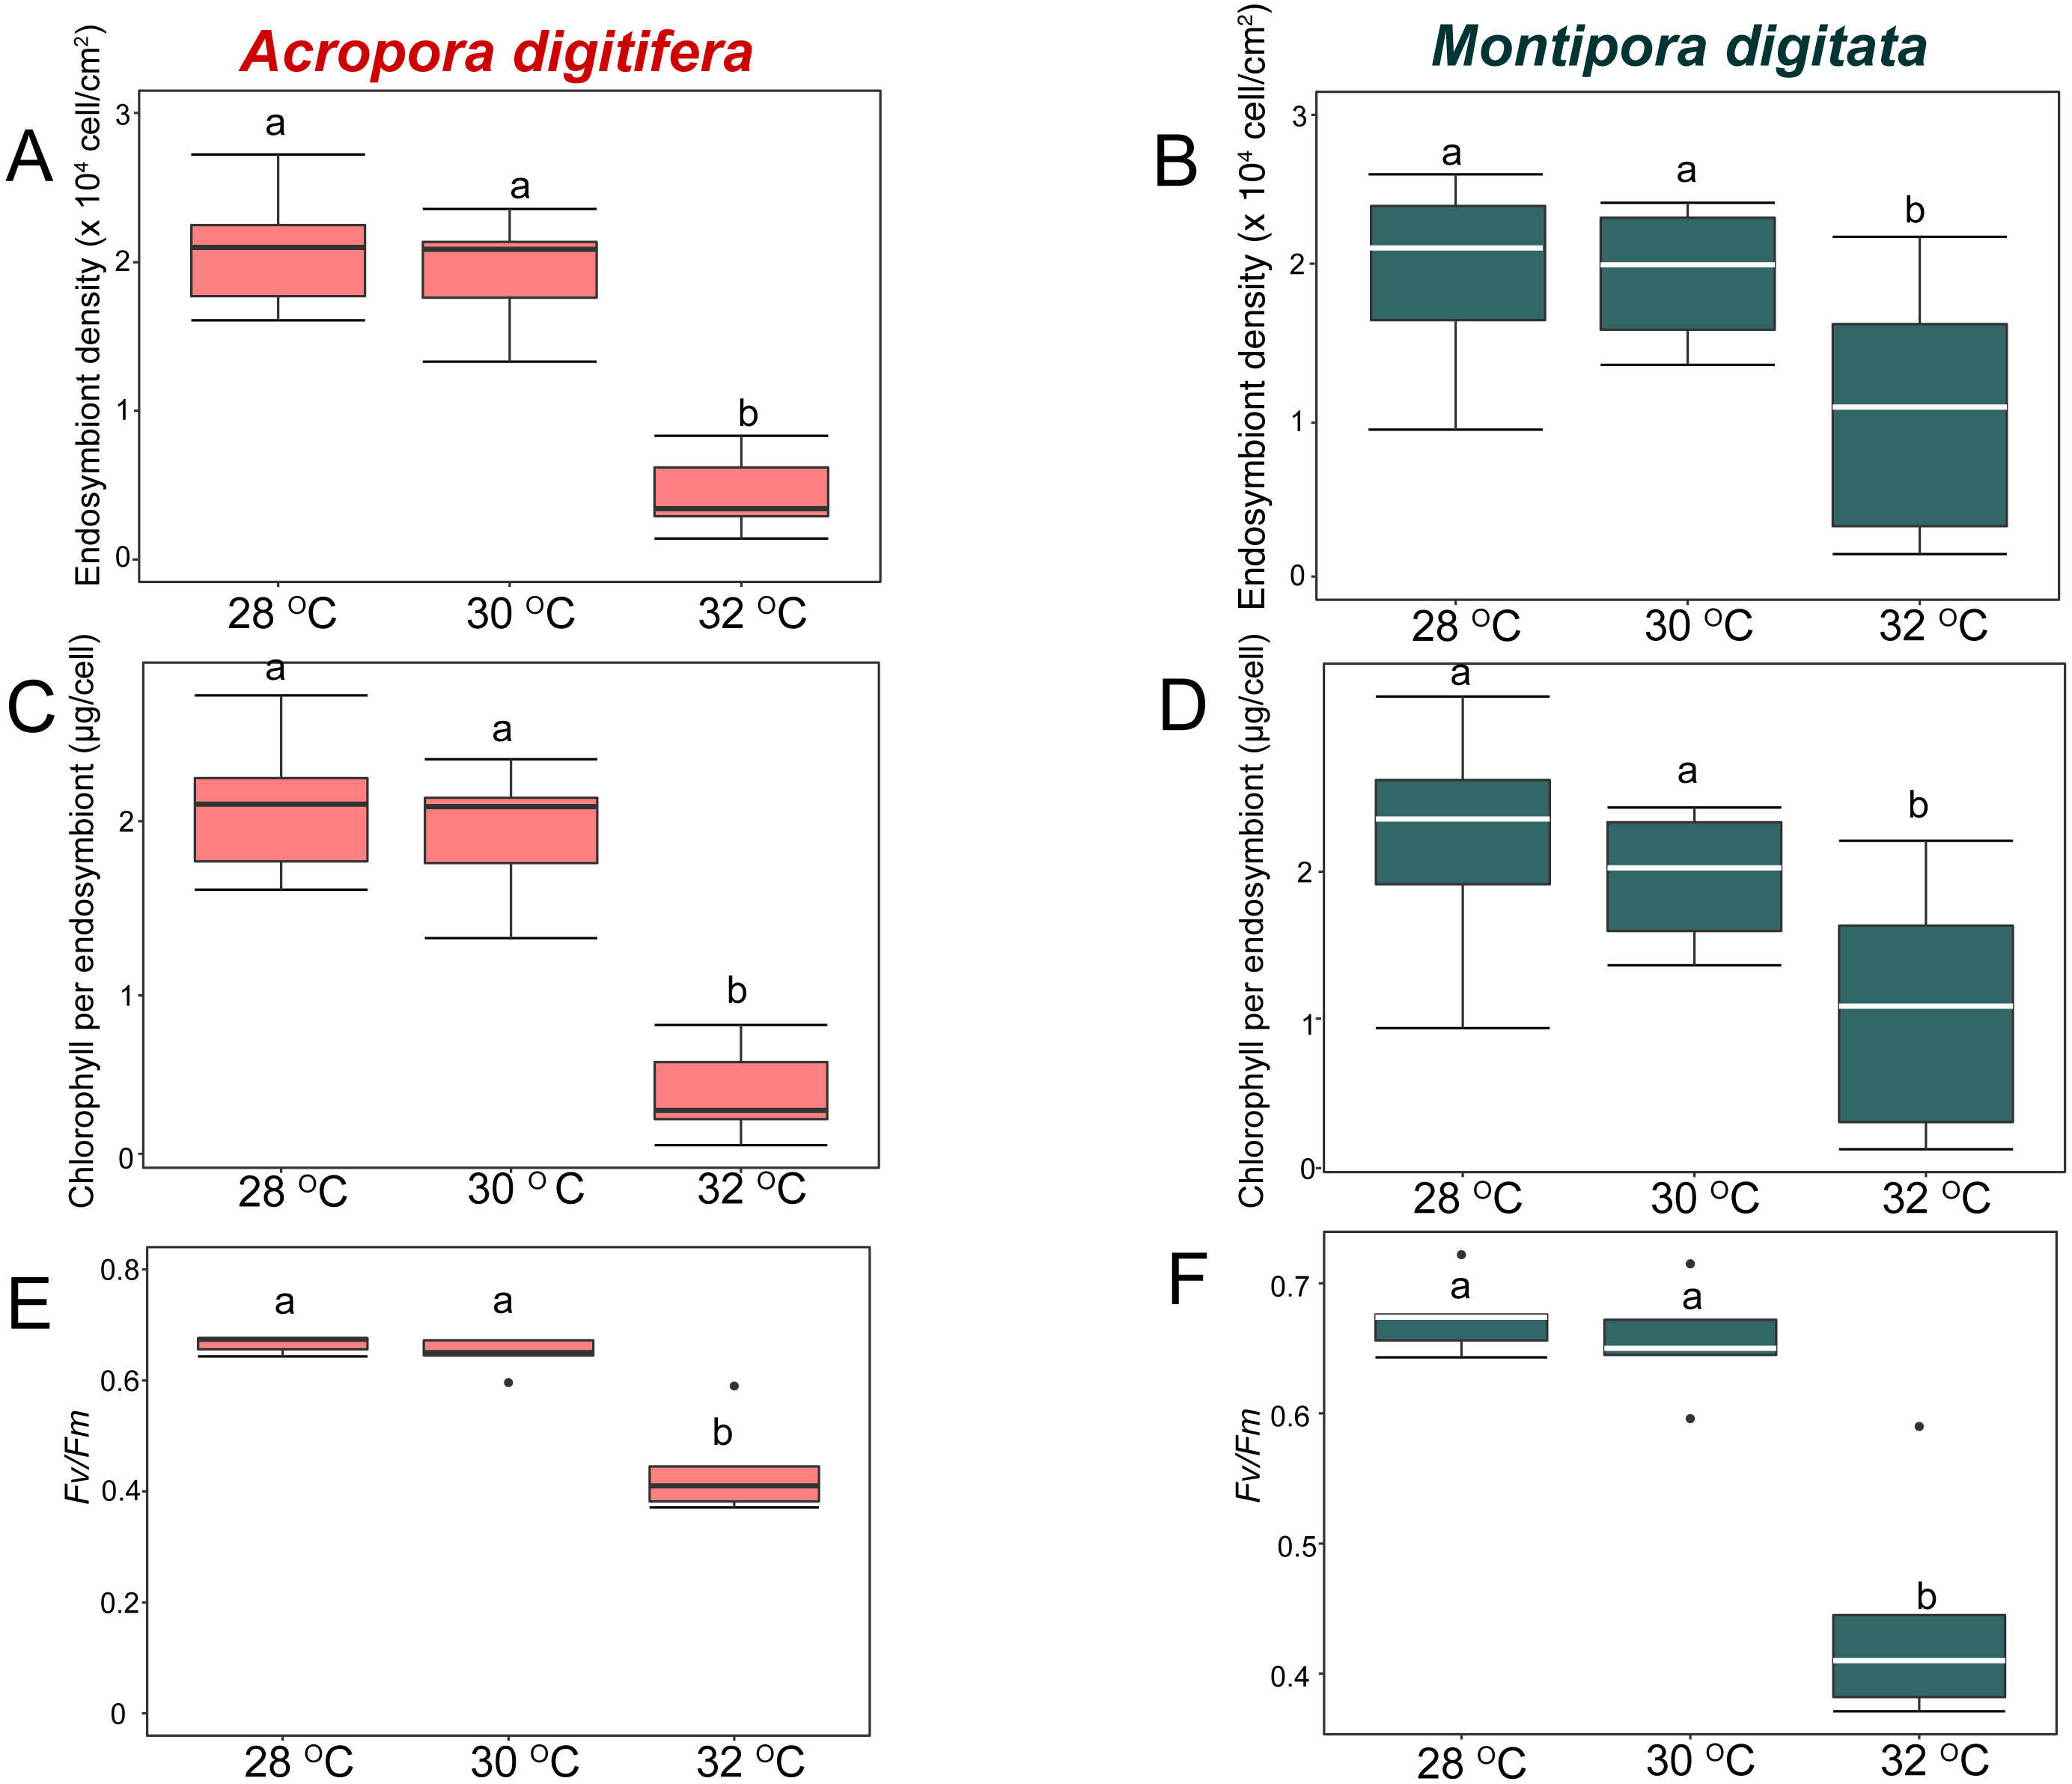
In the OA experiment, endosymbiont density of A. digitifera was significantly higher than that of M. digitata in the control treatments (t-test, p = 0.003; Figs. 4A & 4B). Endosymbiont density of both species differed significantly among treatments (GLM, p = 0.0008; Figs. 4A & 4B); however, the reduction in endosymbiont density was not significantly different among treatments for both species (GLM, p = 0.4; Figs. 4A & 4B), and the species × treatment interaction had no effect on the reduction in endosymbiont density (GLM, p = 0.9; Figs. 4A & 4B).
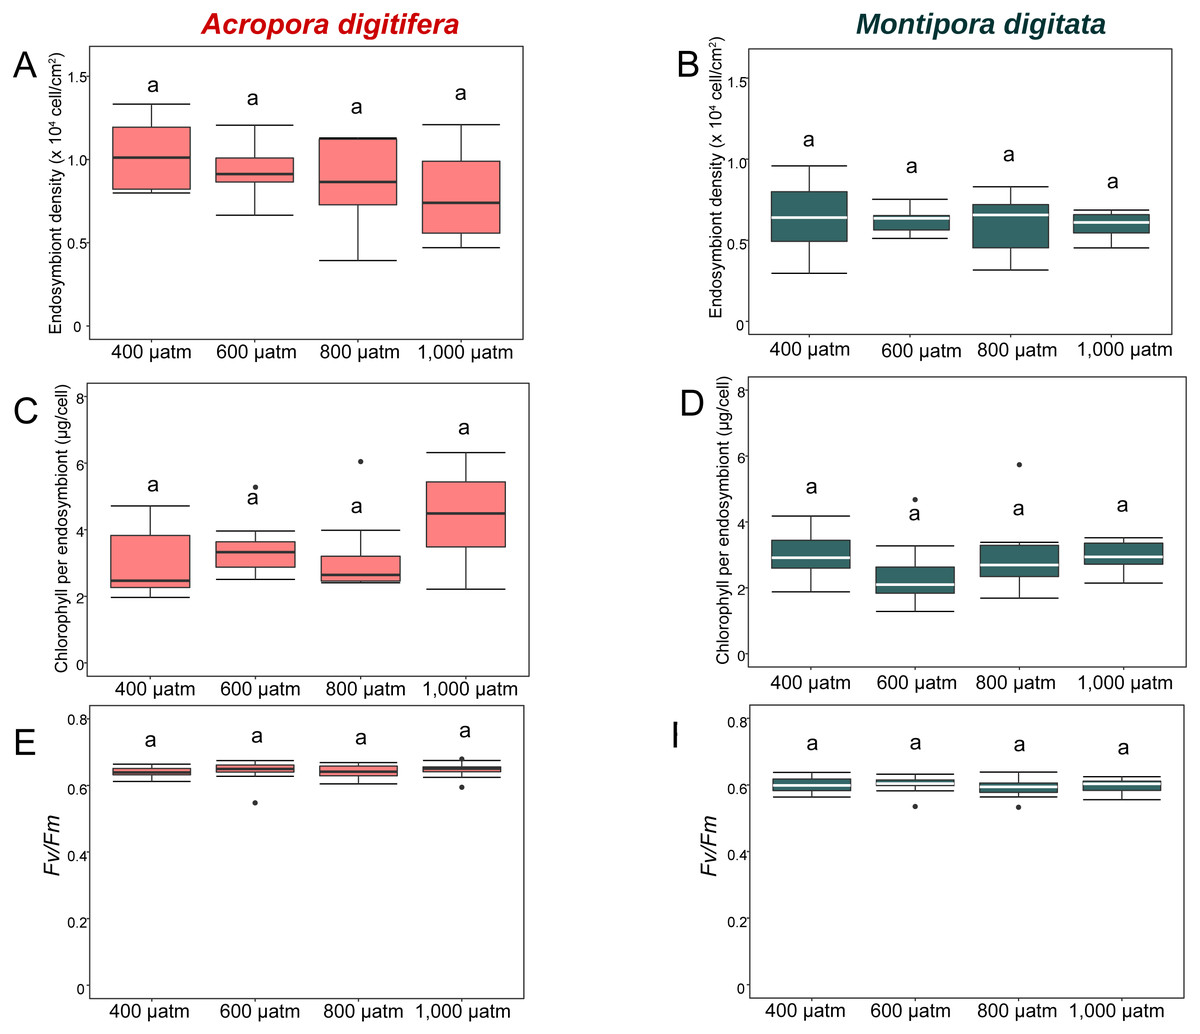
Figure 4: Boxplot of endosymbiont density (A and B); chlorophyll content (C and D); and photosynthetic efficiency (Fv/Fm) (E and F) of A. digitifera (A, C, E) and M. digitata (B, D, F) in OA treatments (n = 5 for each species in each measurement).
The lower and higher boundaries of the box indicate 25th and 75th percentile, respectively. The horizontal line within the box marks the median. Error bars above and below the box indicate the 10th and 90th percentiles. Dots denote outliers. Lowercase letters indicate no significant (same letters) or significant (different letters) differences (p < 0.05).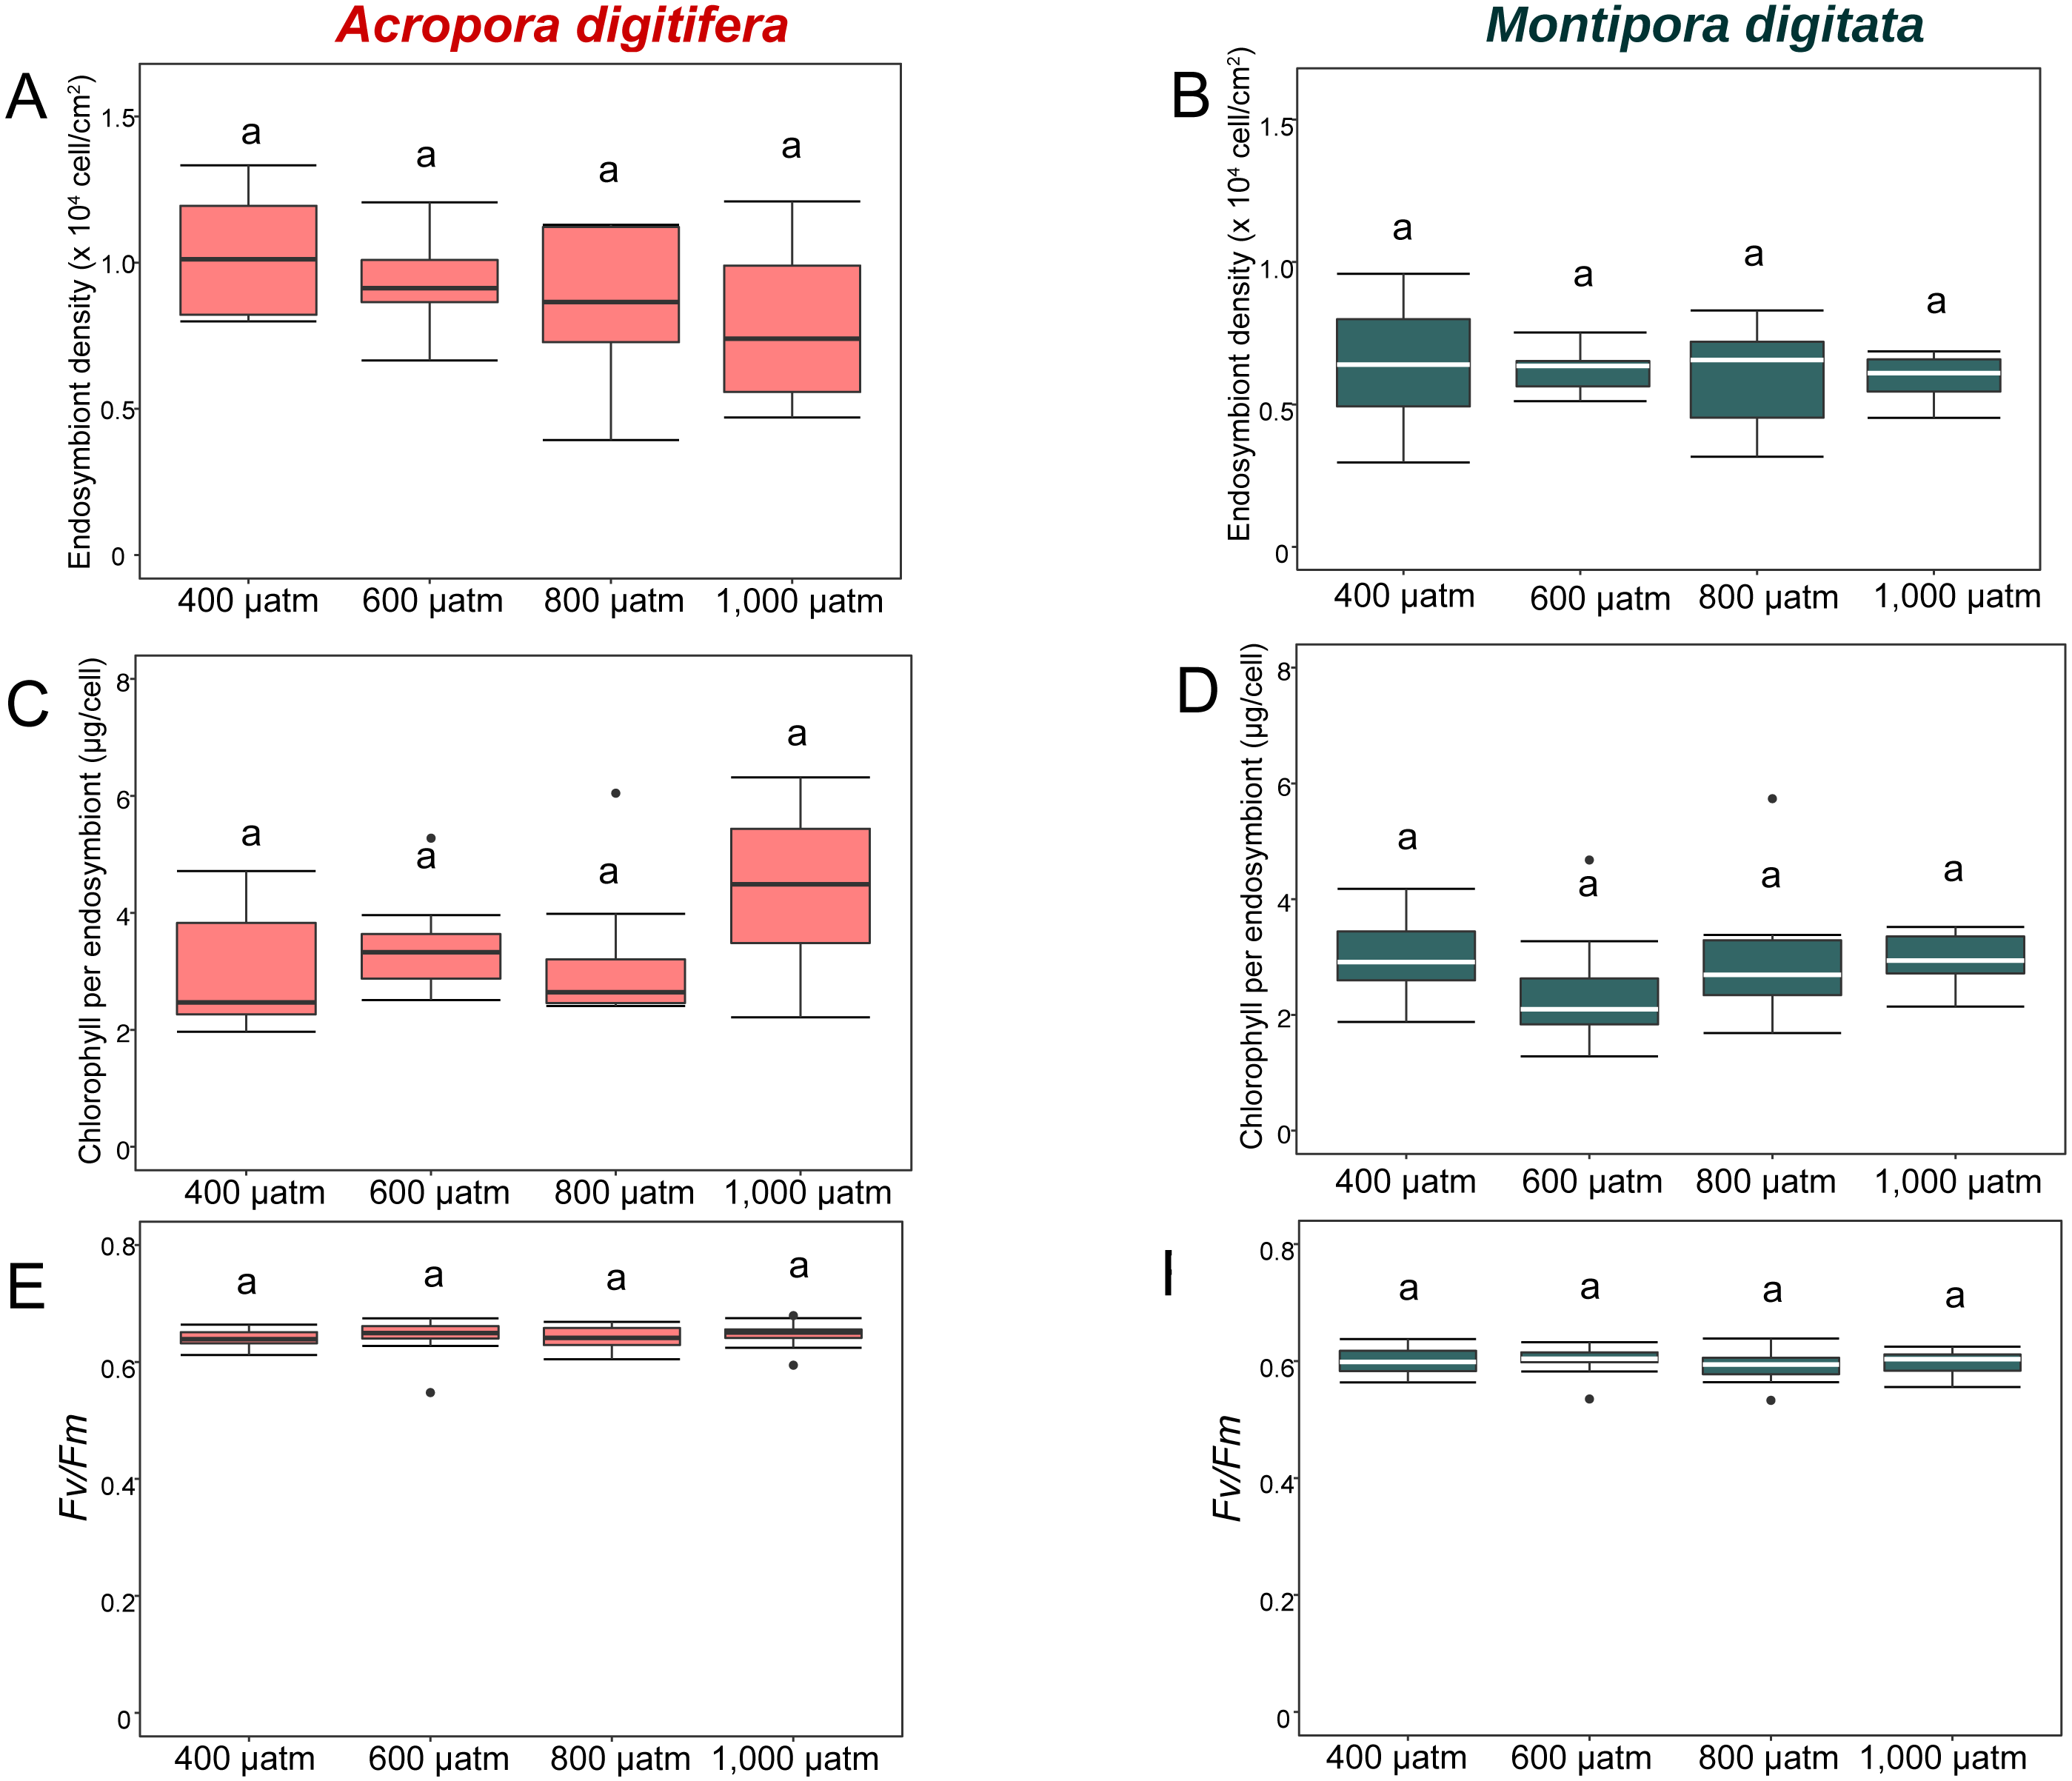
Chlorophyll content
In the OW experiment, chlorophyll content per endosymbiont was not significantly different between the species in the control treatments (t-test, p = 0.9; Figs. 3C & 3D). The chlorophyll content per endosymbiont differed significantly among treatments for both species (GLM, p = 0.0005; Figs. 3C & 3D). Post-hoc test indicated that chlorophyll content of A. digitifera did not differ significantly between 28 and 30 °C (Tukey’s HSD, p = 0.96; Fig. 3C), but it was significantly lower at 32 °C than at 28 and 30 °C (Tukey’s HSD, p < 0.0001 and p = 0.001, respectively; Fig. 3C). The chlorophyll content of M. digitata did not differ significantly among temperature treatments (Tukey’s HSD, p > 0.07; Fig. 3D). The reduction in chlorophyll content per endosymbiont was not significantly different among for both species (GLM, p = 0.2; Figs. 3C & 3D), and the species × treatment interaction had no effect on the reduction in chlorophyll content per endosymbiont (GLM, p = 0.2; Figs. 3C & 3D).
In the OA experiment, chlorophyll content per endosymbiont was not significantly different between species in the control treatments (t-test, p = 0.8, Figs. 4C & 4D). The reduction in chlorophyll content did not differ among treatments for both species (GLM, p = 0.8, Figs. 4C & 4D), and the species × treatment interaction had no effect on the reduction in chlorophyll content per endosymbiont (GLM, p = 0.2, Figs. 4C & 4D).
Photosynthetic efficiency
In the OW experiment, photosynthetic efficiency (Fv/Fm) was not significantly different between species in the control treatments (t-test, p = 0.9; Figs. 3E & 3F). Fv/Fm decreased significantly in both species as temperature increased (GLM, p < 0.0001; Figs. 3E & 3F). Post-hoc test indicated that Fv/Fm of A. digitifera and M. digitata did not differ significantly between 28 and 30 °C (Tukey’s HSD, p = 0.9; Figs. 3E & 3F), but it was significantly lower at 32 °C than at 28 and 30 °C (Tukey’s HSD, both p < 0.0001 in A. digitifera, and p = 0.05 and 0.02, respectively, in M. digitata; Figs. 3E & 3F). The reduction in Fv/Fm was not significantly different among treatments for both species (GLM, p = 0.7; Figs. 3E & 3F) and the species × treatment interaction had no effect on the reduction in Fv/Fm (GLM, p = 0.7; Figs. 3E & 3F).
In the OA experiment, the Fv/Fm of A. digitifera was significantly higher than that of M. digitata in the control treatment (t-test, p = 0.004; Figs. 4E & 4F). The reduction in Fv/Fm did not differ significantly among treatments for both species (GLM, p = 0.53, Figs. 4E & 4F) and there was no effect of the interaction between treatments and species on Fv/Fm (GLM, p = 0.5; Figs. 4E & 4F).
Endosymbiont genotypes
Endosymbionts of both A. digitifera and M. digitata belonged to the genus Cladocopium (LaJeunesse et al., 2018). ITS2 type profiles were clearly different between the two species; C50a and C50c were dominant in A. digitifera, while C15 was dominant in M. digitata.
Discussion
In the present study, the effects of OW and OA on the corals A. digitifera and M. digitata were examined separately, at three temperatures (28 °C, 30 °C, and 32 °C) in OW and at four pCO2 treatments (400, 600, 800, and 1,000 µatm) in OA experiments. Although the two experiments were conducted in different years and seasons using nubbins collected from different colonies, we considered that interspecific comparison within each experiment was possible (see Materials and Methods). The results revealed that A. digitifera was more heat-sensitive than M. digitata, whereas the former was less sensitive to elevated pCO2 than the latter (Fig. 1).
We used the calcification rate of corals as an indicator of stress sensitivity, in accordance with previous studies (Davies, 1989; Anthony et al., 2008; Iguchi et al., 2012; Sekizawa et al., 2017). In the OW experiment, the calcification rate of both coral species showed the greatest decrease at the highest temperature (32 °C) compared to that at lower temperatures (Figs. 1A & 1B). However, the reduction in the calcification rate of A. digitifera from the control (28 °C) to the highest temperature was larger than that of M. digitata, and the species × treatment interaction significantly affected the reduction in the calcification rate (Figs. 1A & 1B). In the OA experiment, the calcification rate of both species decreased as pCO2 increased (from 400, 600, 800, to 1,000 µatm; Figs. 1C & 1D). However, the reduction in the calcification rate was significantly different among treatments for both species, and the species × treatment interaction significantly affected the reduction in the calcification rate; the reduction in the calcification rate was higher for M. digitata than for A. digitifera in the OA experiment (Figs. 1C & 1D). Kavousi et al. (2015) also found that A. digitifera was more sensitive to OW (28 °C vs. 31 °C) and less sensitive to OA (400 vs. 1,000 µatm) than M. digitata (400 vs. 1,000 µatm) in their experiments, which were conducted at the same study site as the present study. Kavousi et al. (2015) compared calcification between two different OW and OA conditions. These findings indicate that the two species will respond differently to the ongoing OW and OA.
In the present study, the calcification rate of A. digitifera decreased considerably from 30 °C to 32 °C, whereas the calcification rate of M. digitata was less affected in the same temperature range (Figs. 1A & 1B). In contrast, the calcification rate of M. digitata steadily decreased from 600 to 1,000 µatm, whereas the calcification rate of A. digitifera only minimally decreased in the same pCO2 range (Figs. 1C & 1D). If these findings are used to predict future responses of the two coral species to climate change, the fitness of A. digitifera will decrease as sea surface temperature increases to 32 °C, while the fitness of M. digitata will show little change in response to the same increases in temperature. In contrast, the fitness of A. digitifera will only decrease when the pCO2 rises from 400 to 600 µatm, and the fitness of M. digitata will continue to decrease as the pCO2 increases from 400 to 1,000 µatm.
Sensitivity differences to thermal stress between A. digitifera and M. digitata might mainly be due to differences in the species of endosymbionts in the host coral. Although LaJeunesse et al. (2018) proposed that evolutionary divergence in the former “Symbiodinium clades” were equivalent to that in the genera of the family Symbiodiniaceae, we used the former “clades” to compare the present findings with those of previous studies. In the present study, we found that the dominant endosymbiont “clades” of A. digitifera were C50 and C3. In contrast, the dominant “clade” of M. digitata was C15. Fisher, Malme & Dove (2012) showed that corals hosting C15 endosymbionts were less heat tolerant (at 32 °C) than those hosting C3. LaJeunesse et al. (2003) also showed that Porites cylindrica and M. digitata with C15 endosymbionts were resistant to heat stress. Although no studies have evaluated the heat tolerance of C50 endosymbionts, the greater heat tolerance of M. digitata than that of A. digitifera was likely related to differences in their endosymbiont “clades.”
Other hypotheses have been proposed to explain interspecific differences in the heat tolerance of corals but were not tested in this study. First, the tissue-thickness hypothesis of Loya et al. (2001) cannot explain the interspecific differences found in the present study. Loya et al. (2001) showed that the tissues of heat-tolerant massive and encrusting coral species were generally thicker (or deeper) than those of less tolerant, finely branched species. They hypothesized that thick-tissued coral species were more tolerant to heat stress, as suggested by Hoegh-Guldberg & Williamson (1999). However, A. digitifera had approximately 2-fold higher tissue thickness compared to M. digitata at the study site (Loya et al., 2001). Second, the mass transfer hypothesis was not applicable in the present study. Loya et al. (2001) hypothesized whether high mass transfer facilitated survival under heat stress based on the findings of Patterson (1992) for coral bleaching. Van Woesik et al. (2012) developed a novel model showing that coral colonies with a higher interstitial domain (volume of space between branches) to boundary domain (volume of space boundary of a colony) ratio had lower mass transfer rates; thus, they were more sensitive to heat stress. In the present study, the coral nubbins were similar in shape and size for both species (one branchlet, two cm in length). Finally, the fast-growth hypothesis (Jokiel & Coles, 1974) could not be applied in the present study. Some studies reported that fast-growing, branching coral species were more sensitive to heat stress than slow-growing, massive species (Jokiel & Coles, 1990; Hoegh-Guldberg & Salvat, 1995; Marshall & Baird, 2000; Hughes et al., 2018), which was thought to be due to the high metabolic rate of fast-growing species. In the present study, the calcification, or growth rate, was higher in M. digitata than in A. digitifera under ambient temperature conditions, although A. digitifera was more heat sensitive than M. digitata was. Our findings support the fast-growth hypothesis; however, the metabolic rate may not always be correlated with the growth rate among branching coral species. To test the fast-growth hypothesis, the metabolic rates of each coral species should be measured.
Corals with a high calcification rate under ambient pCO2 conditions and with higher skeletal density might be more sensitive to high pCO2. The calcification rate of M. digitata was higher than that of A. digitifera at a pCO2 of 400 µatm, and the reduction in the calcification rate of M. digitata was higher than that of A. digitifera at a higher pCO2 (i.e., 600, 800, and 1,000 µatm). These results agree with a general tendency reported in some studies that faster growing coral species were more sensitive to OA (Comeau et al., 2014; Shaw et al., 2016; Jury, Delano & Toonen, 2019). In addition to the calcification rate, the skeletal density of M. digitata was higher than that of A. digitifera. The lateral thickening of the coral skeleton has been considered to increase the bulk density of the coral skeleton (Barnes & Lough, 1992; Mollica et al., 2018). Coral species with a denser skeleton would require ambient seawater with a higher aragonite saturation state to enable lateral thickening of the skeleton compared to species with a less dense skeleton. However, aragonite saturation decreases with OA (Kleypas, 1999; Doney et al., 2009), which may explain why the calcification rate of M. digitata was more sensitive to OA compared to A. digitifera. Alternatively, considering that coral calcification can be biologically controlled in calcifying fluid (Cyronak, Schulz & Jokiel, 2016), biological processes such as acquisition of photosynthate from symbiotic algae (Yellowlees, Rees & Leggat, 2008) may contribute to the interspecific difference in the responses to OA.
In the present study, OW and OA appeared to mainly affect the endosymbionts and host corals, respectively. The endosymbiont density, chlorophyll a concentration, and Fv/Fm of the coral nubbins decreased considerably at the highest temperature treatment (32 °C) in both species, as observed previously (e.g., Fitt & Warner, 1995; Jones et al., 1998; Warner, Fitt & Schmidt, 1996; Warner, Fitt & Schmidt, 1999; Fitt et al., 2001; Castillo & Helmuth, 2005; Flores-Ramírez & Liñán Cabello, 2007). In the present study, the calcification rates of both coral species decreased because of decreases in endosymbiont density under OW. Many studies have indicated that the photosynthesis of symbiotic endosymbionts enhances coral calcification (e.g., Allemand et al., 2011). Therefore, the impact of OW on endosymbiont photosynthesis (Fitt et al., 2001) would decrease the calcification rate of the coral host (De’ath, Lough & Fabricius, 2009; Horwitz, Hoogenboom & Fine, 2017) if the damage is not lethal. In contrast to OW, the endosymbionts were only minimally affected by OA in both A. digitifera and M. digitata in the present study. This agrees with previous studies showing that OA does not affect endosymbiont density, chlorophyll content, and Fv/Fm in some coral species (Rodolfo-Metalpa et al., 2010; Chauvin, Denis & Cuet 2011; Takahashi & Kurihara, 2013). In contrast, Anthony et al. (2008) reported that OA (1,000–1,300 µatm of pCO2) induced bleaching and productivity loss in Acropora intermedia and Porites lobata reared under natural light and summertime temperature conditions. Iguchi et al. (2012) also reported that the Fv/Fm values of massive Porites decreased in acidified seawater, although the endosymbiont density and chlorophyll content did not change. The discrepancy of the effect of OA on endosymbionts between the results of Anthony et al. (2008) and other studies indicates that the effect of OA on endosymbionts differs among coral species in the same locality or among localities containing the same species.
Some caveats should be considered, as below. Consideration of the intraspecific variability in response to OW and OA is needed for a more accurate comparison between the species in future studies. In other words, insufficient consideration of the variability limits the outcomes of the present study. Previous studies have shown significant variation within coral species in response to stresses, including OW and OA. For example, Shaw et al. (2016) found that net calcification was significantly variable at high temperature among colonies, but it was not variable at high pCO2 in the coral Acropora pulchra in Moorea, French Polynesia. Sekizawa et al. (2017) reported significant intra- and interspecific variation in response to OA in the corals M. digitata and Porites cylindrica in Okinawa; they showed that the calcification rate was even higher at high pCO2 conditions than at the ambient conditions in a few colonies of M. digitata. For incorporating the intraspecific variations to future studies, donor colonies, or genotypes, of nubbins should be distinguished throughout the experiments, and variability within species should be examined first; then, interspecific differences could be analyzed. Jury, Delano & Toonen (2019) found that the mean calcification rate decreased by experimental acidification in eight coral species in Hawaii and argued that substantial individual variability might be hidden when only mean calcification was compared among the species. Thus, the intraspecific variability should be added to the mean responses of each species. Experimental conditions such as the duration of experiments (e.g., Kroeker et al., 2013), light intensity (e.g., Smith & Birkeland, 2007), nutrient concentration (e.g., Kitchen et al., 2020), which may cause the variation within species, should also be considered in future studies. Variation in light intensity may also affect the interspecific variation in response to OW and OA; the synergistic effect of strong light with high temperature on coral bleaching has been well known (e.g., Hoegh-Guldberg & Williamson, 1999), and a few studies have shown that the effect of OA may vary with light intensity (Dufault et al., 2013; Suggett et al., 2013; Nakamura et al., 2017). Light intensity thus should also be considered in interspecific comparison of the effect of OW and OA in corals.
Conclusions
The effects of OW and OA on the calcification rate of the corals A. digitifera and M. digitata were examined at three temperatures (28 °C, 30 °C, and 32 °C) and four pCO2 treatments (400, 600, 800, and 1,000 µatm). Acropora digitifera was more heat-sensitive than M. digitata, whereas the former was less sensitive to elevated pCO2 than the latter. Sensitivity differences to thermal stress between A. digitifera and M. digitata might be mainly related to differences in the species of endosymbionts in the host coral. The differences in acidification stress between the two species may be attributable to the calcification rate and skeletal density; M. digitata showed higher calcification rates under ambient pCO2 conditions and had higher skeletal density than A. digitifera. We suggest that OW and OA mainly affected the physiology of the endosymbionts and host corals, respectively, in both species.