
On the classification of Microsoft-Windows ransomware using hardware profile
- Published
- Accepted
- Received
- Academic Editor
- Yu-Dong Zhang
- Subject Areas
- Artificial Intelligence, Data Mining and Machine Learning, Scientific Computing and Simulation, Security and Privacy, Operating Systems
- Keywords
- Malware, Ransomware, Performance counters, Classification, Machine learning
- Copyright
- © 2021 Aurangzeb et al.
- Licence
- This is an open access article distributed under the terms of the Creative Commons Attribution License, which permits unrestricted use, distribution, reproduction and adaptation in any medium and for any purpose provided that it is properly attributed. For attribution, the original author(s), title, publication source (PeerJ Computer Science) and either DOI or URL of the article must be cited.
- Cite this article
- 2021. On the classification of Microsoft-Windows ransomware using hardware profile. PeerJ Computer Science 7:e361 https://doi.org/10.7717/peerj-cs.361
Abstract
Due to the expeditious inclination of online services usage, the incidents of ransomware proliferation being reported are on the rise. Ransomware is a more hazardous threat than other malware as the victim of ransomware cannot regain access to the hijacked device until some form of compensation is paid. In the literature, several dynamic analysis techniques have been employed for the detection of malware including ransomware; however, to the best of our knowledge, hardware execution profile for ransomware analysis has not been investigated for this purpose, as of today. In this study, we show that the true execution picture obtained via a hardware execution profile is beneficial to identify the obfuscated ransomware too. We evaluate the features obtained from hardware performance counters to classify malicious applications into ransomware and non-ransomware categories using several machine learning algorithms such as Random Forest, Decision Tree, Gradient Boosting, and Extreme Gradient Boosting. The employed data set comprises 80 ransomware and 80 non-ransomware applications, which are collected using the VirusShare platform. The results revealed that extracted hardware features play a substantial part in the identification and detection of ransomware with F-measure score of 0.97 achieved by Random Forest and Extreme Gradient Boosting.
Introduction
Over the past several years, an exponential increase has been reported in ransomware attacks. Ransomware is the sub-class of malware that hijacks a device and blocks the victim to access the data until a compensation of some form is made. Typically, this compensation is in the form of money to concede access back to the victim. Ransomware has the ability to harmfully affect various kinds of devices such as personal computers, servers, smartphones, tablets, etc. For instance, multiple new variants of ransomware including WannaCry, JAFF, Petya have been reported in 2017 (Hampton, Baig & Zeadall, 2018). On 12 May 2017, within the span of a few hours, the WannaCry ransomware (Maurya et al., 2018) infected more than 70,000 desktop devices in over 150 countries across the globe (Grant & Parkinson, 2018).
The financial loss incurred due to ransomware can be quite devastating. For instance, CryptoWall_v3 ransomware (Ali, 2017; Sgandurra et al., 2016) caused the loss of an estimated $325 million in the US from November 2015 to June 2016.). In 2018, it was reported that 45% of the companies paid a ransom to recover the data stored on infected machines, which increased to 58% in the year 2019 (Ramesh & Menen, 2020). Another ransomware attack, triggered by CryptoWall_v4 ransomware resulted in a loss of $7.1 million worldwide (Ali, 2017). Recently reported ransomware attacks involving NotPetya and WannaCry are estimated to inflict the costs around $18 billion (Davies, Macfarlane & Buchanan, 2020). These attacks wreaked havoc in systems of various world organizations by halting and damaging their daily operations. It seems that losses caused by ransomware will probably exceed $20 billion by the end of the year 2021 (shown in Fig. 1) as reported by the Global ransomware-protection report (Ramesh & Menen, 2020; Chung, 2019).

Figure 1: Estimation and projection of losses (in Billions USD) caused by different ransomware between 2015 and 2021 (Ramesh & Menen, 2020; Chung, 2019).
Although, malware is deemed a great threat over the years, yet ransomware is an even more daunting threat compared to other malware due to its attacking and demanding nature (i.e., expecting a ransom in return). The classification of ransomware from traditional malware is essential because of their higher damaging impact in terms of informative data and financial loss. Compared to typical malware, it is challenging to identify and kill ransomware even when it is discovered, and the damage can be potentially irreparable even after its deletion Al-rimy, Maarof & Shaid (2018) and Zhang et al. (2019). Hence, we require proactive and aggressive techniques to handle ransomware. Moreover, it is very challenging to recognize and isolate the malware from ransomware due to the similarity in nature. A ransomware is more menacing than malware, as it not only damages the system and results in loss of control from the system but also demands compensation in return. Therefore, there is a need to have the proper distinction of ransomware from other malware (Aurangzeb et al., 2017; Kok et al., 2019; Zhang et al., 2019) to save billions of dollars in financial losses (Davies, Macfarlane & Buchanan, 2020).
Before analyzing the ransomware, one of the mandatory steps is the accurate identification of a particular type of ransomware and differentiating it from other typical malware. Broadly, malware analysis techniques are categorized as (1) static and (2) dynamic analysis (Chen et al., 2017). Besides, various researchers have employed the combinations of static and dynamic techniques in the form of hybrid analysis techniques. The procedure of scrutinizing a potential malware without executing the program is referred to as static analysis, whereas, the analysis performed via observing the execution behavior of a malware is known as dynamic analysis. Most contemporary state-of-the-art dynamic analysis techniques detect and classify ransomware that hides itself using various obfuscation techniques such as packed programs, compressed, or data transformation, indirect addressing, etc. (Behera & Bhaskari, 2015). A ransomware employs different hijacking strategies such as behaving like an adware resulting in unwanted advertisements or hiding itself using rootkits to bypass Anti-Viruses (AV) (Demme et al., 2013). A rootkit is a malware that alters the operating system (OS) and resides in the system for a prolonged period (Aurangzeb et al., 2017). Today, various anti-viruses tackle malware to dampen their caused and expected damages. However, the techniques employed by the anti-viruses are often limited to the prior knowledge (e.g., signatures, etc.) and there is a need to have more comprehensive dynamic analysis that could detect ransomware, employing the obfuscation techniques (Demme et al., 2013), utilizing hardware performance counters.
Hardware Performance Counters (HPCs) have been typically used by the programmers to analyze and measure the performance of applications and to identify the execution bottlenecks of a program (Beneventi et al., 2017; Kuruvila, Kundu & Basu, 2020). Initially, HPCs have been employed for investigating the static and dynamic analysis of programs to detect any malicious amendments as mentioned in Alam et al. (2020) and Malone, Zahran & Karri (2011). Several studies (Das et al., 2019; Demme et al., 2013; Singh et al., 2017; Wang et al., 2016) discuss potential implications of using HPC for application analysis, and the majority of them suggest that hardware execution profile can effectuate the detection of malware (Demme et al., 2013; Singh et al., 2017; Wang et al., 2016; Kuruvila, Kundu & Basu, 2020). Another study (Xu et al., 2017) has utilized the hardware execution profiles to detect malware using machine learning algorithms, as malware changes data structures and control flow, leaving fingerprints on accesses to program memory. In this respect, they proposed a framework for detecting malware from benign applications that uses machine learning to classify malicious behavior of malware based on access patterns of virtual memory. Zhou et al. (2018) investigated whether HPCs are useful in differentiating the malware from benign applications. However, the study did not consider malware as ransomware. However, utilizing the hardware performance measurements and the profile of the low-level execution behavior has not been previously studied for the analysis and detection of ransomware applications. We argue that ransomware reveals itself by exhibiting peculiar patterns in HPCs (e.g., through clock cycles, cache misses and hits, branch instructions and misses, retired instructions, etc.).
In this article, we present a framework based on dynamic analysis that mainly focuses on the classification of ransomware from non-ransomware. This article contemplates HPCs to detect Microsoft Windows-based ransomware by analyzing the execution behavior of ransomware. We primarily focus to determine the potential use of HPCs in analyzing and proactively detecting ransomware. Moreover, the classification of ransomware from malware is imperative because the damages caused by ransomware drastically ensure the data and monetary loss. To address this concern, we propose a mechanism that utilizes the application execution profile for the classification and detection of ransomware from non-ransomware. For classification, the application’s hardware related performance features are extracted from the data set of 160 malware (consisting of 80 ransomware and 80 non-ransomware). Afterward, these features are fed to some well-known machine learning classification models such as Decision Tree (Kohavi, 1996), Random Forest (Liaw & Wiener, 2002), Gradient Boosting (Friedman, 1999) and Extreme Gradient Boosting (XGBoost) (Chen & Tong, 2021). These four classifiers are generally used for classification tasks of various applications including spam detection, face recognition and financial predictions (Jordan & Mitchell, 2015; Kuruvila, Kundu & Basu, 2020), etc. We employ these four classifiers as part of the proposed methodology to analyze their performance for ransomware detection. These models perform binary classification of malicious software into ransomware or non-ransomware classes. In summary, the main contributions of this article are as follows:
-
In-depth analysis of the current state-of-the-art to identify the merits and demerits of several existing approaches;
-
A novel mechanism for the classification and detection of malicious applications into ransomware and non-ransomware; and
-
An empirical investigation of the HPCs against state-of-the-art dynamic techniques using machine learning classifiers;
The outcomes revealed that both the random forest and extreme gradient boosting classifier has outperformed decision tree and gradient boosting by attaining accuracy of 0.97 for classification.
The rest of the article is organized as follows. “Related Work” describes the related work. “Motivation and Methodology” presents the proposed methodology, dataset and feature extraction mechanism. In “Results and Discussion”, the experimental setup details, results and related discussions are presented and “Conclusions” concludes the article.
Motivation and methodology
The dynamic analysis holds adequate potential to accurately detect the threat of ransomware because an executable program cannot hide its true characteristic. Therefore, most of the anti-virus vendors rely on automated dynamic analysis mechanisms to detect new variants of ransomware. Most of the antiviruses apply the heuristics combined with the behavior analysis to deduce whether an executable is benign or malware (Sgandurra et al., 2016).
A wide range of HPCs that is, clock cycles, cache hits, cache misses, branch instructions, branch misses, retired instructions, etc. are used to observe the behavior of an executing application (Chiappetta, Savas & Yilmaz, 2016). Usually, the symmetric encryption marks the cache-based events while the asymmetric encryptions do have an impact on the instruction and branching events as explained in Alam et al. (2020). HPCs have been harnessed by many application developers to identify the computation and memory bottlenecks to improve the performance and reliability of the executing applications (Chiappetta, Savas & Yilmaz, 2016). In this study, we utilize 11 performance counters for the classification of ransomware. For classification, we train the employed machine learning classifiers to analyze the dynamic behavior of ransomware and non-ransomware malicious programs. Moreover, the classification of Ransomware from Traditional Malware is essential due to the intensity of the damage caused in terms of financial loss. Unlike traditional malware, it is more troublesome to identify and kill ransomware even when it is discovered, and the damage is irreparable even after its removal Al-rimy, Maarof & Shaid (2018) and Zhang et al. (2019). Hence, it is very important to recognize and isolate the malware from ransomware due to the similarity in nature. Therefore, it is required to devise a formal classification mechanism to discriminate ransomware from other non-ransomware Zhang et al. (2019) Aurangzeb et al. (2017) and Kok et al. (2019) to avoid billions of transactions in the name of ransom.
Dataset collection
For the experimentation, we have obtained randomly selected 160 Windows-based malware from VirusShare. VirusShare repository provides the dataset related to ransomware and many other types of malicious applications of the Windows platform (in addition to the other platforms such as Android, Linux, etc.). It is frequently updated and at presently contains the latest malicious applications contributed by the community (Kouliaridis & Kambourakis 2020). Due to the diversity, the VirusShare platform is very popular in the research community. We collected the dataset from VirusShare related to Windows-based malicious applications. After static analysis of the downloaded applications, obfuscated applications are eliminated. Afterward, each malware is labeled as a non-ransomware or ransomware based on the analysis data provided by many renowned anti-viruses available via VirusShare. These labels are further validated with the tags available from VirusShare for the sake of confirmation. In this study, benign binary files are not considered because the main aim of the study is to classify between ransomware and other malicious applications. Therefore, we consider the malicious applications category Trojan (as a non-ransomware sample) due to their similarity in activities with the ransomware (Gazet, 2010). The employed classifiers are trained using the behavioral features for ransomware and non-ransomware with explicit labeling (i.e., Ransomware/Non-Ransomware). Furthermore, a disjoint data set is used for training and testing purposes.
Feature extraction
All malware in the data set are executed in a quarantine environment and their data related to hardware performance counters are collected using perf (an instrumentation and performance analysis tool (De Melo, 2010; Weaver, 2013; Alam et al., 2020)). To ensure the reliability and accuracy of the results, the mean values of three rounds of experiments are reported. We executed each application three times in a virtual machine (i.e., VMWorkstation 12 Pro 12.1.1 build 3770994) for no longer than 240 s with different input parameters to emulate a real interactive environment. After the execution of each malicious application, the virtual machine is reset to its original state using the snapshot feature (to ensure the performance counter trace collected during the previous execution do not intermingle with the current execution).
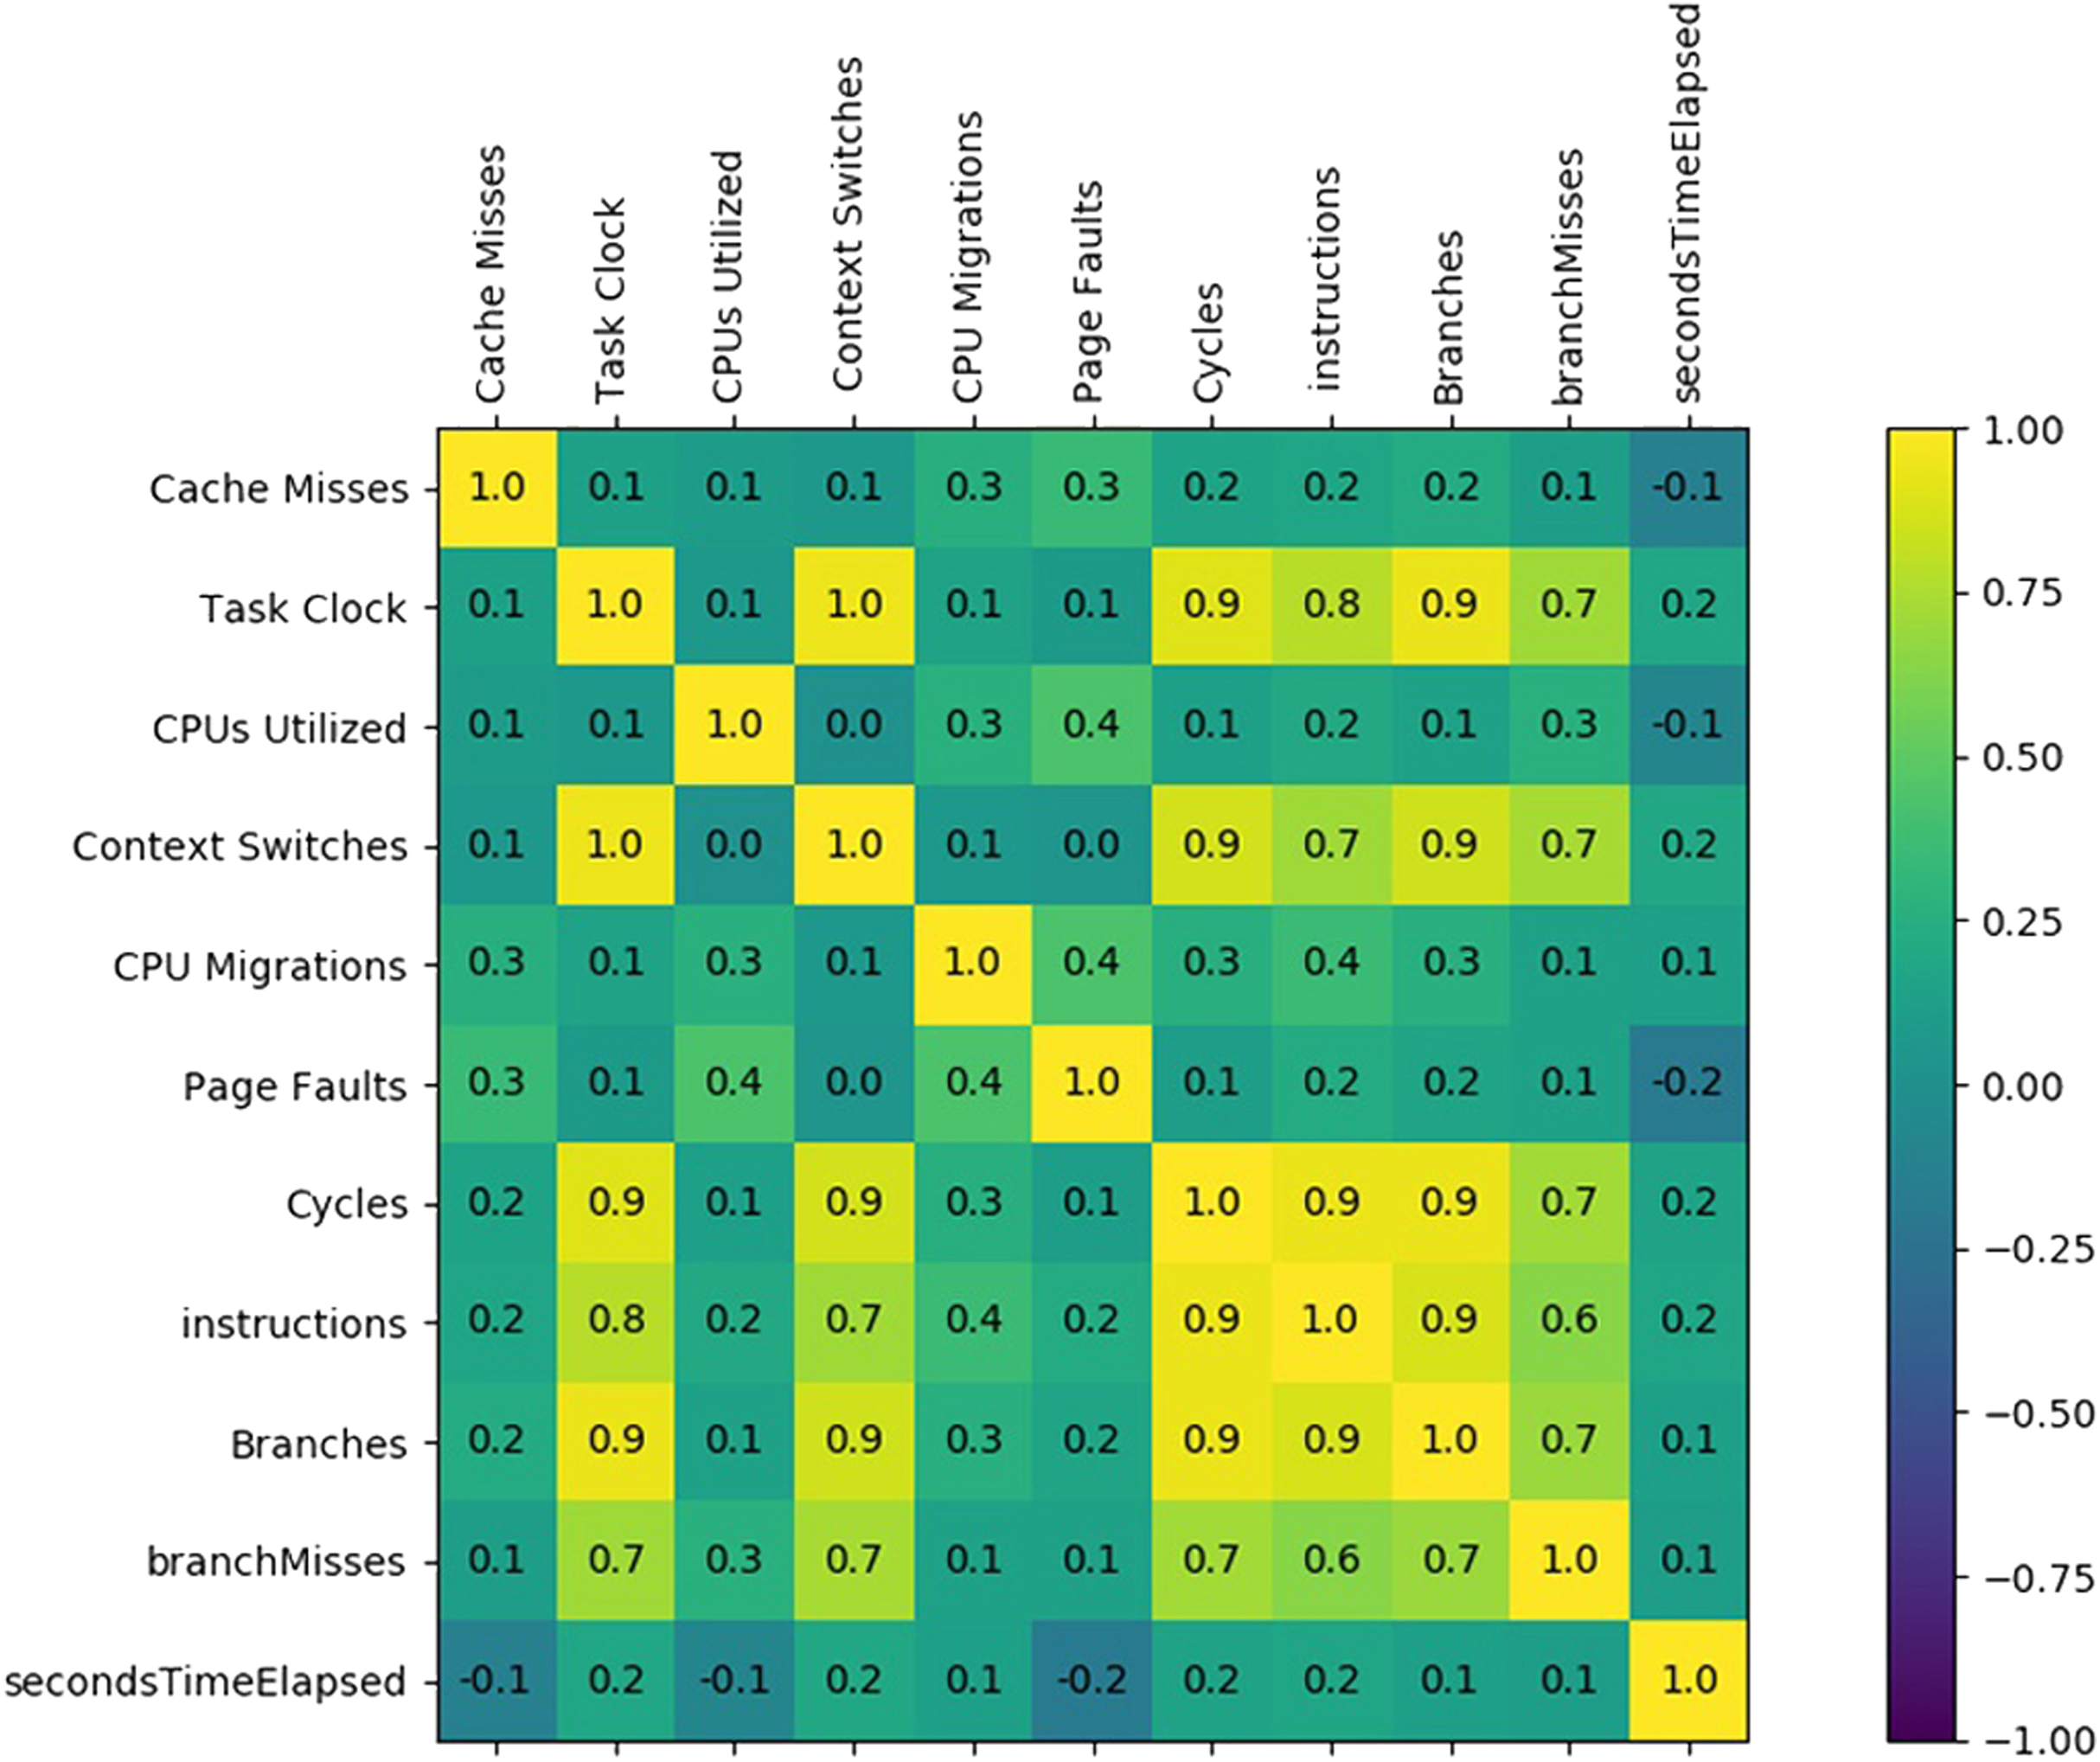
For binary classification problem discussed above, we employ hardware performance counters as features, that is, (1) task clock, (2) context switching, (3) CPU utilized, (4) CPU migrations, (5) page faults, (6) CPU cycles, (7) cache-misses, (8) instructions retired, (9) branches taken, (10) branch-misses and (11) execution time, (illustrated in Table 2) to train the machine learning classifier. We have executed ransomware applications on a PC within a virtual machine and recorded the features (i.e., hardware performance counters, etc.) using perf. The perf library provides the hardware performance counters related values representing the involvement of the several important hardware features of the processor during execution. Feature selection plays a significant role in achieving precise training of the employed machine learning models; thereby attaining accurate results with efficient performance and low overhead (Li et al., 2017). A correlation matrix among the employed features is generated to analyze the pattern that leads to the selection of features. Two features are considered negatively correlated if a change of one feature inversely impacts the value of the other feature. The features correlation analysis is presented in Fig. 2. If two numerical features are highly correlated, then one of them can be ignored. Therefore, we employed a sub-set of those features which are not co-related to reduce the computation overhead during the training process of the machine learning models. Figure 2 shows that the Cache Misses related hardware feature have a low positive correlation with all the other features. On the other hand, the Task Clock feature has a strong relationship with the Context Switches, Cycles, Instructions, Branches, and Branches Misses. The features having higher rank are deemed as potential features for classification than low ranked features as shown in Table 3.
| S.no | Hardware features | Description |
|---|---|---|
| 1 | Task-clock | The task-clock shows the amount of time spent on the task (Kuznetsova et al., 2017) |
| 2 | CPU utilization | CPU-clock is based on the total time spent on the CPU |
| 3 | Context switching | explains how many times the software switched off the CPU from one process/thread to another (Kuznetsova et al., 2017) |
| 4 | CPU migration | CPU migration describes equality in a workload distribution across all cores. (Kuznetsova et al., 2017) |
| 5 | Page faults | Page-faults occur when a program’s virtual content has to be copied to the physical memory (Kuznetsova et al., 2017) |
| 6 | Instructions per cycle | The average number of instructions executed for each clock cycle |
| 7 | Branch | A branch is an instruction in a computer program that can cause a computer to begin executing a different instruction sequence and thus deviate from its default behavior of executing instructions in order |
| 8 | Branch misses | Branch misprediction occurs when a processor mispredicts the next instruction to process in branch prediction, which is aimed at speeding up execution. |
| 9 | Cycles | Perf-CPU-cycles is a count of CPU cycles that traces to a hardware counter (Flater, 2014) |
| 10 | Cache misses | Cache misses is a state of not getting data that is being processed by a component or application that is not found in the cache. |
| 11 | Total time elapsed | It is the total execution time in seconds |

Figure 2: Feature set correlation analysis.
| Rank | Score | Feature |
|---|---|---|
| 1 | 0.20145 | Cache misses |
| 2 | 0.181887 | TaskClock |
| 3 | 0.153562 | Branches |
| 4 | 0.10867 | SecondsTimeElapsed |
| 5 | 0.086973 | Instructions |
| 6 | 0.085666 | BranchMisses |
| 7 | 0.044272 | ContextSwitches |
| 8 | 0.042727 | PageFaults |
| 9 | 0.040087 | CPU migration |
| 10 | 0.028564 | Cycles |
| 11 | 0.026142 | CPUsUtilized |
In the training phase, hardware features are extracted by executing known malware and non-malware application in containing environment system units as shown in Figs. 3A and 3B. A total of 80% of the employed data set is used for training and 20% is used for testing. We have used K-fold (k = 10) cross-validation mechanism and compare the ransomware detection accuracy of different classifiers to make sure that the dataset is used uniformly without any biasness. This results in un-biased training and testing cycles producing the results on which we could conclude with confidence. For each cycle of the training/testing, a 20% testing and 80% training partition was employed. The goal of supervised machine learning techniques is to find a function that is trained using the employed features such that the error is minimum for the new or unseen data. In the training phase, the classification model is trained using the HPCs as shown in Table 2. The testing or validation methodology is performed after the training of the classifiers.
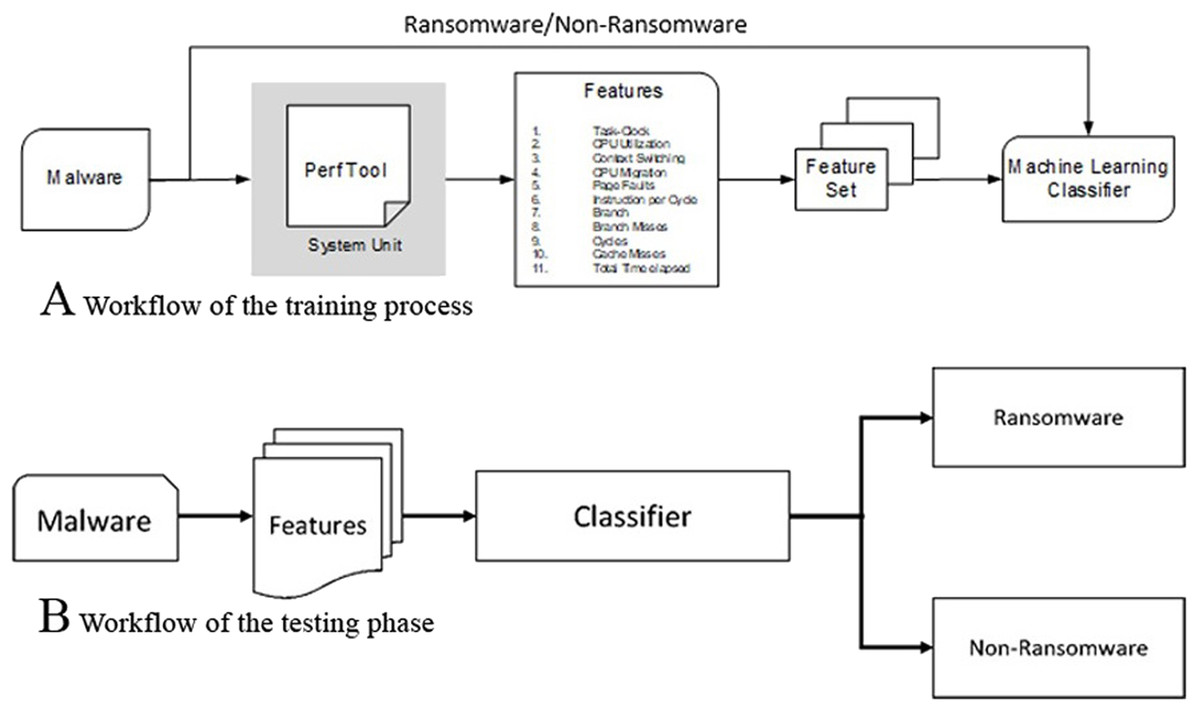
Figure 3: Feature extraction workflow for training and testing phases: (A) Workflow of the training process, (B) workflow of the testing phase.
Classification model
The machine learning classification algorithms namely Decision Tree, Random Forest, Gradient Boosting and Extreme Gradient Boosting are used for classification purposes such as phishing detection, facial recognition and financial predictions (Jordan & Mitchell, 2015), etc. We employ these four classifiers as part of the proposed methodology to analyze their performance for ransomware detection.
The decision tree is a tree-based classifier, which contains a root, internal nodes, and leaf nodes. The class label is assigned to each leaf node and the decisions are rendered by the internal nodes (Tan, Steinbach & Kumar, 2006). Random Forest (RF) classifier is based on a combination of multiple decision tree predictors such that each tree depends on the values of a random vector sampled independently and with the same distribution for all trees in the forest (Xuan et al., 2018). The Extreme Gradient Boosting XGBoost and Gradient Boosting follow the same basic principle however, there are a few differences in their modeling details. Specifically, extreme gradient boosting utilizes a more regularized model formalization to control the over-fitting problem that may occur due to linear fitting over noisy data to provide better performance (Jbabdi et al., 2012). For the Decision Tree and Random Forest, the maximum tree depth is set as 2 to ensure that under-fitting issues are avoided. To achieve a smoother curve, the bagging technique is applied to the Random forest mechanism where each of the trees executes in a parallel way thus making a forest. As each tree is independent, therefore, the whole forest result is taken for the analysis (resulting in a smoother curve) To avoidover-fitting issues, we have evaluated our proposed technique using K-fold (k = 10) cross-validation. The first fold is evaluated with the other folds and the second time it executes, it takes the first and second fold to be compared with the rest, this goes on until 80% of training data is compared against 20% of the test data.
Results and discussion
For experimentation, we utilize a system with Intel core i7 processor, 8 GBs of memory, and Ubuntu 12.10 OEM as an operating system. For classification, a machine learning tool Scikit-learn (Pedregosa et al., 2011; Black et al., 2020), is employed. To evaluate the results, standard evaluation measures that is, precision, recall, and F-Measure are calculated to determine the accuracy of each classifier. Equations (1)–(4) provide the mathematical description of accuracy, precision, recall, and f-measure, respectively. The terms used in Eqs. (1)–(4) are explained as follows: True Positive (TP) rate shows the number of predicted positives that are correct, while the False Positive (FP) rate refers to the number of predicted positives that are incorrect. Similarly, True Negative (TN) rate shows the number of predicted negatives that are correct while the False Negative (FN) rate refers to the number of predicted negatives that are incorrect. The recall is the sensitivity for the most relevant result. F-measure is the value that estimates the entire system performance by calculating the harmonic mean of precision and recall. The maximum value of 1.000 for accuracy precision and recall indicates the best result (Narudin et al., 2016).
(1) Precision denotes the proportion of Predicted Positive cases that are correctly Real Positives.
(2) The recall is the proportion of Real Positive cases that are Predicted Positive
(3)
(4) Receiver Operating Characteristic (ROC) curves (Metz, 1978; Dion & Brohi, 2020) are extensively being applied in significant researches to measure the accuracy of the machine learning models that are being trained to achieve actual performance (Bradley, 1997). Furthermore, ROC curves are applied in numerous systematic approaches that merge multiple clues, test results, etc., and are plotted and evaluated to characterize a qualitative feature of the particular. ROC is a plot wherein Y-axis is reserved for True Positive Rate (TPR) and X-axis is reserved for False Positive Rate (FPR). For all possible classifications such as the output class, the TPR rate depends on the set-up where the real classification is considered to be as positive and the number of times the classifier has predicted the result to be as positive. The FPR can be defined as how the classifier incorrectly labeled positive to those that are classified to be negative. Together the TPR and FPR values lie in-between 0 and 1 (1 indicating an accurate prediction).
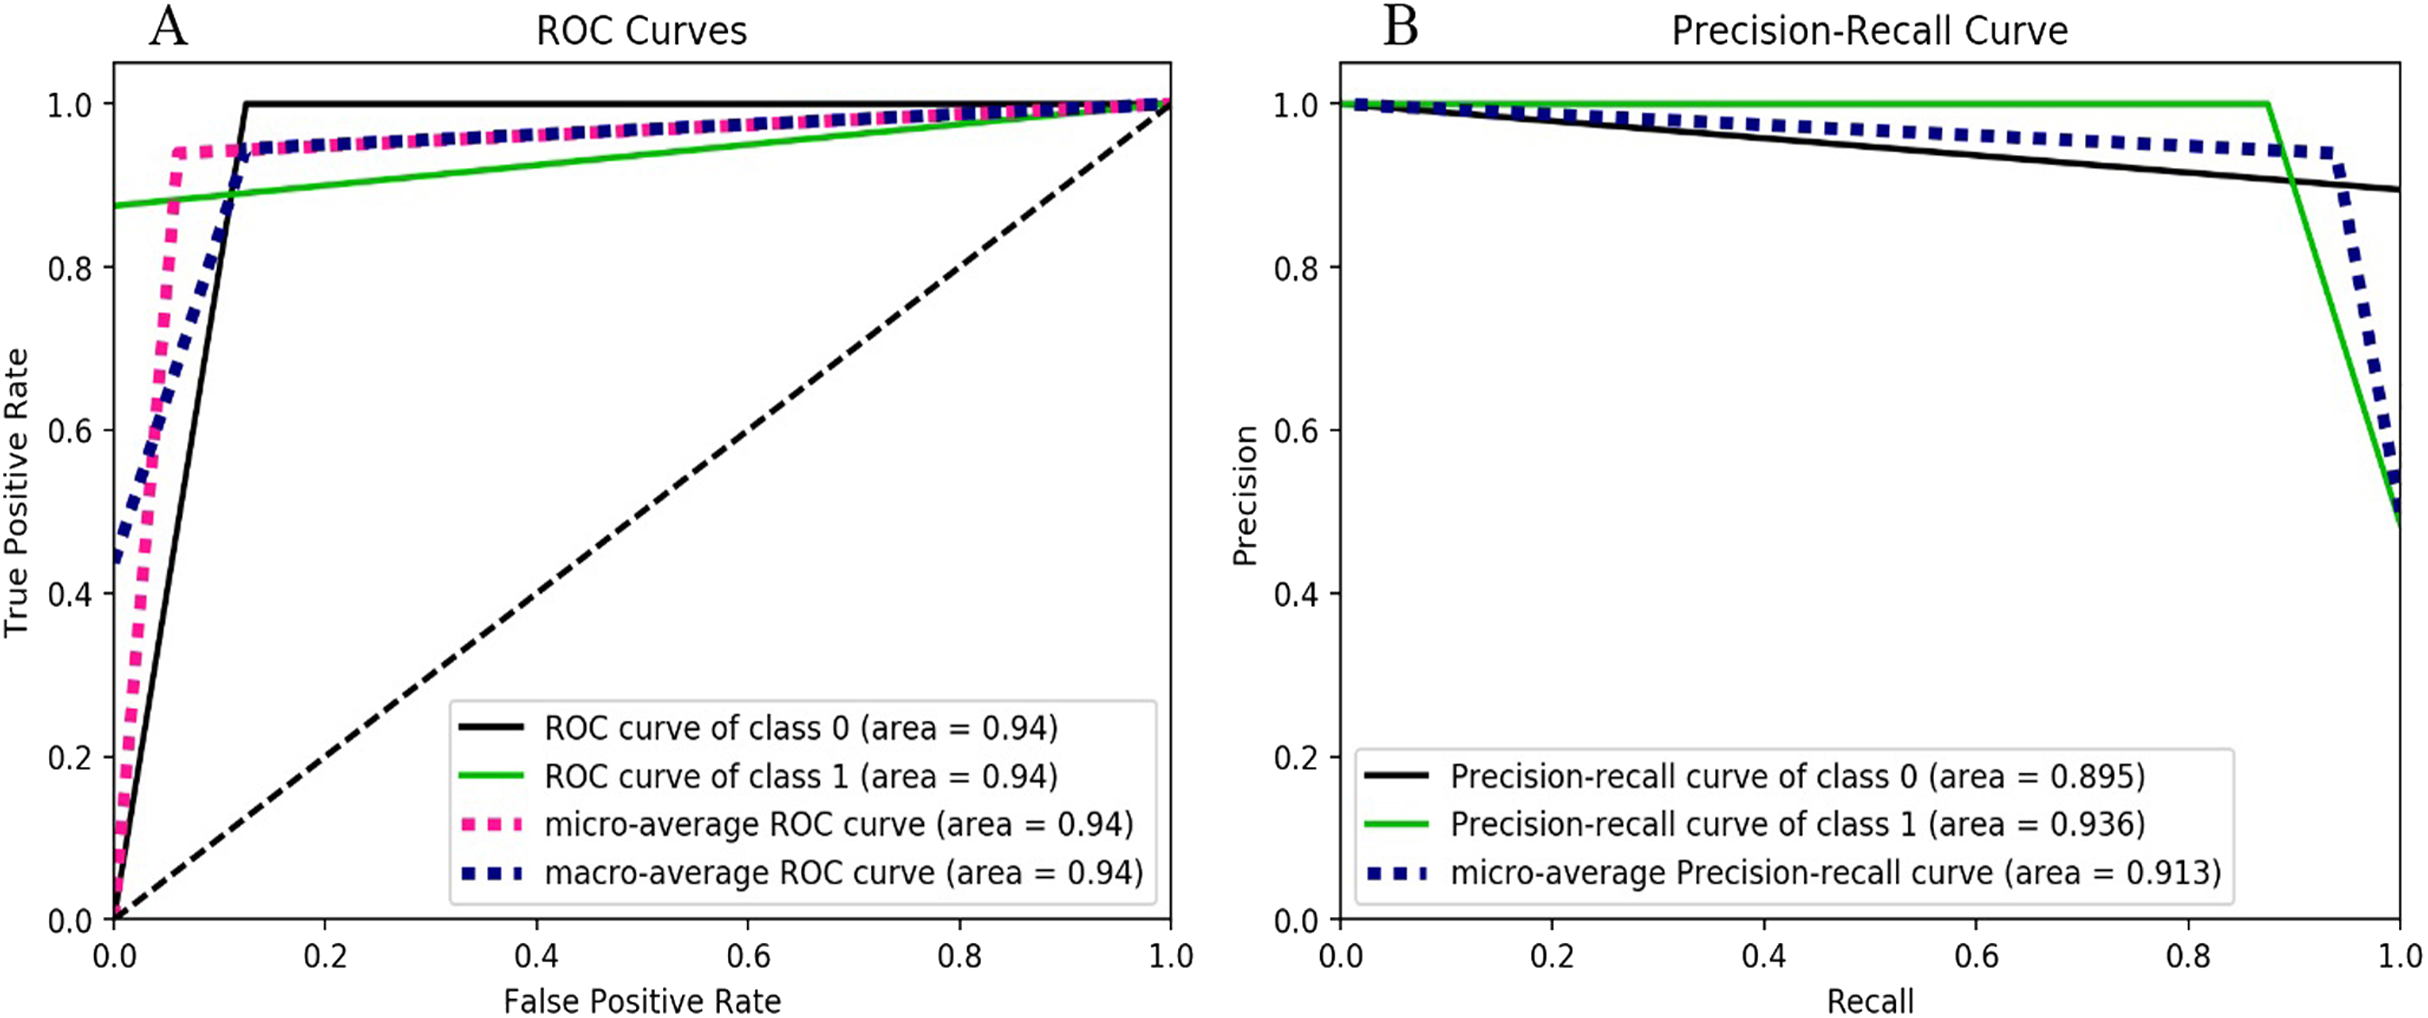
The results based on the decision tree classifier can be seen in Fig. 4. The ROC curve for both classes (i.e., ransomware as class “1” and non-ransomware as class “0”) is the same having value of 0.94 which signifies the excellent prediction. However, the precision-recall curve for class 0 that is, for Non-Ransomware shows accuracy of 0.89 or 89% whereas for class 1 that is, ransomware the accuracy is 0.93. The F-measure score of the Decision Tree is 0.94 as shown in Table 4.

Figure 4: Decision-tree performance metrics behavior, (A) ROC curves for the classes 0 and 1, (B) Precision-Recall curve for the classes 0 and 1.
| Malware class | Precision | Recall | F-measure |
|---|---|---|---|
| Ransomware (class label 1) | 1.0 | 0.88 | 0.93 |
| Non-Ransomware (class label 0) | 0.89 | 1.0 | 0.94 |
The results obtained using the Random Forest classifier for two classes (i.e., ransomware and non-ransomware) are shown in Fig. 5 and F-measure score is illustrated in Table 5. The higher accuracy results are evident from the similar ROC curve value that is, 0.99 for both the ransomware and non-ransomware classes.
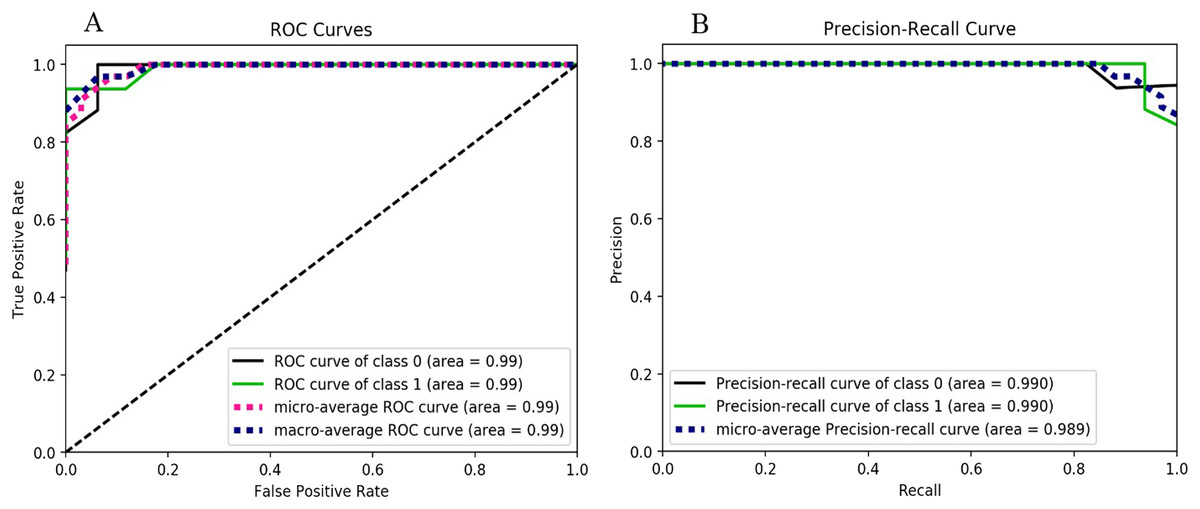
Figure 5: Random forest performance metrics behavior, (A) ROC curves for the classes 0 and 1, (B) Precision-Recall curves for the classes 0 and 1.
| Malware class | Precision | Recall | F-measure |
|---|---|---|---|
| Ransomware (class label 1) | 1.0 | 0.94 | 0.97 |
| Non-Ransomware (class label 0) | 0.94 | 1.0 | 0.97 |
The results depicting the performance of gradient boosting, shown in Fig. 6, reveal that the ROC curve values for both the classes (i.e., ransomware and non-ransomware) as well as (i.e., 1.0) the precision-recall curves of both classes follow similar pattern of high accuracy. The F-measure score of the gradient boosting classifier is 0.93 for ransomware and 0.94 for non-ransomware (as shown in Table 6).

Figure 6: Gradient boosting performance metrics behavior: (A) ROC curves for the classes 0 and 1. (B) Precision-Recall curves for the classes 0 and 1.
| Malware class | Precision | Recall | F-measure |
|---|---|---|---|
| Ransomware (class label 1) | 1.0 | 0.88 | 0.93 |
| Non-Ransomware (class label 0) | 0.89 | 1.0 | 0.94 |
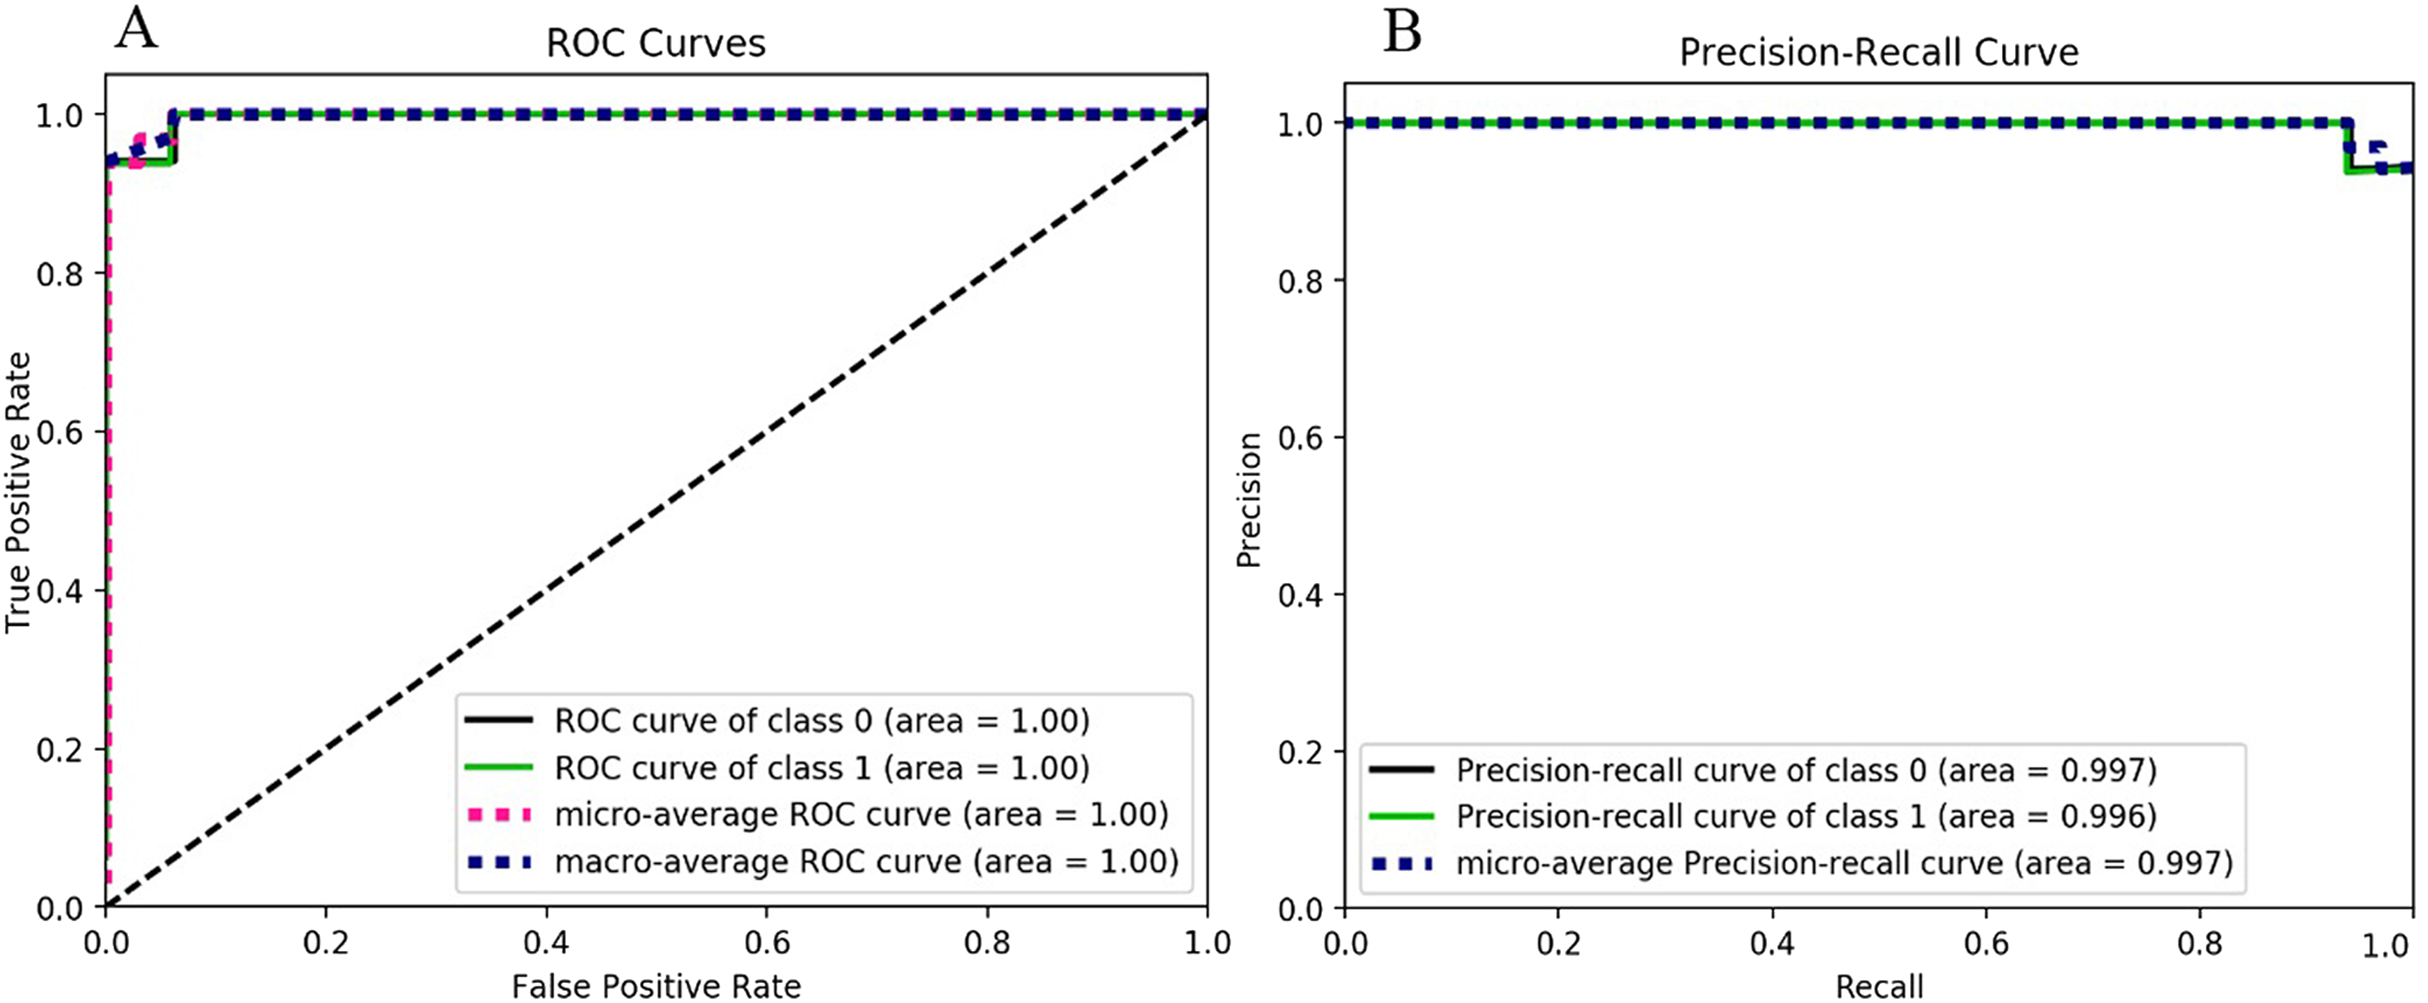
The extreme gradient boosting classification model-based results are shown in Fig. 7 and Table 7. The ROC curve and Precision-Recall Curve of both classes (i.e., ransomware and non-ransomware) are the same (i.e., 1.0). The extreme gradient boosting based model’s F-measure score is 0.97, which is similar to the gradient boosting and random forest-based classification as shown in Table 8. The Random Forest-based classification model outperformed decision tree-based classification by attaining the accuracy of 0.94, as shown in Table 8. However, the value of the F-measure for both the classes is 0.97 (as shown in Table 8). The model has attained an improvement of 3% than the decision tree-based classification. The model shows similar F-measure results of 0.97 as observed for random forest and extreme gradient boosting.

Figure 7: Extreme gradient boosting performance metrics behavior: (A) ROC curves for the classes 0 and 1. (B) Precision-Recall curves for the classes 0 and 1.
| Malware class | Precision | Recall | F-measure |
|---|---|---|---|
| Ransomware (class label 1) | 1.0 | 0.94 | 0.97 |
| Non-Ransomware (class label 0) | 0.94 | 1.0 | 0.97 |
| Classifier | F-measure |
|---|---|
| Decision Tree | 0.94 |
| Random Forest | 0.97 |
| Gradient Boosting | 0.94 |
| Extreme Gradient Boosting | 0.97 |
This study has demonstrated the possibility of exploiting HPCs as the potential features for ransomware detection. After analyzing the sets of ransomware and non-ransomware, the features obtained from HPCs have been analyzed to classify malicious applications into ransomware and non-ransomware categories using several machine learning algorithms such as Decision Tree, Random Forest, Gradient Boosting and Extreme Gradient Boosting. The results of detailed experiments as stated earlier in the section have revealed that extracted hardware features play a significant role in the detection and identification of ransomware. Among all the employed machine learning classifiers, the random forest-based model and extreme gradient boosting have outperformed by yielding F-measure score of 0.97 followed by a decision tree that achieved 0.94 F-measure. Moreover, the features cache misses, task clock, and branches obtained through HPCs could be deemed as potential parameters in classifying ransomware from non-ransomware.
Conclusions
In this article, the analysis of HPCs has been presented for Windows ransomware classification. The results have revealed that the HPCs hold the considerable potential to expose hidden indicators of the executing applications such as malicious codes and ransomware. Performance counters, that is, cache misses, task clock and branches have played a pivotal role in classifying ransomware in a way that if there are a high number of cache misses or a high number of branch mispredictions (where control flow becomes detectably anomalous) are good indicators that help in indicating a potential attack (Foreman, 2018). The proposed technique holds adequate potential to provide sufficient detection accuracy by attaining the F-measure score of 0.97. This study demonstrated the possibility of exploiting HPCs as the potential feature for the detection of ransomware. However, this topic needs further investigation. In the future, we intend to scrutinize other dynamic features with the combination of call graphs to detect and classify ransomware. Moreover, the application of machine learning algorithms has shown very promising results in ransomware detection. In the future, we will expand this study to perform in-depth static analysis as well as dynamic analysis with the combination of HPCs in the detection of that ransomware that usually hides by implementing various obfuscation techniques (like packed or compressed programs, or indirect addressing (Behera & Bhaskari, 2015)). One major challenge and limitation of this research is in ransomware detection of false positives and false negatives. Consider the case of Qwerty ransomware, which uses a benign GPG executable to perform encryption. Perhaps the proposed solution would correctly detect the GPG binary when used in this way, but we suspect it would also detect it in a benign case. Since in this work we did not evaluate benign executables, it is not clear how the system performs with software that performs encryption and/or compression tasks which is the limitation of this research that will be investigated in our future work. Moreover, the collected features are related to hardware-specific environments, so if the system having the same architecture then the trained classification models are applicable as it is. However, in case the hardware environment is different (i.e., different architecture) then we have to retrain our machine learning models for that specific hardware environment. This is one of the limitations of our proposed work that the machine learning models trained on specific architecture are not portable across other machine architectures. Moreover, due to the modest dataset deep learning mechanism at present are not applicable. However, in the future, we intend to extend our dataset to implement more robust Auto Denoising Encoders, which comprises of multiple layers of neural networks and are best-known for providing good accuracy.