
Older adults at high risk of HIV infection in China: a systematic review and meta-analysis of observational studies
- Published
- Accepted
- Received
- Academic Editor
- Bao-Liang Zhong
- Subject Areas
- HIV, Psychiatry and Psychology, Public Health
- Keywords
- HIV/AIDS, Older adults, China, Meta-analysis
- Copyright
- © 2020 Wang et al.
- Licence
- This is an open access article distributed under the terms of the Creative Commons Attribution License, which permits unrestricted use, distribution, reproduction and adaptation in any medium and for any purpose provided that it is properly attributed. For attribution, the original author(s), title, publication source (PeerJ) and either DOI or URL of the article must be cited.
- Cite this article
- 2020. Older adults at high risk of HIV infection in China: a systematic review and meta-analysis of observational studies. PeerJ 8:e9731 https://doi.org/10.7717/peerj.9731
Abstract
There is an increasing prevalence of human immunodeficiency virus (HIV) infection in older adults in China, but the findings across prevalence studies have been mixed. This is the first meta-analysis of the prevalence of HIV infection and its moderating factors in older adults in China. Two investigators systematically and independently searched both international (PubMed, PsycINFO, Web of Sciences and EMBASE) and Chinese (WanFang, CNKI, and CQVIP) databases. HIV infection rates in older adults were analyzed using the random-effects model. Altogether 46 studies were included in the analysis. The pooled prevalence of HIV infection in older adults was 2.1% (95% CI [1.9%–2.3%], I2 = 99.4%). Subgroup analyses revealed that men who have sex with men (MSM), hospital population samples, publications after 2014, studies conducted in the western region of China, and higher study quality were significantly associated with higher HIV infection rate. This meta-analysis found that the HIV infection prevalence in older adults is significantly higher than the general population in China. Attention should be given to this urgent public health issue, and effective HIV/AIDS preventive, screening and treatment measures are warranted in this population. PROSPERO: CRD42019124286.
Introduction
Human Immunodeficiency Virus (HIV) infection is a major public health challenge associated with high disease burden globally (Maartens, Celum & Lewin, 2014). In 2017, approximately 36.9 million people lived with HIV infection worldwide (UNAIDS, 2019). In China, the incidence of HIV was 4.1 per 100,000 individuals in 2018, which translates to approximately 56,993 newly infected persons (National Bureau of Statistics of China, 2018). Those who are at high risk of HIV infection include men who have sex with men (MSM) and younger adults (Knudson et al., 2018; Zhang et al., 2017b). In China, the highest HIV infection rate occurs in those aged between 20 and 40 years (Lu et al., 2008), but there has been an increasing prevalence in older adults recently, which is similar to trends in Western countries. For instance, around half of the people living with HIV were above 50 years old in the USA (High et al., 2012; Hosaka et al., 2019). In Europe, the number of adults aged 50 years or above living with HIV has been also growing (Seeley, 2017). A study in Chongqing, China found that the number of newly HIV infected persons aged over 50 years has increased six-fold from 1,091 in 2004 to 6,352 in 2015 (Zhang, Rongrong & Guohui, 2017a).
Epidemiological studies in China has found an increasing trend in the number and proportion of HIV infection among older adults (Xing et al., 2014). In the past decades, insufficient attention has been paid to older adults with HIV infection, with a lack of HIV risk reduction interventions (Cooperman, Arnsten & Klein, 2007; Crystal et al., 2003). Knowledge of safe sex activities and condom use are usually not addressed in older adults (Negin & Cumming, 2010), even though high risk sexual behaviors exist in this population (Crystal et al., 2003). In China, neglected sex education among older adults have been associated with unprotected sexual activities (Xing et al., 2014), which could increase the risk of HIV infection. On the other hand, the change in the age distribution of HIV infection in China could be partly due to the widespread use of free Highly Active Antiretroviral Therapy (HAART) in reducing transmission risk of HIV infection (Bhaskaran et al., 2008) among younger adults. Greater access to HIV clinics, free HAART treatment, and improved general healthcare service system in China have also increased their life expectancy therefore most are living to older adulthood (Greenbaum et al., 2008; Xing et al., 2014). These factors may also contribute to the growing proportion of older adults with HIV infection.
In order to develop appropriate strategies for HIV prevention and control, it is important to accurately determine the prevalence of HIV infection across different age groups. To date, no meta-analysis or systematic review of the prevalence of HIV infection in older Chinese adults has been published, which gave us impetus to conduct a meta-analysis to examine the prevalence and its associated factors in this population. In addition, we examined the association of demographic and clinical characteristics, such as sex and sexual orientation, with the prevalence of HIV infection in older adults using subgroup and meta-regression analyses. The target demographic and clinical characteristics were selected based on previous studies (Knudson et al., 2018; Zhang et al., 2017b).
Methods
Search strategy and selection criteria
This meta-analysis was performed according to the Preferred Reporting Items for Systematic Review and Meta-Analyses (PRISMA) (Moher et al., 2009). Both International (PubMed, PsycINFO, Web of Science, and EMBASE) and Chinese (WanFang, CNKI and CQVIP) databases were systematically and independently searched by two investigators (Yuan Yang and Chang Chen) from their inception date up to May 1, 2020. The following search terms were used: (“HIV” OR “AIDS” OR “human immunodeficiency virus” OR “acquired immune deficiency syndrome”) AND (“epidemiology” OR “prevalence” OR “rate” OR “proportion”) AND (“old” OR “older” OR “elderly” OR “aged” OR “aging”) AND (“Chinese” OR “China”). Reference lists of eligible studies and relevant review articles were also hand-searched.
The inclusion criteria were studies that: (1) reported prevalence of HIV infection in older adults or provided information to calculate the prevalence. The diagnosis of HIV infection was based on study-defined criteria; (2) were cross-sectional or cohort studies (only baseline data were included) with meta-analyzable data; (3) were conducted in older adults (i.e., aged 50 years and older) in China. Case series, reviews, and meta-analyses were excluded.
Outcome measures
The outcome measure of the meta-analysis was the prevalence of HIV infection in older adults. For each study, the prevalence was calculated by the number of HIV-infected older adults divided by the total number of older adults.
Data extraction
Systematic literature search and data extraction were independently conducted by the same two investigators. The titles and abstracts of potential publications were screened separately by the same two investigators before the full texts were read for eligibility. Any inconsistencies in the process were discussed and resolved by a third reviewer (Yuan-Yuan Wang). The following information was extracted: year of publication, survey period, study site, sampling method, sample size and response rate, mean age, sex, education, occupation, province, rural or urban area, definition of older adults (e.g., above 50 years), and transmission route (e.g., commercial sex).
Quality assessment
The same two investigators independently evaluated the methodological assessment, using the critical appraisal for epidemiological studies (Loney et al., 1998) that contains 8 items covering three aspects: sampling, measurement and analysis. The total score of this instrument is 8; the total score of 7–8 was considered as ‘high quality’, 4–6 as ‘moderate quality’, and 0–3 as ‘low quality’ (Loney et al., 1998). Any inconsistencies were resolved by a discussion with a third investigator.
Data analysis
The Comprehensive Meta-Analysis software, Version 2.0 (http://www.meta-analysis.com/) and Open Meta-Analyst (http://www.cebm.brown.edu/openmeta/) were used to synthesize data (DerSimonian & Laird, 1986) in all the meta-analytic outcomes. Due to different sampling methods, study designs and demographic and clinical characteristics between studies, the random-effects model was used (DerSimonian & Laird, 1986). The heterogeneity of outcomes were assessed using I2, with I2 > 50% as significant heterogeneity (Higgins et al., 2003). Following the recommendation of the Cochrane handbook (Higgins et al., 2019) and other studies (Li et al., 2020; Xu et al., 2020; Yang et al., 2020), publication bias was assessed using the funnel plots and Begg’s test and Tweedie’s trim-and-fill analysis. All data analyses were 2 tailed, and the significant level was set at 0.05.
Subgroup and meta-regression analyses were performed to examine the moderating factors of HIV infection prevalence. Subgroup analyses were conducted according to the following categorical variables: (1) sexual orientation: MSM vs. not specified; (2) sex: male predominance (male percentage ≥ 60%) vs. no-predominance; (3) study site: hospital vs. community; (4) route of transmission: commercial sex vs. non-specified; (5) education: equal to and below primary school vs. above primary school education; (6) occupation: predominance of farmers (i.e., farmer percentage ≥ 60%) vs. no such predominance; (7) economic region: western vs. middle of vs. eastern region of China; (8) area: rural vs. urban; and (9) cut-off age for older adults: ≥50 years vs. ≥60 years, and (10) publication year: during and before 2014 vs. after 2014 (using median splitting method). Meta-regression analyses were conducted to examine the moderating effects of continuous variables (such as quality assessment score and study period) on the results when the number of included studies was at least 10.
Results
Literature search and study characteristics
A total of 3,641 publications were identified in the initial literature search. Finally, 46 studies with 363,399 subjects met the entry criteria and were included in the meta-analysis (Fig. 1); four studies were published in English (Chen et al., 2016; Feng et al., 2009; Ning et al., 2018; Xie et al., 2014), and the remaining were published in Chinese language. Table 1 shows the study characteristics. All studies were published between 2004 and 2018. Most studies (89%) used ≥ 50 years as cut-off age for older adults. Of the 46 studies, only one reported treatment information in HIV infected older adults, i.e., 53.75% of whom had HAART treatment (Ning et al., 2018).

Figure 1: PRISMA flow diagram.
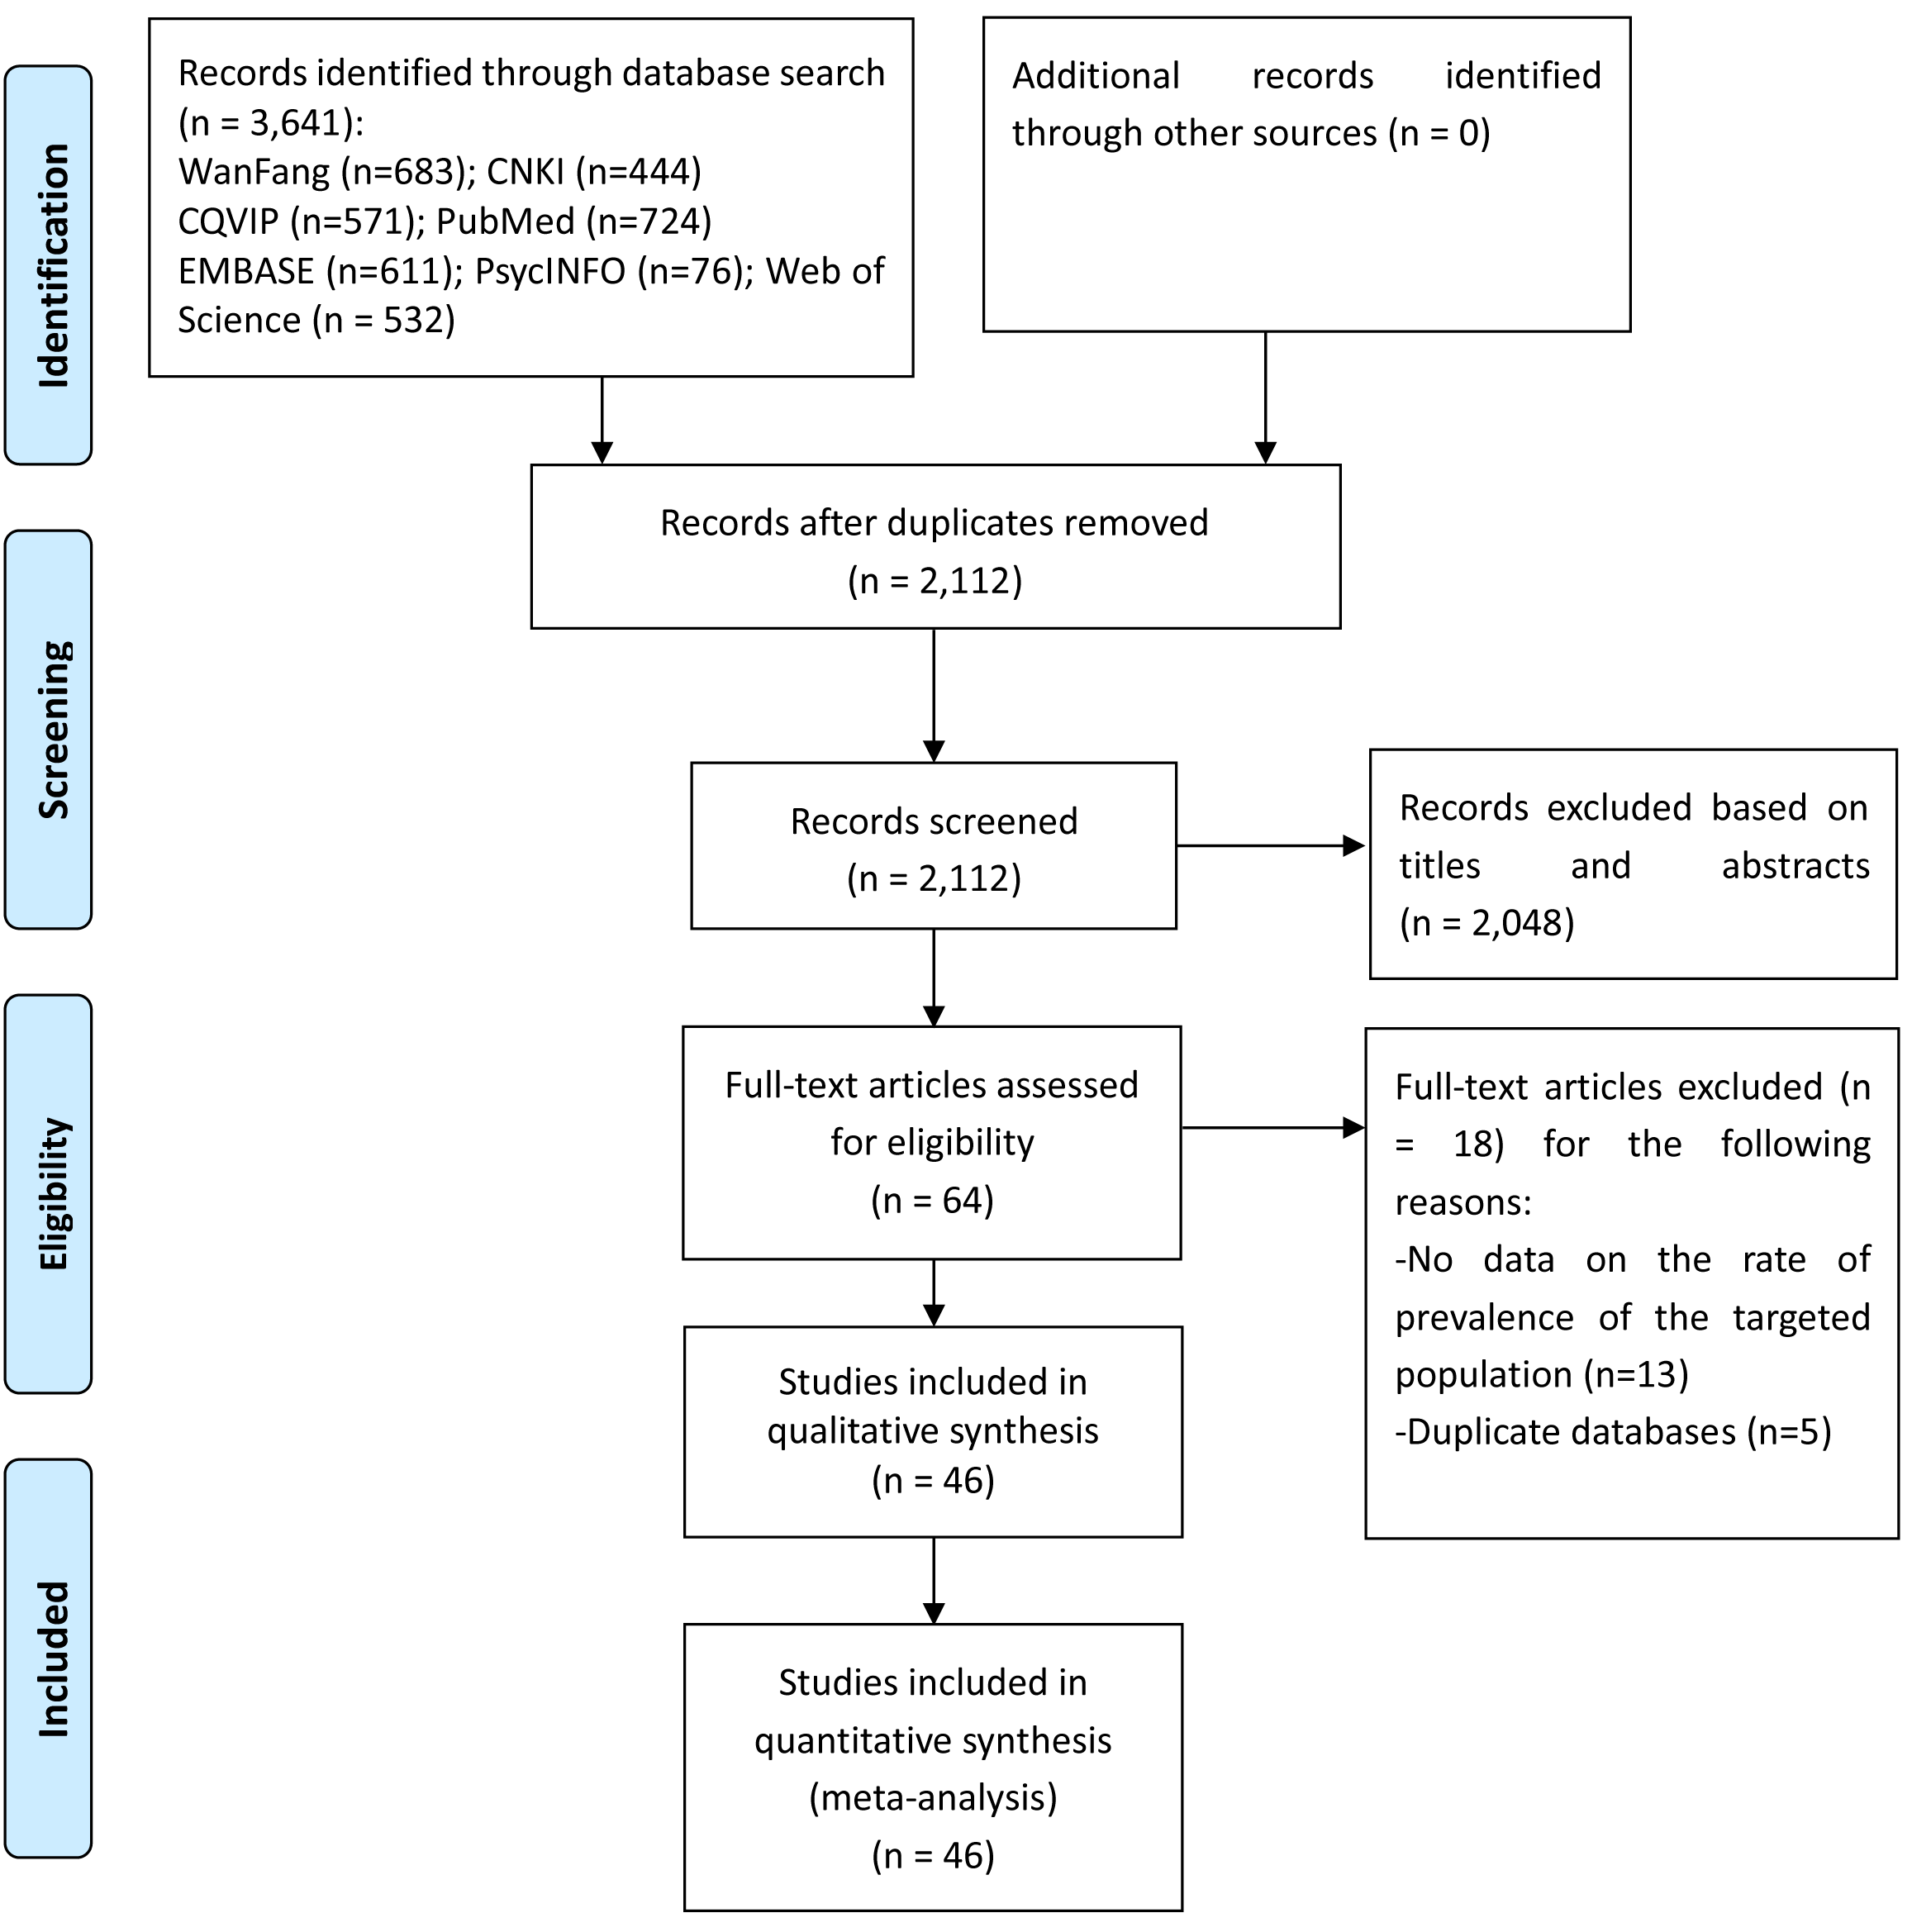
Nine studies reported the HIV infection rate in all age groups (Chen et al., 2017; Chen et al., 2016; Chen et al., 2013; Du & Meng, 2016; Feng et al., 2009; Wang et al., 2018a; Zhao, Su & Jiang, 2015; Zhong et al., 2017; Zhu, Miu & Zhang, 2014), therefore only data in older adults were extracted for analyses; while five studies focused on older MSM adults. Thirteen studies reported transmission routes, while the remaining (71.7%) did not.
Prevalence of HIV infection in older adults and moderating factors
The pooled prevalence of HIV infection in older adults was 2.1% (95% CI [1.9%–2.3%], I2 = 99.3%, Fig. 2). The results of the subgroup analyses are presented in Table 2. MSM population, hospital population samples, publications after 2014, and studies conducted in the western region were significantly associated with higher HIV infection rate. Meta-regression analyses revealed that higher study quality was significantly associated with higher HIV prevalence (β = 0.84, p < 0.001, Fig. S1). Meta-regression analysis did not find any significant association between study periods and the prevalence of HIV infection (β = −0.03, p = 0.76).
Publication bias
Although funnel plot was visually asymmetrical (Fig. S2), Begg’s test did not find statistically significant publication bias (p = 0.21). The Duval and Tweedie trim-and-fill analysis suggests that 8 studies would need to be imputed to achieve an approximate normal error distribution. Including these 8 studies could lead to a lower prevalence of 0.096 (95% CI [0.094–0.099]).
| The first author (year) | References | Province | ER | Rural/ Urban | Study period | Study site | Sample size | Mean Age (yrs) | Male (%) | Education (primary school or illiterate %) | Occupation (farmer;%) | Transmission route | Older adults defined age | Study quality | |
|---|---|---|---|---|---|---|---|---|---|---|---|---|---|---|---|
| 1 | Shao, 2018 | Shao et al. (2018) | Chongqing | W | Rural | 04/2017–05/2017 | Community | 400 | 67 | 100 | 59% | NR | NR | ≥60 | 5 |
| 2 | Lin, 2018 | Lin, Wu & Zheng (2018) | Hainan | E | Urban | 01/2011–12/2016 | Hospital | 1257 | 61.5 | 74.14 | NR | 52.94 | NR | ≥50 | 4 |
| 3 | Lin, 2018 | Lin et al. (2018) | Guangxi | W | Rural | 01/2016–08/2016 | Community | 468 | NR | 48.5 | NR | 97.01 | NR | ≥50 | 6 |
| 4 | Li, 2018 | Li et al. (2018a) | Qinghai | W | Urban | NR | Community | 150 | NR | 100 | NR | NR | NR | ≥50 | 5 |
| 5 | Huang, 2018 | Huang et al. (2018) | Guangxi | W | Rural | 08/2016–03/2017 | Community | 553 | NR | 49.55 | 62.39% | 97.29 | NR | ≥50 | 5 |
| 6 | Ning, 2018 | Ning et al. (2018) | Shanghai | E | Urban | 01/2008–12/2014 | Community | 12910 | 59.3 | 100 | NR | NR | NR | ≥50 | 5 |
| 7 | Zhong, 2017 | Zhong et al. (2017) | Sichuan | W | Rural | 2014–2016 | Hospital | 576 | NR | NR | NR | NR | NR | ≥50 | 5 |
| 8 | Zhang, 2017 | Chen et al. (2017) | Jiangsu | E | Both | 10/2015–03/2016 | Community | 200 | 68.42 | 100 | 73.50% | NR | NR | ≥50 | 5 |
| 9 | Yu, 2017 | Yu (2017) | Guangxi | W | Both | 10/2015–01/2016 | Community | 461 | 58.82 | 100 | 22.30% | 10.4 | Commercial sex | ≥50 | 6 |
| 10 | Xu, 2017 | Xu & Zhu (2017) | Guangdong | E | Urban | 01/2016–04/2016 | Community | 528 | NR | 100 | NR | NR | NR | ≥50 | 5 |
| 11 | Maiwulani, 2017 | Maiwulani et al. (2017) | Xinjiang | W | Urban | 01/2015–12/2015 | Hospital | 3830 | NR | 54.31 | 41.90% | NR | NR | ≥50 | 5 |
| 12 | Liu, 2017 | Liu et al. (2017) | Jiangsu | E | Urban | 04/2013–06/2015 | Hospital | 174 | 57.15 | 100 | 11.50% | NR | NR | ≥50 | 4 |
| 13 | Deng, 2017 | Deng et al. (2017) | Guangxi | W | both | 10/2012–12/2012 | Community | 4048 | NR | 100 | NR | NR | Commercial sex | ≥50 | 5 |
| 14 | Chen, 2017 | Chen et al. (2017) | Guangdong | E | Urban | 2010–2016 | Hospital | 165 | NR | NR | NR | NR | NR | ≥50 | 5 |
| 15 | Zhu, 2016 | Zhu et al. (2016) | Jiangsu | E | Rural | NR | Community | 2860 | 71.75 | 48.39 | 90.07% | NR | NR | ≥65 | 6 |
| 16 | Su, 2016 | Su et al. (2016) | Yunnan | W | Both | 01/2011–12/2013 | Hospital | 26807 | NR | 60.3 | 60.40% | NR | NR | ≥50 | 5 |
| 17 | Shi, 2016 | Shi et al. (2016) | Jiangsu | E | Both | 2010–2014 | Community | 1185 | NR | 100 | 52.83% | NR | NR | ≥50 | 5 |
| 18 | Liu, 2016 | Liu et al. (2016) | Hubei | M | both | 12/2014–12/2014 | Community | 601 | 65.7 | 100 | 59.80% | 61.50% | NR | ≥50 | 6 |
| 19 | Hong, 2016 | Hong, Zhang & Zhang (2016) | Zhejiang | E | both | 03/2014–08/2014 | Community | 400 | 64.1 | 100 | 73.50% | NR | NR | ≥50 | 4 |
| 20 | Du, 2016 | Du & Meng (2016) | Sichuan | W | both | 01/2009–12/2014 | Community | 372 | NR | NR | NR | NR | NR | ≥50 | 4 |
| 21 | Chen Z, 2016 | Chen et al. (2016b) | Chongqing | W | Urban | 04/2015–05/2015 | Community | 599 | NR | 40.23 | 29.55% | 13.40% | NR | ≥60 | 6 |
| 22 | Chen Y, 2016 | Chen et al. (2016a) | Guangxi | W | both | 2010–2015 | Community | 14105 | NR | 100 | NR | NR | Commercial sex | ≥50 | 4 |
| 23 | Zhou, 2015 | Zhou et al. (2015) | Shanghai | E | Urban | 05/2011–04/2013 | Community | 165 | 58.7 | 100 | NR | NR | NR | ≥50 | 5 |
| 24 | Wu, 2015 | Wu et al. (2015) | Guangxi | W | both | 10/2012–04/2013 | Community | 1761 | 64.23 | 100 | 74.50% | 76.2 | Commercial sex | ≥50 | 4 |
| 25 | Qin, 2015 | Qin et al. (2015) | Guangxi | W | Both | 2012 | Community | 430 | 61.06 | 100 | 75.80% | 90 | Commercial sex | ≥50 | 4 |
| 26 | Ma, 2015 | Ma et al. (2015) | Chongqing | W | Urban | 01/2010–12/2014 | Hospital | 832 | 60.1 | 69.11 | 37.86% | 43.51 | NR | ≥50 | 4 |
| 27 | Lu, 2015 | Lu et al. (2015) | Guangxi | W | both | 10/2012–04/2013 | Community | 1236 | 68.42 | 100 | 86.92% | 88.11 | Commercial sex | ≥60 | 4 |
| 28 | Li, 2015 | Li et al. (2015) | Jiangxi | M | NR | 01/2013–12/2013 | Community | 405 | NR | 65.68 | 56.30% | NR | NR | ≥50 | 6 |
| 29 | Zhu Y, 2014 | Zhu, Miu & Zhang (2014) | Yunnan | W | NR | 01/2013–12/2013 | Community | 73 | NR | NR | NR | NR | NR | ≥50 | 5 |
| 30 | Zhu J, 2014 | Zhu et al. (2014) | Guangxi | W | both | NR | Community | 377 | 61.5 | 100 | 73.80% | 85.4 | Commercial sex | ≥50 | 5 |
| 31 | Wang, 2014 | Wang (2014) | Guangxi | W | both | 10/2012–04/2014 | Community | 848 | 56.6 | 100 | 80.20% | 82.7 | Commercial sex | ≥50 | 5 |
| 32 | Min, 2014 | Min et al. (2014) | Yunnan | W | both | NR | Community | 210 | 62 | 100 | NR | NR | sex | ≥50 | 4 |
| 33 | Lu, 2014 | Lu et al. (2014) | Guangxi | W | both | 10/2012–04/2013 | Community | 2056 | 62.28 | 100 | 75.73% | 78.79 | Commercial sex | ≥50 | 4 |
| 34 | Li, 2014 | Li, Wu & Chen (2014) | Zhejiang | E | NR | 2006–2012 | Community | 3860 | NR | NR | NR | NR | NR | ≥50 | 5 |
| 35 | Dou, 2014 | Dou (2014) | Anhui | E | Urban | 2010–2014 | Hospital | 427 | 62.34 | 100 | NR | NR | NR | ≥50 | 5 |
| 36 | Xie, 2014 | Xie et al. (2014) | Zhejiang | E | NR | 03/2012–08/2012 | Community | 215441 | 63.51 | 42.26 | NR | NR | NR | ≥50 | 6 |
| 37 | Zhou, 2013 | Zhou et al. (2013) | Shanghai | E | Urban | 03/2011–09/2011 | Hospital | 157 | 60.1 | 100 | 15.90% | NR | NR | ≥50 | 5 |
| 38 | Chen, 2013 | Chen et al. (2013) | Guangxi | W | both | 04/2012–07/2012 | Community | 2305 | NR | 100 | NR | NR | Commercial sex | ≥50 | 4 |
| 39 | Feng, 2009 | Feng et al. (2009) | Chongqing | W | NR | 07/2006–09/2006, 07/2007–09/2007 | Community | 46 | NR | 100 | NR | NR | NR | >50 | 4 |
| 40 | Liu, 2004 | Liu et al. (2004) | Hubei | M | both | 01/1999–04/2002 | Hospital | 902 | NR | NR | NR | NR | NR | ≥60 | 5 |
| 41 | Zhao, 2015 | Zhao, Su & Jiang (2015) | Liaoning | M | NR | 01/2011–12/2013 | Hospital | 1217 | NR | NR | NR | NR | NR | ≥50 | 4 |
| 42 | Wu, 2013 | Wu et al. (2013) | Guangxi | W | NR | NR | Community | 414 | NR | 100 | 77.05% | 96.14 | Commercial sex | ≥50 | 4 |
| 43 | Li, 2018 | Li et al. (2018b) | Sichuan | W | NR | 04/2014–12/2015 | Community | 363 | NR | 100 | NR | NR | Commercial sex | ≥50 | 4 |
| 44 | Fu, 2013 | Fu et al. (2013) | Yunnan | W | NR | 01/2008–02/2013 | Hospital | 842 | 59.35 | 64.75 | 65.82% | 74.11 | NR | ≥50 | 4 |
| 45 | Pan, 2014 | Pan, Xie & Xu (2014) | Guangdong | E | NR | 06/2011–05/2013 | Hospital | 184 | NR | 65.21 | NR | NR | NR | ≥50 | 4 |
| 46 | Wang, 2018 | Wang et al. (2018a),Wang et al. (2018b) | Henan | M | NR | 01/2013–12/2015 | Hospital | 56199 | NR | 52.22 | NR | NR | NR | ≥50 | 4 |
Notes:
- ER
-
Economic Regions
- E
-
East
- M
-
Middle
- W
-
West
- U
-
Urban
- R
-
Rural
- NR
-
Not recorded
Discussion
This was the first meta-analysis to examine the prevalence of HIV infection in older adults in China. The meta-analysis revealed that the pooled prevalence of HIV infection in older Chinese adults was 2.1%, which was substantially higher than the figure reported in the Chinese general population (0.05%) (National Bureau of Statistics of China, 2018). The high HIV infection rate could be due to several reasons. The life expectancy of HIV-infected adults has been significantly prolonged due to widespread use of HAART (Bhaskaran et al., 2008; Greenbaum et al., 2008; Xing et al., 2014); e.g., the National Free Antiretroviral Treatment Program (NFATP) has covered more than 97% of HIV-infected people in China (Zhang et al., 2009). The high HAART adherence rate in Chinese HIV patients, as confirmed by a recent meta-analysis (Wang et al., 2018b), would be expected to increase life expectancy and many patients are living into their older adulthood. Furthermore, many studies have indicated increasing transmission via commercial sexual activities among older Chinese men after retirement as a major reason for HIV infection (Wang et al., 2014; Zhou et al., 2014). It has been suggested that prevention of HIV transmission among older MSM should be an urgent priority in China’s HIV/AIDS strategy (Ning et al., 2018).
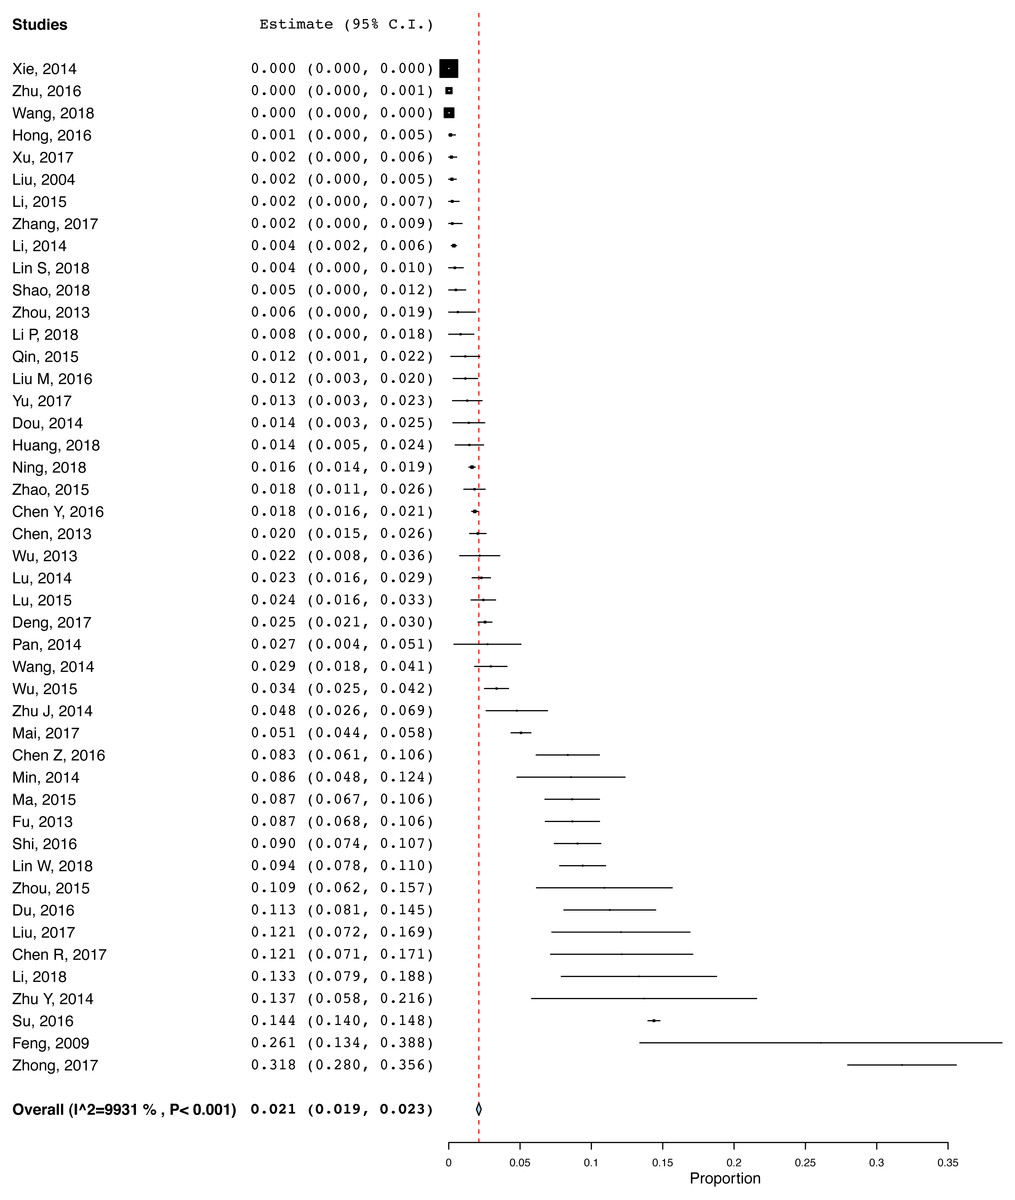
Figure 2: Pooled HIV prevalence of the included studies.
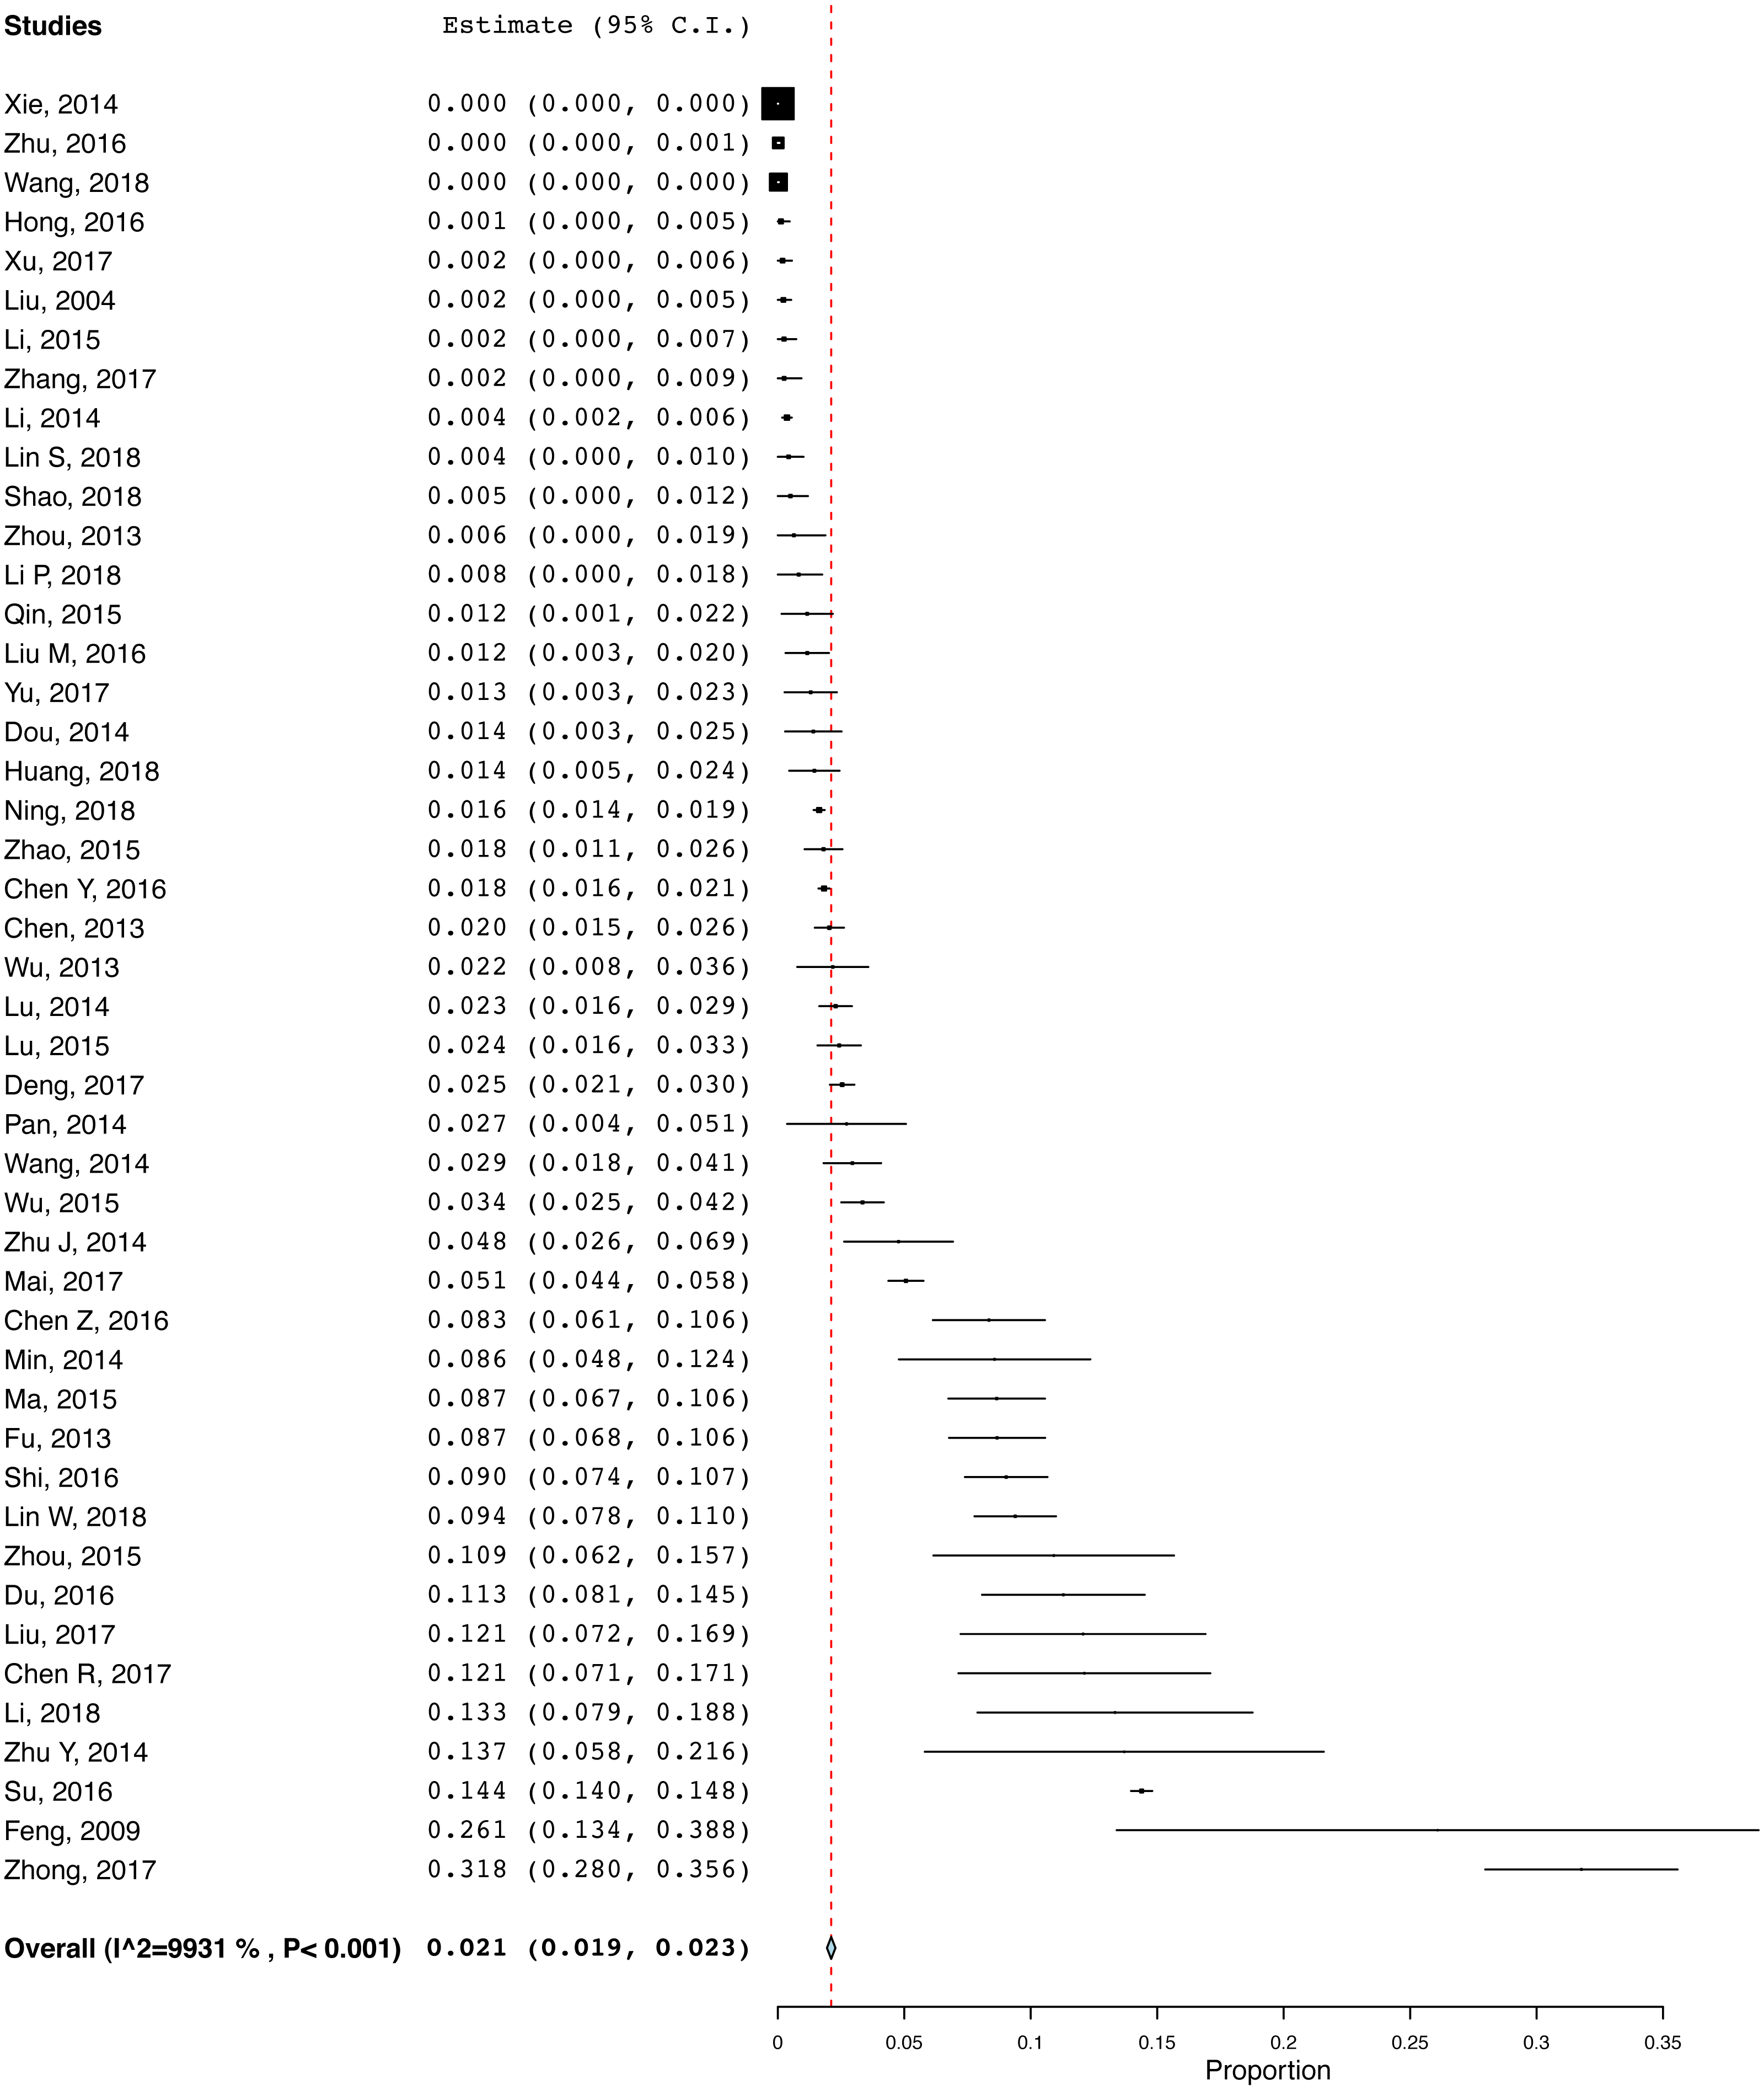
The high proportion of HIV infection in older adults is growing major public health challenge in China. Compared to younger adults, physical and psychiatric comorbidities, such as pneumonia, depression and insomnia, are usually more common in HIV-infected older adults (Ding et al., 2017), which could lead to heavy personal, family and economic burden. Therefore, appropriate allocation of healthcare resources and developing effective preventive strategies for HIV-infected older adults in China should be considered (Xing et al., 2014).
| Subgroup | Number of studies | Sample size | Number of cases | Prevalence (%) | 95% CI | I2 (% with P-value) |
|---|---|---|---|---|---|---|
| 1. Sexual orientation: MSM population | 5 | 1,720 | 178 | 11.8 | 8.5–15 | 59.24 (<0.05) |
| Not specified | 41 | 361,679 | 5,560 | 2.0 | 1.8–2.2 | 99.4 (<0.001) |
| 2. Sex: Male predominance (≥60%) | 32 | 76,284 | 5,159 | 4.1 | 2.8–5.4 | 99.2 (<0.001) |
| No predominance | 4 | 7,711 | 204 | 1.7 | 0.4–3.9 | 98.6 (<0.001) |
| 3. Study site: Hospital | 14 | 93,569 | 4,587 | 7.5 | 4.5–10.4 | 99.8 (<0.001) |
| Community | 32 | 269,830 | 1,151 | 1.5 | 1.3–1.8 | 97.4 (<0.001) |
| 4. Route of transmission: Commercial sex | 12 | 28,404 | 610 | 2.2 | 1.8–2.6 | 71.3 (<0.001) |
| Not specified | 33 | 334,785 | 5,110 | 2.0 | 1.8–2.2 | 99.5 (<0.001) |
| 5. Education: Primary school and below (≥60%) | 13 | 38,784 | 4,130 | 3.4 | 0.6–6.1 | 99.7 (<0.001) |
| Above primary school (≥60%) | 8 | 7,167 | 205 | 3.9 | 2.1–5.8 | 96.8 (<0.001) |
| 6. Occupation: Farmer predominance (≥60%) | 11 | 9,586 | 283 | 2.6 | 1.7–3.5 | 90.2 (<0.001) |
| No predominance | 4 | 3,149 | 246 | 6.9 | 0.2–11.5 | 97.0 (<0.001) |
| 7. Economic Region: West | 26 | 64,162 | 5,152 | 6.0 | 4.2–7.9 | 99.3 (<0.001) |
| Middle | 5 | 59, 324 | 46 | 0.5 | 0.0–1.0 | 87.1 (<0.001) |
| East | 15 | 239,913 | 540 | 1.0 | 0.7–1.3 | 97.5 (<0.001) |
| 8. Area: Rural | 5 | 4, 857 | 195 | 4.8 | 2.6–7.1 | 98.6 (<0.001) |
| Urban | 12 | 21,194 | 732 | 5.8 | 4.3–7.3 | 97.2 (<0.001) |
| Urban and Rural | 18 | 58,304 | 4,630 | 3.8 | 1.8–5.7 | 99.5 (<0.001) |
| 9. Defined age for older adults (years): ≥50 | 41 | 357,402 | 5,654 | 2.4 | 2.2–2.5 | 99.4 (<0.001) |
| ≥60 | 5 | 5,997 | 84 | 1.4 | 0.6–2.3 | 95.4 (<0.001) |
| 10. Publication yeara: In or before 2014 | 15 | 22,8142 | 305 | 2.1 | 1.5–2.7 | 95.4 (<0.001) |
| After 2014 | 31 | 135,257 | 5,433 | 3.6 | 3.1–4.1 | 99.5 (<0.001) |
Notes:
Consistent with previous findings on HIV prevalence in China (Zhang et al., 2013), we found in this meta-analysis that MSM was associated with a higher risk of HIV infection; the HIV prevalence in MSM older adults was 11.8%, which was the highest among all subgroups. Compared to community populations, hospital population samples were significantly associated with higher HIV infection rate, which is probably because older adults with HIV infection were more likely to receive HIV testing than those in the community. Compared to middle and eastern economic regions, HIV infection prevalence in older adults was significantly higher in the western region of China, being less developed than other parts of China. Therefore, the lack of access to HIV treatment and prevention measures in the western region could be associated with higher HIV infection rate. Due to degradation of traditional Chinese family structure and lack of family support, retired older men are also more likely to have engaged in commercial sex, particularly in under-developed western regions of China (Huang, Maman & Pan, 2012).
Unexpectedly, commercial sex as the transmission route was not significantly associated with higher HIV infection rate. This appears inconsistent with previous findings that commercial sex is a major route for HIV infection transmission among older Chinese men (Wang et al., 2014; Zhou et al., 2014). Studies published after 2014 were significantly associated with higher HIV infection rate, which we were unable to explain adequately. However, we found that higher study quality was significantly associated with higher HIV prevalence. Due to sigma and discrimination associated with HIV/AIDS, many sufferers, particularly older adults in China usually deny or conceal their diagnosis in order to avoid “loss of face”. High quality studies may identify patients more systematically, and obtain a more accurate and often higher rate HIV infection.
There were several limitations in this meta-analysis. First, similar to other meta-analyses of epidemiological studies (Liu et al., 2016; Long et al., 2014; Wang et al., 2018b; Winsper et al., 2013), there was substantial heterogeneity, although subgroup analyses were performed. The heterogeneity may be associated with different sampling methods, study designs, diagnostic criteria of HIV infection and demographic and clinical characteristics between studies. Second, most studies did not report the transmission route, therefore further sophisticated analyses could not be conducted. Third, due to the cross-sectional design of included studies, the causal relationship between HIV infection and related variables could not be explored.
In conclusion, this meta-analysis showed that the prevalence of HIV infection in older adult population is significantly higher than the general population in China. Attention should be given to this urgent public health issue, and effective HIV/AIDS preventive, screening and treatment measures are warranted in this population.