

Abstract
The effects of Mg co-doping on the scintillation properties of Ce:Lu2Gd1(Ga,Al)5O12 (LGGAG) single crystals with different Ga/Al ratios were investigated. Mg co-doped and non co-doped Ce:LGGAG single crystals were grown by the micro-pulling down (µ-PD) method and then cut, polished and annealed for each measurement. Absorption spectra, radioluminescence (RL) spectra, pulse height spectra, and scintillation decay were measured to reveal the effect of Mg co-doping. Ce4+ charge transfer (CT) absorption band peaking at ∼260 nm was observed in Mg co-doped samples, which is in good agreement with previous reports for the Ce4+ CT absorption band in other garnet-based crystals. The scintillation decay time tended to be accelerated and the light yield tended to be decreased by Mg co-doping at higher Ga concentrations.
Export citation and abstract BibTeX RIS
1. Introduction
Scintillator materials combined with photodetectors are often used in a wide range of medical imaging applications1) such as X-ray imaging, X-ray computed tomography, and positron emission tomography (PET). For applications like PET, the properties generally required for scintillators are high light yield, high density, and fast decay time (for the timing resolution). Among many kinds of scintillator materials, oxide scintillation materials based on Ce-doped Lu3Al5O12 (Ce:LuAG) garnets are promising candidates because of their high density, excellent scintillation performance and well-mastered large-size growth techniques.2) In addition, admixture of Gd and Ga in Ce:LuAG showed enhancement of light yield due to suppression of shallow traps.3) Among the admixed garnets, Ce:Gd3(Ga,Al)5O12 (GAGG) with density of 6.7 g/cm3, light yield of 56,000 photons/MeV and fast decay time of 92 ns is now commercially produced.4–8) Furthermore, heavy Ce:Lu2Gd1Ga3Al2O12 (LGGAG) garnet with density of 7.13 g/cm3, light yield of 25,000 photons/MeV and fast decay time of 53.6 ns was recently reported.9)
In garnet scintillators, the slow decay components originating from re-trapping of electrons at shallow electron traps related to anti-site (LuAl) defects are often a problem for scintillator applications requiring high timing resolution such as PET.
In recent investigations on the improvement of scintillation response, afterglow suppression and scintillation decay acceleration by Ca2+ co-doping were reported in Ce:Lu2SiO5 (LSO) and Ce:(Lu,Y)2SiO5 (LYSO) single crystals.10,11) Besides the silicate-based scintillators described above, alkali-earth co-doping effects also in multi-component garnet-based scintillators like Ce:Lu3(Ga,Al)5O12 (LGAG)12–15) and Ce:GAGG14–18) were investigated and both enhancement of light yield and acceleration of decay time were found in Mg co-doped Ce:LGAG,10,11,14) while only the decay time was improved in Gd-containing garnet, Mg co-doped Ce:GAGG.14,19–21) The Ce4+ ions stabilized by divalent ions play an important role in these positive effects, mainly due to the suppression of such slow delayed recombination processes, even though the traps in silicates are related to different defects compared to garnets. Their luminescence mechanism and the related improvement of scintillation performance have been explained7,8,12) in detail. In this report, the host composition of LGGAG crystals was selected for the advantages of high density and large size growth of promising Mg co-doped compositions in the future, and the effects of Mg co-doping on their luminescence and scintillation properties were investigated. Parts of this work on the crystal growth and radiation response of Mg co-doped and non co-doped LGGAG were cited in the extended abstract of 2017 International Conference on Solid State Devices and Materials (SSDM2017).22) In this paper full sets of crystal phase analysis, radioluminescence spectra, light output and decay time under gamma-ray excitation in the chemical composition of MgzCe0.005(Lu2/3Gd1/3)1−z−0.005)3GaxAl5−xO12 at the values of x were 0, 1, 2, 3, and 4, and z = 0.0002 were reported.
2. Experimental methods
2.1. Crystal growth procedure
A stoichiometric mixture of 4N MgCO3, CeO2, α-Al2O3, β-Ga2O3, Lu2O3, and Gd2O3 powders was prepared as the starting material. Concerning the nominal composition, Lu3+ and Gd3+ dodecahedral sites were substituted by Ce3+ dopant and Mg2+ co-dopant according to the formula (MgzCe0.005(Lu2/3Gd1/3)1−z−0.005)3GaxAl5−xO12. The values of x were 0, 1, 2, 3, and 4, and z = 0.0002 for Mg co-doped Ce:LGGAG, and z = 0 for non co-doped Ce:LGGAG. For example, the sample when x = 2 and z = 0.0002 is described as Ga2; Mg co-doped, and the sample when x = 3 and z = 0.0 as Ga3; non co-doped. 1.5 wt % excess β-Ga2O3 was added for the ignition loss of Ga2O3 during growth due to the high melting point close to that of LuAG crystal. Mg co-doped and non co-doped Ce:LGGAG crystals were prepared by the micro-pulling down (µ-PD) method equipped with a radiofrequency-heating system and an Ir crucible under N2 atmosphere. See Refs. 23 and 24 for a schematic view of the µ-PD growth apparatus. Typical pulling rates in the growth method were 0.06–0.12 mm/min, and 15–50 mm length crystals were grown around the diameter of 2–3 mm. 〈100〉 oriented YAG crystals were used as the seed crystals. The as-grown crystals were cut into plates of ϕ (2–3) mm × 1.2 mm size and polished. The cut samples were annealed for 24 h at 1700 °C in air using an electric furnace (Motoyama MS3448) in order to remove the oxygen vacancies and the thermal distortion in the as-grown crystals. The annealed crystals were mechanically polished on both sides to 1-mm size again for the absorption and luminescence spectra measurements. The remaining rods were used for phase characterization.
Rods of ϕ (2–3) mm × a few mm taken from the middle part of the grown crystals were crushed into powder by using an alumina pestle and mortar. Powder X-ray diffraction analysis was performed in the 2θ range of 15–75° by using a Bruker D8 DISCOVER-HS diffractometer (Cu Kα X-ray source: 40 kV, 40 mA).
2.2. Optical, luminescence, and gamma-ray response measurement procedure
Absorption spectra measurements for optical properties were carried out with a JASCO V550 spectrophotometer in the 190–750 nm range. Using a CCD digital camera (Andor DU420-OE) as the photon detector, the radioluminescence (RL) spectra measurements were conducted using an X-ray (40 kV, 40 mA) tube (Rigaku RINT2000) excitation source. For the gamma-ray response study, the pulse height spectra were collected under 662 keV γ-ray excitation of a 137Cs source using a setup consisting of a photomultiplier tube (PMT; Hamamatsu R7600U-200, ultra bialkali photocathode, quartz window), a bias-supplying module (Ortec 556) for a PMT, a pre-amplifier (Ortec 113), a multichannel analyzer (MCA; Amptek 8000A), and a personal computer. Light output measurements were performed using a PMT (Hamamatsu R7600U-200). The sample plates were coupled to the PMT using silicon grease (Oken 6262A) and covered by Teflon tape. The shaping time was set to 2 µs. In addition, the light yield (LY) values were estimated by quantitative comparisons of the photo-peaks in pulse height spectra with high quality Ce:GAGG single crystal (LY = 46,000 photons/MeV) as the standard sample considering the quantum efficiency (QE) of the PMT at the emission wavelength of the Ce:GAGG standard and each LGGAG sample. The decay time was measured using almost the same setup used for the pulse height spectra measurement, where the signal output from the pre-amplifier was fed into a digital oscilloscope (Tektronix TDS3052B).
3. Results and discussion
3.1. Crystal growth and phase characterization
Mg co-doped and non co-doped Ce:LGGAG crystals with different Ga concentration were grown by the µ-PD method. Selected photographs of the grown Ga0, 1, 2, 3, and 4; Mg co-doped and non co-doped crystals are shown in Fig. 1. The left side of the pictures corresponds to the seed side of the crystal and the right side to the tail side. The grown crystals are transparent with yellow-to-green color, 2–3 mm in diameter and 15–50 mm in length. Some of the as-grown crystals show a rough surface due to thermal etching. However, the inner parts of the crystals were transparent.
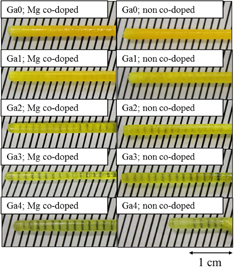
Fig. 1. Photographs of the grown Ga0, 1, 2, 3, and 4; Mg co-doped and non co-doped crystals.
Download figure:
Standard image High-resolution imageThe crystal phase of the grown crystals was identified by powder X-ray diffraction analysis. In addition to the powder diffraction file (PDF) data for Gd3Al5O12 (PDF: 73-1371), the powder X-ray diffraction data of Ga0–4; Mg co-doped and non co-doped crystals and their magnifications of the wide angle range in the inset are shown in Fig. 2.
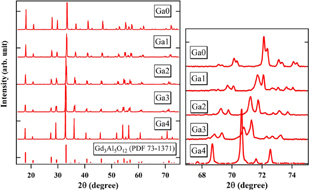
Fig. 2. Results of the powder X-ray diffraction of Ga0, 1, 2, 3, and 4; Mg co-doped crystals and their magnification of the wide angle side.
Download figure:
Standard image High-resolution imageThe single cubic garnet phase was observed in all the grown crystals. The wide angle peaks obviously showed systematic shifts towards shorter angles with increase of Ga3+ concentration due to the increase of the lattice parameters mentioned below. Figure 3 shows the dependence of the lattice constant on the Ga3+ concentration. The lattice parameters showed an increasing trend with increasing Ga3+ concentration. The ionic radii of Ga3+ are bigger than those of Al3+, which is why this trend is reasonable and is in good agreement with Vegard's law.
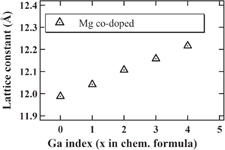
Fig. 3. Results of the lattice constant of Ga0, 1, 2, 3, and 4; Mg co-doped crystals.
Download figure:
Standard image High-resolution image3.2. Optical and luminescence properties
The absorption spectra of the Ga2; Mg co-doped and non co-doped samples are presented in Fig. 4. The difference of the absorption between Mg co-doped and non co-doped samples in the range 210–320 nm is also shown in the inset of Fig. 4. Furthermore, the dependences of the Ce3+ 4f–5d1 and 4f–5d2 absorption band maximum positions on Ga concentration are shown in Fig. 5.
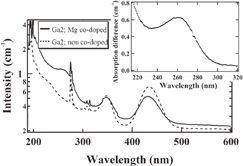
Fig. 4. Absorption spectra of Ga2; Mg co-doped and non co-doped crystals and the absorption difference between Mg co-doped and non co-doped samples (inset).
Download figure:
Standard image High-resolution image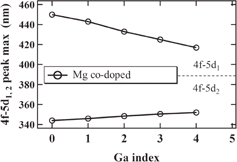
Fig. 5. Dependence of the Ce3+ 4f–5d1 and 4f–5d2 absorption peak position on the material composition of Ga0, 1, 2, 3, and 4; Mg co-doped and non co-doped crystals.
Download figure:
Standard image High-resolution imageIn addition to the 4f–5d1 absorption bands of Ce3+ centered between 450–418 nm and 4f–5d2 around 342–355 nm, enhancement of the absorption peak around 240 nm was observed in Fig. 4 for the Mg co-doped sample. The peak around 240 nm has been ascribed to the Ce3+-related absorption bands, namely 4f–5d3,4,5 states formed by the crystal field splitting of the 5d state.11,25) Similar absorption bands were shown in a previous report for Lu3(Ga,Al)5O12 (LGAG)11) and LuAG3) crystals and these states in LGGAG crystals were most probably shifted towards longer wavelength than in LGAG and LuAG crystals.
The enhancement of absorption below 300 nm has been explained as the Ce4+ charge transfer (CT) absorption upon Mg co-doping according to a previous study on alkali-earth co-doped samples.8,10,26) Furthermore, a peak around 260 nm in absorption-difference spectra (inset of Fig. 4) was observed. This absorption peak is similar to that observed in Ca2+ co-doped Ce:LYSO and Mg2+ co-doped Ce:LuAG single crystals and has been ascribed to the CT transition between the O2− levels at the top of valence band (VB) and the 4f ground state of Ce4+.8,10,26)
The peak position of the Ce3+ 4f–5d1 absorption band shifted to shorter wavelength and that of the Ce3+ 4f–5d2 absorption band showed the opposite behavior (see Fig. 5). Therefore their separation decreased with the increase of Ga3+ concentration. The increase in the lattice parameters with increasing Ga contents causes both a decrease in the crystalline field at the dodecahedral site and increased covalent bonding between the Ga3+ and O2− ions, resulting in the removal of outer electrons of O2− ligands around the dodecahedral site. This explanation is supported by previous reports.3,25)
The peak position of the Ce3+ 5d1–4f transition in the radioluminescence spectra is shown in Fig. 6 as a function of Ga concentration. The RL spectra of Ga1 and 3; Mg co-doped and non co-doped samples are simultaneously presented in the inset of Fig. 6. The Ce3+ emission was observed between 539–513 nm in addition to the Gd3+ 4f–4f emission at ∼310 nm. The RL peak showed the same behavior, as it was shifted towards shorter wavelengths by Ga3+ admixture as the 4f–5d1 absorption peak.
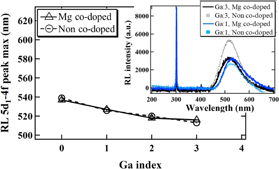
Fig. 6. RL spectra of Ga1 and 3; Mg co-doped and non co-doped crystals and the dependence of the Ce3+ 5d1–4f RL peak position on the material composition of Ga0, 1, 2, 3, and 4; Mg co-doped and non co-doped crystals. Excitation by X-rays, 40 kV, 40 mA.
Download figure:
Standard image High-resolution imageThe Ce3+ emission band was enhanced by Mg co-doping for Ga1 as seen from the RL spectra in Fig. 6. On the other hand, the opposite effect was observed for Ga3. This can be explained by the stability of the Ce tetravalent state and its converging to the conduction band related to the Ga concentration. With increasing Ga concentration, the Fermi level of the materials shifts to lower energies, which increases the separation between the Ce3+ 4f level and the Fermi level.27,28) Consequently, the Ce tetravalent state became more stable and a larger amount of Ce4+ was formed by Mg co-doping. According to Ref. 27, the Ce4+ 5d1 state is found to be situated at a higher level than that of Ce3+, and consequently comes close to the edge of the conduction band. Therefore, due to the lower band gap energy with higher Ga concentration,25) the Ce4+ 5d state is much closer to the edge of the conduction band than for the samples with lower Ga content. That is why there are different consequences of the Mg co-doping for different Ga concentrations.
Measured RL emission wavelengths were used in order to correct the light yield.
3.3. Gamma-ray response
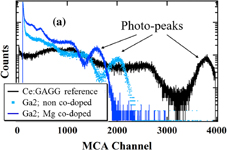
The pulse height spectra of Mg co-doped and non co-doped Ce:LGGAG and Ce:GAGG reference samples by 662 keV γ-ray excitation of the 137Cs source were collected at room temperature using the PMT. The results of the Ga2; Mg co-doped and non co-doped samples are shown in Fig. 7(a). As already mentioned in the experimental section, the LY was estimated by comparing each photo-peak channel with the Ce:GAGG standard reference sample considering the QE of the PMT at the emission wavelength of the GAGG standard and each LGGAG sample. The dependence of the LY on the material composition is shown in Fig. 7(b). The Mg co-doping decreases the light yield significantly for the samples with high Ga concentration (Ga3), while the light yield for Ga1 increases with Mg co-doping. These effects are most probably caused by changes in the stability of the tetravalent Ce and separation of its 5d state from the conduction band (see also Sect. 3.2).
Download figure:
Standard image High-resolution image
Fig. 7. (a) Energy spectra of Ga2; Mg co-doped and non co-doped crystals, (b) dependence of the light yield on the material composition of Ga0, 1, 2, 3, and 4; Mg co-doped and non co-doped crystals. Excitation by 137Cs radioisotope (662 keV).
Download figure:
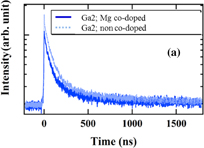
Standard image High-resolution imageScintillation decay curves were measured using a digital oscilloscope (TDS3052B) under excitation by 137Cs radioisotope (662 keV). Figure 8(a) shows the scintillation decay curves of Ga2; Mg co-doped and non co-doped crystals. In order to obtain the decay time values, the collected scintillation decay curves were fitted by the sum of two exponentials I(t) = I0 + ΣAi exp(−t/τi)  , where τ1 is the fast decay time component (first decay time) and τ2 is the slow component (second decay time). As already mentioned in the introduction, the slow components of the decay time occur due to shallow electron traps related to anti-site (LuAl) defects and oxygen vacancies in LuAG-based garnet scintillators.
Download figure:
Standard image High-resolution image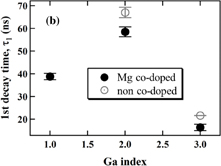
Fig. 8. (a) Scintillation decay curves of Ga2; Mg co-doped and non co-doped crystals, (b) dependence of the first decay time on the material composition of Ga0, 1, 2, and 3; Mg co-doped and non co-doped crystals. Excitation by 137Cs radioisotope (662 keV).
Download figure:
Standard image High-resolution image
Figure 8(b) shows the dependence of the fast component of the decay time on the Ga concentration. Enough signal for the fitting could not be obtained in the case of the Ga:0, 1, and 4, non co-doped and Ga:0 and 4, Mg co-doped samples. The first decay time is the shortest for Ga3 as the Ga-admixture decreases the Fermi level energy while decreasing the stability of the Ce trivalent state. Then the alternative scintillation mechanism involving Ce4+ will prevail; see for example Ref. 11. Furthermore, the first decay time showed the tendency to be accelerated by Mg co-doping, which can be interpreted by the same positive role of Ce4+ center in the scintillation mechanism as described for the silicate crystal (Ce:LYSO)17) and the garnet crystals (Ce:LGAG,10,11) Ce:GAGG8,12)) co-doped with alkali-earth ions. This mechanism of Ce4+ center is explained step by step.29)
The obtained values of the light yield, both components of the decay time, and the theoretical density estimated from the value5,12) are summarized in Table I. The intensities of decay components are indicated in percent with each value of decay time, which are calculated as A1τ1/(A1τ1 + A2τ2) × 100% (A1, A2: constants) for the first component in Table I. In addition to the improvement of the first decay time, the intensities of the first components were increased by Mg co-doping even if the seconddecay time value was degraded (Ga3). This is most probably due to other effects of Mg2+ 30,31) such as 1) the occupants of Ga deficiency sites and 2) obstruction of the formation of shallow electron traps like oxygen vacancies introduced as charge compensators for Ga deficiencies.
Table I. Scintillation properties (light yield and decay time) and theoretical density in Ga0, 1, 2, 3, and 4; Mg co-doped and non co-doped crystals. Scintillation decay times are approximated by the sum of two exponentials I(t) = I0 + ΣAi exp[−t/τi],  . The decay component intensities (%) are indicated for each value of decay time, which are calculated as A1τ1/(A1τ1 + A2τ2) × 100% for the first component.
| Ga | Light yield (photons/MeV) | 1st decay time, τ1 (ns) | 2nd decay time, τ2 (ns) | Theoretical density (g/cm3) | |||
|---|---|---|---|---|---|---|---|
| Non co-doped | Mg co-doped | Non co-doped | Mg co-doped | Non co-doped | Mg co-doped | ||
| 0 | ∼8000 | ∼5000 | N.D. | N.D. | N.D. | N.D. | 6.47a) |
| 1 | ∼3400 | ∼4000 | N.D. | 39 (19%) | N.D. | 189 (81%) | ∼6.69 |
| 2 | ∼16000 | ∼17000 | 67 (52%) | 59 (54%) | 349 (48%) | 293 (46%) | ∼6.91 |
| 3 | ∼28000 | ∼14000 | 22 (20%) | 16 (50%) | ∼56 (80%) | 96 (50%) | 7.13a) |
| 4 | 0 | 0 | N.D. | N.D. | N.D. | N.D. | ∼7.35 |
N.D.: "Not detected" due to the very low intensities of the scintillation response.
a) The theoretical density data in Refs. 5 and 12 were referred.
4. Conclusions
The optical, luminescence, and scintillation characteristics of Mg co-doped and non co-doped Ce:LGGAG single crystals prepared by the µ-PD method were measured. A peak around 260 nm in the absorption difference spectra was observed and has been ascribed to the CT transition from the O2− levels at the top of valence band (VB) to the Ce4+ ground state.
With Mg co-doping, a decreasing trend of the light yield in the samples with high Ga concentration (Ga3) was observed, while the light yield around Ga1 showed an increase with Mg co-doping.
Acceleration of the scintillation decay time and improvement of the intensities of the 1st component were observed by Mg co-doping, which means that Mg co-doping could thus improve the timing characteristics of Ce:LGGAG. The results obtained for these Gd-containing garnet crystals increases our understanding of the co-doping effects on Ce-doped garnet scintillator crystals and also suggest that the chemical composition of Ga3; Mg co-doped crystals is the most promising scintillator of LGGAG crystals for applications which require both high density and fast timing resolution such as PET. In the near future we will report on the high-quality, large-size bulk crystal growth of the host composition described above, namely Ga3; Mg co-doped crystals, and on further improvement of the scintillation responses grown by the Czochralski method.
Acknowledgments
This work was partially supported by JSPS KAKENHI Grant Numbers 38000153 and 16H05986, Cz-jp collaboration project (ASCR-JSPS 2017–2018), Crystal Clear Collaboration in CERN, and EC H2020 program under the Marie Skodowska-Curie Grant agreement No. 644260 (Intelum). In addition, we would like to thank the following persons for their support: Mr. Yoshihiro Nakamura at the Institute of Multidisciplinary Research for Advanced Materials (IMRAM), and Mr. Hiroshi Uemura, Ms. Keiko Toguchi, Ms. Megumi Sasaki, and Ms. Yuka Takeda at IMR, Tohoku University.