

Abstract
Bifunctional Au/Ag nanoparticle-decorated silicon nanowire arrays (Au/Ag@SiNWAs) were prepared using a facile wet chemical method. This surface-enhanced Raman scattering (SERS) substrate not only showed excellent reutilization capabilities by the simple NaBH4 washing, but also could reach a detection limit for drop-dried rhodamine 6G molecules as low as 10−16 M. More importantly, this substrate could be used to monitor the in situ reduction of 4-nitrothiophenol by NaBH4 using SERS spectroscopy. Our findings demonstrate that the bifunctional substrate can serve as a powerful system for the real-time in situ SERS monitoring of catalytic reactions, which should be beneficial for new catalyst exploration.
Export citation and abstract BibTeX RIS
Surface-enhanced Raman scattering (SERS) is a sensitive spectroscopic technique used to provide fingerprint information on analytes with the advantages of not only rapid and nondestructive detection but also high sensitivity, surface-selectivity, and water transparency.1) Many achievements in three-dimensional (3D) nanowire arrays have been reported such as the development of Ag/TiO2 nanowire arrays,2) Ag/Si nanowire arrays3) and Au/Si nanowire arrays.4) However, most of these substrates could be used only once, which has greatly limited SERS applications because of the waste of noble metals, high cost, and even environmental issues. Therefore, there is much room for further optimization of substrates that will enable reutilization and simplification of the synthesis process. The noble metal Ag is an ideal SERS-active material because its nanostructures have a wide range of tunable surface plasmon responses from the visible to near-infrared spectral regions.5,6) At the same time, by taking into account the noble metal Au, another SERS-active material that exhibits catalytic activity, plasmonic Ag and Au nanostructures can exhibit more sensing and catalytic properties.7,8)
Compared with the commonly used ultraviolet–visible absorption spectroscopy or infrared spectroscopy, SERS offers distinct advantages for monitoring interfacial reactions. Moreover, most solvents used including water would induce unavoidable background absorption disturbance in infrared spectroscopy. In situ Raman monitoring is the natural candidate for chemical reaction observation since it is a nondestructive and direct method of obtaining fingerprint vibrations of surface species.9,10) Many studies have employed SERS for the in situ monitoring of noble-metal-catalyzed reactions to reveal the kinetics and reaction mechanisms.11–15) It is critical to find a strategy that is both simple and efficient.
In this work, a 3D Au/Ag nanoparticle (NP)-decorated silicon nanowire array nanostructure (Au/Ag@SiNWAs) with excellent SERS performance and catalytic activity for real-time SERS detection was fabricated. The substrate preparation used had many advantages: (1) the reaction could be conducted at room temperature, (2) no shielding gas was required, and (3) every step of the preparation could be accomplished with in a short time. Si nanowires were prepared by Ag+ etching; then, Au and Ag NPs were reduced in situ onto the surface of the Si nanowires. The sample preparation is presented in the online supplementary data at http://stacks.iop.org/JJAP/57/030308/mmedia. The Au/Ag bimetallic NP-decorated SiNWAs formed a stable 3D nanostructure, more importantly, both the SERS and catalytic activity were maintained. Therefore, this substrate was deemed suitable for the trace detection and in situ SERS monitoring of catalytic reactions.
Scanning electron microscopy (SEM) images and energy-dispersive X-ray spectroscopy (EDS) elemental mappings were obtained using a Hitachi S-4700 scanning electron microscope at an acceleration voltage of 20 kV. Transmission electron microscopy (TEM) images were obtained using a FEI Tecnai 20 transmission electron microscope at an acceleration voltage of 200 kV. Figures 1(a) and 1(b) show SEM images of the as-prepared Au/Ag@SiNWAs substrate, which was highly uniform. The average diameter of the Si nanowires was ∼300 nm; the NPs were distributed equally on the surface of each Si nanowire. The TEM image in Fig. 1(c) reveals that there were two mean sizes of NPs (120 and 80 nm). To distinguish between the Au and Ag NPs, EDS measurements were performed on a selected area, as shown in Fig. 1(d). The EDS elemental mappings of the Ag and Au NPs are presented separately in Figs. 1(e) and 1(f), showing that the Ag and Au NPs were successfully formed on the surface of the Si nanowires. The larger NPs with a mean diameter of 120 nm are Ag NPs, whereas the smaller NPs with a mean diameter of 80 nm are Au NPs. The merged image in Fig. 1(g) further supports the view that these two metal NPs were equally distributed on the surface of the SiNWAs.

Fig. 1. SEM images of the Au/Ag@SiNWAs: (a) aerial and (b) side views. (c) TEM image of a single Au/Ag@Si nanowire. (d) SEM image showing the selected area of EDS measurement. EDS elemental mapping images of (e) Ag and (f) Au. (g) Merged image of (e) and (f).
Download figure:
Standard image High-resolution imageRaman spectra were collected using a LabRAM ARAMIS Raman system with a 633 nm line laser as the excitation source and a laser power of 5 mW. The SERS performance of the Au/Ag@SiNWAs substrate was explored using rhodamine 6G (R6G) as the probe molecule, which has been extensively used for SERS because of its well-established vibrational features.16) The Raman spectra of R6G solution at different concentrations were detected after the solution was dropped onto the Au/Ag@SiNWAs substrate and then allowed to evaporate naturally. Figure 2(a) presents the Raman spectra of the R6G solution at concentrations ranging from 0.1 to 10−17 M. The fingerprint Raman peaks of R6G at 611, 778, 1184, 1309, 1361, 1507, 1577, and 1652 cm−1 vibrations17) were still clear even at 10−16 M. To investigate the changes in the R6G Raman spectra with the change in concentration, the relationship between the SERS integrated intensity of the peak centered at ∼1361 cm−1 and the R6G concentration is plotted in Fig. 2(b). When logarithm-scale axes were used, the response between the logarithmic integrated signal intensity (log I) and the logarithmic concentration (log C) was linear, as shown in the inset in Fig. 2(b). The linear relationship between log I and log C was previously confirmed to follow the Langmuir isotherm for the adsorption of an analyte molecule.18) The linear relationship can be used to determine the unknown concentration of R6G in solution with this substrate.
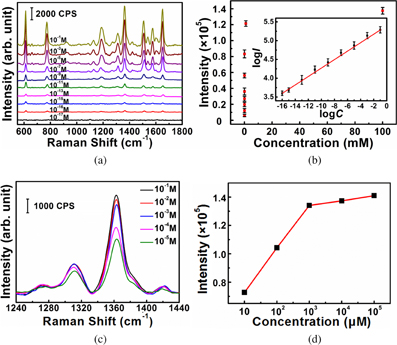
Fig. 2. (a) SERS spectra of R6G solution at various concentrations. (b) Response curve of the integrated SERS band at 1361 cm−1 of R6G; the inset presents the quantitative logarithmic relation curve. (c) SERS spectra of R6G solution with concentrations ranging from 10−5 to 0.1 M. (d) Corresponding integrated SERS band at 1361 cm−1 of R6G at concentrations ranging from 10−5 to 0.1 M.
Download figure:
Standard image High-resolution imageThe SERS enhancement factor (EF) of the Au/Ag@SiNWAs substrate was calculated using the commonly accepted equation19) EF = (ISERS/IRaman) × (NRaman/NSERS), where the parameters ISERS and IRaman represent the Raman band for SERS and the conventional Raman spectra, respectively. Here, the Raman band centered at 1361 cm−1 was selected to calculate the I values. NRaman is the number of molecules in the non-SERS-active SiNWAs substrate under the laser spot, and NSERS is the number of molecules adsorbed on the Au/Ag@SiNWAs substrate. Figure 2(c) presents the SERS spectra of R6G molecules collected from the Au/Ag@SiNWAs substrate with concentrations ranging from 10−5 to 0.1 M. Figure 2(d) presents the corresponding integrated peak intensity (ISERS) of the 1361 cm−1 Raman band. The ISERS values were significantly enhanced with increasing R6G concentrations up to 10−3 M. However, the ISERS values of 10−2 and 10−1 M are very close to that of 10−3 M. Therefore, the surface of the Au/Ag@SiNWAs substrate is presumed to have been fully absorbed by R6G molecules when the concentration reached 10−3 M. Accordingly, the Au/Ag@SiNWAs substrate exhibited an EF of ∼3.3 × 10⁵. The detailed calculation process is presented in the online supplementary data at http://stacks.iop.org/JJAP/57/030308/mmedia. This high EF indicated that the Au/Ag@SiNWAs substrate exhibited a high SERS efficiency.
To verify the spatial distribution of the electric fields, an ideal 3D finite-different time-domain (FDTD) simulation was performed. Figure 3(a) presents the local model of the Au/Ag@SiNWAs substrate decorated with 80 nm Au NPs and 120 nm Ag NPs on the surface. In this simulation, a 633 nm simulation plane was set. As observed in Figs. 3(b)–3(d), the substrate generated many "hot spots" in the nanogaps between the Au, Ag, and Au–Ag NPs, and these gaps were pivotal for the electromagnetic field enhancement. According to the simulation results, the EF of ∼|E|4 calculated at the maximum of 19.7 V m−1 was ∼1.5 × 10⁵, which corresponds well to the experimental EF of ∼3.3 × 10⁵. The 3D-FDTD simulation results demonstrate that the large electromagnetic field enhancement is related to the nanogaps between the NPs.
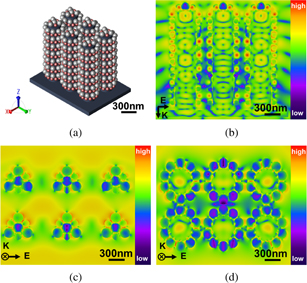
Fig. 3. (a) 3D-FDTD model of Au/Ag@SiNWAs. (b) Calculated spatial distribution of the electric field intensity in the yz plane. Calculated spatial distributions of the electric field intensities of the (c) top and (d) bottom of the xy plane.
Download figure:
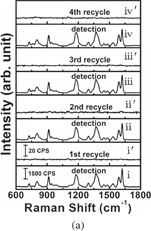
Standard image High-resolution imageInvestigation of the recyclability of SERS substrates is significant because substantial costs can be saved and environmental pollution can be reduced if noble metals can be recycled. For recyclable detection, four types of analytes namely crystal violet (CV), congo red (CR), methylene blue (MB), 4-aminothiophenol (4-ATP), were selected as probe molecules. These four analytes were SERS-detected sequentially; after each detection, the substrate was immersed in 0.1 M NaBH4 aqueous solution for 30 min followed by rinsing with water three times. Figures 4(a) and 4(b) present the results for the analytes collected from the initial SERS detection and after washing with 0.1 M NaBH4 aqueous solution several times, respectively. These analytes can be categorized as one of two types of dyes: those with the mercapto group (–SH) (4-ATP) and those without (MB, CR, CV). Figure 4(a) presents the spectra for 10−5 M CV on the Au/Ag@SiNWAs substrate before and after cleaning with NaBH4 aqueous solution. The CV signal completely disappeared after each NaBH4 aqueous solution rinsing step. As observed in Fig. 4(b), the Au/Ag@SiNWAs substrate was immersed in solutions of CV, CR, MB, and 4-ATP of the same concentration of 10−5 M. Lines i, ii, iii, and iv and i', ii', iii', and iv' represent the SERS spectra before and after washing with NaBH4 aqueous solution, respectively. The detected SERS signals indicate that the analyte signal disappeared every time the substrate was rinsed with NaBH4 aqueous solution, similarly to the phenomenon observed for the recyclable detection of CV. This phenomenon could be related to a hydride derived from NaBH4 exhibiting a higher binding affinity to Au NPs than to Au–S bonds or from the interaction of the N atom and Au NPs, and completely replacing the analytes.20) These results of the SERS analyses indicate that the Au/Ag@SiNWAs substrate exhibits excellent recyclability, which can largely reduce the cost of the SERS test, from the non-recyclable cost of about 20 dollars down to around 5 dollars per measurement according to our estimation. This cost reduction is very important for industrial applications in multiple fields, such as the trace detection of the residues of environmentally harmful nitrogen-containing and mercapto-group-containing dye in the emission process in the dye industry.
Download figure:
Standard image High-resolution image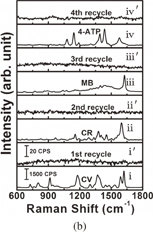
Fig. 4. Recycled performance of Au/Ag@SiNWAs substrate: (a) four cycles of CV and (b) different adsorbed molecules of CV, CR, MB, and 4-ATP.
Download figure:
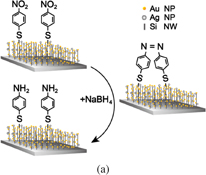
Standard image High-resolution imageThe SERS monitoring of the reduction of 4-nitrothiophenol (4-NTP) by NaBH4 was performed in a liquid environment. First, the Au/Ag@SiNWAs substrate was placed at the bottom of a 500 µL reaction tank. 4-NTP ethanol solution (400 µL, 10−3 M) was then added to the tank and left to stand at room temperature for 15 min, which resulted in the formation of a 4-NTP molecular self-assembled layer on the surface of NPs. Second, the reaction tank was rinsed with ethanol to remove any excess 4-NTP molecules that did not bond with NPs. Third, the reaction tank was placed on the sample stage of the Raman spectroscope. NaBH4 solution (300 µL, 10−2 M) was added, the Raman detection process was started, and the laser (633 nm) was focused on the detection area. As shown in Fig. 5(a), the reaction mechanism could be studied in real time by examining the in situ detection SERS signals of analyte molecules adsorbed on the surface of metal NPs, and transient intermediates during the reaction processes could be evaluated. The 4-NTP molecular monolayer on the surface of metal NPs began to decrease upon the addition of NaBH4 at room temperature. The reduction is a two-step process. First, new vibrational Raman bands of the intermediate are observed upon the addition of NaBH4, which can be assigned to 4,4'-dimercapto-azobenzene (4,4'-DMAB).21) Second, the Raman bands of the final product arise, which correspond to 4-ATP. As observed in Fig. 5(b), the characteristic bands of 4-NTP at 855, 1111, 1345, and 1571 cm−1 correspond to the C–H wagging, C–S stretching, symmetric nitro stretching, and phenyl ring modes, respectively.22) 4 min after the NaBH4 addition, the intensity of the Raman band of 4-NTP at 1345 cm−1 gradually decreased, and new vibrational Raman bands of the intermediate at 1141, 1390, and 1432 cm−1 appeared attributable to the C–N symmetric stretching, N=N stretching, and C–H in-plane bending modes of 4,4'-DMAB, respectively.23) With increasing reaction time [from the bottom to the top of Fig. 5(b)], the concentration of 4,4'-DMAB initially increased and then finally decreased. For a longer reaction time, only additional bands of a third substance appeared [Fig. 5(b) top]. These bands at 1496 and 1593 cm−1 correspond to 4-ATP. 4-ATP was considered the final reaction product for the reduction of 4-NTP by NaBH4, which verifies that the Au/Ag@SiNWAs substrate can be used for in situ chemical reaction monitoring. This Au/Ag@SiNWAs substrate strongly exhibits a dual function in terms of plasmonic and catalytic activities, which may have great potential for environmental protection.
Download figure:
Standard image High-resolution image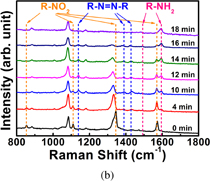
Fig. 5. (a) Schematic diagram showing the chemical reduction of surface-adsorbed 4-NTP to 4-ATP catalyzed by SERS substrates. (b) In situ SERS monitoring of catalytic reduction of 4-NTP to 4-ATP at different reaction times.
Download figure:
Standard image High-resolution image
In summary, the bifunctional 3D structure created vast "hot spots", which showed excellent enhancement of the SERS signal, and this Au/Ag@SiNWAs substrate could be recycled for SERS detection by cleaning it with NaBH4 detergent. In addition, this substrate exhibited great catalytic activity, which was useful for real-time chemical reaction monitoring. The reduction of 4-NTP to 4-ATP catalyzed by the Au/Ag@SiNWAs substrate could be monitored in real time using an in situ SERS method. Because of the composite structure of the substrate, the reaction process could be studied and intermediates could be captured, which accurately revealed the mechanism of the catalytic reaction. This study provides a facile method of synthesizing a bifunctional SERS substrate that can be used to study catalytic reactions. We think that this type of SERS platform could have many potential applications, such as to environmental protection and health monitoring.
Acknowledgements
This work was supported by the National 973 Basic Research Program of China (2013CB733600), the National Natural Science Foundation of China (21676015), the Beijing Natural Science Foundation (4142040), and the Beijing Higher Education Young Elite Teacher Project.