

Abstract
We propose a new asynchronous measurement system to visualize the amplitude and phase distribution of a frequency-modulated electromagnetic wave. The system consists of three parts: a nonpolarimetric electro-optic frequency down-conversion part, a phase-noise-canceling part, and a frequency-tracking part. The photonic local oscillator signal generated by electro-optic phase modulation is controlled to track the frequency of the radio frequency (RF) signal to significantly enhance the measurable RF bandwidth. We demonstrate amplitude and phase measurement of a quasi-millimeter-wave frequency-modulated continuous-wave signal (24 GHz ± 80 MHz with a 2.5 ms period) as a proof-of-concept experiment.
Export citation and abstract BibTeX RIS

Content from this work may be used under the terms of the Creative Commons Attribution 4.0 license. Any further distribution of this work must maintain attribution to the author(s) and the title of the work, journal citation and DOI.
Measurement techniques for millimeter waves (mm waves: 30–300 GHz) and terahertz waves (THz waves: 0.1–10 THz) have recently attracted a great deal of attention, not only in academia but also in industry. In particular, techniques for visualizing the field distribution of electromagnetic (EM) waves will become important in this field1–3) because EM waves are used as the beam in these high-frequency regions, and the beam quality affects the system performance in many applications such as imaging,4–6) radar,7–10) and wireless communication.11,12)
Recently, we proposed an asynchronous technique to investigate the spatial distribution of not only the amplitude but also the phase of the electric field generated by free-running, self-oscillating generators.13) Unlike conventional measurement techniques using a network analyzer, this technique does not require injection of a reference radio frequency (RF) signal into the device under test. Instead, the reference phase is measured using a reference probe to extract the relative phase distribution of the electric field. The frequency and phase fluctuation of the RF signal are canceled out in the measurement system; therefore, the technique is applicable to RF signals with random frequency and phase noise generated by equipment such as CMOS oscillators, Gunn oscillators, resonant tunneling diodes, and quantum cascaded lasers. In principle, any type of frequency fluctuations, including modulation signals such as chirp signals, can be canceled out. However, the bandwidth of the cancellation is limited to several megahertz because an increase in the bandwidth increases the noise level and, hence, decreases the signal-to-noise ratio (SNR) of the measurements. Although a bandwidth of several megahertz is sufficient in many cases for self-oscillating devices, this does not apply to wideband frequency/phase-modulated RF signals such as mm-wave frequency-modulated continuous-wave (FMCW) radars, which are commonly used for advanced driver assistance.14) The required bandwidth for current radar systems for advanced driver assistance is 100–200 MHz for the 24 GHz band and 0.5–1 GHz for the 77 GHz band.15) The bandwidth will be extended to 4 GHz in next-generation systems operating at 79 GHz to improve the resolution of the detection.16)
In this letter, we demonstrate a new asynchronous measurement system to visualize frequency-modulated wideband RF signals. The photonic local oscillator (LO) signal generated by an electro-optic (EO) phase modulator is controlled to track the frequency of the RF signal to be measured so that the frequency deviation of the intermediate frequency (IF) signal is reduced. Hence, this photonic frequency tracking technique significantly enhances the measurable RF bandwidth. We demonstrate electric field visualization of an FMCW signal (24 GHz ± 80 MHz with a 2.5 ms period) as a proof-of-concept experiment.
Figure 1 shows a schematic of the measurement system. The system consists of three parts: a nonpolarimetric EO frequency down-conversion part,17,18) a phase-noise-canceling part,13) and a frequency-tracking part. The optical frequency comb (OFC) generated by phase modulation is used as a photonic LO signal for nonpolarimetric EO frequency down-conversion. Because there is no phase-locking between the RF and LO signals, the frequency of the IF signals fluctuates. In our new system, the frequency drift and/or frequency modulation signal is tracked by controlling the LO frequency so that the frequency deviation of the IF signal is reduced. For frequency tracking, the frequency fluctuation of IF signal 1 is detected by a frequency discriminator and fed back to the signal generator for OFC generation through the controller. The common mode residual frequency fluctuation in the IF signals is canceled out in the phase-noise-canceling part, and the relative phase between the signals measured by the reference EO probe and measurement EO probe is detected by a lock-in amplifier (LIA).
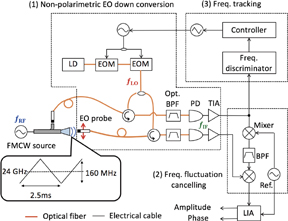
Fig. 1. Schematic of the measurement system. It consists of (1) a nonpolarimetric EO down-conversion part, (2) a phase-noise-canceling part, and (3) a frequency-tracking part. LD: laser diode, EOM: electro-optic modulator, PD: photodiode, TIA: transimpedance amplifier, BPF: bandpass filter, LIA: lock-in amplifier.
Download figure:
Standard image High-resolution imageIn the proof-of-concept experiment, we visualized a quasi-mm-wave FMCW signal that was generated by a synthesizer (Keysight N5183B). The center frequency of the FMCW signal was 24 GHz, and the frequency deviation was ±80 MHz; the period was 2.5 ms. The quasi-mm-wave was divided by a rectangular-waveguide-type power divider. Port 1 of the divider was connected to a K-band standard pyramidal horn antenna, whereas port 2 was kept open. Although the time-delay difference between the RF signals measured by the reference and measurement EO probes was negligible in the proof-of-concept experiment, this effect might be considered for a high-chirp-rate signal. The input power to the horn antenna was ∼230 mW. The modulation frequency for OFC generation was fm = 12.0018 GHz. The ±1st components of the OFC are used for nonpolarimetric EO frequency down-conversion; therefore, the frequency of the IF signal was fIF = 3.6 MHz without frequency modulation. We extracted the −1st components of the OFC for detection. Although the sideband generated by the −3rd components of the OFC is simultaneously extracted by an optical filter, the power of the beat signal between the sideband components is negligible. In the phase-noise-canceling part, IF signal 1 was mixed with the reference signal (1.7 MHz) to generate a frequency-converted IF signal (5.3 MHz). The frequency-converted IF signal was passed through an electrical bandpass filter with a bandwidth of 1 MHz (5–6 MHz) and then mixed with IF signal 2. Therefore, the bandwidth of the current noise cancellation is 1 MHz. We used a fast Fourier transform analyzer as a frequency discriminator. The instantaneous frequency was analyzed and sampled in 38 ms intervals, and the error signal was fed back to the OFC generator. Note that the sampling interval was determined on the basis of the frequency drift rate in the current experiment.
Figure 2 shows the IF response before and after proportional and integral (PI) feedback control. The amplitude and phase of the quasi-mm-wave electric field detected by the LIA are also shown. As the quasi-mm wave to be measured was an FMCW signal, we modulated the LO frequency using the same waveform with a frequency deviation and period of ±80 MHz and 2.5 ms, respectively. However, there was a frequency drift (≈−150 kHz/s) between the RF and LO signals because there is no mutual phase locking between them. As a result, the amplitude and phase could not be measured properly. When the PI feedback control was turned on, the IF was fixed at 3.6 MHz, regardless of the initial frequency difference, and the amplitude and phase were measured properly. Our feedback control does not lock the phase; rather, it tracks the frequency. Thus, there was a residual frequency fluctuation. The standard deviation of the residual frequency fluctuation was 2.1 kHz. It should be noted that our system measures the mutual frequency fluctuation; therefore, the system can be applied to RF signals with an unknown modulation format, although the feedback control should be sophisticated.
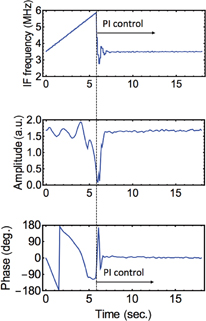
Fig. 2. IF, amplitude, and phase response before and after PI feedback control.
Download figure:
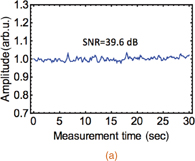
Standard image High-resolution imageFigure 3 shows the measured amplitude and phase of the quasi-mm-wave electric field detected by the LIA. The time constant of lock-in detection was 100 ms. Owing to phase-noise cancellation, the relative phase between the measurement probe, which was at the center of the antenna aperture (15 mm from the antenna), and the reference probe was measured precisely, even with a residual frequency fluctuation of 2.1 kHz. The SNR of the amplitude measurement was 39.6 dB, whereas the standard deviation of the phase measurement was 0.52 deg. We confirmed that this stability held for more than 3 h. Note that we could not measure the SNR without frequency tracking because the IF signal deviates from the cancelling bandwidth (1 MHz) owing to the relative frequency drift. Although the FMCW signal can be canceled out by extending the canceling bandwidth to at least 160 MHz, this results in SNR degradation of more than 22 dB.
Download figure:
Standard image High-resolution image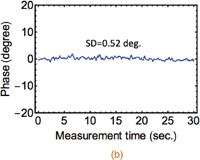
Fig. 3. Measured quasi-mm-wave electric field. (a) Normalized amplitude and (b) phase. The EO sensor was placed at the center of the antenna aperture. The lock-in time constant was 100 ms.
Download figure:
Standard image High-resolution imageFigure 4 shows the visualized amplitude and relative phase distributions of the quasi-mm-wave. Note that the pyramidal horn antennas in Fig. 4 are simulation models; that is, Fig. 4(a) is produced by merging the simulation model and the experimental results. The measurement was conducted for the FMCW signal, whereas the simulation was conducted for a 24 GHz CW signal using CST Microwave Studio. The amplitude data were normalized to their maximum values in each plane. Although the scan area (70 mm) was limited by the mechanical stage, it can be further improved. The frequency deviation of ±80 MHz for a carrier frequency of 24 GHz corresponds to a fractional bandwidth of 0.7%. Although the visualized relative phase distribution is the averaged phase distribution, as shown here, the measured amplitude and phase distribution agree well with the simulated distributions.
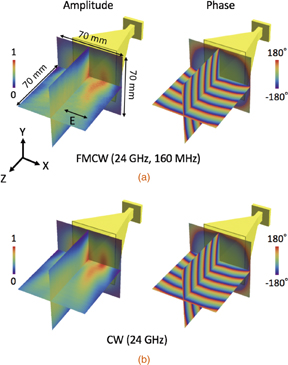
Fig. 4. Amplitude and phase distribution of quasi-mm-wave emitted by horn antenna. (a) Measured results for FMCW signal and (b) simulated results for CW signal. Note: The pyramidal horn antennas are simulation models.
Download figure:
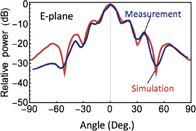
Standard image High-resolution imageFigure 5 shows the far-field radiation pattern obtained from the measured near-field pattern. This simulation was also conducted for the CW signal. The E plane was parallel to the XZ plane, and the H plane was parallel to the YZ plane. The radiation pattern determined from the measured amplitude and phase distribution for the FMCW signal agrees well with the simulated pattern. Hence, we conclude that our system is applicable for beam quality checking of frequency-modulated radiation.
Download figure:
Standard image High-resolution image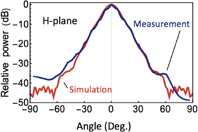
Fig. 5. Radiation patterns of horn antenna obtained from measured near-field pattern.
Download figure:
Standard image High-resolution image
The target frequency can easily be extended to mm-wave and THz-wave bands by using a higher modulation frequency and/or choosing a higher order of the OFC components. Although the tracking bandwidth is limited by the bandwidth of the EO phase modulator for OFC generation, it can easily be extended to several tens of gigahertz by choosing a higher order of the OFC components.
We proposed and demonstrated a new scheme for measuring the amplitude and phase distribution of a frequency-modulated EM wave. As a proof-of-concept experiment, we visualized an FMCW radar signal in the 24 GHz band and demonstrated that the radiation pattern obtained from the measured amplitude and phase distribution agrees well with the simulated radiation pattern obtained at a fixed frequency of 24 GHz. In principle, our measurement scheme can be applied to not only FMCW radar signals but also any type of unknown frequency/phase modulation format. Moreover, the target RF signal and its bandwidth can easily be extended to the THz wave range and several tens of gigahertz, respectively. Our system paves the way for a new inspection method for applications such as real car radar and on-chip antenna devices19,20) for mm-wave and THz-wave wireless communications.
Acknowledgment
This work was supported by SENTAN, JST.