
Abstract
A nitridation process of a diamond surface with nitrogen radical exposure far from the radio-frequency plasma for the stabilization of a negatively charged nitrogen-vacancy (NV−) centers near the surface is presented. At a nitrogen coverage of as high as 0.9 monolayers, high average Rabi contrasts of 0.40 ± 0.06 and 0.46 ± 0.03 have been obtained for single NV− centers formed by shallow nitrogen implantation with acceleration voltages of 1 and 2 keV, respectively. This indicates that nitrogen termination by a radical exposure process produces an electric charge state suitable for single NV− centers near the surface compared with the states obtained for alternatively terminated surfaces.
Export citation and abstract BibTeX RIS

Content from this work may be used under the terms of the Creative Commons Attribution 4.0 license. Any further distribution of this work must maintain attribution to the author(s) and the title of the work, journal citation and DOI.
Negatively charged nitrogen-vacancy (NV−) centers in diamond possess many remarkable properties, such as long spin coherent times (T2 ≧ 1.8 ms)1) even at room temperature and a triplet spin state (S = 1), which can be initialized and read out by optical control.1,2) Owing to these properties, the NV− center is proposed to be a promising candidate for a quantum sensor,3) single photon source,4) and single nuclear spin detector.5) For these applications, a shallow NV− center6) within a few nanometers from the diamond surface is desirable because the dipole magnetic field scales as 1/r3, where r is the distance from the NV− center to the target. However, the charge state of a shallow NV− center is unstable and is easily converted to a neutral charge state (NV0)7) since the NV−/NV0 transition level is located in the midgap of diamond (2.9 eV from the valence band edge). Some band engineering approaches have been adopted for the charge stabilization of NV centers;6,8,9) however, an appropriate surface termination with low damage is especially significant for the charge stability of shallow NV centers.
An oxygen-terminated (O-termed) diamond surface, which exhibits positive electron affinity (PEA), is conventionally formed to stabilize the charge state of shallow NV− centers. Acid treatment is one of the basic methods of forming an oxygen termination (O-term); however, our group reported that the charge state of shallow NV− centers with the O-term formed by acid treatment was relatively unstable.10) The oxygen plasma process is another way of forming the O-term. The problem associated with this process is the generation of unwanted surface damage.11) Recently, low-damage methods, such as thermal oxidation10,12) and the remote plasma process,13) have been established, and the charge stability of shallow NV− centers with the O-term has gradually been improved.
A nitrogen-terminated (N-termed) diamond surface is another candidate for the charge stabilization of a shallow NV− center. Theoretical band structure calculations for an N-termed diamond surface14) predicted that the full N (N dimer) and N/H-termed (N–C–H) diamond surfaces exhibit PEA and are strain free, whereas an O-termed surface is strained owing to the C–O–C bridges at the surface. Recently, in situ X-ray photoelectron spectroscopy (XPS) and secondary electron emission (SEE) measurements15) have indicated that an N-termed diamond surface, formed by a radio frequency (RF) plasma process, exhibits PEA, and downward band bending is advantageous for the stabilization of NV− centers. However, surface damage and the variation of the chemical bonds of the N-term are observed. In this study, we also attempt to establish a moderate process for nitrogen termination (N-term) by nitrogen radical (N-radical) exposure far from the radical source, which is generally used for gallium nitride (GaN) molecular beam epitaxy (MBE). For RF-MBE growth, adding a small amount of hydrogen radicals is an advantageous method of cleaning the substrate surface with a small effect on nitridation.16) Before and after N-radical exposure, we evaluated the surface chemical bond precisely using XPS in boron-doped (conducting) diamond and investigated the effect of the N-termed surface on the charge stability of a shallow NV− center in pure (insulating) diamond using photoluminescence (PL) intensity mapping and optically detected magnetic resonance (ODMR) measurements.
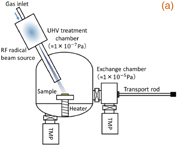
A pure (001) single crystalline diamond with a nitrogen concentration of less than 1014 cm−3 and a natural abundance ratio (1.1%) of 13C (Sample A) was used as the substrate for the evaluation of the NV centers. Shallow single NV centers were created by low-energy 15N-ion implantation and subsequent thermal annealing under optimized conditions (1000 °C for 2 h2)). The 15N ion was used to distinguish 15NV centers created by ion implantation from the natural 14NV center. Two low acceleration energies of 1.0 and 2.0 keV, with the same fluence of 1 × 109 cm−2, were applied to create the shallow NV centers. The depth distribution of the nitrogen atoms was calculated by Monte Carlo simulation (SRIM) and the average depths at 1.0 and 2.0 keV were estimated to be 2.3 ± 1.0 and 3.8 ± 1.6 nm, respectively. The O-termed surface, formed by acid treatment with a  mixture of HNO3 and H2SO4 at 200 °C for 30 min, was used as a reference for the N-term. Sample A before and after N-radical exposure (O- and N-term) are hereinafter referred to as samples A-1 and A-2, respectively. Figure 1(a) shows the schematic diagram of the nitridation apparatus with an RF radical beam source (ARIOS IRFS-504). The base pressure of the main chamber was ∼1 × 10⁻⁷ Pa. A mixture gas of N2 (96%) and H2 (4%), with a flow rate of 2.0 sccm, flowed into the RF plasma generator. The activated species passed through a narrow cylinder and reached the diamond substrate after neutralization. A small amount of hydrogen gas was added to clean the diamond surface and to terminate the excess dangling bonds, which might affect the surface charge stability. Figure 2(b) shows a schematic diagram of the mixed surface chemical bonds formed by N radical exposure. The predominant nitrogen-related surface groups are "full N" (N dimer),14) N/H (N–C–H),14) C–NH2, and C–NH3+. During the 20 min N radical exposure at 5 × 10⁻³ Pa, the substrate temperature was maintained at 200 °C. To evaluate the surface termination by XPS with a monochromatic Al Kα X-ray source, we prepared two boron-doped (conducting) homoepitaxial samples (Samples B-1 and B-2) before and after the same N radical exposure as samples A-1 and A-2, respectively. An ohmic contact to the sample surface was made by attaching colloidal graphite (Aquadag) to avoid charging-up during the XPS measurement. The binding energy scale was calibrated using Ag and Au reference samples.
Download figure:
Standard image High-resolution image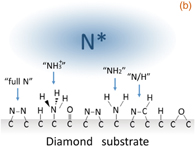
Fig. 1. Schematic diagram of (a) the radio frequency radical exposure system and (b) mixed surface state formed by nitrogen radical exposure. The types of C–N bonds classified as full N, N/H, NH2, and NH3+ are schematically shown.
Download figure:
Standard image High-resolution image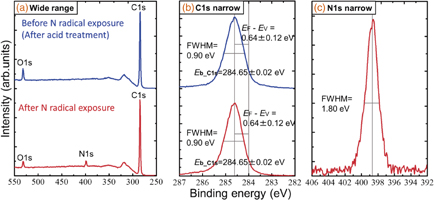
Fig. 2. (a) Wide-range XPS spectra of the samples before and after nitrogen radical exposure (samples B-1 and B-2). (b) C 1s narrow scan spectra of the samples before and after nitrogen radical exposure. (c) N 1s narrow scan spectra of the sample after nitrogen radical exposure.
Download figure:
Standard image High-resolution imageThe XPS wide scan spectra of samples B-1 and B-2 (before and after N radical exposure) are shown in Fig. 2(a). In the XPS spectrum of sample B-1, a strong O 1s peak derived from the acid treatment was observed. However, in the XPS spectrum of sample B-2, the intensity of the O 1s peak decreased to about half the value and the N 1s peak appeared. This indicates that the oxygen atoms terminating the diamond surface were replaced by nitrogen atoms. Figure 2(b) shows that the binding energy of C 1s was not changed before and after N radical exposure (Eb_C1s = 284.65 ± 0.02 eV); hence, the value of EF − EV was not changed (EF − EV = 0.64 ± 0.12 eV). Here, EF is a Fermi level and EV is a valence band maximum. The FWHM of C 1s was not changed before and after N radical exposure (FWHM = 0.90 eV), which indicates that the C–C binding state of the diamond near the surface was preserved and that our N radical exposure did not damage the diamond surface, whereas the C 1s FWHM from the previous report15) increased after nitridation, indicating the coexistence of sp3 and sp2 bonds. The N 1s peak after N radical exposure [Fig. 2(c)] was sharper (FWHM = 1.8 eV) than that in a previous report (FWHM = 2.7 eV)15) and mainly a single component (C–N bonds) was observed. Considering the obtained Fermi level position near the surface and one component of the N 1s peak, the surface was mainly covered by "full N" or "N/H" as well as small amounts of NH2 and NH3+, which might result in a negative electron affinity (NEA).17) Generally, the coverage (thickness) of the surface-terminated impurity layers was calculated using the integrated intensity ratio of the impurity peak to the C 1s peak as below:18)
where λ is the mean free path of the photoelectron, θ is the polar angle of the electron emission inside the solid (θ = 45° in the present case), σ is the photoelectron cross section, T is the translation ratio of photoelectrons to the analyzer, and I is the integrated intensity of the relevant photoelectron peak. By adapting the integrated intensity of our XPS results to this calculation, with an approximation for simplification, the coverage of the N-containing layer was estimated to be 0.9 monolayers (ML) and that of the O-containing layer was ∼0.6 ML for sample B-2. Here, an ML is defined as the density of the first-layer carbon atoms on a (100) diamond surface of ∼1.6 × 10¹⁵/cm2. Since the possibility of the physical adsorption of nitrogen to the surface is extremely low, the high nitrogen coverage of 0.9 ML indicated that our N radical exposure process was extremely effective for the formation of a high coverage of C–N bonds (N-term), and the main cause of the oxygen coverage of ∼0.6 ML was ascribed to the adsorbed water molecules as the sample was exposed to air.
A custom-built confocal laser scanning fluorescence microscope (CFM) was used to observe and evaluate the properties of the single NV centers. The details of the system were described previously.10) Figures 3(a) and 3(b) show the confocal PL-intensity mapping, obtained with a 532 nm excitation laser, of samples A-1 and A-2 (before and after N radical exposure) in the 2 keV injection area, respectively. First, we confirmed the creation of the NV centers, and the average photon counts of each spot was 110 kcps. Hence, we roughly estimated each NV center as a single NV center. Both of the average S/N (PL-intensity of single NV centers/background) ratios before and after N radical exposure were estimated to be ∼10. Oliveira et al.13) reported that the oxygen plasma treatment increased the background noise level, so that the S/N ratio decreased. However, our N radical exposure process seems to create no substantial defects or damage.

Fig. 3. Examples of the photoluminescence images and ODMR measurements in the 2 keV region. PL-intensity mapping images (a) before nitrogen radical exposure (oxygen termination) and (b) after nitrogen radical exposure (nitrogen termination). Rabi oscillations (c) before nitrogen radical exposure and (d) after nitrogen radical exposure. Fourier transformations of the Ramsey FID (e) before nitrogen radical exposure and (f) after nitrogen radical exposure.
Download figure:
Standard image High-resolution imageFigures 3(c) and 3(d) show examples of Rabi oscillations of single NV centers in the 2 keV injection region for samples A-1 and A-2 (before and after N radical exposure), respectively. Here, we define the contrast of Rabi oscillations C as
where Ftop, Fbottom, and Fmiddle = (Ftop + Fbottom)/2 are the normalized fluorescence intensities of the top, bottom, and middle of the Rabi oscillations, respectively. C is a significant parameter for evaluating the charge stability of the NV− center against the NV0 reported previously.10) The decrease in the C value means that the charge state of a certain NV− center transfers to that of the NV0 center. The C value (C = 0.28) of the NV− center before N radical exposure (O-term) is smaller than the theoretical transition rates and lifetimes of the bulk NV− spin systems (C ≃ 0.5) and the previously reported values of the bulk NV− centers (C ≃ 0.46).10) However, the C value (C = 0.49) of the NV− center was higher after N radical exposure (N-term) than before N radical exposure (O-term). This means that the charge state of the NV− center with the N-termed surface is sufficiently stable for pulsed ODMR measurements compared with the surface before N radical exposure. The hyperfine interaction between the NV electronic spin and the host nitrogen nuclear spin using a Fourier transformation (FT) of the Ramsey free induction decay (FID) was observed to distinguish the 15NV− centers from the 14NV− centers. Figures 3(e) and 3(f) show the FT results of the NV center measured in Figs. 3(c) and 3(d), respectively. We were unable to distinguish if the NV center before N radical exposure was a 14NV center or a 15NV center; however, we were able to identify the NV center after N radical exposure as either a 14NV center or a 15NV center on the basis of the hyperfine splitting width of ∼3 MHz.
To confirm the above results statistically, we measured several Rabi contrasts and Ramsey FIDs of single NV− centers in the 1 and 2 keV injection area before and after N radical exposure and summarized the results in Fig. 4. The spread of the Rabi contrast can be approximated by a Gaussian distribution. In both the 1 and 2 keV injection regions, the average C value increased after N radical exposure. Since the influence of the diamond surface became small as the depth of the NV− centers increased, the average C value was higher in the 2 keV injection region than in the 1 keV region, and we obtained the highest average C (0.46 ± 0.03) in the 2 keV region after N radical exposure. From the results of FT of the Ramsey FID in Fig. 4, NV− centers with high Rabi contrast were easily identified as either a 14NV− center or a 15NV− center, and the probability that we could identify the NV− center was higher after N radical exposure. Here, note that the depth at which we observed the 15NV− centers was small, because 15N atoms were selectively implanted at 1–2 keV. On the other hand, while the depth distribution of the observed native 14NV− centers was unknown, some observed 14NV− centers might also be at a small depth because a large amount of vacancies were created near the diamond surface during the 15N implantation, and some of these vacancies may have coupled with native 14N upon annealing at 1000 °C. Considering the above, one of the reasons the FID of NV− centers with low Rabi contrast could not be observed was the decharging from NV− centers to the other sites, including the unoccupied surface state. Additionally, the reason the probability was higher after N radical exposure may be that the surface modification by N radical exposure treatment suppressed the decharging and stabilized the charge state of the shallow NV− center.

Fig. 4. Summary of Rabi oscillation contrast of the NV centers in the (a) 1 keV region before nitrogen radical exposure (oxygen termination), (b) 2 keV region before nitrogen radical exposure (oxygen termination), (c) 1 keV region after nitrogen radical exposure, and (d) 2 keV region after nitrogen radical exposure.
Download figure:
Standard image High-resolution image
In this study, we demonstrate that our N radical exposure process is effective for the charge stability of shallow NV− centers by the monolayer coverage of the N-term. The evaluation of the Rabi contrast revealed that the charge state of the shallow NV− center with the N-term was sufficiently stable compared with that with the O-term. We expect that this work will enhance the future performance of applications such as nanoscale NMR using a single NV− center as a sensor.
Acknowledgments
This work was supported by a Grant-in-Aid for Scientific Research (S) (Grant Number 26220903), Grant-in-Aid for Scientific Research (A) (Grant Number 26246001), and Grant-in-Aid for Scientific Research (B) (Grant Number 15H03980) from the Japan Society for the Promotion of Science (JSPS). We thank Dr. Liam P. McGuinness and Professor Fedor Jelezko for their help with setting up the CFM.