Homo-oligomerization of the human adenosine A2A receptor is driven by the intrinsically disordered C-terminus
- Department of Chemistry and Biochemistry, University of California, Santa Barbara, United States
- Department of Chemical Engineering, University of California, Santa Barbara, United States
- C. Eugene Bennett Department of Chemistry, West Virginia University, United States
Abstract
G protein-coupled receptors (GPCRs) have long been shown to exist as oligomers with functional properties distinct from those of the monomeric counterparts, but the driving factors of oligomerization remain relatively unexplored. Herein, we focus on the human adenosine A2A receptor (A2AR), a model GPCR that forms oligomers both in vitro and in vivo. Combining experimental and computational approaches, we discover that the intrinsically disordered C-terminus of A2AR drives receptor homo-oligomerization. The formation of A2AR oligomers declines progressively with the shortening of the C-terminus. Multiple interaction types are responsible for A2AR oligomerization, including disulfide linkages, hydrogen bonds, electrostatic interactions, and hydrophobic interactions. These interactions are enhanced by depletion interactions, giving rise to a tunable network of bonds that allow A2AR oligomers to adopt multiple interfaces. This study uncovers the disordered C-terminus as a prominent driving factor for the oligomerization of a GPCR, offering important insight into the effect of C-terminus modification on receptor oligomerization of A2AR and other GPCRs reconstituted in vitro for biophysical studies.
Introduction
G protein-coupled receptors (GPCRs) have long been studied as monomeric units, but accumulating evidence demonstrates that these receptors can also form homo- and hetero-oligomers with far-reaching functional implications. The properties emerging from these oligomers can be distinct from those of the monomeric protomers in ligand binding (El-Asmar et al., 2005; Casadó-Anguera et al., 2016; Guitart et al., 2014; Yoshioka et al., 2001), G protein coupling (Cristóvão-Ferreira et al., 2013; Cordomí et al., 2015; González-Maeso et al., 2007; Lee et al., 2004; Rashid et al., 2007), downstream signaling (Liu et al., 2016; Hilairet et al., 2003; Rozenfeld and Devi, 2007; Borroto-Escuela et al., 2010), and receptor internalization/desensitization (Ecke et al., 2008; Stanasila et al., 2003; Faklaris et al., 2015). With the vast number of genes identified in the human genome (Takeda et al., 2002), GPCRs are able to form a daunting number of combinations with unprecedented functional consequences. The existence of this intricate network of interactions among GPCRs presents major challenges and opportunities for the development of novel therapeutic approaches (Dorsam and Gutkind, 2007; Farran, 2017; Schonenbach et al., 2015; Ferré et al., 2014; Bräuner-Osborne et al., 2007; George et al., 2002). Hence, it is crucial to identify the driving factors of GPCR oligomerization, such that this process can be more deliberately controlled to facilitate structure-function studies of GPCRs.
GPCR oligomers with multiple interfaces (Song et al., 2020; Ghosh et al., 2014; Periole et al., 2012; Fanelli and Felline, 2011; Liu et al., 2012) can give rise to myriad ways by which these complexes can be formed and their functions modulated. In the crystal structure of the turkey β1-adrenergic receptor (β1AR), the receptor appears to dimerize via two different interfaces, one formed via TM4/TM5 (transmembrane domains 4/5) and the other via TM1/TM2/H8 (helix 8) contacts (Huang et al., 2013). Similarly, in the crystal structure of the antagonist-bound μ-opioid receptor (μ-OR), the protomers also dimerize via two interfaces; however, only one of them is predicted to induce a steric hindrance that prevents activation of both protomers (Manglik et al., 2012), hinting at interface-specific functional consequences. A recent computational study predicted that the adenosine A2A receptor (A2AR) forms homodimers via three different interfaces and that the resulting dimeric architectures can modulate receptor function in different or even opposite ways (Fanelli and Felline, 2011). All the above-mentioned interfaces are symmetric, meaning that the two protomers are in face-to-face orientations, hence forming strictly dimers. Asymmetric interfaces, reported in M3 muscarinic receptor (Thorsen et al., 2014), rhodopsin (Fotiadis et al., 2006; Fotiadis et al., 2003; Liang et al., 2003), and opsin (Liang et al., 2003), are in contrast formed with the protomers positioning face-to-back, possibly enabling the association of higher-order oligomers.
Not only do GPCRs adopt multiple oligomeric interfaces, but various studies also suggest that these interfaces may dynamically rearrange to activate receptor function (Xue et al., 2015). According to a recent computational study, A2AR oligomers can adopt eight different interfaces that interconvert when the receptor is activated or when there are changes in the local membrane environment (Song et al., 2020). Similarly, a recent study that combined experimental and computational data proposed that neurotensin receptor 1 (NTS1R) dimer is formed by ‘rolling’ interfaces that coexist and interconvert when the receptor is activated (Dijkman et al., 2018). Clearly, meaningful functional studies of GPCRs require exploring their dynamic, heterogeneous oligomeric interfaces.
The variable nature of GPCR oligomeric interfaces suggests that protomers of GPCR oligomers may be connected by tunable interactions. In this study, we explore the role of an intrinsically disordered region (IDR) of a model GPCR that could engage in diverse non-covalent interactions, such as electrostatic interactions, hydrogen bonds, or hydrophobic interactions. These non-covalent interactions are readily tunable by external factors, such as pH, salts, and solutes, and further can be entropically enhanced by depletion interactions (Asakura and Oosawa, 1958; Yodh et al., 2001; Marenduzzo et al., 2006), leading to structure formation and assembly (Milles et al., 2018; Wicky et al., 2017; Szasz et al., 2011; Goldenberg and Argyle, 2014; Qin and Zhou, 2013; Cino et al., 2012; Soranno et al., 2014; Zosel et al., 2020). In a system where large protein molecules and small solute particles typically coexist in solution, assembly of the protein molecules causes their excluded volumes to overlap and the solvent volume accessible to the non-protein solutes to increase, raising the entropy of the system. The type and concentration of solutes or ions can also remove water from the hydration shell around the proteins, further enhancing entropy-driven protein-protein association in what is known as the hydrophobic effect (Tanford, 1980; Tanford, 1978; Pratt and Chandler, 1977; van der Vegt et al., 2017). This phenomenon is applied in the precipitation of proteins upon addition of so-called salting-out ions according to the Hofmeister series (Hofmeister, 1888; Hyde et al., 2017; Yang, 2009). The ability of IDRs to readily engage in these non-covalent interactions motivates our focus on the potential role of IDRs in driving GPCR oligomerization.
The cytosolic carboxy (C-)terminus of GPCRs is usually an IDR (Tovo-Rodrigues et al., 2014; Jaakola et al., 2005). Varying in length among different GPCRs, the C-terminus is commonly removed in structural studies of GPCRs to enhance receptor stability and conformational homogeneity. A striking example is A2AR, a model GPCR with a particularly long, 122-residue, C-terminus that is truncated in all published structural biology studies (Song et al., 2020; Fanelli and Felline, 2011; García-Nafría et al., 2018; Sun et al., 2017; Lebon et al., 2011; Xu et al., 2011; Doré et al., 2011; Jaakola et al., 2008; Carpenter et al., 2016; Hino et al., 2012). However, evidence is accumulating that such truncations—shown to affect GPCR downstream signaling (Koretz et al., 2021; Navarro et al., 2018a; Jain and McGraw, 2020)—may abolish receptor oligomerization (Schonenbach et al., 2016; Svetlana and Devi, 1997). A study using immunofluorescence has demonstrated that C-terminally truncated A2AR does not show protein aggregation or clustering on the cell surface, a process readily observed in the wild-type form (Burgueño et al., 2003). Our recent study employing a tandem three-step chromatography approach uncovered the impact of a single-residue substitution of a C-terminal cysteine, C394S, in reducing the receptor homo-oligomerization in vitro (Schonenbach et al., 2016). In the context of heteromerization, mass spectrometry and pull-down experiments have demonstrated that A2AR-D2R dimerization occurs via direct electrostatic interactions between the C-terminus of A2AR and the third intracellular loop of D2R (Ciruela et al., 2004). These results all suggest that the C-terminus may participate in A2AR oligomer formation. However, no studies to date have directly and systematically investigated the role of the C-terminus, or any IDRs, in GPCR oligomerization.
This study focuses on the homo-oligomerization of the human adenosine A2AR, a model GPCR, and seeks to address (i) whether the C-terminus engages in A2AR oligomerization, and if so, (ii) whether the C-terminus forms multiple oligomeric interfaces. We use size-exclusion chromatography (SEC) to assess the oligomerization levels of A2AR variants with strategic C-terminal modifications: mutations of a cysteine residue C394 and a cluster of charged residues 355ERR357, as well as systematic truncations at eight different sites along its length. We complemented our experimental study with an independent molecular dynamics (MD) simulation study of A2AR dimers of five C-terminally truncated A2AR variants designed to mirror the experimental constructs. We furthermore examined the oligomerization level of select C-terminally modified A2AR variants under conditions of varying ionic strength ranging from 0.15 to 0.95 M. To verify whether the A2AR oligomer populations are thermodynamic products, we performed a series of SEC analyses on SEC-separated monomer and dimer/oligomer populations to observe their repopulation into monomer and dimer/oligomer populations. Finally, to test whether the C-termini directly and independently promote A2AR oligomerization, we recombinantly expressed the entire A2AR C-terminal segment sans the transmembrane portion of the receptor and investigated its solubility and assembly properties with increasing ion concentration and temperature. This is the first study designed to uncover the role of the intrinsically disordered C-terminus on the oligomerization of a GPCR.
Results
This study systematically investigates the role of the C-terminus on A2AR oligomerization and the nature of the involved interactions through strategic mutations and truncations at the C-terminus as well as modulation of the ionic strength of solvent. All experiments were done at 4°C unless stated otherwise. The experimental assessment of A2AR oligomerization relies on SEC analysis.
SEC quantifies A2AR oligomerization
We performed SEC analysis on a mixture of ligand-active A2AR purified from a custom synthesized antagonist affinity column (Figure 1—figure supplement 1A). Distinct oligomeric species were separated and eluted in the following order: high-molecular-weight (HMW) oligomer, dimer, and monomer (Figure 1 and Figure 1—figure supplement 1B). This peak assignment has been verified with SEC-MALS (multi-angle light scattering) experiments, as detailed in a previous publication (Schonenbach et al., 2016). The population of each oligomeric species was quantified as the integral of each Gaussian from a multiple-Gaussian curve fit of the SEC signal. The reported standard errors were calculated from the variance of the fit that do not correspond to experimental errors (see Supplementary file 1 and Figure 1—figure supplement 2 for SEC data corresponding to all A2AR variants in this study). As this study sought to identify the factors that promote A2AR oligomerization, the populations with oligomeric interfaces (i.e., dimer and HMW oligomer) were compared with those without such interfaces (i.e., monomer). Hence, the populations of the HMW oligomer and dimer were expressed relative to the monomer population in arbitrary units as monomer-equivalent concentration ratios, henceforth referred to as population levels (Figure 1).
Figure 1 with 2 supplements see all

Method for collecting size-exclusion chromatography (SEC) data and assessing A2AR oligomerization.
The SEC data is recorded every second as absorbance at 280 nm. The baseline is corrected to ensure uniform fitting and integration across the peaks. The areas under the curve, resulting from a multiple-Gaussian curve fit, express the population of each oligomeric species. The reported standard errors of integration are within a 95% confidence interval and are calculated from the variance of the fit, not experimental errors. The levels of high-molecular-weight oligomer and dimer are expressed relative to the monomeric population in arbitrary units. A representative calculation defining the oligomer levels is given in the box.
C-terminal amino acid residue C394 contributes to A2AR oligomerization
To investigate whether the C-terminus of A2AR is involved in receptor oligomerization, we first examined the role of residue C394 as a previous study demonstrated that the mutation C394S dramatically reduced A2AR oligomer levels (Schonenbach et al., 2016). The C394S mutation was replicated in our experiments, alongside other amino acid substitutions for the cysteine, namely alanine, leucine, methionine, or valine, generating five A2AR-C394X variants. The HMW oligomer and dimer levels of A2AR wild-type (WT) were compared with those of the A2AR-C394X variants. We found that the dimer level of A2AR-WT was significantly higher than that of the A2AR-C394X variants (WT: 1.14; C394X: 0.24–0.57; Figure 2A). A similar result, though less pronounced, was observed when the HMW oligomer and dimer levels were considered together (WT: 1.34; C394X: 0.59–1.21; Figure 2A). This suggests that residue C394 plays a role in A2AR oligomerization, and even more prominently in A2AR dimerization.
Figure 2
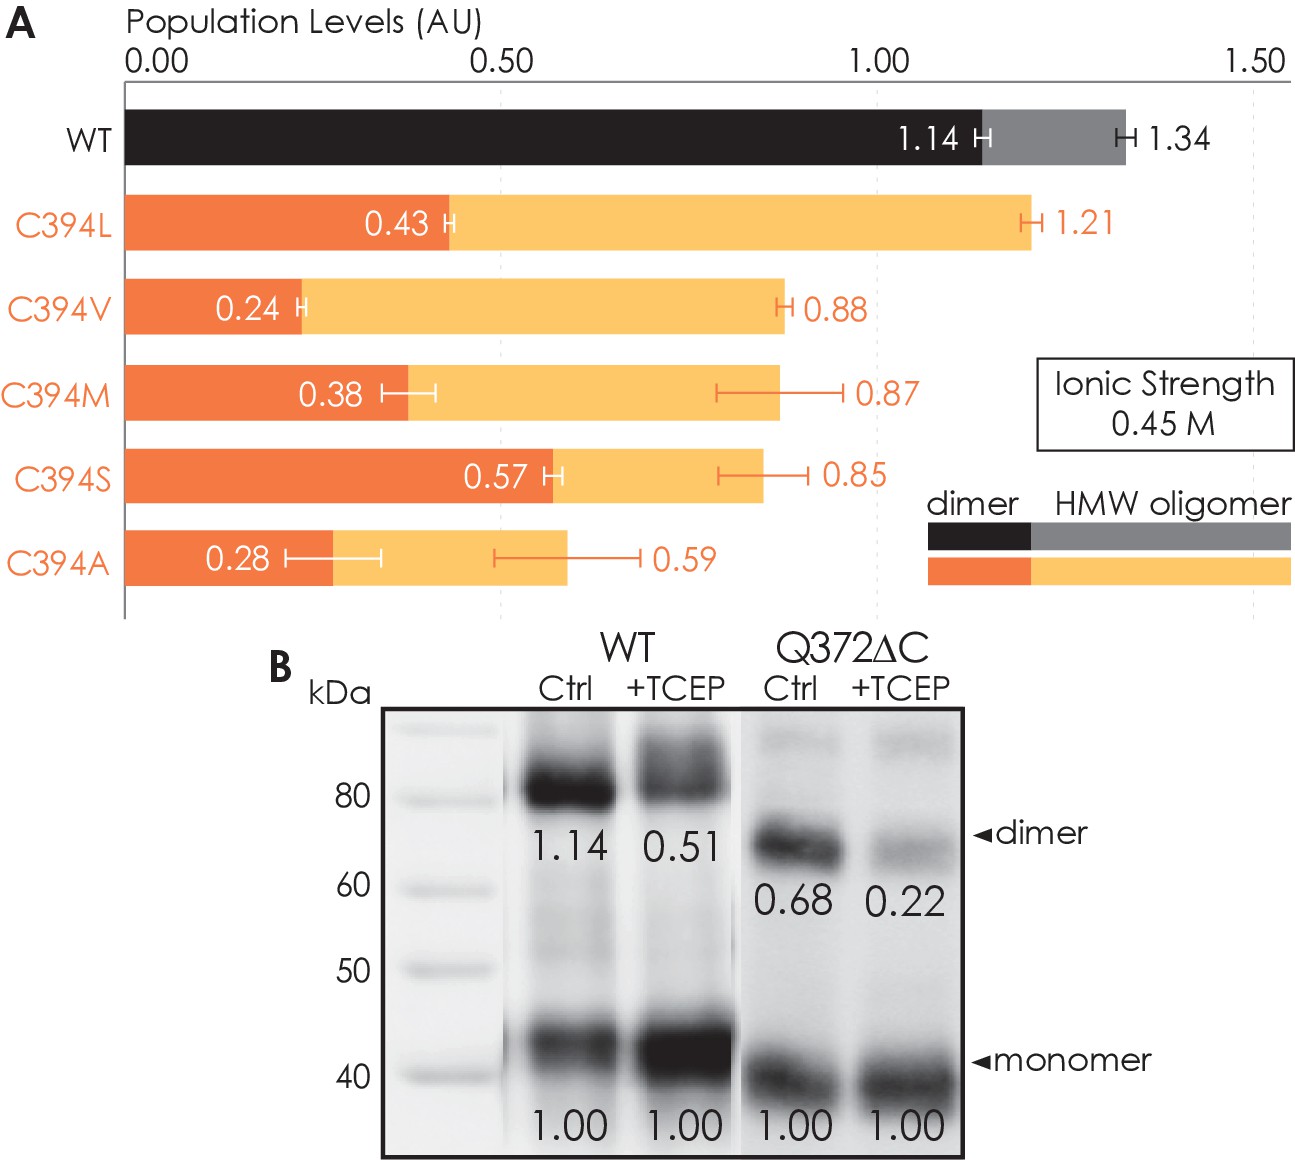
Residue C394 helps stabilize A2AR oligomerization via disulfide bonds.
(A) The effect of C394X substitutions on A2AR oligomerization. The levels of dimer (dark colors) and high-molecular-weight oligomer (light colors) are expressed relative to the monomeric population in arbitrary units, with reported errors calculated from the variance of the fit, not experimental variation. (B) Line densitometry of western blot bands on size-exclusion chromatography (SEC)-separated dimeric populations of A2AR-WT and Q372ΔC with and without 5 mM TCEP. The level of dimer is expressed relative to the monomeric population in arbitrary units similarly to the SEC analysis. MagicMark protein ladder (LC5602) is used as the molecular weight standard.
-
Figure 2—source data 1
Raw western blot of size-exclusion chromatography-separated dimeric populations of A2AR-WT with and without 5 mM TCEP.
- https://cdn.elifesciences.org/articles/66662/elife-66662-fig2-data1-v2.tif.zip
-
Figure 2—source data 2
Raw western blot of size-exclusion chromatography-separated dimeric populations of A2AR-WT with and without 5 mM TCEP.
MagicMark protein ladder (LC5602) is used as the molecular weight standard.
- https://cdn.elifesciences.org/articles/66662/elife-66662-fig2-data2-v2.tif.zip
-
Figure 2—source data 3
Raw western blot of size-exclusion chromatography-separated dimeric populations of A2AR-Q372ΔC with and without 5 mM TCEP.
- https://cdn.elifesciences.org/articles/66662/elife-66662-fig2-data3-v2.tif.zip
-
Figure 2—source data 4
Raw western blot of size-exclusion chromatography-separated dimeric populations of A2AR-Q372ΔC with and without 5 mM TCEP.
MagicMark protein ladder (LC5602) is used as the molecular weight standard.
- https://cdn.elifesciences.org/articles/66662/elife-66662-fig2-data4-v2.tif.zip
-
Figure 2—source data 5
Raw size-exclusion chromatography data of A2AR-WT and C394X variants.
- https://cdn.elifesciences.org/articles/66662/elife-66662-fig2-data5-v2.xlsx
To test whether residue C394 stabilizes A2AR dimerization by forming disulfide linkages, we incubated the SEC-separated dimers of A2AR-WT and A2AR-Q372ΔC with 5 mM of the reducing agent TCEP, followed by SDS-PAGE and western blotting. The population of each species was determined as the area under the densitometric trace. The dimer level was then expressed as monomer-equivalent concentration ratios in a manner similar to that of the SEC experiment described above. Upon incubation with TCEP, the dimer level of the A2AR-WT sample decreased from 1.14 to 0.51 (Figure 2B). This indicates that disulfide bond formation via residue C394 is one possible mechanism for A2AR dimerization. Interestingly, the dimer level of the A2AR-Q372ΔC sample also decreased from 0.68 to 0.22 (Figure 2B). This suggests that there may exist other inter-A2AR disulfide bonds that do not involve residue C394. Still, in both cases, a clearly visible population of A2AR dimer persists, even after reduction of disulfide bonds via TCEP (Figure 2B), suggesting that there must be additional interfacial sites that help drive A2AR dimer/oligomerization.
C-terminus truncation systematically reduces A2AR oligomerization
To determine which interfacial sites in the C-terminus other than the disulfide-bonded cysteines drive A2AR dimer/oligomerization, we carried out systematic truncations at eight sites along the C-terminus (A316, V334, G344, G349, P354, N359, Q372, and P395), generating eight A2AR-ΔC variants (Figure 3A). The A2AR-A316ΔC variant corresponds to the removal of the entire disordered C-terminal region and is used in all published structural studies of A2AR (Martynowycz et al., 2020; Song et al., 2020; García-Nafría et al., 2018; Sun et al., 2017; Carpenter et al., 2016; Hino et al., 2012; Xu et al., 2011; Lebon et al., 2011; Doré et al., 2011; Jaakola et al., 2008; Fanelli and Felline, 2011). Using the SEC analysis described earlier (Figure 1), we evaluated the HMW oligomer and dimer levels of the A2AR-ΔC variants relative to that of the A2AR full-length-wild-type (FL-WT) control. Both the dimer and the total oligomer levels of A2AR decreased progressively with the shortening of the C-terminus, with almost no oligomerization detected upon complete truncation of the C-terminus at site A316 (Figure 3B). This result shows that the C-terminus drives A2AR oligomerization, with multiple potential interaction sites positioned along much of its length.
Figure 3
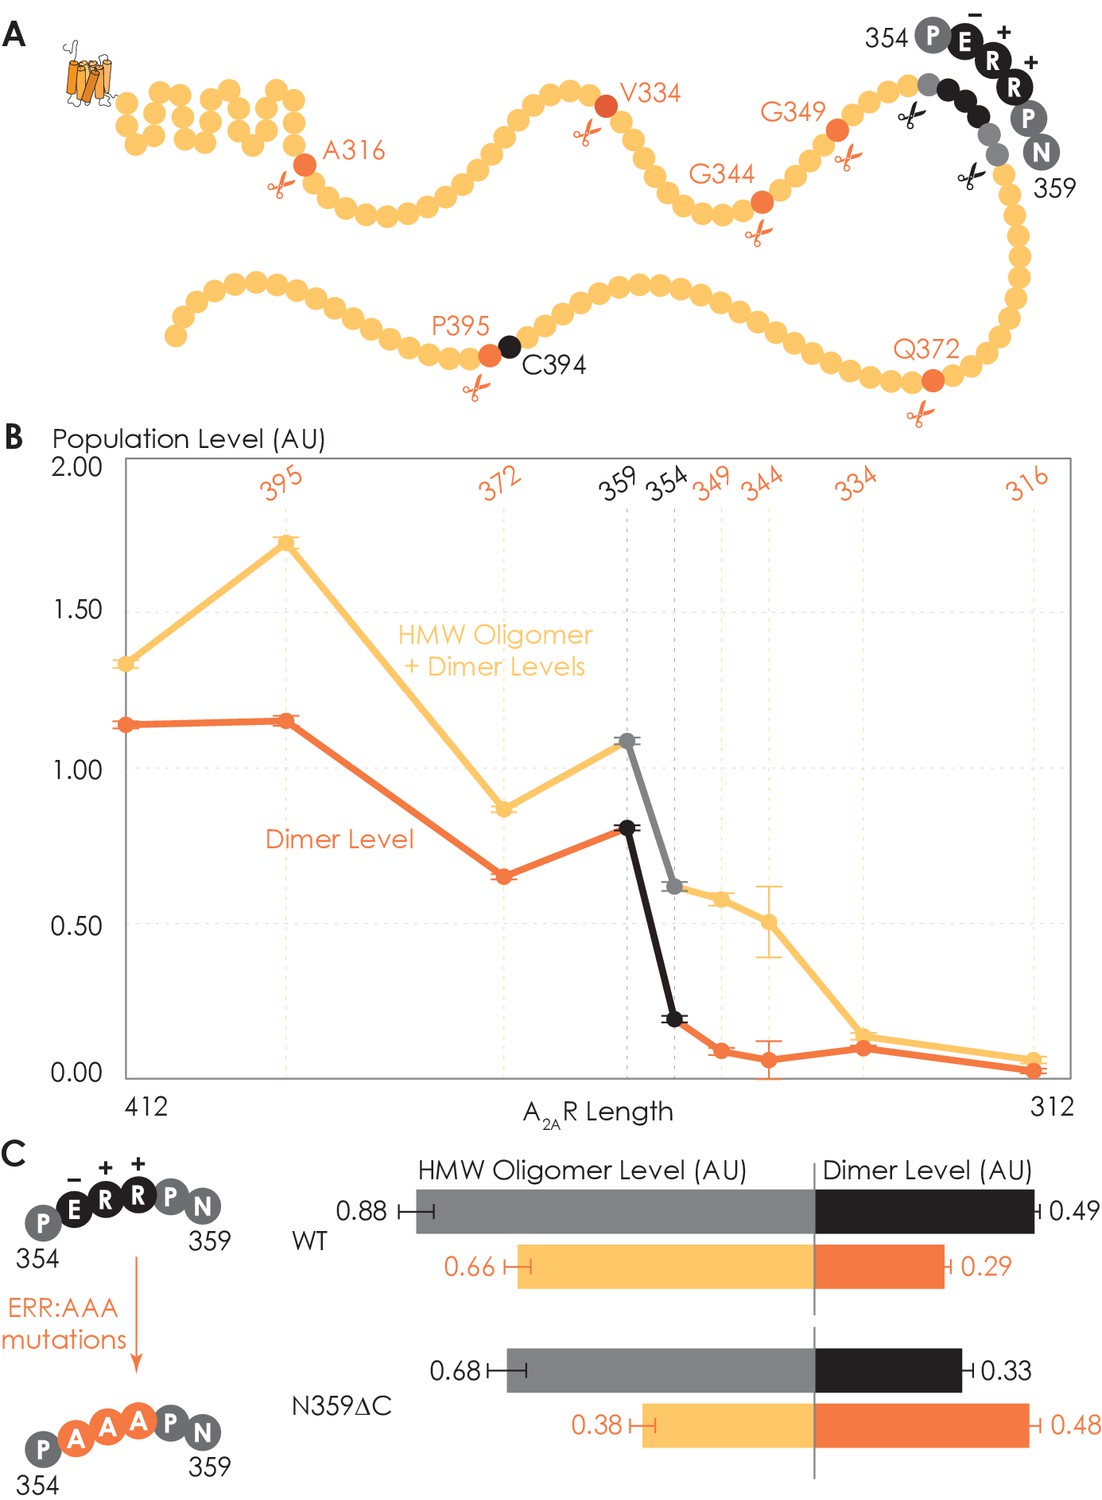
Truncating the C-terminus systematically affects A2AR oligomerization.
(A) Depiction of where the truncation points are located on the C-terminus, with region 354–359 highlighted (in black) showing critical residues. (B) The levels of dimer and high-molecular-weight (HMW) oligomer are expressed relative to the monomeric population as an arbitrary unit and plotted against the residue number of the truncation sites, with reported errors calculated from the variance of the fit, not experimental variation. Region 354–359 is emphasized (in black and gray) due to a drastic change in the dimer and HMW oligomer levels. (C) The dependence of A2AR oligomerization on three consecutive charged residues 355ERR357. The substitution of residues 355ERR357 to 355AAA357 is referred to as the ERR:AAA mutations. The levels of dimer and HMW oligomer are expressed relative to the monomeric population as an arbitrary unit, with reported errors calculated from the variance of the fit, not experimental variation.
-
Figure 3—source data 1
Raw size-exclusion chromatography data of A2AR-WT and C-terminally truncated ΔC variants.
- https://cdn.elifesciences.org/articles/66662/elife-66662-fig3-data1-v2.xlsx
Interestingly, there occurred a dramatic decrease in the dimer level between the N359 and P354 truncation sites, from a value of 0.81 to 0.19, respectively (Figure 3B). A similar result, though less pronounced, was observed on the total oligomer level, with a decrease from 1.09 to 0.62 for the N359 and P354 truncation sites, respectively (Figure 3B). Clearly, the C-terminal segment encompassing residues 354–359 (highlighted in black in Figure 3A) is a key constituent of the A2AR oligomeric interface.
Since segment 354–359 contains three consecutive charged residues (355ERR357; Figure 3A), which could be involved in electrostatic interactions, we hypothesized that this 355ERR357 cluster could strengthen inter-protomer A2AR-A2AR association. To test this hypothesis, residues 355ERR357 were substituted by 355AAA357 on A2AR-FL-WT and A2AR-N359ΔC to generate A2AR-ERR:AAA variants (Figure 3C). We then compared the HMW oligomer and dimer levels of the resulting variants with controls (same A2AR variants but without the ERR:AAA mutations). We found that the ERR:AAA mutations had varied effects on the dimer level: decreasing for A2AR-FL-WT (ctrl: 0.49; ERR:AAA: 0.29) but increasing for A2AR-N359ΔC (ctrl: 0.33; ERR:AAA: 0.48) (Figure 3C). In contrast, the ERR:AAA mutations reduced the HMW oligomer level of both A2AR-FL-WT (ctrl: 0.88; ERR:AAA: 0.66) and A2AR-N359ΔC (ctrl: 0.68; ERR:AAA: 0.38) (Figure 3C). Consistently, the ERR:AAA mutation lowered the total oligomer level of both A2AR-FL-WT (ctrl: 1.37; ERR:AAA: 0.94) and A2AR-N359ΔC (ctrl: 1.01; ERR:AAA: 0.85) (Figure 3C). These results suggest that the charged residues 355ERR357 participate in A2AR oligomerization, with a greater effect in the context of a longer C-terminus and for forming higher-order oligomers. The question then arises as to what types of interactions are formed along the C-terminus that help stabilize A2AR oligomerization.
C-terminus truncation disrupts complex network of non-bonded interactions necessary for A2AR dimerization
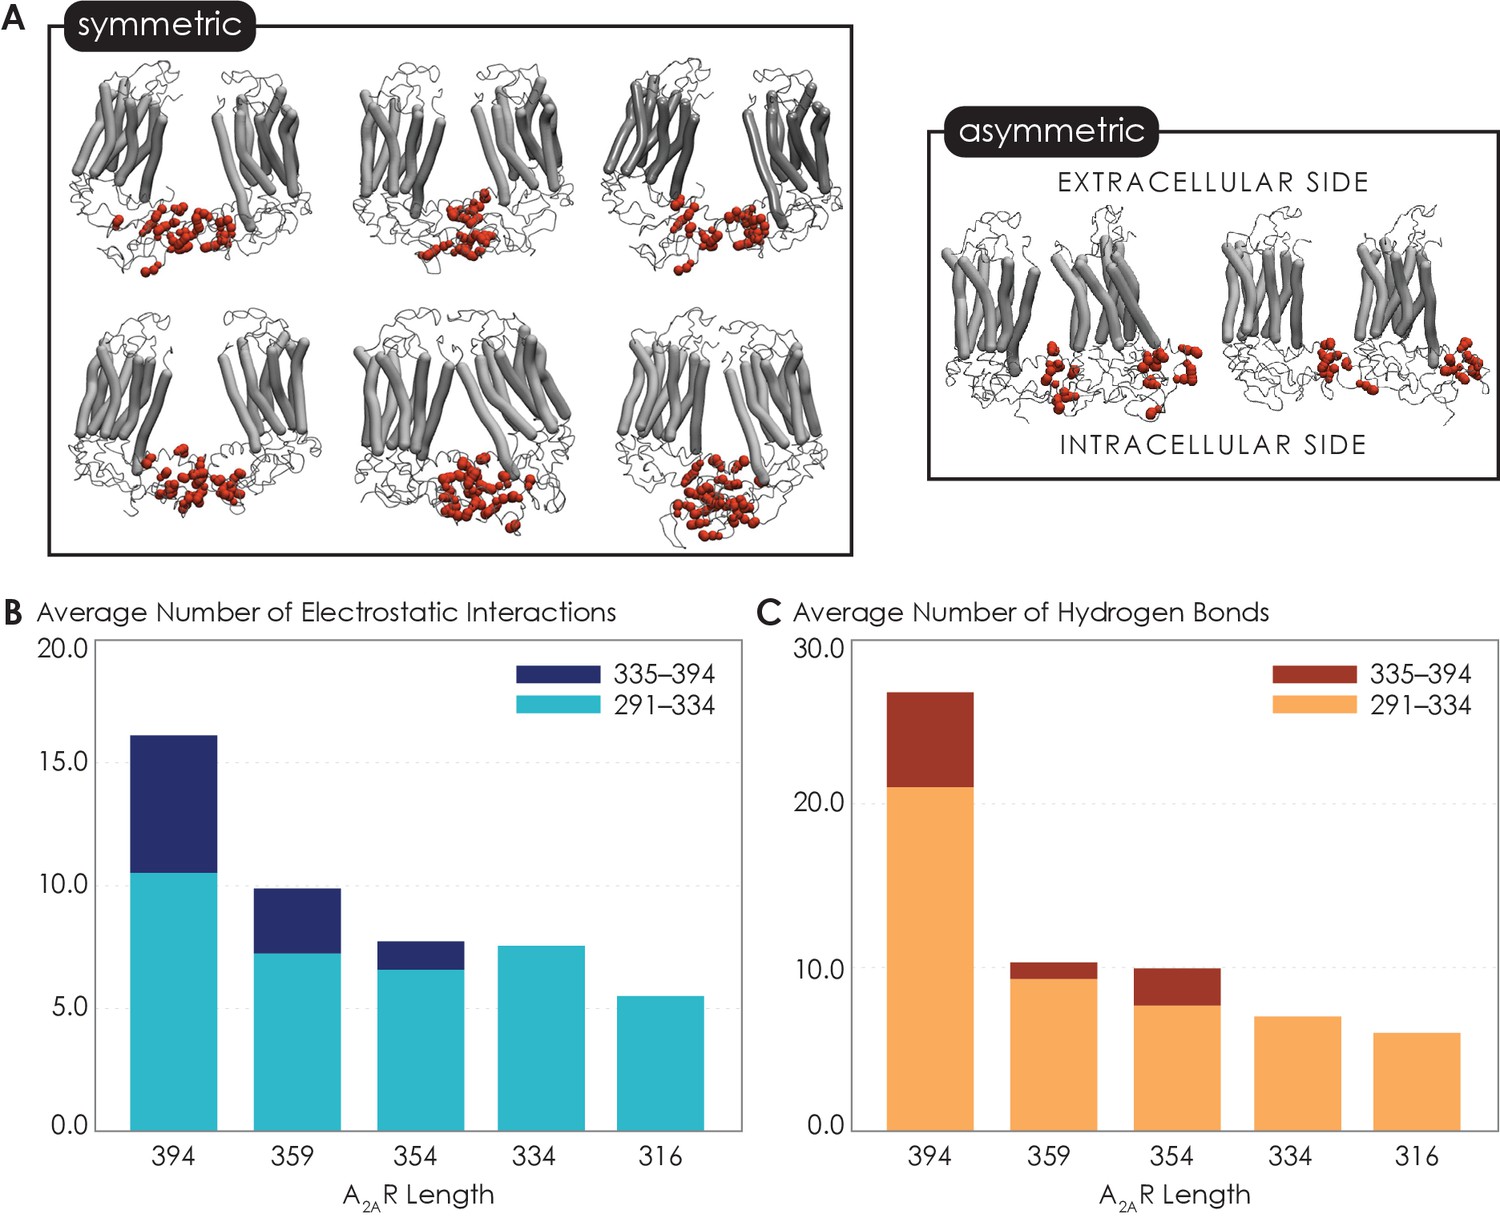
Given that the structure of A2AR dimers or oligomers is unknown, we next used MD simulations to seek molecular-level insights into the role of the C-terminus in driving A2AR dimerization and to gain an understanding of what types of interactions and sites may be involved in this process. First, to explore A2AR dimeric interface, we performed coarse-grained (CG) MD simulations using the Martini force field (see Materials and methods for details). The Martini force field can access the length and time scales relevant to membrane protein oligomerization, albeit at the expense of atomic-level details. We carried out a series of CGMD simulations on five A2AR-ΔC variants designed to mirror the experiments by systematic truncation at five sites along the C-terminus (A316, V334, P354, N359, and C394). Our results revealed that A2AR dimers were formed with multiple interfaces, all involving the C-terminus only (Figure 4A). The transmembrane heptahelical bundles were not a part of the dimeric interfaces as they all showed distances greater than the minimum distance criterion of 7 Å for interacting helices. The vast majority of A2AR dimers were symmetric, with the C-termini of the protomers directly interacting with each other. A smaller fraction of the dimers had asymmetric orientations, with the C-terminus of one protomer interacting with other parts of the other protomer, such as ICL2 (the second intracellular loop) and ICL3 (Figure 4A).
Figure 4
Non-bonded interactions of the extended C-terminus of A2AR play a critical role in stabilization of the dimeric interface.
(A) Dimer configurations from cluster analysis in GROMACS of the 394-residue variant identify two major clusters involving either (1) the C-terminus of one protomer and the C-terminus, ICL2, and ICL3 of the second protomer or (2) the C-terminus of one protomer and ICL2, ICL3, and ECL2 of the second protomer. Spheres: residues forming intermolecular electrostatic contacts. (B) Average number of residues that form electrostatic contacts as a function of sequence length of A2AR. (C) Average number of residues that form hydrogen bonds as a function of sequence length of A2AR. The criteria for designating inter-A2AR contacts as electrostatic interactions or hydrogen bonds are described in detail in Materials and methods.
-
Figure 4—source data 1
Detailed data regarding the multiple interfaces of A2AR and the network of non-bonded interactions that stabilize these interfaces.
(A) Dimer configurations from cluster analysis in GROMACS of the 394-residue variant. (B) Average number of residues that form electrostatic contacts as a function of sequence length of A2AR. (C) Average number of residues that form hydrogen bonds as a function of sequence length of A2AR.
- https://cdn.elifesciences.org/articles/66662/elife-66662-fig4-data1-v2.xlsx
Our observation of multiple A2AR oligomeric interfaces, which is consistent with previous studies (Fanelli and Felline, 2011; Song et al., 2020), suggests that tunable, non-covalent intermolecular interactions may be involved in receptor dimerization. We first dissected two key non-covalent interaction types: electrostatic and hydrogen bonding interactions. Electrostatic interactions were calculated from CGMD simulations, while hydrogen bonds were quantified from atomistic MD simulation as the CG model merges all hydrogens into a CG bead and hence cannot report on hydrogen bonds. This analysis was performed on the symmetric dimers as they constituted the more dominant population. With the least truncated A2AR variant containing the longest C-terminus, A2AR-C394ΔC, we observed an average of 15.9 electrostatic contacts (Figure 4B) and 26.7 hydrogen bonds (Figure 4C) between the C-termini of the protomers. This result shows that both electrostatic interactions and hydrogen bonds can play important roles in A2AR dimer formation.
Upon further C-terminus truncation, the average number of both electrostatic contacts and hydrogen bonds involving C-terminal residues progressively declined, respectively reaching 5.4 and 6.0 for A2AR-A316ΔC (in which the disordered region of the C-terminus is removed) (Figure 4B, C). This result is consistent with the experimental result, which demonstrated a progressive decrease of A2AR oligomerization with the shortening of the C-terminus (Figure 3B). Interestingly, upon systematic truncation of the C-terminal segment 335–394, we observed in segment 291–334 a steady decrease in the average number of electrostatic contacts, from 10.4 to 7.4 (Figure 4B). This trend was even more pronounced with hydrogen bonding contacts involving segment 291–334 decreasing drastically from 21.0 to 7.0 as segment 335–394 was gradually removed (Figure 4C). This observation that truncation of a C-terminal segment reduces inter-A2AR contacts elsewhere along the C-terminus indicates that an allosteric mechanism of dimerization exists, in which an extended C-terminus of A2AR stabilizes inter-A2AR interactions near the heptahelical bundles of the dimeric complex. These results demonstrate that A2AR dimers can be formed via multiple interfaces and stabilized by an allosteric network of electrostatic interactions and hydrogen bonds along much of its C-terminus.
Ionic strength modulates oligomerization of C-terminally truncated A2AR variants
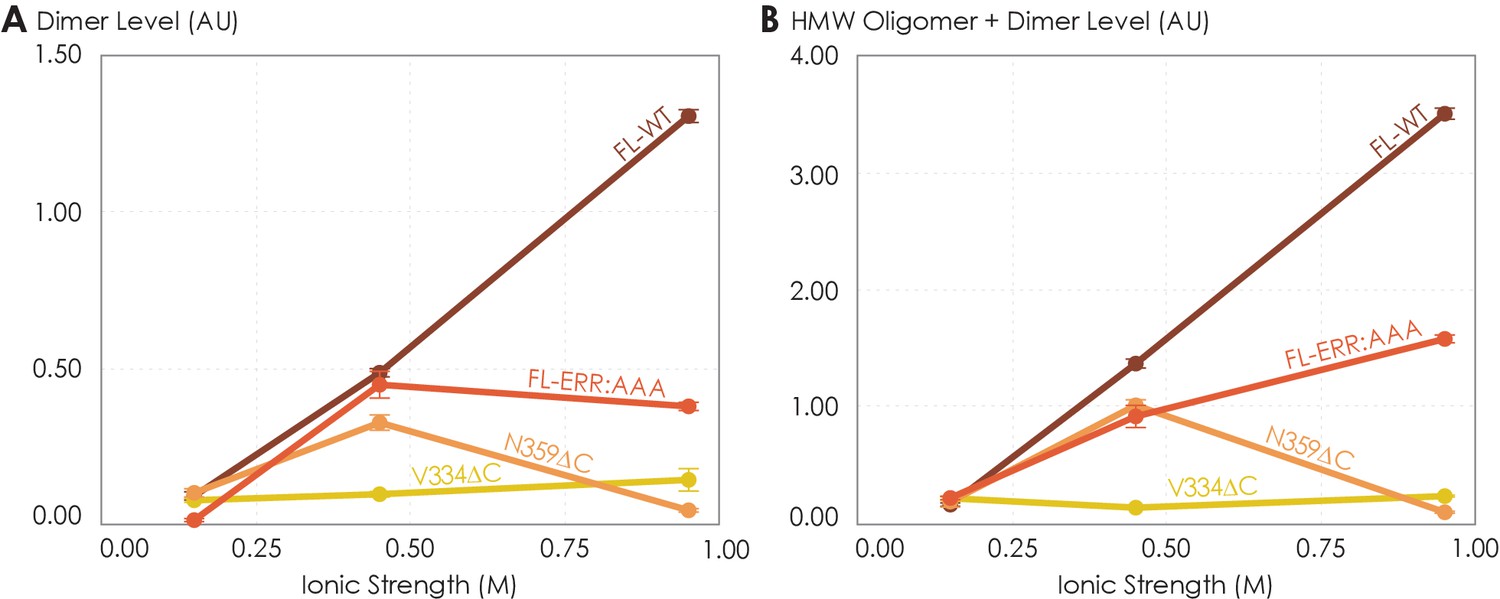
So far, we have demonstrated that the C-terminus clearly plays a role in forming A2AR oligomeric interfaces. However, it remains unclear what the driving factors of A2AR oligomerization are and whether the oligomeric populations are thermodynamic products. The variable nature of A2AR oligomeric interfaces suggests that the main driving forces must be non-covalent interactions, such as electrostatic interactions and hydrogen bonds. Modulating the solvent ionic strength is an effective method to identify the types of non-covalent interaction(s) at play. Specifically, with increasing ionic strength, electrostatic interactions are weakened (based on Debye–Hückel theory, most electrostatic bonds at a distance greater than 5 Å are screened out at an ionic strength of 0.34 M at 4°C) and depletion interactions are enhanced with salting-out salts, while hydrogen bonds remain relatively impervious. For this reason, we subjected various A2AR variants (FL-WT, FL-ERR:AAA, N359ΔC, and V334ΔC) to ionic strength ranging from 0.15 to 0.95 M by adding NaCl (buffer composition shown in Materials and methods). The HMW oligomer and dimer levels of the four A2AR variants were determined and plotted as a function of ionic strengths.
The low ionic strength of 0.15 M should not affect hydrogen bonds or electrostatic interactions if present. We found that the dimer and total oligomer levels of all four variants were near zero (Figure 5). This is a striking experimental observation: despite being shown to play a role in stabilizing A2AR dimers according to our MD simulations (Figure 4B, C), we can conclude that electrostatic and hydrogen-bonding interactions are not the dominant driving force for A2AR association. The question remains whether depletion interactions could facilitate A2AR oligomerization.
Figure 5 with 1 supplement see all
The effects of ionic strength on the oligomerization of various A2AR variants reveal the involvement of depletion interactions.
The levels of (A) dimer and (B) high-molecular-weight oligomer + dimer are expressed relative to the monomeric population as an arbitrary unit and plotted against ionic strength, with reported errors calculated from the variance of the fit, not experimental variation. NaCl concentration is varied to achieve ionic strengths of 0.15, 0.45, and 0.95 M.
-
Figure 5—source data 1
Raw size-exclusion chromatography data of various A2AR variants under different ionic strengths of 0.15, 0.45, and 0.95 M.
- https://cdn.elifesciences.org/articles/66662/elife-66662-fig5-data1-v2.xlsx
At higher ionic strengths of 0.45 M and 0.95 M, the dimer and total oligomer levels of A2AR-V334ΔC still remained near zero (Figure 5). In contrast, we observed a progressive and significant increase in the dimer and total oligomer levels of A2AR-FL-WT with increasing ionic strength (Figure 5). This result indicates that A2AR oligomerization is driven by depletion interactions enhanced with increasing ionic strength and that these interactions must involve the C-terminal segment after residue V334.
Upon closer examination, we recognize that at the very high ionic strength of 0.95 M the increase in the dimer and total oligomer levels was robust for A2AR-FL-WT, but less pronounced for A2AR-FL-ERR:AAA (Figure 5). Furthermore, this high ionic strength even had an opposite effect on A2AR-N359ΔC, with both its dimer and total oligomer levels abolished (Figure 5). These results indicate that the charged cluster 355ERR357 and the C-terminal segment after residue N359 promote the depletion interactions to drive A2AR oligomerization. Taken together, we can conclude that A2AR oligomerization is more robust when the C-terminus is fully present and the ionic strength higher, suggesting that depletion interactions via the C-terminus are strong driving factors of A2AR oligomerization.
The discussion of depletion interactions as driving factors assumes that A2AR dimer/oligomer populations are thermodynamic products at equilibrium with the A2AR monomer population. However, some of the A2AR dimer/oligomer populations may be kinetically stabilized. To address this question, we tested the stability and reversibility of A2AR oligomers by performing a second round of SEC on the monomer and dimer/oligomer populations of the A2AR-WT and Q372ΔC variants. We found that the SEC-separated monomers repopulate into dimer/oligomer, with the total oligomer level after redistribution comparable with that of the initial samples for both A2AR-WT (initial: 2.87; redistributed: 1.60) and Q372ΔC (initial: 1.49; redistributed: 1.40) (Figure 5—figure supplement 1A). This observation indicates that A2AR oligomer is a thermodynamic product with a lower free energy compared with that of the monomer (Figure 5—figure supplement 1B). This agrees with the results we have shown in Supplementary file 1 that the oligomer levels of A2AR-WT are consistent among replicates (1.34–2.05) and that A2AR oligomerization can be modulated with ionic strengths via depletion interactions (Figure 5).
In contrast, the SEC-separated dimer/oligomer populations do not repopulate to form monomers (Figure 5—figure supplement 1A). This observation is consistent with a published study of ours on A2AR dimers (Schonenbach et al., 2016), indicating that once the oligomers are formed, some are kinetically trapped and thus cannot redistribute into monomers. We believe that disulfide linkages are likely candidates to kinetically stabilize A2AR oligomers, as demonstrated by their redistribution into monomers only in the presence of a reducing agent (Figure 2B).
Taken together, we suggest that A2AR oligomerization is a thermodynamic process (Figure 5—figure supplement 1B), with the free energy of the dimer/oligomers lowered by depletion forces that hence increase their population relative to that of the monomers (there always exists a distribution between the two). Once formed, the redistributed dimer/oligomer populations may be kinetically stabilized by disulfide linkages. The question then arises whether inter-A2AR interactions are primarily a result of the C-termini directly interacting with one another. This question motivated us to carry out a study focused on investigating the behavior of A2AR C-terminus sans the transmembrane domains.
The isolated A2AR C-terminus is prone to aggregation
To test whether A2AR oligomerization is driven by direct depletion interactions among the C-termini of the protomers, we assayed the solubility and assembly properties of the stand-alone A2AR C-terminus—an intrinsically disordered peptide—sans the upstream transmembrane regions. Since depletion interactions can be manifested via the hydrophobic effect (van der Vegt et al., 2017), we examined whether this effect can also drive the assembly of the A2AR C-terminal peptides.
It is an active debate whether the hydrophobic effect can be promoted or suppressed by ions with salting-out or salting-in tendency, respectively (Thomas and Elcock, 2007; Graziano, 2010; Zangi et al., 2007; Grover and Ryall, 2005). We increased the solvent ionic strength using either sodium (salting-out) or guanidinium (salting-in) ions and assessed the aggregation propensity of the C-terminal peptides using UV-Vis absorption at 450 nm, which indicates the turbidity of the solution. We first observed the behavior of the C-terminus with increasing salting-out NaCl concentrations. At NaCl concentrations below 1 M, the peptide was dominantly soluble, despite showing slight aggregation at NaCl concentrations between 250 and 500 mM (Figure 6A). At NaCl concentrations above 1 M, A2AR C-terminal peptides strongly associated into insoluble aggregates (Figure 6A). Consistent with the observations made with the intact receptor (Figure 5), the A2AR C-terminus showed the tendency to progressively associate and eventually precipitate with increasing ionic strengths, suggesting that depletion interactions drive the association and precipitation of the peptides. We next observed the behavior of the C-terminus with increasing concentrations of guanidine hydrochloride (GdnHCl), which contains salting-in cations that do not induce precipitation and instead facilitate the solubilization of proteins (Heyda et al., 2017; Baldwin, 1996). Our results demonstrated that the A2AR C-terminus incubated in 4 M GdnHCl showed no aggregation propensity (Figure 6A), validating our expectation that salting-in salts do not enhance depletion interactions. These observations demonstrate that the C-terminal peptide in and of itself, outside the context of the lipid membrane and TM domain, can directly interact with other C-terminal peptides to form self-aggregates in the presence of ions, and presumably solutes, that have salting-out effects.
Figure 6 with 1 supplement see all
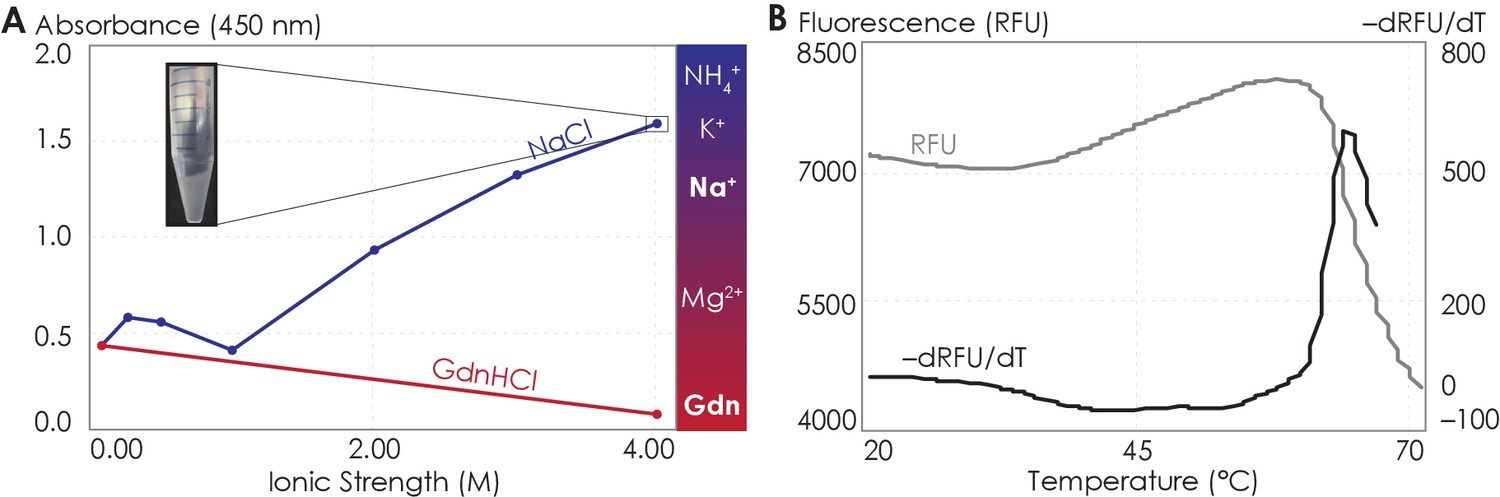
The A2AR C-terminus is prone to aggregation.
(A) Absorbance at 450 nm of the A2AR C-terminus in solution, with NaCl and GdnHCl concentrations varied to achieve ionic strengths 0–4 M. Inset: the solution at ionic strength 4 M achieved with NaCl. The Hofmeister series is provided to show the ability of cations to salt-out (blue) or salt-in (red) proteins. (B) SYPRO orange fluorescence of solutions containing the A2AR C-terminus as the temperature was varied from 20°C to 70°C (gray). The change in fluorescence, measured in relative fluorescence unit (RFU), was calculated by taking the first derivative of the fluorescence curve (black).
-
Figure 6—source data 1
Detailed data showing the propensity of A2AR C-terminus to aggregate.
(A) Absorbance at 450 nm of the A2AR C-terminus in solution, with NaCl and GdnHCl concentrations varied to achieve ionic strengths 0–4 M. (B) SYPRO orange fluorescence of solutions containing the A2AR C-terminus as the temperature was varied from 20°C to 70°C (gray). The change in fluorescence, measured in relative fluorescence unit (RFU), was calculated by taking the first derivative of the fluorescence values.
- https://cdn.elifesciences.org/articles/66662/elife-66662-fig6-data1-v2.xlsx
Attractive hydrophobic interactions among the hydrophobic residues are further enhanced when the water that solvate the protein surface have more favorable interactions with other water molecules, ions, or solutes than with the protein surface, here the truncated C-terminus (Larsen et al., 1998; Tsai and Nussinov, 1997; Tsai et al., 1997). We explored the possible contribution of hydrophobic interactions to the aggregation of the C-terminal peptides using both experimental and computational approaches. Using differential scanning fluorimetry (DSF), we gradually increased the temperature to melt the C-terminal peptides, exposing any previously buried hydrophobic residues (Figure 6—figure supplement 1A, B), which then bound to the SYPRO orange fluorophore, resulting in an increase in fluorescence signal. Our results showed that as the temperature increased, a steady rise in fluorescence was observed (Figure 6B), indicating that multiple hydrophobic residues were gradually exposed to the SYPRO dye. However, at approximately 65°C, the melt peak signal was abruptly quenched (Figure 6B), indicating that the hydrophobic residues were no longer exposed to the dye. This observation suggests that, at 65°C, enough hydrophobic residues in the C-terminal peptides become exposed such that they collapse on one another (thus expelling the bound dye molecules), resulting in aggregation. This experimental result is further supported by our CGMD computational analysis of C-terminal non-polar contacts found in A2AR symmetrical dimers (Figure 6—figure supplement 1C). Specifically, we observed an average of 60 non-polar contacts for A2AR-C394ΔC. This number progressively declined upon further C-terminus truncation, reaching 15 for A2AR-A316ΔC. Clearly, the hydrophobic effect can cause A2AR C-terminal peptides to directly associate. These results demonstrate that A2AR oligomer formation can be driven by depletion interactions among the C-termini of the protomers by non-polar contacts.
Discussion
The key finding of this study is that the C-terminus of A2AR, removed in all previously published structural studies, is directly responsible for receptor oligomerization. Using a combination of experimental and computational approaches, we demonstrate that the C-terminus stabilizes A2AR oligomers via a combination of disulfide linkages, hydrogen bonds, electrostatic interactions, and hydrophobic interactions. This diverse combination of interactions is greatly enhanced by depletion interactions, forming a network of malleable bonds that drives A2AR oligomerization and gives rise to multiple oligomeric interfaces.
Intermolecular disulfide linkages play a role in A2AR oligomerization, potentially by kinetically trapping the receptor oligomers. Among the seven cysteines that do not form intramolecular disulfide bonds (De Filippo et al., 2016; Naranjo et al., 2015; O'Malley et al., 2010), residue C394 is largely involved in stabilizing A2AR oligomers (Figure 2A). Indeed, this cysteine is highly conserved and a C-terminal cysteine is almost always present in A2AR homologs (Pándy-Szekeres et al., 2018), suggesting that it may serve an important role in vivo. There may also exist inter-A2AR disulfide linkages that do not involve residue C394 at all as the SEC-separated dimer/oligomer populations of A2AR-Q372ΔC, which lack residue C394, were still resistant to TCEP reduction (Figure 2B) and appear to be kinetically trapped (Figure 5—figure supplement 1). Such disulfide linkages may involve other cysteines in the hydrophobic core of A2AR, namely C281.54, C823.30, C1284.49, C1855.46, C2456.47, or C2546.56. Many examples exist where disulfide linkages help drive GPCR oligomerization, including the CaR-mGluR1 heterodimer (Gama et al., 2001), homodimers of mGluR5 (Romano et al., 1996), M3R (Zeng and Wess, 1999), V2R (Zhu and Wess, 1998), 5-HT4R (Berthouze et al., 2007) and 5-HT1DR (Lee et al., 2000), and even higher-order oligomers of D2R (Guo et al., 2008). Although unconventional cytoplasmic disulfide bonds have been reported (Saaranen and Ruddock, 2013; Locker and Griffiths, 1999), no study has shown how such linkages would be formed in vivo as the cytoplasm lacks the conditions and machinery required for disulfide bond formation (Gaut and Hendershot, 1993; Hwang et al., 1992; Helenius et al., 1992; Creighton et al., 1980).
The electrostatic interactions that stabilize A2AR oligomer formation come from multiple sites along the C-terminus. From a representative snapshot of a A2AR-C394ΔC dimer from our MD simulations (Figure 7A), we could visualize not only the intermolecular interactions calculated from the CGMD simulations (Figure 4B), but also intramolecular salt bridges. In particular, the 355ERR357 cluster of charged residues lies distal from the dimeric interface but still forms several salt bridges (Figure 7A, inset). This observation is supported by our experimental results showing that substituting this charged cluster with alanines reduces the total A2AR oligomer levels (Figure 3C). However, it is unclear how such salt bridges involving this 355ERR357 cluster are enhanced by depletion interactions (Figure 5) as electrostatic interactions are usually screened out at high ionic strengths. In our MD simulations, we also observed networks of salt bridges along the dimeric interface, for example, between K315 of one monomer and D382 and E384 of the other monomer (Figure 7A, inset). The innate flexibility of the C-terminus could facilitate the formation of such salt bridges, which then help stabilize A2AR dimers.
Figure 7 with 1 supplement see all
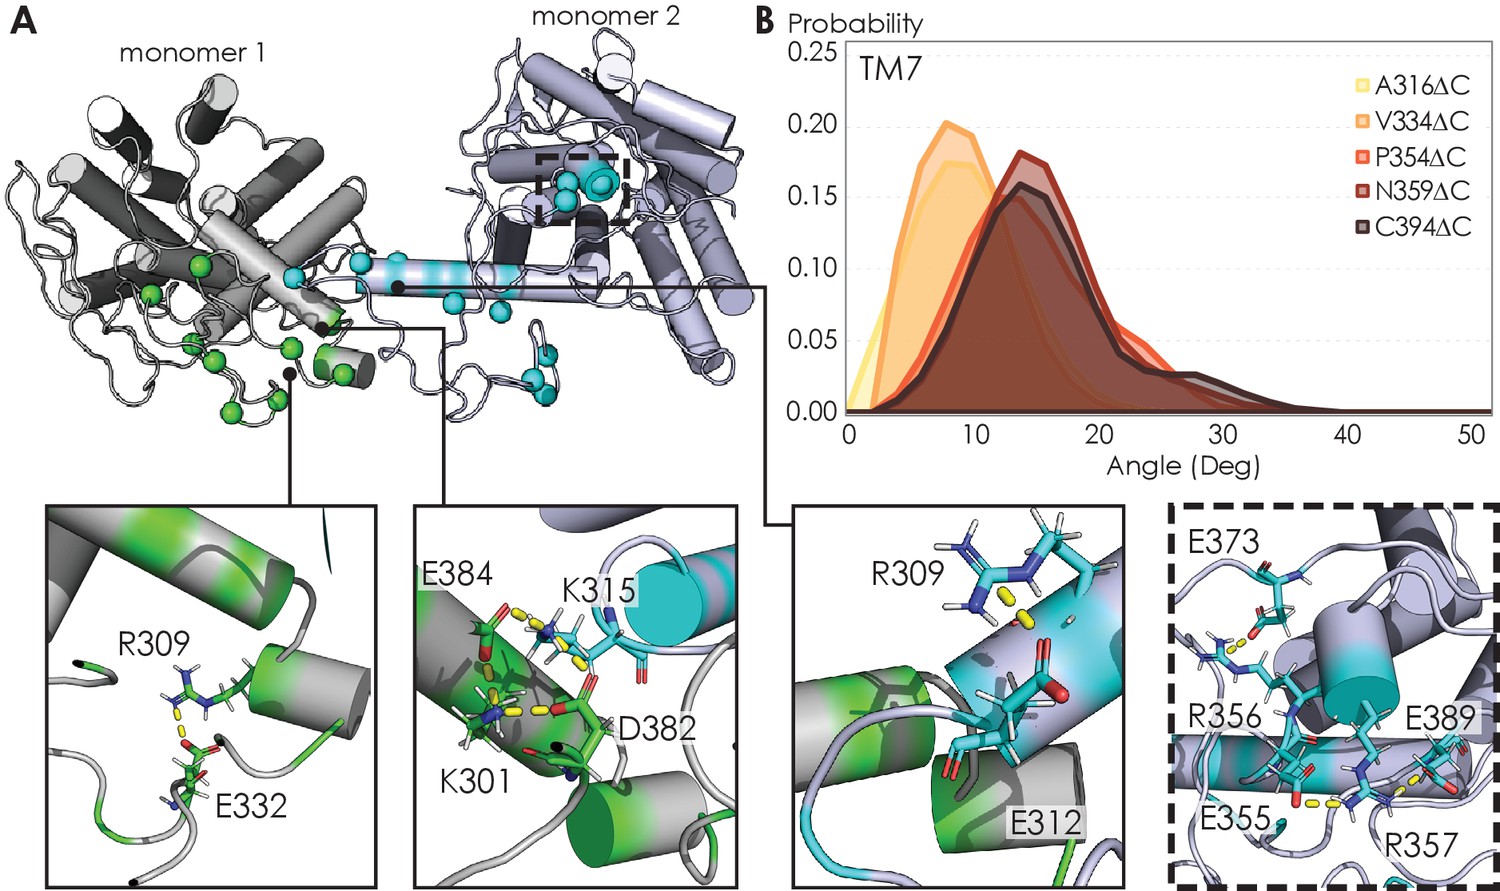
Visualizing A2AR dimeric interface and observing conformational changes of the TM7 using MD simulations.
(A) Representative snapshot of A2AR-C394ΔC dimers shows salt bridge formation between a sample trajectory. The insets are closeups of the salt bridges, which can be both intra- and intermolecular. The last inset shows a network of salt bridges with the charged cluster 355ERR357 involved. (B) Helical tilt angles for TM7 helix in A2AR as a function of protein length. Systematic truncations of the C-terminus lead to rearrangement of the heptahelical bundle. The participation of the C-terminus in A2AR dimerization increases the tilting of the TM7 domain, which is in closest proximity to the C-terminus.
-
Figure 7—source data 1
MD simulations data used to visualize A2AR dimeric interface and observe the conformational changes of the TM7.
(A) List of all C-terminal residue pairs of A2AR-C394ΔC dimers engaging in electrostatic interactions. (B) Helical tilt angles for TM7 helix in A2AR as a function of protein length.
- https://cdn.elifesciences.org/articles/66662/elife-66662-fig7-data1-v2.xlsx
Our finding that A2AR forms homo-oligomers via multiple interfaces (Figure 4A) agrees with the increasing number of studies reporting multiple and interconverting oligomeric interfaces in A2AR and other GPCRs (Song et al., 2020; Ghosh et al., 2014; Periole et al., 2012; Fanelli and Felline, 2011; Liu et al., 2012; Huang et al., 2013; Manglik et al., 2012; Thorsen et al., 2014; Fotiadis et al., 2006; Fotiadis et al., 2003; Liang et al., 2003; Xue et al., 2015; Dijkman et al., 2018). When translated to in vivo situations, GPCR oligomers can also transiently associate and dissociate (Kasai et al., 2018; Tabor et al., 2016; Möller et al., 2020; Vilardaga et al., 2008). Such conformational changes require that the oligomeric interfaces be formed by interactions that can easily be modulated. This is consistent with our study, which demonstrates that depletion interactions via the intrinsically disordered, malleable C-terminus drive A2AR oligomerization. Because depletion interactions can be readily tuned by environmental factors, such as ionic strength, molecular crowding, and temperature, the formation of GPCR oligomeric complexes could be dynamically modulated in response to environmental cues to regulate receptor function.
Not only did we find multiple A2AR oligomeric interfaces, we also found that these interfaces can be either symmetric or asymmetric. This finding is supported by a growing body of evidence that there exists both symmetric and asymmetric oligomeric interfaces for A2AR (Song et al., 2020) and many other GPCRs. Studies using various biochemical and biophysical techniques have shown that heterotetrameric GPCR complexes can be formed by dimers of dimers, including μOR-δOR (Golebiewska et al., 2011), CXC4R-CC2R (Armando et al., 2014), CB1R/D2R (Bagher et al., 2017), as well as those involving A2AR, such as A1R-A2AR (Navarro et al., 2018a; Navarro et al., 2016) and A2AR-D2R (Navarro et al., 2018b). The quaternary structures identified in these studies required specific orientations of each protomer, with the most viable model involving a stagger of homodimers with symmetric interfaces (DelaCuesta-Barrutia et al., 2020). On the other hand, since symmetric interfaces limit the degree of receptor association to dimers, the HMW oligomer of A2AR observed in this (Song et al., 2020) and other studies (Schonenbach et al., 2016; Vidi et al., 2008) can only be formed via asymmetric interfaces. It is indeed tempting to suggest that the formation of the HMW oligomer of A2AR may even arise from combinations of different interfaces. In any case, the wide variation of GPCR oligomerization requires the existence of both symmetric and asymmetric oligomeric interfaces.
The ultimate question to answer is how oligomerization alters A2AR function. In the case of A2AR, displacement of the transmembrane domains has been demonstrated to be the hallmark of receptor activation (Eddy et al., 2018; Sušac et al., 2018; Prosser et al., 2017; Ye et al., 2016), but no studies have linked receptor oligomerization with the arrangement of the TM bundles in A2AR. Our MD simulations revealed that C-terminus truncation resulted in structural changes in the heptahelical bundles of A2AR dimers. Specifically, as more of the C-terminus was preserved, we observed a progressive increase in the helical tilt of TM7 (Figure 7B). This change in helical tilt occurred for the entire heptahelical bundle, with an increase in tilt for TM1, TM2, TM3, TM5, and TM7, and a decrease in tilt for TM4 and TM6 (Figure 7—figure supplement 1). The longer C-terminus in the full-length A2AR permits greater rearrangements in the transmembrane regions, leading to the observed change in helical tilt. Furthermore, in the cellular context, it has been demonstrated that truncation of the C-terminus significantly reduced receptor association with Gαs and cAMP production in cellular assays (Koretz et al., 2021). These results hint at potential conformational changes of A2AR upon oligomerization, necessitating future investigation on functional consequences.
Like all biophysical studies of membrane proteins in non-native environments, a drawback in our study is the question whether the above results, conducted in detergent micelles, can be translated to bilayer or cellular context. It has been demonstrated that the propensity of membrane proteins to associate and oligomerize is greater in lipid bilayers compared to that in detergent micelles (Popot and Engelman, 1990). Furthermore, in the cellular context, A2AR has been shown to assemble into homo-oligomers in transfected HEK293 cells (Canals et al., 2003) and in Cath.A differentiated neuronal cells (Vidi et al., 2008), while C-terminally truncated A2AR shows no protein aggregation or clustering on the cell surface, in contrast with its WT form (Burgueño et al., 2003). Therefore, we speculate that A2AR oligomerization will be present in the lipid bilayer and cellular environment. Regardless, given that most biophysical structure-function studies of GPCRs are conducted in detergent micelles and other artificial membrane mimetics, it is critical to understand the role of the C-terminus in the oligomerization of A2AR reconstituted in detergent micelles.
C-terminal truncations prior to crystallization and structural studies may be the main reason for the scarcity of GPCR structures featuring oligomers. In that context, this study offers valuable insights and approaches into how the oligomerization of A2AR and potentially of other GPCRs can be tuned by modifying the intrinsically disordered C-terminus and varying salt types and concentrations. The presence of A2AR oligomeric populations with partial C-terminal truncations means that one can now study its oligomerization with less perturbation from the C-terminus. We also present evidence that the multiple C-terminal interactions that drive A2AR oligomerization can be easily modulated by ionic strength and specific salts (Figures 5 and 6). Given that ~75% and ~15% of all class A GPCRs possess a C-terminus of >50 and >100 amino acid residues (Mirzadegan et al., 2003), respectively, it will be worthwhile to explore the prospect of tuning GPCR oligomerization not only by shortening the C-terminus but also with simpler approaches such as modulating ionic strength and the surrounding salt environment.
Conclusion
This study emphasizes for the first time the definite impact of the C-terminus on A2AR oligomerization, which can be extended to include the oligomers formed by other GPCRs with a protracted C-terminus. We have shown that the oligomerization of A2AR is strongly driven by depletion interactions along the C-terminus, further modulating and enhancing the multiple interfaces formed via a combination of hydrogen, electrostatic, hydrophobic, and covalent disulfide interactions. The task remains to link A2AR oligomerization to functional roles of the receptor. From a structural biology standpoint, visualizing the multiple oligomeric interfaces of A2AR in the presence of the full-length C-terminus is key to investigating whether these interfaces give rise to different oligomer functions.
Materials and methods
Key resources table
| Reagent type (species) or resource | Designation | Source or reference | Identifiers | Additional information |
|---|---|---|---|---|
| Recombinant DNA reagent | pITy (plasmid) | Parekh et al., 1996 | ||
| Strain, strain background (Saccharomyces cerevisiae) | BJ5464 | Robinson Lab – Carnegie Mellon University | ||
| Strain, strain background (Escherichia coli) | BL21 (DE3) | Sigma, St. Louis, MO, USA | #CMC0014 | |
| Chemical compound, drug | DDM | Anatrace, Maumee, OH, USA | #D310 | |
| Chemical compound, drug | CHAPS | Anatrace, Maumee, OH, USA | #C216 | |
| Chemical compound, drug | CHS | Anatrace, Maumee, OH, USA | #CH210 | |
| Chemical compound, drug | Xanthine amine congener | Sigma, St. Louis, MO, USA | #X103 | |
| Chemical compound, drug | Theophylline | Sigma, St. Louis, MO, USA | #T1633 | |
| Commercial assay, kit | Affigel 10 resin | BioRad, Hercules, CA, USA | #1536099 | |
| Commercial assay, kit | Tricorn Superdex 200 10/300 GL column | GE Healthcare, Pittsburgh, PA, USA | #17-5175-01 | |
| Antibody | Anti-A2AR, clone 7F6-G5-A2 (Mouse monoclonal) | Millipore, Burlington, MA, USA | #05-717 | (1:500) dilution |
| Antibody | Anti-Mouse IgG H&L DyLight 550 (Goat monoclonal) | Abcam, Cambridge, MA, USA | #ab96880 | (1:600) dilution |
| Software, algorithm | MODELLER 9.23 | Eswar et al., 2006 | ||
| Software, algorithm | martinize.py script | de Jong et al., 2013 | ||
| Software, algorithm | ELNeDyn elastic network | Periole et al., 2009 | ||
| Software, algorithm | MARTINI coarse-grained force field v2.2 | Monticelli et al., 2008 | ||
| Software, algorithm | GROMACS 2016 | Abraham et al., 2015 | ||
| Software, algorithm | backward.py script | Wassenaar et al., 2014 | ||
| Software, algorithm | LINCS | Hess et al., 1997 | ||
| Software, algorithm | CHARMM36 and TIP3P force fields | Best et al., 2012; Jorgensen et al., 1983 | ||
| Software, algorithm | LOOS | Romo and Grossfield, 2009 | ||
| Software, algorithm | VMD | Humphrey et al., 1996 |
Cloning, gene expression, and protein purification
Request a detailed protocolThe multi-integrating pITy plasmid (Parekh et al., 1996), previously used for overexpression of A2AR in Saccharomyces cerevisiae (O'Malley et al., 2009), was employed in this study. pITy contains a Gal1–10 promoter for galactose-induced expression, a synthetic pre-pro leader sequence that directs protein trafficking (Clements et al., 1991; Parekh et al., 1995), and the yeast alpha terminator. The genes encoding A2AR variants with 10-His C-terminal tag were cloned into pITy downstream of the pre-pro leader sequence using either splice overlapping extension (Bryksin and Matsumura, 2010) or USER cloning using X7 polymerase (Nørholm, 2010; Nour-Eldin et al., 2006). The plasmids were then transformed into S. cerevisiae strain BJ5464 (MATα ura3-52 trp1 leu2∆1 his3∆200 pep4::HIS3 prb1∆1.6R can1 GAL) (provided by the lab of Anne Robinson at Carnegie Mellon University) using the lithium-acetate/PEG method (Gietz, 2014). Transformants were selected on YPD G-418 plates (1% yeast extract, 2% peptone, 2% dextrose, 2.0 mg/mL G-418).
Receptor was expressed and purified following the previously described protocol (Niebauer and Robinson, 2006). In brief, from freshly streaked YPD plates (1% yeast extract, 2% peptone, 2% dextrose), single colonies were grown in 5 mL YPD cultures overnight at 30°C. From these 5 mL cultures, 50 mL cultures were grown with a starting OD of 0.5 overnight at 30°C. To induce expression, yeast cells from these 50 mL cultures were centrifuged at 3000 × g to remove YPD before resuspended in YPG medium (1% yeast, 2% peptone, 2% D-galactose) at a starting OD of 0.5. The receptor was expressed for 24 hr overnight at 30°C with 250 rpm shaking. Cells were pelleted by centrifugation at 3000 × g, washed in sterile PBS buffer, and pelleted again before storage at –80°C until purification.
Mechanical bead lysis of cells was done, per 250 mL of cell culture, by performing 12 pulses of 60 s intense vortexing (with at least 60 s of rest in between pulses) in 10 mL 0.5 mm zirconia silica beads (BioSpec, Bartlesville, OK, USA; #11079105z), 25 mL of lysis buffer (50 mM sodium phosphate, 300 mM sodium chloride, 10% [v/v] glycerol, pH = 8.0, 2% [w/v] n-dodecyl-β-D-maltopyranoside [DDM; Anatrace, Maumee, OH, USA; #D310], 1% [w/v] 3-[(3-cholamidopropyl)dimethylammonio]−1-propanesulfonate [CHAPS; Anatrace; #C216], and 0.2% [w/v] cholesteryl hemisuccinate [CHS; Anatrace; #CH210] and an appropriate amount of 100× Pierce Halt EDTA-free protease inhibitor [Pierce, Rockford, IL, USA; #78439]). Beads were separated using a Kontex column. Unlysed cells were removed by centrifugation at 3220 × g for 10 min. Receptor was let solubilized on rotary mixer for 3 hr before cell debris was removed by centrifugation at 10,000 × g for 30 min. Solubilized protein was incubated with Ni-NTA resin (Pierce; #88221) overnight. Protein-resin mixture was then washed extensively in purification buffer (50 mM sodium phosphate, 300 mM sodium chloride, 10% [v/v] glycerol, 0.1% [w/v] DDM, 0.1% [w/v] CHAPS and 0.02% [w/v] CHS, pH = 8.0) containing low imidazole concentrations (20–50 mM). A2AR was eluted into purification buffer containing 500 mM imidazole. Prior to further chromatographic purification, imidazole was removed using a PD-10 desalting column (GE Healthcare, Pittsburgh, PA, USA; #17085101).
Ligand affinity resin was prepared as previously described for purification of active A2AR (O'Malley et al., 2007; Weiß and Grisshammer, 2002). In brief, 8 mL of isopropanol-washed Affigel 10 resin (BioRad, Hercules, CA, USA; #1536099) was mixed gently in an Erlenmeyer flask for 20 hr at room temperature with 48 mL of DMSO containing 24 mg of xanthine amine congener (XAC, high-affinity A2AR antagonist, KD = 32 nM; Sigma, St. Louis, MO, USA; #X103). The absorbance at 310 nm of the XAC-DMSO solution before and after the coupling reaction was measured in 10 mM HCl and compared to a standard curve. The amount of resin bound to ligand was estimated to be 5.6 μM. The coupling reaction was quenched by washing the resin with DMSO, then with Tris-HCl 50 mM (pH = 7.4), then with 20% (v/v) ethanol. The resin was packed into a Tricorn 10/50 column (GE Healthcare) under pressure via a BioRad Duoflow FPLC (BioRad).
For purification of active A2AR, the column was equilibrated with 4 CV of purification buffer. The IMAC-purified A2AR was desalted and diluted to 5.5 mL before applied to a 5 mL sample loop on the BioRad Duoflow FPLC, from which the sample was loaded onto the column at a rate of 0.1 mL/min. Inactive A2AR was washed from the column by flowing 10 mL of purification buffer at 0.2 mL/min, followed by 16 mL at 0.4 mL/min. Active A2AR was eluted from the column by flowing purification buffer containing 20 mM theophylline (low-affinity A2AR antagonist, KD = 1.6 μM; Sigma; #T1633). Western blot analysis was performed to determine 4 mL fractions with active A2AR collected with a BioFrac fraction collector (BioRad), which were then concentrated through a 30 kDa MWCO centrifugal filter (Millipore, Billerica, MA, USA; #UFC803096) and desalted to remove excess theophylline. For the experiments where the salt concentrations were varied, the buffer exchange was done also by this last desalting step.
Size-exclusion chromatography
Request a detailed protocolTo separate oligomeric species of active A2AR, a prepacked Tricorn Superdex 200 10/300 GL column (GE Healthcare; #17-5175-01) connected to a BioRad Duoflow FPLC was equilibrated with 60 mL of running buffer (150 mM sodium chloride except for the ionic strength experiments where NaCl concentration is adjusted to achieve the desired ionic strengths, 50 mM sodium phosphate, 10% [v/v] glycerol, 0.1% [w/v] DDM, 0.1% [w/v] CHAPS, 0.02% [w/v] CHS, pH = 8.0) at a flow rate of 0.2 mL/min. 0.5 mL fractions were collected with a BioFrac fraction collector in 30 mL of running buffer at the same flow rate. The subsequent SEC analysis performed on the SEC-separated oligomeric populations also followed this protocol.
SEC peak analysis
Request a detailed protocolSEC chromatograms were analyzed using OriginLab using the nonlinear curve fit (Gaussian) function. The area under the curve and the peak width were manually defined in cases where the SNR of the SEC trace were too low. The R2 values reached > 0.96 for most cases. The population of each oligomeric species was expressed as the integral of each Gaussian this curve fit of the SEC signal. The HMW oligomer peak in some cases could not be fitted with one curve and thus was fitted with two curves instead. The reported standard errors were calculated from the variance of the fit and did not correspond to experimental errors. The results are detailed in Figure 1—figure supplement 2 and Supplementary file 1.
SDS-PAGE and western blotting
Request a detailed protocol10% SDS-PAGE gels were hand-casted in BioRad Criterion empty cassettes (BioRad; #3459902, 3459903). Lysate controls were prepared by lysis of 5 OD cell pellets with 35 μL of YPER (Fisher Scientific, Waltham, MA, USA; #8990) at RT for 20 min, incubation with 2× Laemmli buffer (4% [w/v] SDS, 16% [v/v] glycerol, 0.02% [w/v] bromophenol blue, 167 M Tris, pH 6.8) at 37°C for 1 hr, and centrifugation at 3000 × g for 1 min to pellet cell debris. Protein samples were prepared by incubation with 2× Laemmli buffer at 37°C for 30 min. For all samples, 14 μL (for 26-well gel) or 20 μL (for 18-well gel) was loaded per lane, except for 7 μL of Magic Mark XP Western protein ladder (Thermo Scientific, Waltham, MA, USA; #LC5602) as a standard. Electrophoresis was carried out at 120 V for 100 min. Proteins were transferred to 0.2 μm nitrocellulose membranes (BioRad; #170-4159) via electroblotting using a BioRad Transblot Turbo, mixed MW protocol. Membranes were blocked in Tris-buffered saline with Tween (TBST; 150 mM sodium chloride, 15.2 mM Tris-HCl, 4.6 mM Tris base, pH = 7.4, 0.1% [v/v] Tween 20 [BioRad; #1706531]) containing 5% (w/v) dry milk, then probed with anti-A2AR antibody, clone 7F6-G5-A2, mouse monoclonal (Millipore, Burlington, MA, USA; #05-717) at 1:500 in TBST with 0.5% (w/v) dry milk. Probing with secondary antibody was done with a fluorescent anti-mouse IgG H&L DyLight 550 antibody (Abcam, Cambridge, MA, USA; #ab96880) at 1:600 in TBST containing 0.5% (w/v) milk.
Western blot was analyzed with Image Lab 6.1 software (BioRad), with built-in tool to define each sample lane and to generate an intensity profile. Peaks were manually selected and integrated with the measure tool to determine the amount of protein present.
CGMD simulations
Request a detailed protocolInitial configuration of A2AR was based on the crystal structure of the receptor in the active state (PDB 5G53). Since this structure does not include the entire C-terminus, we resorted to using homology modeling software (i.e., MODELLER 9.23) (Eswar et al., 2006) to predict the structures of the C-terminus. After removing all non-receptor components, the first segment of the C-terminus consisting of residues 291–314 was modeled as a helical segment parallel to the cytoplasmic membrane surface while the rest of the C-terminus was modeled as intrinsically disordered. MODELLER is much more accurate in structural predictions for segments less than 20 residues. This limitation necessitated that we run an equilibrium MD simulation for 2 µs to obtain a well-equilibrated structure that possesses a more viable starting conformation. To validate our models of all potential variants of A2AR, we calculated the RMSD and RMSF for each respective system. Default protonation states of ionizable residues were used. The resulting structure was converted to MARTINI CG topology using the martinize.py script (de Jong et al., 2013). The ELNeDyn elastic network (Periole et al., 2009) was used to constrain protein secondary and tertiary structures with a force constant of 500 kJ/mol/nm2 and a cutoff of 1.5 nm. To optimize loop refinement of the model, a single copy was embedded in a 1-palmitoyl-2-oleoyl-sn-glycero-3-phosphocholine (POPC) bilayer using the insane.py script, solvated with MARTINI polarizable water, neutralized with 0.15 M NaCl, and a short MD (1.5 µs) run to equilibrate the loop regions. Subsequently, two monomers of the equilibrated A2AR were randomly rotated and placed at the center of a 13 nm × 13 nm × 11 nm (xyz) box, 3.5 nm apart, with their principal transmembrane axis aligned parallel to the z axis. The proteins were then embedded in a POPC bilayer using the insane.py script. Sodium and chloride ions were added to neutralize the system and obtain a concentration of 0.15 M NaCl. Total system size was typically in the range of 34,000 CG particles, with a 280:1 lipid:protein ratio. Ten independent copies were generated for each A2AR truncated variant. v2.2 of the MARTINI CG force field (Monticelli et al., 2008) was used for the protein and water, and v2.0 was used for POPC. All CG simulations were carried out in GROMACS 2016 (Abraham et al., 2015) in the NPT ensemble (P = 1 atm, T = 310 K). The Bussi velocity rescaling thermostat was used for temperature control with a coupling constant of τt = 1.0 ps (Bussi et al., 2007), while the Parrinello–Rahman barostat (Martonák et al., 2003) was used to control the pressure semi-isotropically with a coupling constant of τt = 12.0 ps and compressibility of 3 × 10⁻⁴ bar–1. Reaction field electrostatics was used with Coulomb cutoff of 1.1 nm. Non-bonded Lennard–Jones interactions were treated with a cutoff of 1.1 nm. All simulations were run with a 15 fs time step, updating neighbor lists every 10 steps. Cubic periodic boundary conditions along the x, y, and z axes were used. Each simulation was run for 8 µs.
Atomistic MD simulations
Request a detailed protocolThree snapshots of symmetric dimers of A2AR for each respective truncated variant were randomly selected from the CG simulations as starting structures for backmapping. CG systems were converted to atomistic resolution using the backward.py script (Wassenaar et al., 2014). All simulations were run in Gromacs2019 in the NPT ensemble (P = 1 bar, T = 310 K) with all bonds restrained using the LINCS method (Hess et al., 1997). The Parrinello–Rahman barostat was used to control the pressure semi-isotropically with a coupling constant of τt = 1.0 ps and a compressibility of 4.5 × 10⁻⁵ bar–1, while the Bussi velocity rescaling thermostat was used for temperature control with a coupling constant of τt = 0.1 ps. Proteins, lipids, and solvents were separately coupled to the thermostat. The CHARMM36 and TIP3P force fields (Best et al., 2012; Jorgensen et al., 1983) were used to model all molecular interactions. Periodic boundary conditions were set in the x, y, and z directions. Particle mesh Ewald (PME) electrostatics was used with a cutoff of 1.0 nm. A 2-fs time step was used for all atomistic runs, and each simulation was run for 50 ns.
Analysis of computational results
Request a detailed protocolAll trajectories were postprocessed using gromacs tools and in-house scripts. We ran a clustering analysis of all dimer frames from the CG simulations using Daura et al.’s clustering algorithm (Daura et al., 1999) implemented in GROMACS, with an RMSD cutoff of 1.5 Å. An interface was considered dimeric if the minimum center of mass distance between the protomers was less than 5 Å. This method uses an RMSD cutoff to group all conformations with the largest number of neighbors into a cluster and eliminates these from the pool, then repeats the process until the pool is empty. We focused our analysis on the most populated cluster from each truncated variant. Electrostatic interactions in the dimer were calculated from CG systems with LOOS (Romo and Grossfield, 2009) using a distance cutoff of 5.0 Å. Transmembrane helical tilt angles were also calculated in LOOS from CG simulations. Hydrogen bonds were calculated from AA simulations using the hydrogen bonds plugin in VMD (Humphrey et al., 1996), with a distance cutoff of 3.5 Å and an angle cutoff of 20°. Only C-terminal residues were included in hydrogen bond analysis. PyMOL (The PyMOL Molecular Graphics System, version 2.0, Schrödinger, LLC, 2020) was used for molecular visualizations.
Assessing A2AR oligomerization with increasing ionic strength
Request a detailed protocolNa2HPO4 and NaH2PO4 in the buffer make up an ionic strength of 0.15 M, to which NaCl was added to increase the ionic strength to 0.45 M and furthermore to 0.95 M. The A2AR variants were purified at 0.45 M ionic strength and then exchanged into buffers of different ionic strengths using a PD-10 desalting column prior to subjecting the samples to SEC. The buffer composition is detailed below.
| Buffers | Components | Concentration (mM) | Ionic strength (mM) |
|---|---|---|---|
| 0.15 M ionic strength | NaCl | 0 | 0 |
| NaH2PO4 | 4 | 4 | |
| Na2HPO4 | 49 | 146 | |
| 0.45 M ionic strength | NaCl | 300 | 300 |
| NaH2PO4 | 4 | 4 | |
| Na2HPO4 | 49 | 146 | |
| 0.95 M ionic strength | NaCl | 800 | 800 |
| NaH2PO4 | 4 | 4 | |
| Na2HPO4 | 49 | 146 |
Isolated C-terminus purification
Request a detailed protocolEscherichia coli BL21 (DE3) cells (Sigma; #CMC0014) were transfected with pET28a DNA plasmids containing the desired A2AR sequence with a 6x His tag attached for purification. Cells from glycerol stock were grown in 10 mL luria broth (LB, Sigma Aldrich, L3022) overnight at 37°C and then used to inoculate 1 L of fresh LB and 10 μg/mL kanamycin (Fisher Scientific, BP906). Growth of cells was performed at 37°C, 200 rpm until optical density at λ = 600 nm reached 0.6–0.8. Expression was induced by incubation with 1 mM isopropyl-β-D-thiogalactoside (Fisher Bioreagents, BP175510) for 3 hr.
Cells were harvested with centrifugation at 5000 rpm for 30 min. Harvested cells were resuspended in 25 mL Tris-HCl, pH = 7.4, 100 mM NaCl, 0.5 mM DTT, 0.1 mM EDTA with 1 Pierce protease inhibitor tablet (Thermo Scientific, A32965), 1 mM PMSF, 2 mg/mL lysozyme, 20 μg/mL DNase (Sigma, DN25) and 10 mM MgCl2, and incubated on ice for 30 min. Samples were then incubated at 30°C for 20 min, then flash frozen and thawed three times in LN2. Samples were then centrifuged at 10,000 rpm for 10 min to remove cell debris. 1 mM PMSF was added again and the resulting supernatant was incubated while rotating for at least 4 hr with Ni-NTA resin. The resin was loaded to a column and washed with 25 mL 20 mM sodium phosphate, pH = 7.0, 1 M NaCl, 20 mM imidazole, 0.5 mM DTT, 100 μM EDTA. Purified protein was eluted with 15 mL of 20 mM sodium phosphate, pH = 7.0, 0.5 mM DTT, 100 mM NaCl, 300 mM imidazole. The protein was concentrated to a volume of 2.5 mL and was buffer exchanged into 20 mM ammonium acetate buffer, pH = 7.4, 100 mM NaCl using a GE PD-10 desalting column. Purity of sample was confirmed with SDS-PAGE and western blot.
Aggregation assay to assess A2AR C-terminus assembly
Request a detailed protocolAbsorbance was measured at 450 nm using a Shimadzu UV-1601 spectrophotometer with 120 µL sample size. Prior to reading, samples were incubated at 40°C for 5 min. Samples were vigorously pipetted to homogenize any precipitate before absorbance was measured. Protein concentration was 50 µM in a 20 mM ammonium acetate buffer (pH = 7.4).
Differential scanning fluorimetry (DSF)
Request a detailed protocolDSF was conducted with a BioRad CFX90 real-time PCR machine. A starting temperature of 20°C was increased at a rate of 0.5°C per 30 s to a final temperature of 85°C. All samples contained 40 μL of 40 µM A2AR C-terminus, 9x SYPRO orange (ThermoFisher S6650), 200 mM NaCl, and 20 mM MES. Fluorescence was detected in real time at 570 nm. All samples were conducted in triplicate.
Hydrophobicity and charge profile of C-terminus
Request a detailed protocolThe hydrophobicity profile reported in Figure 6—figure supplement 1 was determined with ProtScale using method described by Kyte and Doolittle, 1982, window size of 3.
Data availability
All data generated or analysed during this study are included in the manuscript and supporting files.
References
-
Interaction between particles suspended in solutions of macromoleculesJournal of Polymer Science 33:183–192.https://doi.org/10.1002/pol.1958.1203312618
-
How Hofmeister ion interactions affect protein stabilityBiophysical Journal 71:2056–2063.https://doi.org/10.1016/S0006-3495(96)79404-3
-
Two transmembrane cys residues are involved in 5-HT4 receptor dimerizationBiochemical and Biophysical Research Communications 356:642–647.https://doi.org/10.1016/j.bbrc.2007.03.030
-
Optimization of the additive CHARMM all-atom protein force field targeting improved sampling of the backbone φ, ψ and side-chain χ(1) and χ(2) dihedral anglesJournal of Chemical Theory and Computation 8:3257–3273.https://doi.org/10.1021/ct300400x
-
Galanin receptor-1 modulates 5-hydroxtryptamine-1A signaling via heterodimerizationBiochemical and Biophysical Research Communications 393:767–772.https://doi.org/10.1016/j.bbrc.2010.02.078
-
The adenosine A2A receptor interacts with the actin-binding protein alpha-actininJournal of Biological Chemistry 278:37545–37552.https://doi.org/10.1074/jbc.M302809200
-
Canonical sampling through velocity rescalingThe Journal of Chemical Physics 126:014101.https://doi.org/10.1063/1.2408420
-
Evidence for the heterotetrameric structure of the Adenosine A2A-dopamine D2 receptor complexBiochemical Society Transactions 44:595–600.https://doi.org/10.1042/BST20150276
-
Structures for G-Protein-Coupled receptor tetramers in complex with G proteinsTrends in Biochemical Sciences 40:548–551.https://doi.org/10.1016/j.tibs.2015.07.007
-
Catalysis by protein-disulphide isomerase of the unfolding and refolding of proteins with disulphide bondsJournal of Molecular Biology 142:43–62.https://doi.org/10.1016/0022-2836(80)90205-3
-
Peptide folding: when simulation meets experimentAngewandte Chemie International Edition 38:236–240.https://doi.org/10.1002/(SICI)1521-3773(19990115)38:1/2<236::AID-ANIE236>3.0.CO;2-M
-
Role of extracellular cysteine residues in the adenosine A2A receptorPurinergic Signalling 12:313–329.https://doi.org/10.1007/s11302-016-9506-7
-
“Improved Parameters for the Martini Coarse-Grained Protein Force Field.”Journal of Chemical Theory and Computation 9:687–697.https://doi.org/10.1021/ct300646g
-
G Protein-Coupled receptor heteromers as putative pharmacotherapeutic targets in autismFrontiers in Cellular Neuroscience 14:588662.https://doi.org/10.3389/fncel.2020.588662
-
Dynamic tuneable G protein-coupled receptor monomer-dimer populationsNature Communications 9:03727-6.https://doi.org/10.1038/s41467-018-03727-6
-
G-protein-coupled receptors and cancerNature Reviews Cancer 7:79–94.https://doi.org/10.1038/nrc2069
-
Evidence for negative binding cooperativity within CCR5-CCR2b heterodimersMolecular Pharmacology 67:460–469.https://doi.org/10.1124/mol.104.003624
-
Comparative protein structure modeling using modellerCurrent Protocols in Bioinformatics 15:5.6.1–5.6.5.https://doi.org/10.1002/0471250953.bi0506s15
-
Dimerization and ligand binding affect the structure network of A2A adenosine receptorBiochimica Et Biophysica Acta (BBA) - Biomembranes 1808:1256–1266.https://doi.org/10.1016/j.bbamem.2010.08.006
-
An update on the physiological and therapeutic relevance of GPCR oligomersPharmacological Research 117:303–327.https://doi.org/10.1016/j.phrs.2017.01.008
-
G protein-coupled receptor oligomerization revisited: functional and pharmacological perspectivesPharmacological Reviews 66:413–434.https://doi.org/10.1124/pr.113.008052
-
Structure of the rhodopsin dimer: a working model for G-protein-coupled receptorsCurrent Opinion in Structural Biology 16:252–259.https://doi.org/10.1016/j.sbi.2006.03.013
-
Heterodimerization of calcium sensing receptors with metabotropic glutamate receptors in neuronsJournal of Biological Chemistry 276:39053–39059.https://doi.org/10.1074/jbc.M105662200
-
The modification and assembly of proteins in the endoplasmic reticulumCurrent Opinion in Cell Biology 5:589–595.https://doi.org/10.1016/0955-0674(93)90127-C
-
G-protein-coupled receptor oligomerization and its potential for drug discoveryNature Reviews Drug Discovery 1:808–820.https://doi.org/10.1038/nrd913
-
Multiscale modelling to understand the self-assembly mechanism of human β2-adrenergic receptor in lipid bilayerComputational Biology and Chemistry 48:29–39.https://doi.org/10.1016/j.compbiolchem.2013.11.002
-
Book“Yeast Transformation by the LiAc/SS Carrier DNA/PEG MethodIn: Xiao W, editors. Yeast ProtocolsMethods in Molecular Biology. New York: Springer. pp. 33–44.https://doi.org/10.1385/0896033198
-
Hydrophobic interaction of two large plates: an analysis of salting-in/salting-out effectsChemical Physics Letters 491:54–58.https://doi.org/10.1016/j.cplett.2010.03.092
-
The endoplasmic reticulum as a protein-folding compartmentTrends in Cell Biology 2:227–231.https://doi.org/10.1016/0962-8924(92)90309-B
-
LINCS: a linear constraint solver for molecular simulationsJournal of Computational Chemistry 18:1463–1472.https://doi.org/10.1002/(SICI)1096-987X(199709)18:12<1463::AID-JCC4>3.0.CO;2-H
-
Guanidinium can both cause and prevent the hydrophobic collapse of biomacromoleculesJournal of the American Chemical Society 139:863–870.https://doi.org/10.1021/jacs.6b11082
-
Hypersensitization of the orexin 1 receptor by the CB1 receptor: evidence for cross-talk blocked by the specific CB1 antagonist, SR141716Journal of Biological Chemistry 278:23731–23737.https://doi.org/10.1074/jbc.M212369200
-
Zur Lehre yon der wirkung der salzeArchiv Für Experimentelle Pathologie Und Pharmakologie 24:247–260.https://doi.org/10.1007/BF01918191
-
Crystal structure of oligomeric β1-adrenergic G protein-coupled receptors in ligand-free basal stateNature Structural & Molecular Biology 20:419–425.https://doi.org/10.1038/nsmb.2504
-
VMD: visual molecular dynamicsJournal of Molecular Graphics 14:33–38.https://doi.org/10.1016/0263-7855(96)00018-5
-
General principles and strategies for Salting-Out informed by the Hofmeister seriesOrganic Process Research & Development 21:1355–1370.https://doi.org/10.1021/acs.oprd.7b00197
-
G protein-coupled receptors show unusual patterns of intrinsic unfoldingProtein Engineering, Design and Selection 18:103–110.https://doi.org/10.1093/protein/gzi004
-
Comparison of simple potential functions for simulating liquid waterThe Journal of Chemical Physics 79:926–935.https://doi.org/10.1063/1.445869
-
The Class-A GPCR dopamine D2 receptor forms transient dimers stabilized by agonists: detection by Single-Molecule trackingCell Biochemistry and Biophysics 76:29–37.https://doi.org/10.1007/s12013-017-0829-y
-
Characterization of binding kinetics of A2AR to Gαsprotein by surface plasmon resonanceBiophysical Journal 120:1641–1649.https://doi.org/10.1016/j.bpj.2021.02.032
-
A simple method for displaying the hydropathic character of a proteinJournal of Molecular Biology 157:105–132.https://doi.org/10.1016/0022-2836(82)90515-0
-
Oligomerization of dopamine and serotonin receptorsNeuropsychopharmacology 23:S32–S40.https://doi.org/10.1016/S0893-133X(00)00155-X
-
Dopamine D1 and D2 receptor Co-activation generates a novel phospholipase C-mediated calcium signalJournal of Biological Chemistry 279:35671–35678.https://doi.org/10.1074/jbc.M401923200
-
Organization of the G Protein-coupled receptors rhodopsin and opsin in native membranesJournal of Biological Chemistry 278:21655–21662.https://doi.org/10.1074/jbc.M302536200
-
Heterodimerization of the kappa opioid receptor and neurotensin receptor 1 contributes to a novel β-arrestin-2–biased pathwayBiochimica Et Biophysica Acta (BBA) - Molecular Cell Research 1863:2719–2738.https://doi.org/10.1016/j.bbamcr.2016.07.009
-
An unconventional role for cytoplasmic disulfide bonds in vaccinia virus proteinsJournal of Cell Biology 144:267–279.https://doi.org/10.1083/jcb.144.2.267
-
The depletion attraction: an underappreciated force driving cellular organizationJournal of Cell Biology 175:681–686.https://doi.org/10.1083/jcb.200609066
-
Predicting crystal structures: the Parrinello-Rahman method revisitedPhysical Review Letters 90:075503.https://doi.org/10.1103/PhysRevLett.90.075503
-
Characterization of intrinsically disordered proteins and their dynamic complexes: from in vitro to cell-like environmentsProgress in Nuclear Magnetic Resonance Spectroscopy 109:79–100.https://doi.org/10.1016/j.pnmrs.2018.07.001
-
Single-molecule analysis reveals agonist-specific dimer formation of µ-opioid receptorsNature Chemical Biology 16:946–954.https://doi.org/10.1038/s41589-020-0566-1
-
The MARTINI Coarse-Grained force field: extension to proteinsJournal of Chemical Theory and Computation 4:819–834.https://doi.org/10.1021/ct700324x
-
Conserved disulfide bond is not essential for the adenosine A2A receptor: extracellular cysteines influence receptor distribution within the cell and ligand-binding recognitionBiochimica Et Biophysica Acta (BBA) - Biomembranes 1848:603–614.https://doi.org/10.1016/j.bbamem.2014.11.010
-
Exceptional total and functional yields of the human adenosine (A2a) receptor expressed in the yeast Saccharomyces cerevisiaeProtein Expression and Purification 46:204–211.https://doi.org/10.1016/j.pep.2005.09.020
-
GPCRdb in 2018: adding GPCR structure models and ligandsNucleic Acids Research 46:D440–D446.https://doi.org/10.1093/nar/gkx1109
-
Combining an elastic network with a Coarse-Grained molecular force field: structure, dynamics, and intermolecular recognitionJournal of Chemical Theory and Computation 5:2531–2543.https://doi.org/10.1021/ct9002114
-
Structural determinants of the supramolecular organization of G protein-coupled receptors in bilayersJournal of the American Chemical Society 134:10959–10965.https://doi.org/10.1021/ja303286e
-
Membrane protein folding and oligomerization: the two-stage modelBiochemistry 29:4031–4037.https://doi.org/10.1021/bi00469a001
-
Theory of the hydrophobic effectThe Journal of Chemical Physics 67:3683–3704.https://doi.org/10.1063/1.435308
-
Effects of macromolecular crowding on the conformational ensembles of disordered proteinsThe Journal of Physical Chemistry Letters 4:3429–3434.https://doi.org/10.1021/jz401817x
-
Metabotropic glutamate receptor 5 is a Disulfide-linked dimerJournal of Biological Chemistry 271:28612–28616.https://doi.org/10.1074/jbc.271.45.28612
-
ConferenceLOOS: an extensible platform for the structural analysis of simulations2009 Annual International Conference of the IEEE Engineering in Medicine and Biology Society.https://doi.org/10.1109/IEMBS.2009.5335065
-
Disulfide bond formation in the cytoplasmAntioxidants & Redox Signaling 19:46–53.https://doi.org/10.1089/ars.2012.4868
-
Structure and function of G Protein-Coupled receptor oligomers: implications for drug discovery: studying GPCR oligomer functionWiley Interdisciplinary Reviews. Nanomedicine and Nanobiotechnology 7:408–427.https://doi.org/10.1002/wnan.1319
-
Oligomerization of the α 1a - and α 1b -adrenergic receptor subtypes: potential implications in receptor internalizationJournal of Biological Chemistry 278:40239–40251.https://doi.org/10.1074/jbc.M306085200
-
Dimerization of the δ opioid receptor: implication for a role in receptor internalizationJournal of Biological Chemistry 272:26959–26964.https://doi.org/10.1074/jbc.272.43.26959
-
Protein disorder prevails under crowded conditionsBiochemistry 50:5834–5844.https://doi.org/10.1021/bi200365j
-
Molecular dynamics simulations of hydrophobic associations in aqueous salt solutions indicate a connection between water hydrogen bonding and the hofmeister effectJournal of the American Chemical Society 129:14887–14898.https://doi.org/10.1021/ja073097z
-
The Hydrophobic Effect and the Role of CosolventsThe Journal of Physical Chemistry B 121:9986–9998.https://doi.org/10.1021/acs.jpcb.7b06453
-
Going backward: a flexible geometric approach to reverse transformation from coarse grained to atomistic modelsJournal of Chemical Theory and Computation 10:676–690.https://doi.org/10.1021/ct400617g
-
Purification and characterization of the human adenosine A(2a) receptor functionally expressed in Escherichia coliEuropean Journal of Biochemistry 269:82–92.https://doi.org/10.1046/j.0014-2956.2002.02618.x
-
Major ligand-induced rearrangement of the heptahelical domain interface in a GPCR dimerNature Chemical Biology 11:134–140.https://doi.org/10.1038/nchembio.1711
-
Hofmeister effects: an explanation for the impact of ionic liquids on biocatalysisJournal of Biotechnology 144:12–22.https://doi.org/10.1016/j.jbiotec.2009.04.011
-
Entropically driven self–assembly and interaction in suspensionPhilosophical Transactions of the Royal Society of London 359:921–937.https://doi.org/10.1098/rsta.2000.0810
-
Effect of ions on the hydrophobic interaction between two platesJournal of the American Chemical Society 129:4678–4686.https://doi.org/10.1021/ja068305m
-
Identification and molecular characterization of m3 muscarinic receptor dimersJournal of Biological Chemistry 274:19487–19497.https://doi.org/10.1074/jbc.274.27.19487
Article and author information
Author details
Khanh Dinh Quoc Nguyen

Funding
National Institute of General Medical Sciences (R35GM136411)
- Khanh Dinh Quoc Nguyen
- Michael Vigers
- Susanna Seppälä
- Nicole Star Schonenbach
- Michelle Ann O'Malley
- Songi Han
National Institute of Mental Health (1R43MH119906-01)
- Khanh Dinh Quoc Nguyen
- Jennifer Paige Hoover
- Michelle Ann O'Malley
- Songi Han
National Science Foundation (MCB-1714888)
- Eric Sefah
- Blake Mertz
The funders had no role in study design, data collection and interpretation, or the decision to submit the work for publication.
Acknowledgements
This material is based upon work supported by (1) the National Institute of General Medical Sciences of the National Institutes of Health under Award Number R35GM136411, (2) the National Institute of Mental Health of the National Institutes of Health under Small Business Innovation Research Award Number 1R43MH119906-01, and (3) the National Science Foundation under Award Number MCB-1714888 (ES and BM). The content is solely the responsibility of the authors and does not necessarily represent the official views of the National Institutes of Health. Many of the experiments were completed with the assistance from Rohan Katpally. The pITy expression vector and S. cerevisiae BJ5464 strain were generously provided by Prof. Anne Robinson's lab at Carnegie Mellon University. The X7 polymerase was a gift from Dr. Morten Nørholm, Novo Nordisk Foundation Center for Biosustainability, Technical University of Denmark. Computational time was provided through WVU Research Computing and XSEDE allocation no. TG-MCB130040.
Version history
- Preprint posted: December 22, 2020 (view preprint)
- Received: January 18, 2021
- Accepted: July 15, 2021
- Accepted Manuscript published: July 16, 2021 (version 1)
- Version of Record published: August 2, 2021 (version 2)
Copyright
© 2021, Nguyen et al.
This article is distributed under the terms of the Creative Commons Attribution License, which permits unrestricted use and redistribution provided that the original author and source are credited.
Metrics
-
- 1,890
- views
-
- 317
- downloads
-
- 8
- citations
Views, downloads and citations are aggregated across all versions of this paper published by eLife.
Download links
A two-part list of links to download the article, or parts of the article, in various formats.
Downloads (link to download the article as PDF)
Open citations (links to open the citations from this article in various online reference manager services)
Cite this article (links to download the citations from this article in formats compatible with various reference manager tools)
Homo-oligomerization of the human adenosine A2A receptor is driven by the intrinsically disordered C-terminus
eLife 10:e66662.
https://doi.org/10.7554/eLife.66662
Further reading
-
- Biochemistry and Chemical Biology
- Microbiology and Infectious Disease
To date, all major modes of monoclonal antibody therapy targeting SARS-CoV-2 have lost significant efficacy against the latest circulating variants. As SARS-CoV-2 omicron sublineages account for over 90% of COVID-19 infections, evasion of immune responses generated by vaccination or exposure to previous variants poses a significant challenge. A compelling new therapeutic strategy against SARS-CoV-2 is that of single-domain antibodies, termed nanobodies, which address certain limitations of monoclonal antibodies. Here, we demonstrate that our high-affinity nanobody repertoire, generated against wild-type SARS-CoV-2 spike protein (Mast et al., 2021), remains effective against variants of concern, including omicron BA.4/BA.5; a subset is predicted to counter resistance in emerging XBB and BQ.1.1 sublineages. Furthermore, we reveal the synergistic potential of nanobody cocktails in neutralizing emerging variants. Our study highlights the power of nanobody technology as a versatile therapeutic and diagnostic tool to combat rapidly evolving infectious diseases such as SARS-CoV-2.
-
- Biochemistry and Chemical Biology
Phosphoinositide 3-kinase (PI3K) beta (PI3Kβ) is functionally unique in the ability to integrate signals derived from receptor tyrosine kinases (RTKs), G-protein coupled receptors, and Rho-family GTPases. The mechanism by which PI3Kβ prioritizes interactions with various membrane-tethered signaling inputs, however, remains unclear. Previous experiments did not determine whether interactions with membrane-tethered proteins primarily control PI3Kβ localization versus directly modulate lipid kinase activity. To address this gap in our knowledge, we established an assay to directly visualize how three distinct protein interactions regulate PI3Kβ when presented to the kinase in a biologically relevant configuration on supported lipid bilayers. Using single molecule Total Internal Reflection Fluorescence (TIRF) Microscopy, we determined the mechanism controlling PI3Kβ membrane localization, prioritization of signaling inputs, and lipid kinase activation. We find that auto-inhibited PI3Kβ prioritizes interactions with RTK-derived tyrosine phosphorylated (pY) peptides before engaging either GβGγ or Rac1(GTP). Although pY peptides strongly localize PI3Kβ to membranes, stimulation of lipid kinase activity is modest. In the presence of either pY/GβGγ or pY/Rac1(GTP), PI3Kβ activity is dramatically enhanced beyond what can be explained by simply increasing membrane localization. Instead, PI3Kβ is synergistically activated by pY/GβGγ and pY/Rac1 (GTP) through a mechanism consistent with allosteric regulation.


