Identification of a molecular basis for the juvenile sleep state
- Department of Psychiatry, Perelman School of Medicine at the University of Pennsylvania, United States
- Department of Medicine, Perelman School of Medicine at the University of Pennsylvania, United States
- Department of Biology, University of New Mexico, United States
- Department of Neuroscience, Perelman School of Medicine at the University of Pennsylvania, United States
- Chronobiology and Sleep Institute, Perelman School of Medicine at the University of Pennsylvania, United States
Abstract
Across species, sleep in young animals is critical for normal brain maturation. The molecular determinants of early life sleep remain unknown. Through an RNAi-based screen, we identified a gene, pdm3, required for sleep maturation in Drosophila. Pdm3, a transcription factor, coordinates an early developmental program that prepares the brain to later execute high levels of juvenile adult sleep. PDM3 controls the wiring of wake-promoting dopaminergic (DA) neurites to a sleep-promoting region, and loss of PDM3 prematurely increases DA inhibition of the sleep center, abolishing the juvenile sleep state. RNA-Seq/ChIP-Seq and a subsequent modifier screen reveal that pdm3 represses expression of the synaptogenesis gene Msp300 to establish the appropriate window for DA innervation. These studies define the molecular cues governing sleep behavioral and circuit development, and suggest sleep disorders may be of neurodevelopmental origin.
Introduction
Across species, sleep amounts are highest in early life and decrease as animals mature (Kayser and Biron, 2016; Roffwarg et al., 1966). Increasing evidence suggests early life sleep may represent a distinct behavioral state, uniquely evolved for the needs of a developing nervous system (Blumberg, 2015; Clawson et al., 2016; Dilley et al., 2018; Frank, 2011). In humans, childhood sleep disturbances portend later neurocognitive deficits, possibly because sleep loss impinges on neural circuit formation (Kotagal, 2015; O'Brien, 2009). Although mechanisms controlling mature adult sleep have been uncovered (Allada et al., 2017), the regulation of early life sleep remains poorly understood.
Like other animals, the fruit fly, Drosophila melanogaster, exhibits increased sleep duration in young adulthood that tapers with maturity (Dilley et al., 2018; Kayser et al., 2014; Shaw et al., 2000). At the circuit level, activity of wake-promoting dopaminergic (DA) neurons increases as flies mature, exerting greater inhibitory influence on the sleep-promoting dorsal fan shaped body (dFSB) (Donlea et al., 2014; Kayser et al., 2014; Liu et al., 2012; Ueno et al., 2012). The mechanistic underpinnings of how this central sleep circuit develops are not defined. More broadly, there are no known genes that regulate sleep ontogenetic change. We previously found that all studied short and long-sleeping Drosophila mutants sleep more when young (Dilley et al., 2018). Thus, genes regulating sleep ontogenetic change are likely distinct from those that control sleep duration.
From an RNAi-based screen, we identified the transcription factor pdm3 as a genetic regulator of sleep ontogeny. In contrast to all other characterized sleep mutants, flies lacking PDM3 do not attain appropriately high juvenile sleep amounts. Pdm3 knockdown specifically during pupal development prematurely increases wake-promoting DA input to the dFSB. Blocking DA signaling to the dFSB rescues sleep ontogeny in flies lacking PDM3, demonstrating that greater inhibitory DA signaling to the sleep center prevents young flies from achieving high sleep amounts. Transcriptional profiling of mid-pupal brains and a subsequent genetic modifier screen reveal that pdm3 regulates expression of the synapse assembly gene, Msp300, to control sleep ontogeny. Thus, miswiring during early development leads to a brain structural abnormality that disrupts the normal ontogeny of sleep behavior.
Results
Pdm3 controls sleep ontogeny in Drosophila
To identify genes that specifically regulate sleep ontogeny, we performed an RNAi-based screen to search for factors that, when knocked down, abolish normal ontogenetic change in sleep duration. We used Elav-GAL4 to pan-neuronally knockdown >1000 individual genes selected from those with predicted neuronal expression (www.flybase.org), and compared sleep amount in adult flies at day one post-eclosion (young adults) to flies at day 4–5 post-eclosion (mature adults) (Figure 1A). We calculated an ‘ontogeny ratio’ (OR) as the ratio of sleep amount in young/mature flies of each genotype, and screened for ratios close to 1. After identifying 53 hits from the primary screen (Figure 1B; Figure 1—figure supplement 1A), we then conducted a secondary screen with independent RNAi lines (Figure 1C; Figure 1—figure supplement 1B; Dietzl et al., 2007).
Figure 1 with 2 supplements see all

Pdm3 controls sleep ontogeny in Drosophila.
(A) Ontogeny screen design (B) Primary sleep ontogeny screen. Ontogeny ratio = (min daytime sleep, young) / (min daytime sleep, mature). (C) Secondary screen of primary hits (n ≥ 8 flies per genotype/age in B and C). (D) Representative sleep traces of genetic controls (top) and pdm3 knockdown (bottom). Young flies are shown in blue and mature flies are shown in orange. Comparison of (E) total sleep, (F) day sleep and (G) night sleep in pdm3 RNAi and controls at day 1 versus day 4–5 (n = 97, 106, 119, 95, 140, 145 left to right in E-G). (H) Total sleep time with re-expression of PDM3 (right) versus a control UAS-GFP construct (middle) (n = 24, 24, 19, 16, 30, 31 left to right). Graphs in this figure and all others unless otherwise specified are presented as means ± SEM. ****p<0.0001, ***p<0.001, **p<0.01, *p<0.05; multiple Student’s t tests with Holm-Sidak correction, alpha = 0.05 (E–H).
Knockdown of the gene pdm3 with either one of two RNAi lines, each targeting a different part of the gene, resulted in a consistent loss of sleep ontogenetic change (Figure 1B,C). Following outcrossing to a uniform genetic background, we found that while genetic controls had robust ontogenetic change in total sleep time, pan-neuronal pdm3 knockdown abolished this transition (Figure 1D,E). This phenotype was driven by attenuation of daytime sleep ontogeny (Figure 1F) and less night sleep in young compared to mature flies with pdm3 knockdown (Figure 1G). Pdm3 is part of the POU domain transcription factor family, a gene group with essential roles in nervous system patterning across species (Badea et al., 2012; Dominguez et al., 2013; Olsson-Carter and Slack, 2011). In Drosophila, PDM3 is a broadly expressed neuronal protein that coordinates axon targeting in several areas of the brain (Chen et al., 2012; Tichy et al., 2008). Staining with an anti-PDM3 antibody confirmed a drastic reduction in brain protein levels with knockdown (Figure 1—figure supplement 2; Chen et al., 2012). Restoring PDM3 in the setting of pdm3 knockdown rescued sleep ontogeny (Figure 1H; Figure 1—figure supplement 2), indicating that the phenotype is specific to PDM3 reduction. Thus, pdm3 regulates sleep ontogenetic change.
Increased daytime sleep in young flies typically stems from prolonged duration of sleep bouts (Figure 2A, genetic controls) (Kayser et al., 2014); pdm3 knockdown disrupted this consolidation of daytime sleep in early life (Figure 2A). Further, at both ages, flies had more fragmented day and night sleep than controls, with greater numbers of short sleep bouts (Figure 2A–D), as well as redistributed sleep across the day and night (Figure 1D; Figure 2—figure supplement 1A). Mature flies lacking pdm3 also exhibited reduced locomotor rhythmicity in constant darkness (Figure 2—figure supplement 1B-D), though the core molecular clock remained intact (Figure 2—figure supplement 1E), suggesting a problem with clock output (Taghert and Shafer, 2006). Importantly, these changes in sleep architecture and rhythmicity were fully dissociable from deficits in sleep ontogeny (demonstrated below, Figure 3E–G; Figure 5—figure supplement 1) indicating a mechanistically distinct role for pdm3 in juvenile sleep.
Figure 2 with 3 supplements see all
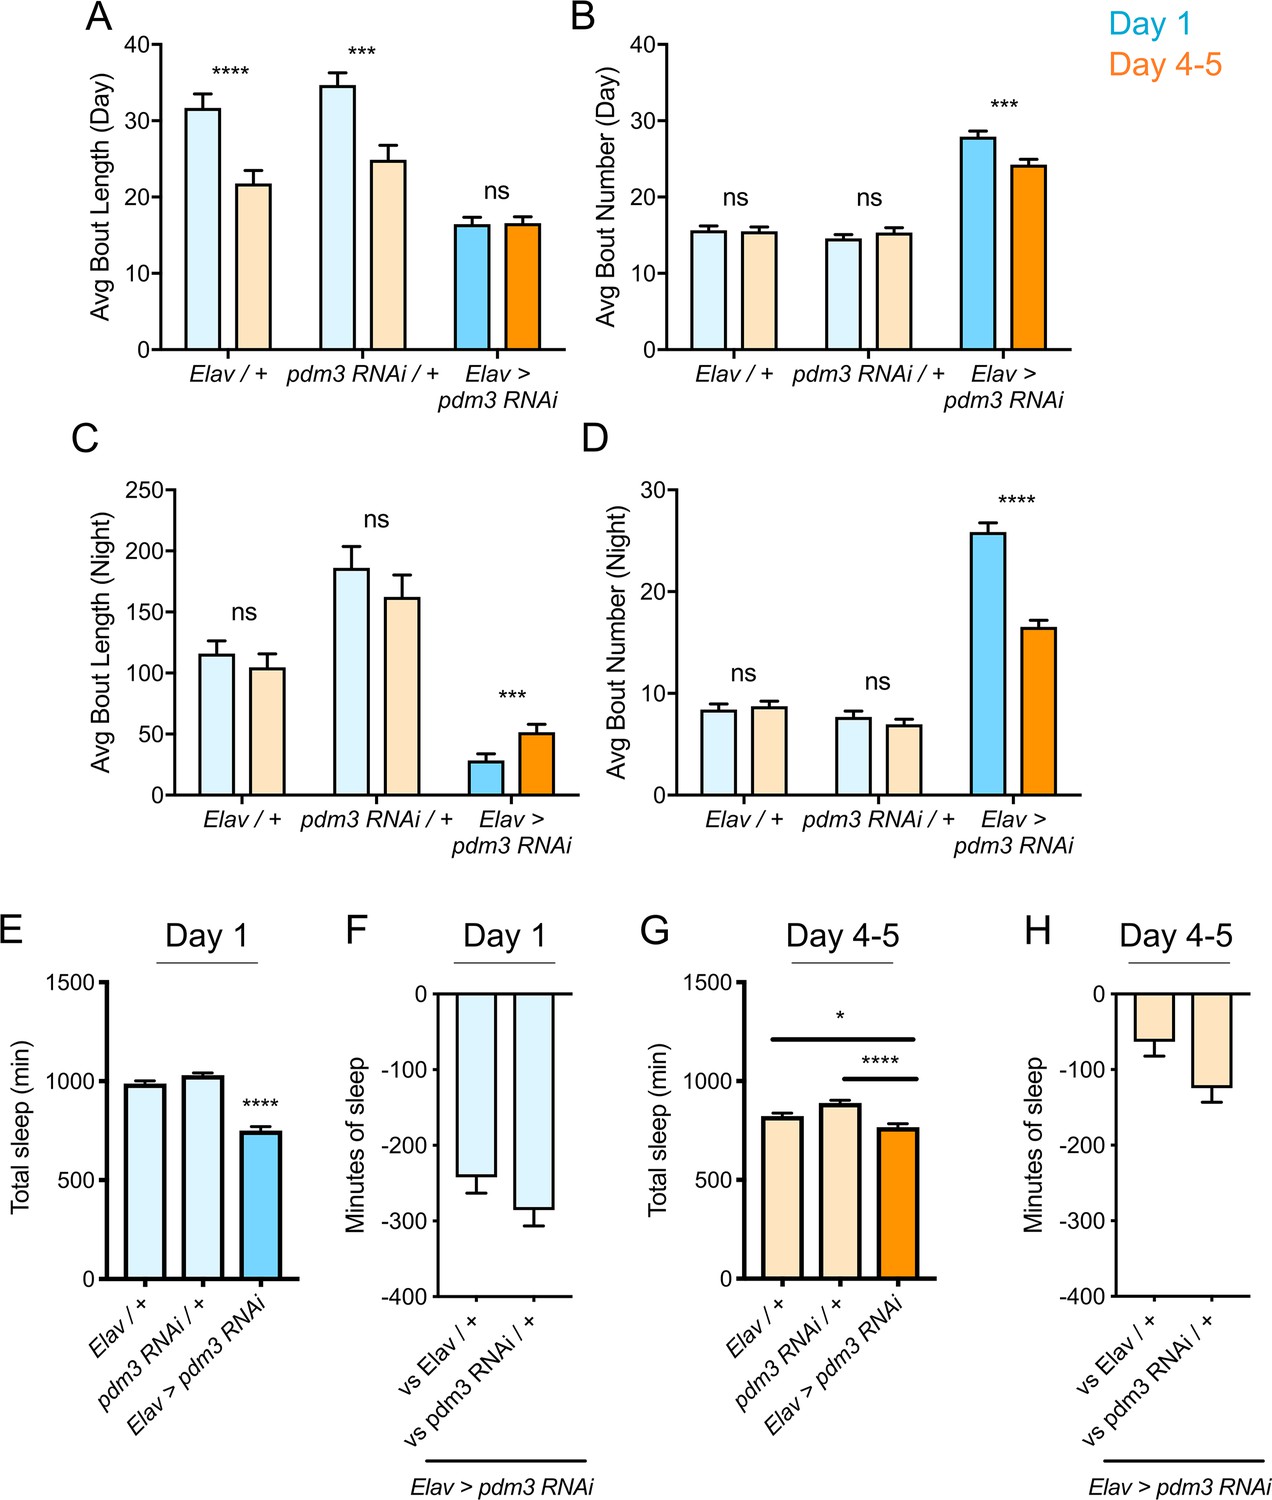
Effects of pdm3 knockdown on sleep architecture.
(A) Day sleep average bout length and (B) day sleep average bout number in pdm3 RNAi and controls at day 1 (blue) versus day 4–5 (orange). (C) Night bout length and (D) night average bout number in pdm3 RNAi and controls (n = 97, 106, 119, 95, 140, 145 left to right in A-D). (E) Total sleep time at day 1, pdm3 RNAi versus controls (n = 97, 119, 140 left to right). (F) Minutes of sleep lost in Elav-GAL4 >UAS pdm3 RNAi at day one compared to each genetic control. (G) Total sleep time at day 4–5, pdm3 RNAi versus controls (n = 106, 95, 145 left to right). (H) Minutes of sleep lost in Elav-GAL4 >UAS pdm3 RNAi at day 4–5 compared to each genetic control. ****p<0.0001, ***p<0.001, **p<0.01, *p<0.05; multiple Student’s t tests with Holm-Sidak correction, alpha = 0.05 (A–D); ANOVA with Tukey’s test (E–H).
Figure 3 with 1 supplement see all

Pdm3 acts during mid-pupal development to control sleep ontogeny.
(A) Drosophila life cycle. (B) Total sleep in mature adults with pdm3 knockdown post-eclosion and genetic controls (n = 50, 60, 70 left to right). (C) Total sleep with pre-eclosion pdm3 knockdown in day 1 (blue) versus day 4–5 (orange) (n = 44, 42, 38, 42, 35, 50 left to right) (D) Total sleep with pdm3 knockdown from embryo to the 3rd instar larval stage (n = 76, 79, 82, 64, 73, 99 left to right). (E) Total sleep (left) and day sleep bout number (right) with pdm3 knockdown from the 3rd instar larval stage up to the mid pupal stage (n = 33, 32, 32, 31, 32, 32 left to right). (F) Total sleep (left) and day sleep bout number (right) with pdm3 knockdown from the 3rd instar larval stage to the late pupal stage (n = 30, 32, 32, 32, 32, 31 left to right). (G) Summary of temporal mapping and dissociation of sleep ontogeny from sleep architecture ****p<0.0001, ***p<0.001, **p<0.01, *p<0.05; multiple Student’s t tests with Holm-Sidak correction, alpha = 0.05 (C, D, E/F left); ANOVA with Tukey’s test (B, E/F right).
The loss of sleep ontogenetic change can arise in two main ways: (1) early life sleep is disrupted, such that young flies do not achieve high sleep amounts or (2) mature flies exhibit a persistent juvenile sleep state. Comparison of sleep duration at each age showed that while mature flies lacking pdm3 exhibited a mild reduction in sleep duration, young flies had a more substantial loss of sleep (Figure 2E–H). Moreover, despite circadian-related redistribution of sleep from night to day, daytime sleep was lower than anticipated in juvenile flies with PDM3 knockdown (Figure 2—figure supplement 2). Taken together, our data show that with pdm3 knockdown, young flies are not able to attain appropriately high sleep amounts or increased sleep consolidation, indicating a particular disruption of early life sleep.
We next wondered whether pdm3 controls maturation of other behaviors, as opposed to sleep behaviors specifically. Male courtship of females is a robust, innate behavior that also undergoes ontogenetic change during early adulthood (Eastwood and Burnet, 1977). In contrast to its effects on sleep ontogeny, pdm3 knockdown did not affect ontogenetic change in courtship (Figure 2—figure supplement 3). Therefore, pdm3 is unlikely to be broadly required for behavioral maturation, but plays a critical role in regulating sleep ontogeny.
Pdm3 acts during the mid-pupal stage of development to control sleep ontogeny
Pdm3 could play an active role in regulating sleep amount in young adult flies, or it could act during earlier development to influence how sleep circuits form. We used an inducible knockdown system (McGuire et al., 2004) to examine when during development pdm3 is required for normal sleep ontogeny. First, we tested whether pdm3 acts prior to or following eclosion. Beginning knockdown immediately following eclosion had no effect on sleep duration (Figure 3B), fragmentation (Figure 3—figure supplement 1A), or day-night distribution (Figure 3—figure supplement 1B) in mature adults, indicating that pdm3 does not actively regulate sleep in adulthood. In contrast, knockdown of pdm3 for the entire pre-eclosion period (starting at the embryonic stage) abolished sleep ontogenetic change (Figure 3C). We further restricted knockdown to narrower pre-eclosion developmental windows. Loss of pdm3 from embryonic stages until the beginning of the 3rd instar larval stage had no effect on sleep ontogeny (Figure 3D), indicating that pdm3 acts during later stages of development. Knockdown from the beginning of the 3rd instar larval stage to the middle of pupation likewise did not affect sleep ontogeny (Figure 3E, left panel), but did lead to sleep fragmentation (Figure 3E, right panel) and day-night redistribution (Figure 3—figure supplement 1C). The disruption of sleep architecture while ontogeny remained intact indicates that these phenotypes are temporally dissociable. Finally, in addition to effects on sleep architecture (Figure 3F, right and Figure 3—figure supplement 1D), extending knockdown from the beginning of 3rd instar up to the late pupal stage abolished sleep ontogeny (Figure 3F, left). Since sleep ontogeny remained intact until knockdown extended through the mid-pupal stage, we concluded that pdm3 acts during mid-pupal development to control sleep ontogeny (Figure 3G).
Pdm3 controls dopaminergic synapse formation in the sleep-promoting dorsal fan shaped body
Given that pdm3 acts during pre-eclosion development, we hypothesized that loss of PDM3 may disrupt patterning of ontogeny-relevant sleep circuits. The dorsal fan shaped body (dFSB), part of the central complex (CCX), is a synaptic neuropil in which projections from wake-promoting DA neurons inhibit sleep-promoting ExFl2 neurons (Donlea et al., 2011; Donlea et al., 2014; Liu et al., 2012; Pimentel et al., 2016). These DA inputs are less active in young flies, reducing inhibition of the sleep-promoting neurons and facilitating more sleep (Kayser et al., 2014). Previous work showed that pdm3 null mutants, which do not survive as adults, have grossly disrupted DA innervation of the CCX and intrinsic CCX structural abnormalities (Chen et al., 2012). We investigated whether the decrease in juvenile sleep seen with pdm3 knockdown could be explained by changes in DA innervation of the dFSB, or aberrant development of the CCX itself.
We first examined whether pdm3 knockdown leads to structural changes in the sleep-promoting ExFl2 projections to the dFSB, labeled by the 23E10 driver (Donlea et al., 2014). We did not see gross morphological changes in the neurites (Figure 4A), but quantification revealed an increase in innervation with pdm3 knockdown (Figure 4B). An increase in ExFl2 projections to the dFSB could reflect the sleep-promoting neurons receiving more inhibitory DA input, thereby preventing young flies from achieving high sleep amounts. Indeed, labeling of DA neurites using a tyrosine hydroxylase promoter (TH-LexA) showed a two-fold increase in the density of DA innervation to the dFSB (Figure 4C,D). We also noticed that DA inputs to the ventral FSB (vFSB) were grossly disorganized (Figure 4C). However, loss of PDM3 did not diffusely disrupt DA innervation, as TH+ innervation of the mushroom body was unchanged (Figure 4—figure supplement 1A). Thus, pdm3 knockdown alters DA inputs to the FSB, leading to greater innervation density in the dFSB and disorganization of inputs to the vFSB.
Figure 4 with 2 supplements see all
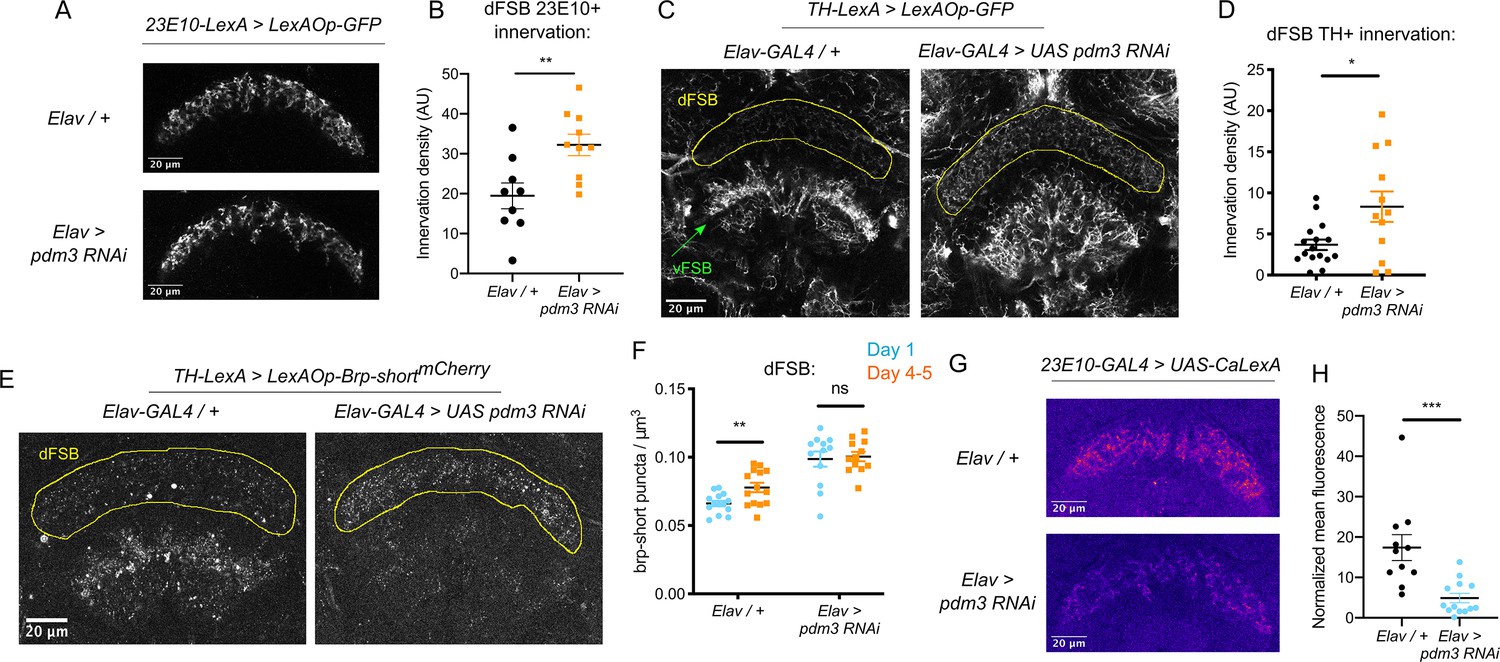
Loss of PDM3 increases inhibitory DA input to the sleep-promoting dFSB.
(A) Projections of 23E10+ dFSB neurons in controls (top) and pdm3 RNAi (bottom). (B) Innervation density of 23E10+ neurites in the adult dFSB (n = 9 controls, 10 pdm3 RNAi). (C) TH+ projections to the FSB in controls (left) and pdm3 RNAi (right). (D) Innervation density of TH+ neurites in the adult dFSB (n = 16 controls, 12 pdm3 RNAi). (E) Labeling of TH+ pre-synaptic sites in the FSB with Brp-shortmCherry. (F) TH+ synapse density in the dFSB in controls (left) and pdm3 RNAi (right) at day 1 and day 4–5 (n = 14, 14, 12, 12 left to right). (G) Pseudocolored CaLexA signal in 23E10+ neurons in day one controls (top) versus pdm3 RNAi (bottom), quantified in (H) (n = 11 controls, 13 pdm3 RNAi). ****p<0.0001, ***p<0.001, **p<0.01, *p<0.05; unpaired two-tailed Student’s t test plus Welch’s correction (B,D,H), multiple Student’s t tests with Holm-Sidak correction, alpha = 0.05 (F).
We next wanted to determine whether the increased density of DA-dFSB neurites reflects more pre-synaptic sites, as these projections may not actually form synapses. We expressed a fluorescently tagged form of the pre-synaptic active zone protein, Bruchpilot (Brp-shortmCherry) (Fouquet et al., 2009; Wagh et al., 2006) specifically in TH+ neurons (Figure 4E; Figure 4—figure supplement 1B). In control flies, the density of DA synapses to the dFSB increased as flies matured (Figure 4F). Thus, DA inputs to the dFSB are both more active (Kayser et al., 2014) and more numerous in mature flies. By contrast, in a young fly lacking pdm3, the number of DA synapses to the dFSB was elevated (Figure 4F), and ontogenetic changes were abolished (Figure 4F). In the vFSB, pdm3 knockdown led to a reduction in TH+ synapses at both ages, and ontogenetic change in synapse number was still preserved (Figure 4—figure supplement 1C). Thus, with pdm3 knockdown, we observed a particular disruption to developmentally regulated synapse addition in the dFSB but not vFSB. The number of 23E10+ and TH+ neurons projecting to the FSB was unchanged with pdm3 knockdown when compared to controls, indicating that pdm3 does not affect early cell fate decisions in this circuit (Figure 4—figure supplement 1D-F). Together, these data suggest that a premature increase in DA synapses to the dFSB underlies loss of behavioral sleep ontogeny.
Reducing dopaminergic signaling in the dFSB rescues sleep ontogenetic change
We hypothesized that with pdm3 knockdown, greater DA synaptic input increases inhibition of 23E10+ dFSB neurons, preventing high dFSB activity normally seen in young flies. To measure 23E10+ neuron activity, we used the CaLexA (Calcium-dependent nuclear import of LexA) system (Masuyama et al., 2012), which relies on activity-dependent nuclear import of a chimeric transcription factor to drive GFP expression. We generated pdm3 RNAi in the QUAS system for compatibility with CaLexA reagents (Figure 4—figure supplement 2), and found pdm3 knockdown led to a decrease in the 23E10+ dFSB CaLexA signal in day one flies (Figure 4G,H). Thus, increased TH+ innervation of the dFSB reduces activity of 23E10+ sleep-promoting neurons in young flies.
If DA-driven inhibition of 23E10+ neurons underlies the lack of sleep ontogenetic change with pdm3 knockdown, blocking DA signal transmission should rescue sleep ontogeny. DA signaling promotes wake by inhibiting sleep-promoting 23E10+ neurons via two D1-like receptors, Dop1R1 and Dop1R2 (Liu et al., 2012; Pimentel et al., 2016; Ueno et al., 2012). We knocked down pdm3 pan-neuronally in a Dop1R1 and Dop1R2 double null mutant background (hereafter referred to as Dop1R1/R2 -/-)(Keleman et al., 2012). Dop1R1/R2 -/- mutants exhibited increased sleep amounts overall and retained normal sleep ontogenetic change (Figure 5A, genotypes i and ii). In keeping with the reported haplosufficiency of this mutant, knockdown of pdm3 in a Dop1R1/R2 +/- background mimicked knockdown in an otherwise wild-type background, showing loss of sleep ontogenetic change (Figure 5A,iii). However, complete loss of these receptors (Dop1R1/R2 -/-) rescued sleep ontogeny in the setting of pdm3 knockdown (Figure 5A, iv).
Figure 5 with 1 supplement see all
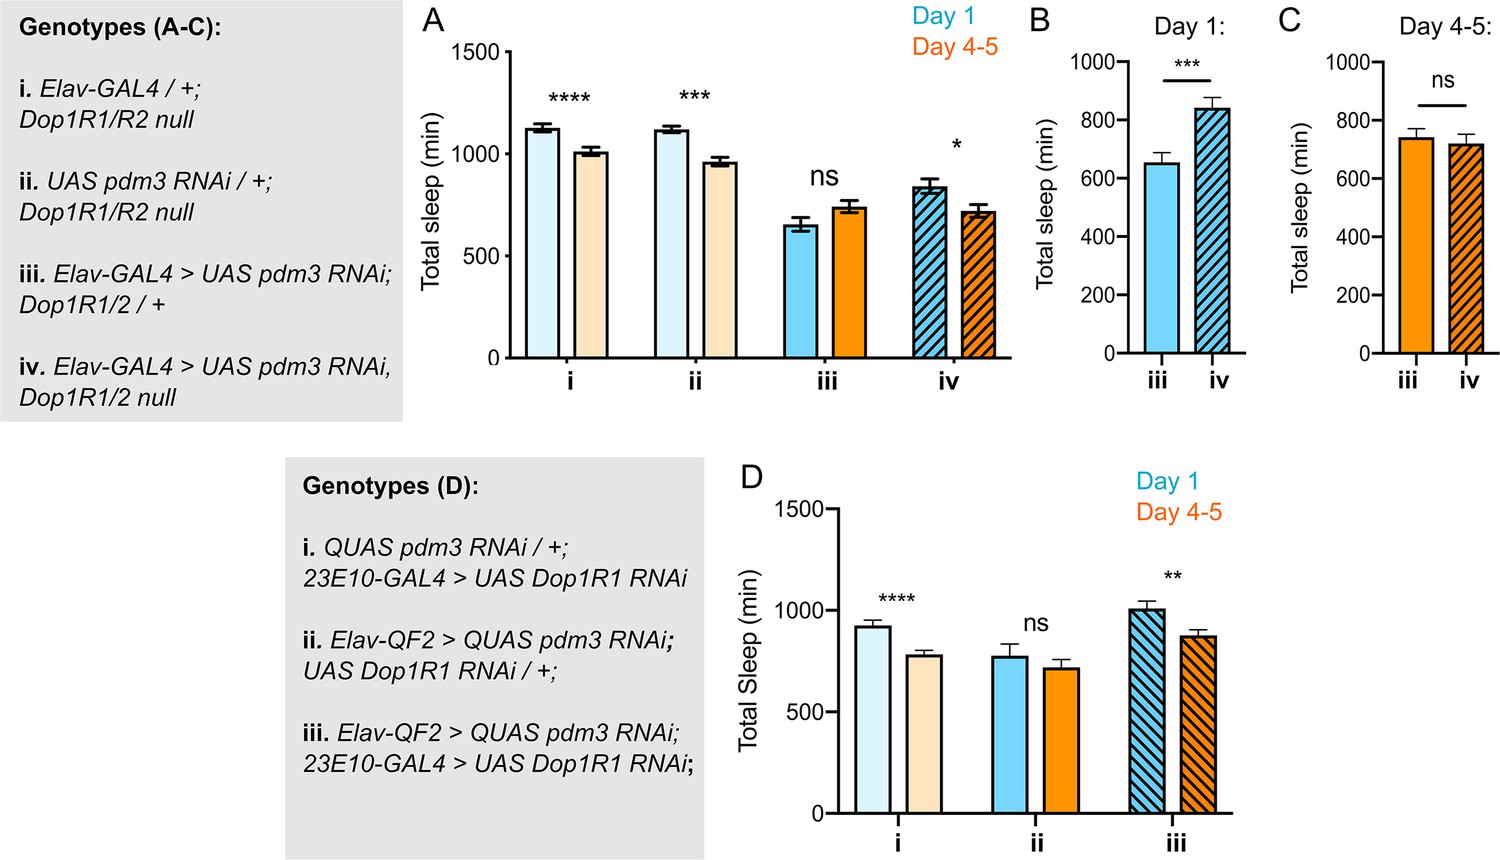
Reducing Dop1R1 signaling restores normal sleep ontogenetic change.
(A) Dop1R1/R2-/- with pdm3 RNAi and controls (n = 55, 92, 72, 96, 58, 97, 45, 75 left to right). Comparison of total sleep amount in Elav-pdm3 RNAi with and without Dop1R1/R2 null mutation in day 1 (B) and day 4–5 (C). (D) Dop1R1 knockdown in 23E10+ neurons in the setting of pan-neuronal pdm3 RNAi and controls (n = 39, 46, 17, 25, 33, 50 left to right). ****p<0.0001, ***p<0.001, **p<0.01, *p<0.05; multiple Student’s t tests with Holm-Sidak correction, alpha = 0.05 (A, D), unpaired two-tailed Student’s t test plus Welch’s correction (B,C).
The Dop1R1/R2 -/- mutant did not rescue sleep fragmentation, day-night sleep redistribution, or circadian arrhythmicity, demonstrating again that these phenotypes are mechanistically independent from loss of sleep ontogenetic change with pdm3 knockdown (Figure 5—figure supplement 1A-C). Further, comparison of sleep amounts at each age in the setting of pdm3 knockdown showed that Dop1R1/2 -/- specifically increases sleep in young flies (Figure 5B), but does not alter mature sleep amounts (Figure 5C). Thus, loss of the two dFSB DA receptors, Dop1R1 and Dop1R2, specifically restores sleep ontogenetic change in a manner dissociable from other pdm3-related sleep behaviors.
Lastly, to test the prediction that the loss of sleep ontogeny stems from heightened DA signaling specifically through the dFSB, we knocked down Dop1R1 using 23E10-GAL4 in the setting of pdm3 RNAi. Indeed, reduction of dopaminergic influence in the dFSB rescued sleep ontogenetic change (Figure 5D) but, like the null mutant, did not affect sleep architecture (Figure 5—figure supplement 1D). Together, these results indicate that a developmental wiring error in flies lacking PDM3 prematurely increases wake-promoting DA-dFSB signaling in young adult flies, abolishing juvenile sleep.
Pdm3 acts in primordial central complex neurons to influence TH+ dFSB innervation
We next sought to determine which cell population pdm3 acts in to control sleep ontogeny, and how this wiring error occurs. Pdm3 could either act in pre-synaptic TH+ cells or in CCX neurons that are targeted by TH+ inputs. Knockdown of pdm3 using TH-GAL4, which targets the majority of DA neurons and is expressed in the CCX-projecting DA neurons during pupal development (Hartenstein et al., 2017), did not affect sleep ontogeny (Figure 6A). Pdm3 knockdown using 23E10-GAL4 also did not affect sleep ontogeny (Figure 6A); however, during the mid-pupal stage when pdm3 is acting, 23E10-GAL4 is not expressed in neurons that project to the FSB (Figure 6—figure supplement 1). To address whether pdm3 acts in neurons that are targets of TH+ inputs, we needed to test GAL4 drivers that express in CCX neurons at the mid-pupal developmental stage. We reasoned that at least some adult-defined drivers might have similar expression patterns in the pupal brain, and screened a subset of GAL4 lines with adult CCX expression from the FlyLight collection (Figure 6B; Figure 6—figure supplement 2A; Jenett et al., 2012). We identified one driver, R93F07-GAL4, which produced a loss of sleep ontogenetic change (Figure 6B,C) and was expressed in the CCX during pupal development. During the mid-pupal stage, R93F07-GAL4 targets both the primordial FSB and ellipsoid body (Figure 6D). These R93F07+ neurons are not TH+ (Figure 6—figure supplement 2B), further supporting the idea that pdm3 is not acting in TH+ neurons themselves. Importantly, knockdown of pdm3 using other developmentally expressed sleep/circadian drivers did not affect sleep ontogeny (Figure 6A). Additionally, glial-specific knockdown did not affect sleep ontogeny, confirming that our phenotype stems from loss of PDM3 in neurons (Figure 6A). Thus, pdm3 appears to act in primordial CCX target neurons to coordinate DA innervation of the dFSB. To test this directly, we knocked down pdm3 using R93F07-GAL4 and measured TH+ innervation density in the dFSB. Indeed, restricting pdm3 knockdown to TH-, R93F07+ CCX neurons increased the density of DA innervation in the dFSB (Figure 6E), confirming that pdm3 acts in CCX target neurons to control DA innervation of this region.
Figure 6 with 2 supplements see all
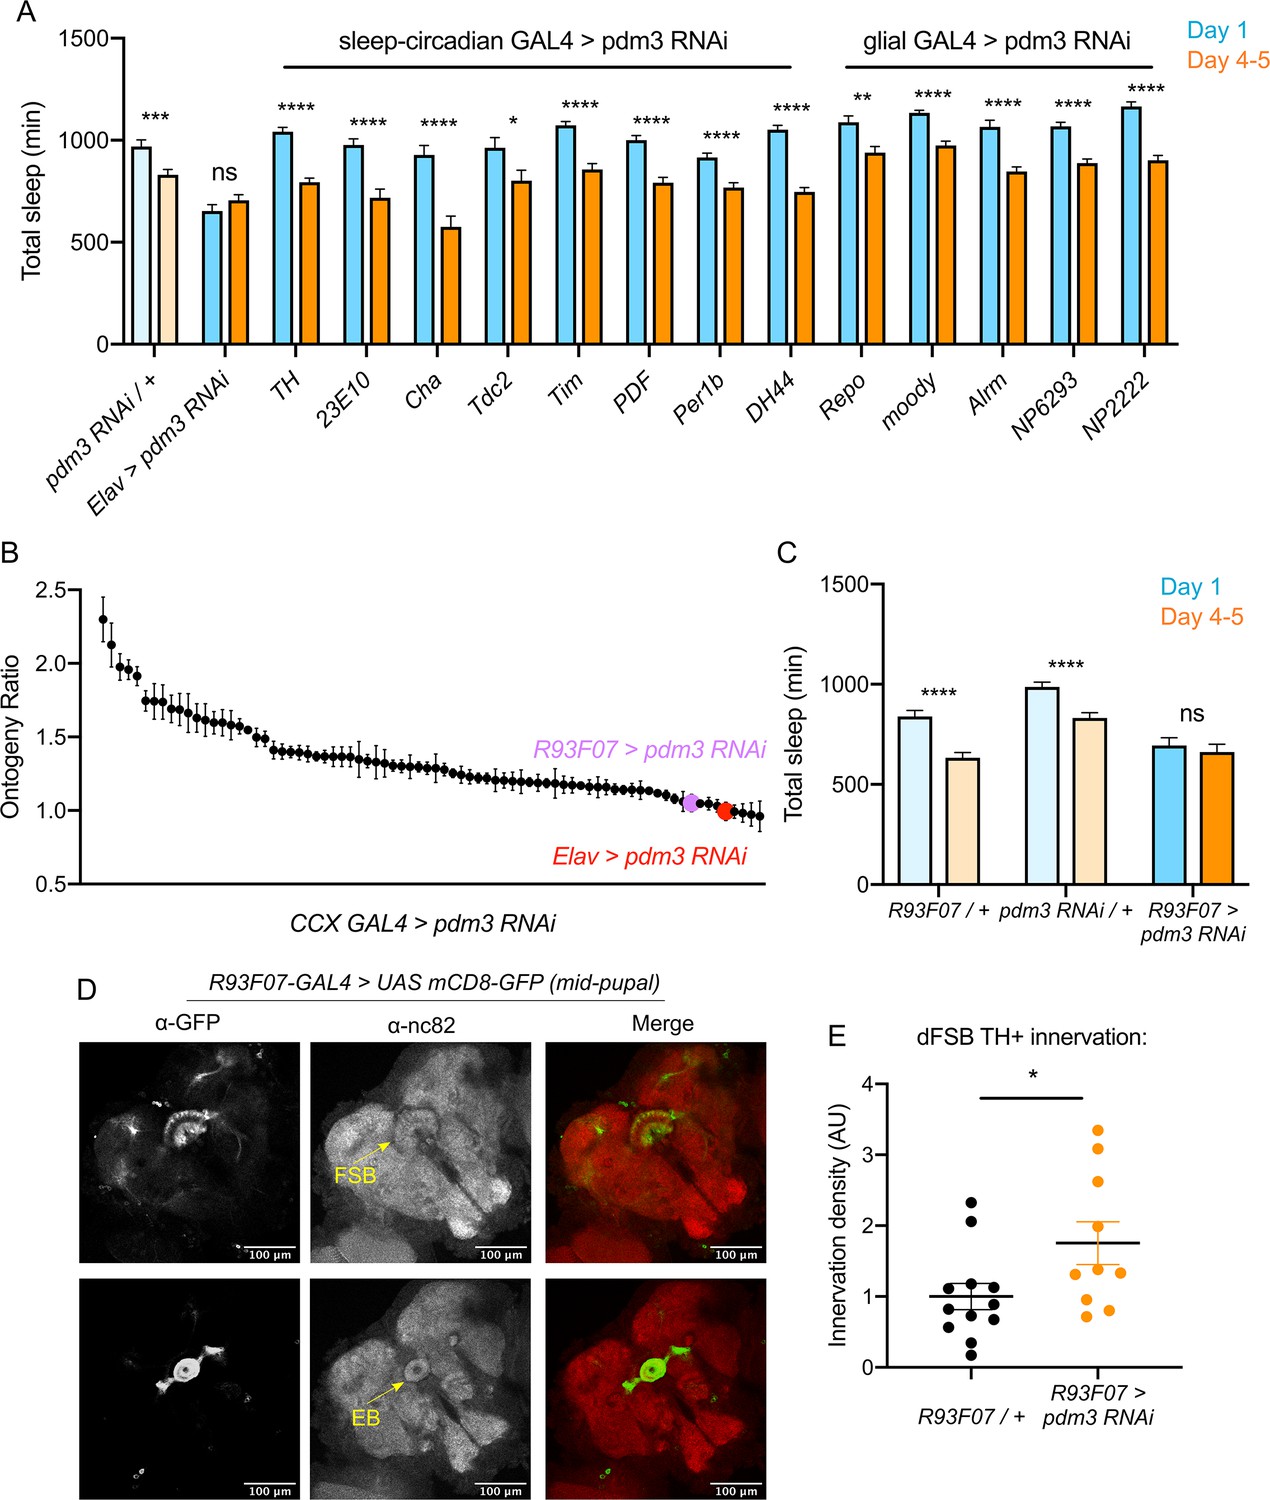
Pdm3 acts in R93F07+ CCX target cells to control sleep ontogeny.
(A) Total sleep time: pdm3 knockdown with spatially restricted GAL4 drivers with expression in sleep/circadian circuitry or glial expression (n ≥ 8 per genotype/age). (B) Spatial mapping screen of FlyLight GAL4 lines with adult CCX expression patterns (n ≥ 8 per genotype/age). (C) Total sleep time in R93F07-GAL4 > UAS pdm3 RNAi versus controls (n = 41, 32, 40, 40, 40, 40 left to right). (D) At the mid-pupal stage, R93F07-GAL4 is expressed in the FSB (top) as well as the ellipsoid body (EB, bottom). (E) Innervation density of TH+ neurites in the adult dFSB (labeled by TH-LexA >LexAOp GFP) with R93F07-GAL4 driving pdm3 RNAi (n = 12 controls, 10 pdm3 RNAi). ****p<0.0001, ***p<0.001, **p<0.01, *p<0.05; multiple Student’s t tests with Holm-Sidak correction, alpha = 0.05 (A, C), unpaired two-tailed Student’s t test plus Welch’s correction (E).
How does DA innervation of the dFSB go awry during development? Little is known about when and how DA inputs normally integrate into CCX circuitry. To characterize this process, we tracked the ingrowth of TH+ neurites to the FSB during pupation. In controls at 24 hr after puparium formation (APF), TH+ neurites were rarely observed in the dFSB, but we observed an early phase of TH+ innervation in the vFSB (Figure 7A, upper left and Figure 7B/C, left). By 48 hr APF, DA innervation in both the dFSB and vFSB closely resembled the adult brain (Figure 7A, lower left). By contrast, pdm3 knockdown led to a striking increase in TH+ innervation of the dFSB at 24 hr APF, while vFSB innervation proceeded unchanged (Figure 7A, upper right and Figure 7B/C, right). As with controls, TH+ innervation in the dFSB and vFSB with pdm3 knockdown resembled adult brains at 48 hr APF (Figure 7A, lower right). Thus, TH+ neurites normally innervate the vFSB first, and by 48 hr APF, layered TH+ innervation of the entire FSB appears largely complete. Loss of PDM3 leads to early ingrowth of TH+ neurites to the dFSB, likely increasing the amount of dFSB TH+ innervation in the adult brain.
Figure 7
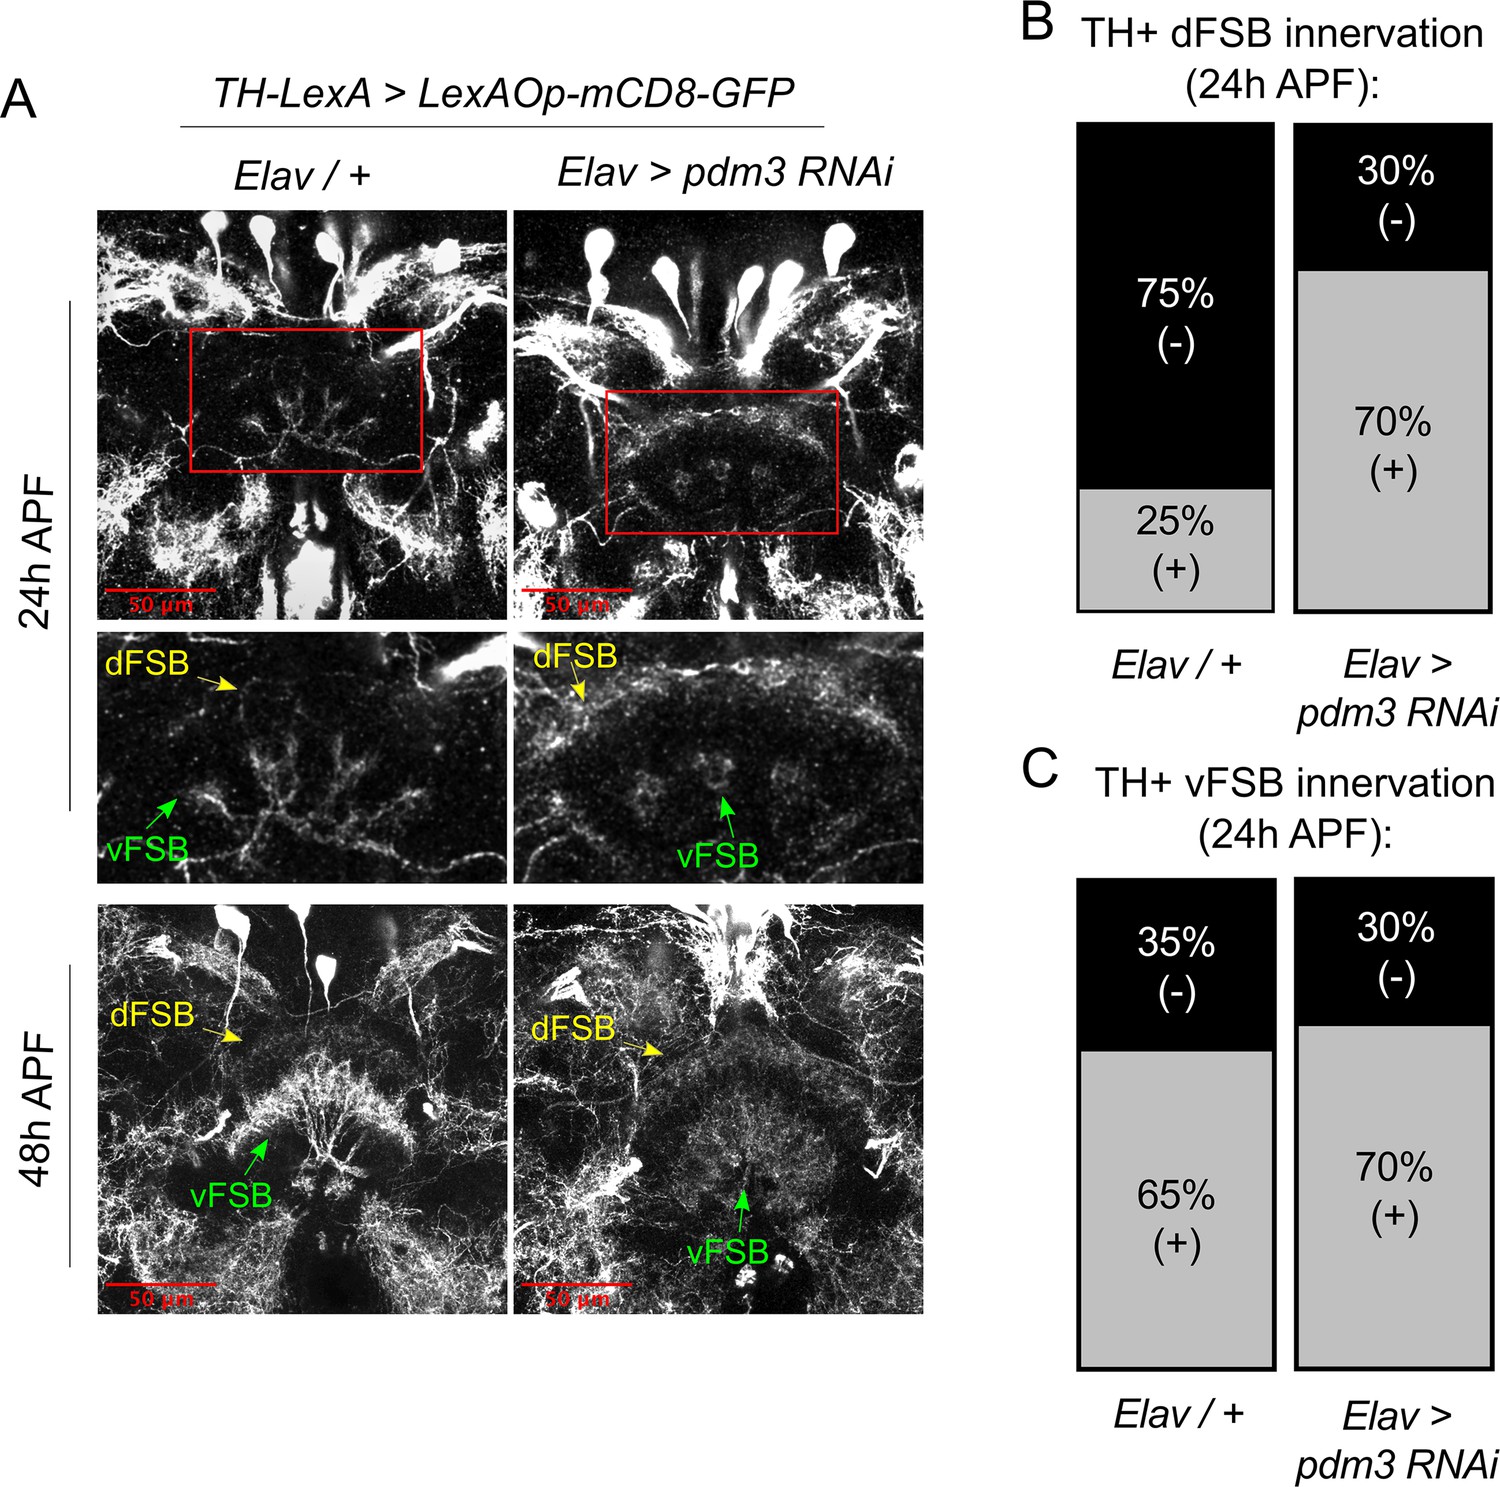
Pdm3 controls TH+ dFSB innervation during pupation.
(A) TH+ innervation in the FSB at 24 hr after puparium formation (APF) (top) and 48 hr APF (bottom). (B,C) Percentage of brains with TH+ innervation in the dFSB (B) or vFSB (C) at 24 hr APF (gray = positive for innervation, black = negative; n = 10 controls, 10 pdm3 RNAi).
Pdm3 regulates the synaptic gene, Msp300, to control sleep ontogeny
How does pdm3 coordinate appropriate DA innervation of the dFSB at the molecular level? Pdm3 binds to a TAAT Hox motif 2–3 base pairs upstream of a POU motif (TGCAA/T) (Andersen and Rosenfeld, 2001; Jafari and Alenius, 2015). Transcriptional targets of pdm3 remain largely uncharacterized (Jafari and Alenius, 2015; Tichy et al., 2008). To determine which genes affect sleep ontogeny downstream of pdm3, we performed RNA-Seq analysis of central brains in pdm3 knockdown and controls at the mid-pupal stage (Figure 8A, n = 4 biological replicates). Staining of pupal brains confirmed pdm3 knockdown (Figure 8—figure supplement 1). Differential gene expression analysis revealed 35 genes that were downregulated with pdm3 knockdown and 54 genes that were upregulated (p-adj <0.05, Fold Change > 1.2; Supplementary file 1; Figure 8B). Interestingly, some of the most significant changes in expression occurred in genes known to facilitate synapse formation and plasticity, such as Arc1 and Msp300 (Figure 8B; Ashley et al., 2018; Morel et al., 2014; Packard et al., 2015). Since loss of pdm3 results in excessive DA synaptic ingrowth in the dFSB, we hypothesized that pdm3 may regulate synapse dynamics by directing expression of some of these genes in particular.
Figure 8 with 3 supplements see all
Pdm3 controls expression of the synaptic gene Msp300 to regulate sleep ontogeny.
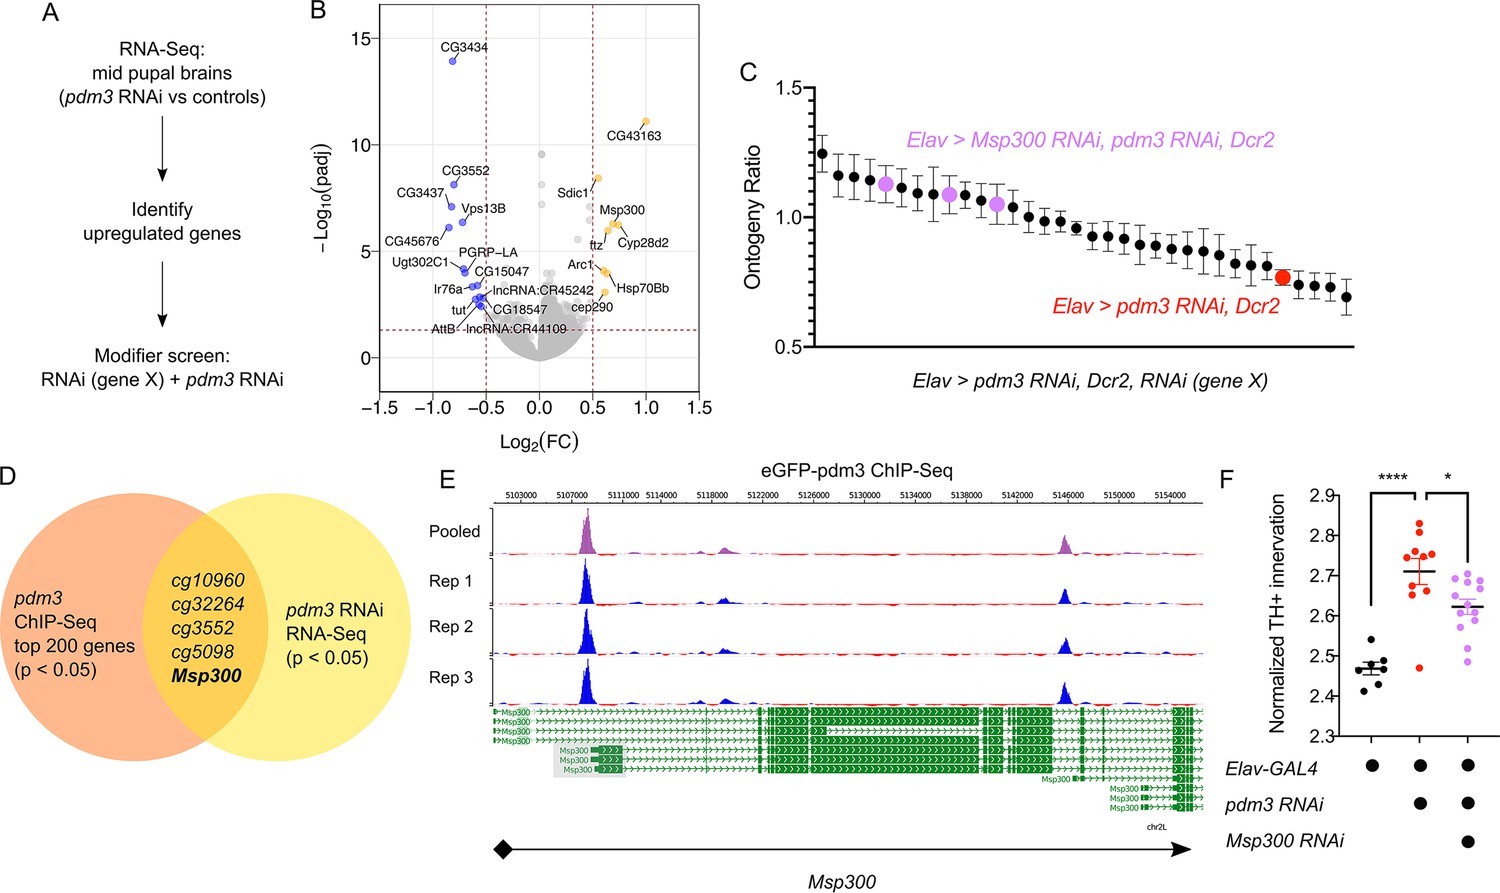
(A) Scheme of RNA-Seq and subsequent modifier screen. (B) Volcano plot of RNA-Seq data highlighting significant changes in gene expression with pdm3 knockdown compared to controls in mid-pupal brains. Labeled genes have −log10(padj) >1.3 and absolute value of log2(Fold Change)>0.5. Yellow = increased expression, blue = decreased expression upon pdm3 knockdown (n = 4 biological replicates per genotype, 40 brains per replicate for RNA-Seq). (C) Modifier screen with co-expression of RNAi targeting upregulated genes from RNA-Seq alongside pdm3 RNAi (n ≥ 16 per genotype/age). (D) Overlap of hits from RNA-Seq and pdm3 ENCODE ChIP-Seq experiments. (E) Control-normalized peaks of PDM3 binding within the Msp300 gene. The strongest binding peak occurs upstream of the first exon in the RD, RL and RB transcript isoforms (shaded gray box). (F) Quantification of TH+ staining in the dFSB with Msp300 RNAi and pdm3 RNAi (n = 7, 10, 13 left to right). RNA-Seq statistical analysis is detailed in Materials and methods. ****p<0.0001, *p<0.05; ANOVA with Tukey’s test (F).
To identify transcriptional changes relevant to the loss of sleep ontogeny, we performed a modifier RNAi screen (Figure 8A). We focused specifically on the top genes that were upregulated, and combined RNAi against these genes with pdm3 RNAi to test if reducing their levels rescued the sleep ontogeny phenotype. Expression of pdm3 RNAi along with UAS-Dcr2 (to facilitate knockdown of other genes) resulted in a more drastic sleep ontogeny phenotype, with young flies sleeping less than mature flies and an ontogeny ratio below 1.0 (Figure 8C; Figure 8—figure supplement 2A). Co-expression of most RNAi lines did not result in a significant rescue of sleep ontogeny (Figure 8C). However, in the setting of pdm3 RNAi, knockdown of Msp300 using three independent RNAi lines suppressed the pdm3 sleep ontogeny phenotype (Figure 8C; Figure 8—figure supplement 2A,B) without affecting PDM3 knockdown level (Figure 8—figure supplement 2C). Expression of Msp300 RNAi alone had no effect on baseline sleep or sleep ontogeny, nor did UAS-Dcr2 itself (Figure 8—figure supplement 2D).
To determine whether PDM3 directly binds and regulates Msp300, we took advantage of a pre-existing ChIP-Seq dataset available at the ENCODE database (www.encodeproject.org) (Davis et al., 2018). ChIP-Seq for pdm3 was performed at the pre-pupal stage, close the critical time window for pdm3 regulation of sleep ontogeny. Comparison of the top 200 genes by p-value and signal strength in this dataset to differentially expressed genes from our RNA-Seq data showed Msp300 is one of five genes present in both datasets (Figure 8D). Visualization of Msp300-associated peaks revealed a strong binding peak across all replicates located approximately 400 bp upstream from the transcription start site in the putative Msp300 promoter region of three Msp300 isoforms, as well as an intronic peak (Figure 8E). Our RNA-Seq analysis with pdm3 knockdown demonstrated increased reads across exons specific to the Msp300-RD, RL and RB isoforms compared to control, immediately downstream of the strongest binding peak (Figure 8E; Figure 8—figure supplement 3A, shaded boxes), suggesting that pdm3 may regulate these Msp300 isoforms. Thus, the observed changes in Msp300 mRNA level with pdm3 knockdown are likely due to direct transcriptional regulation.
Finally, in the setting of pdm3 RNAi, we tested whether Msp300 knockdown also rescued excessive TH+ dFSB innervation. Indeed, TH+ dFSB innervation with pdm3 knockdown was significantly reduced upon co-expression of Msp300 RNAi (Figure 8F), further supporting the idea that exaggerated TH+ input to the dFSB drives the loss of sleep ontogeny. Our model predicts that pdm3 and Msp300 act within the same population of CCX target neurons defined by R93F07-GAL4. To test this idea directly, we knocked down PDM3 expression pan-neuronally while expressing Msp300 RNAi with R93F07-GAL4. Surprisingly, this manipulation did not suppress the pdm3-related sleep ontogeny phenotype (Figure 8—figure supplement 3B), suggesting a more complex interaction between pdm3 and its downstream transcriptional targets. Regardless, these results indicate pdm3 acts through suppression of Msp300 levels during pupal development to control wiring of sleep ontogeny circuitry.
Discussion
Despite a long-standing appreciation for the importance of early life sleep in brain development, its regulation at the molecular level has thus far been unknown. We have identified the transcription factor, pdm3, as a genetic regulator of sleep ontogeny. Pdm3 acts during early development to coordinate synapse formation in a sleep ontogeny circuit, enabling the brain to later execute high levels of sleep. These findings provide novel insight into how a central component of Drosophila sleep circuitry is wired, and how disruption of this process impinges on sleep behavior.
At the circuit level, pdm3 knockdown leads to premature and exaggerated DA input to the dFSB, inhibiting sleep output neurons. Rather than acting in TH+ neurons themselves, pdm3 functions within CCX neurons (labeled by R93F07-GAL4) to pattern DA inputs in this region. CCX intrinsic neurons form rudimentary projections to the FSB neuropil during larval development (Riebli et al., 2013), prior to DA innervation, supporting the idea that DA inputs are directed by pre-existing CCX targets. How does early entrance of TH+ neurites into dFSB territory lead to the eventual increase in innervation in the adult brain? We propose that pdm3 restricts the timing of a developmental window during which target-derived cues facilitate the guidance and stabilization of TH+ processes in the dFSB. Upon PDM3 reduction, this window opens early, allowing more time for innervation and an increase in TH+ synapse number. Our data suggest pdm3 controls development of this circuit and behavioral sleep ontogeny via repression of Msp300. Msp300, also known as dNesprin-1, is a cytoskeleton-associated protein that facilitates delivery of mRNAs to promote synapse maturation (Morel et al., 2014; Packard et al., 2015). As such, an increase in Msp300 may result in exaggerated or inappropriately-timed delivery of synaptic mRNAs and exuberant synaptogenesis. Restriction of Msp300 knockdown to R93F07+ cells failed to rescue the loss of sleep ontogeny observed with pan-neuronal PDM3 depletion. This result raises the possibility of mixed cell-autonomous and non-cell-autonomous interactions between these molecules in coordinating DA innervation of the CCX, and/or a role for other PDM3 transcriptional targets. Future studies will further delineate how pdm3 coordinates expression of Msp300 and other synaptic genes to orchestrate development of this sleep circuit.
POU family proteins have highly conserved roles in nervous system patterning across species. In mammals, POU proteins have been linked to neurodevelopmental diseases that often have comorbid sleep abnormalities (Kotagal, 2015; Robinson-Shelton and Malow, 2016) hinting at potential early life sleep-regulatory roles. In particular, the human homolog of pdm3, POU6F2, has been associated with subtypes of autism spectrum disorder (ASD) (Anney et al., 2010). Additionally, disrupted function of the Brn-2 gene (also known as POU3F2) is associated with ASD in humans and ASD-like social deficits in mice (Belinson et al., 2016; Marchetto et al., 2017; Salyakina et al., 2011). Developmental sleep abnormalities could thus contribute to behavioral pathology seen with these lesions.
Given the cross-species conservation and importance of sleep ontogeny for brain development, there are likely to be additional genes that control this behavior. In particular, there may be molecules that actively regulate sleep in young flies or genetic lesions that result in a persistent juvenile sleep state. Notably, the developmental role of pdm3 stands in contrast to most other known Drosophila sleep genes (Chakravarti et al., 2017; Dubowy and Sehgal, 2017) and suggests the existence of an entirely separate class of ‘sleep genes’ that orchestrate establishment of sleep circuits. This idea raises the intriguing possibility that primary sleep disorders such as insomnia or hypersomnia may have neurodevelopmental origins. The identification of genes and circuits regulating sleep ontogeny thus deepens our understanding of how sleep matures and its age-specific functions for the nervous system.
Materials and methods
Fly stocks
Request a detailed protocol
Key resources table
| Reagent type (species) or resource | Designation | Source or reference | Identifiers | Additional information |
|---|---|---|---|---|
| Gene Drosophila melanogaster | pdm3 | FBgn0261588 | ||
| Gene Drosophila melanogaster | Msp300 | FBgn0261836 | ||
| Genetic reagent (D. melanogaster) | hs-hid; Elav-GAL4; UAS Dcr2 | Dragana Rogulja | ||
| Genetic reagent (D. melanogaster) | UAS-pdm3 RNAi | BloomingtonDrosophilaStock Center | BSC #53887, TRiP HMJ21205 | |
| Genetic reagent (D. melanogaster) | UAS-pdm3 RNAi | ViennaDrosophilaResource Center | VDRC #30538, Construct ID 4312 | |
| Genetic reagent (D. melanogaster) | ElavC155-GAL4 | Amita Sehgal | ||
| Genetic reagent (D. melanogaster) | UAS-mCD8-GFP | BloomingtonDrosophilaStock Center | ||
| Genetic reagent (D. melanogaster) | UAS-pdm3-short | John Carlson | ||
| Genetic reagent (D. melanogaster) | tubGAL80-ts | BloomingtonDrosophilaStock Center | BSC #7017 | |
| Genetic reagent (D. melanogaster) | R23E10-LexA | BloomingtonDrosophilaStock Center | BSC #52693 | |
| Genetic reagent (D. melanogaster) | TH-LexA | Ronald Davis | ||
| Genetic reagent (D. melanogaster) | LexAOp-GFP | BloomingtonDrosophilaStock Center | BSC #32203 | |
| Genetic reagent (D. melanogaster) | LexAOp-Brp-short-mCherry | Takashi Suzuki | ||
| Genetic reagent (D. melanogaster) | 23E10-GAL4 | BloomingtonDrosophilaStock Center | BSC #49032 | |
| Genetic reagent (D. melanogaster) | UAS-CaLexA | J. Wang | ||
| Genetic reagent (D. melanogaster) | ElavC155-QF2 | BloomingtonDrosophilaStock Center | BSC #66466 | |
| Genetic reagent (D. melanogaster) | QUAS-pdm3 RNAi | This study | Figure 4—figure supplement 2; available upon request | |
| Genetic reagent (D. melanogaster) | Dop1R1[attp] | Krystyna Keleman | ||
| Genetic reagent (D. melanogaster) | UAS-Dcr2 | BloomingtonDrosophilaStock Center | BSC #24651 | |
| Genetic reagent (D. melanogaster) | UAS-Msp300 RNAi | ViennaDrosophilaResource Center | VDRC #105694 | |
| Genetic reagent (D. melanogaster) | UAS-Msp300 RNAi | ViennaDrosophilaResource Center | VDRC #109023 | |
| Genetic reagent (D. melanogaster) | UAS-Msp300 RNAi | ViennaDrosophilaResource Center | VDRC #107183 | |
| Antibody | anti-PDM3 (Guinea pig polyclonal) | Cheng-Ting Chien | 1:500 | |
| Antibody | anti-GFP (Mouse monoclonal) | Sigma | Cat# G6539-200UL | 1:500 |
| Antibody | anti-GFP (Rabbit polyclonal) | Fisher | Cat# A11122 | 1:500 |
| Antibody | anti-PER (Guinea pig polyclonal) | Amita Sehgal | 1:1000 | |
| Antibody | anti-PDF C7 (Mouse monoclonal) | Developmental Studies Hybridoma Bank | 1:500 | |
| Antibody | anti-nc82 (Brp) (Mouse monoclonal) | Developmental Studies Hybridoma Bank | 1:100 | |
| Antibody | Alexa Fluor 488 Donkey anti-Rabbit | Thermo Fisher | 1:1000 | |
| Antibody | Alexa Fluor 555 Donkey anti-GP | Thermo Fisher | 1:1000 | |
| Antibody | Alexa Fluor 488 Donkey anti-Mouse | Thermo Fisher | 1:1000 | |
| Antibody | Alexa Fluor 647 Donkey anti-Mouse | Thermo Fisher | 1:1000 | |
| Recombinant DNA reagent | QUAS-WALIUM20 (vector) | Jonathan Zirin, Fly Transgenic RNAi Project | ||
| Sequence-based reagent | HMJ21205 pdm3 RNAi hairpin | Synthesized in this study, sequence from TRiP database | ||
| Restriction enzyme | NheI | New England Biolabs | Cat. #: R3131S | |
| Restriction enzyme | EcoRI | New England Biolabs | Cat # R3101L | |
| Commercial assay or kit | Plasmid Midi Kit | Qiagen | Cat # 12143 | |
| Software, algorithm | Prism 8 | Prism |
Sleep assays
Request a detailed protocolFlies were raised and maintained in bottles on cornmeal molasses food obtained from Lab Express (Fly Food R, recipe available at http://lab-express.com/DIS58.pdf) at 25°C on a 12 hr:12 hr LD cycle. For all ontogeny experiments unless otherwise noted, day one females (young adults) were compared to day 4–5 females (mature adults) of the same genotype. For day 4–5 flies, newly eclosed females were collected and aged in group housing on standard food at 25 degrees on a 12 hr:12 hr LD cycle, and flipped onto new food every 3–4 days. For experiments with young flies, newly eclosed females were group housed until loading into the sleep experiment. Flies were anesthetized on CO2 pads (Genesee Scientific Cat #59–114) and loaded into individual glass tubes (containing 5% sucrose and 2% agar) for monitoring locomotor activity in the Drosophila Activity Monitoring (DAM) system (Trikinetics, Waltham MA). All sleep experiments were loaded between ZT5-ZT7, and data collection began at ZT0 the following day (at least 16 hr after CO2 exposure). Activity was measured in 1 min bins and sleep was identified as 5 min of consolidated inactivity (Hendricks et al., 2000; Shaw et al., 2000). Data was processed using PySolo (Gilestro and Cirelli, 2009).
Ontogeny screen
Request a detailed protocolFor the sleep ontogeny primary and secondary screens, the hs-hid; Elav-GAL4, UAS Dcr2 (hEGD) fly stock was crossed to each RNAi line from the TRiP, GD and KK collections. We screened genes with neuronal expression (www.flybase.org, 1067 genes). For each gene, we screened one RNAi line from the Transgenic RNAi Project (TRiP) collection (Ni et al., 2009). Control lines for the primary screen were hEGD x TRiP library landing site host strains: P{y[+t7.7]=CaryP}attP2 (Chr3, BSC #36303) or P{y[+t7.7]=CaryP}attP40 (Chr2, BSC #36304). Controls for the secondary screen were hEGD x Landing site VIE-260B KK library host strain (VDRC #60100) and GD library host strain (VDRC #60000). Day one females were loaded alongside day 4–5 females of the same genotype. Since young flies typically sleep about twice as much during the day compared to mature flies (Kayser et al., 2014), we focused on daytime sleep for our screen. An ‘ontogeny ratio’ (OR) for each genotype was quantified as follows: (minutes of daytime sleep in day 1) / (minutes of daytime sleep in day 4–5). Most wild-type flies, including our genetic controls, had a ratio in between 1.5 and 2.0 (Figure 1B). A lack of ontogenetic change would correspond to a ratio of 1.0, and a ratio below 1.0 indicates that young flies are sleeping less than mature flies. We thus set a ratio of 1.2 and below as our cutoff for defining hits.
Circadian experiments
Request a detailed protocolFlies were entrained to a 12:12 LD cycle for 3 days and then transferred to constant darkness (DD). Locomotor activity during days 1–7 in DD was analyzed with Clocklab software (Actimetrics, Wilmette, IL). Fast Fourier transform (FFT) values were calculated for all genotypes.
Courtship assays
Request a detailed protocolVirgin male flies were collected within 4 hr after eclosion and kept in isolation on regular food until being used in courtship experiments. Female Canton-S virgins (3–7 days post eclosion) were used in all courtship assays. A male and female were gently aspirated into a well-lit porcelain mating chamber (25 mm diameter and 10 mm depth) covered with a glass slide. Experiments were done in a temperature and humidity-controlled room at 25°C, 40–50% humidity. Courtship index (CI) was determined as the percentage of total amount of time a male was engaged in courtship activity during a period of 10 min or until successful copulation (Siegel and Hall, 1979). Courtship assays were recorded using a video camera (Sony HDR-CX405) and scored blind to experimental condition.
TARGET system experiments
Request a detailed protocolFor the temporal mapping experiments using the TARGET system, flies were reared at 19°C (restrictive temperature) to prevent GAL80 denaturation, resulting in suppression of RNAi expression. For temporal windows during which pdm3 knockdown was desired, flies were kept at 28°C (permissive temperature). Because of temperature-related changes inDrosophiladevelopmental timing, flies were staged visually based on prior descriptions of developmental stages. Genetic controls were reared alongside experimental flies to control for temperature effects on development. All sleep experiments were conducted at 22°C in 12:12 LD cycles.
Immunohistochemistry
Request a detailed protocolFly brains were dissected in 1X PBS, fixed in 4% PFA for 20 min at room temperature, and cleaned of remaining tissue in 1X PBS with 0.1% Triton-X 100 (PBS-T). Following 3 × 10 min washes in PBS-T, brains were incubated with primary antibody at 4°C overnight. Following 3 × 10 min washes in PBS-T, brains were incubated with secondary antibody for 2 hr at room temperature. After 3 × 10 min washes in PBST, brains were cleared in 50–70% glycerol and mounted in Vectashield.
Imaging and analysis quantification
Request a detailed protocolBrains were visualized with a TCS SP8 confocal microscope and images processed in NIH Fiji (Schindelin et al., 2012). All settings were kept constant between experimental conditions. Images were taken in 0.5 μM steps unless otherwise specified.
PER quantification
To investigate PER expression in sLNvs, sLNvs were labeled using an anti-PDF antibody and brains were co-stained with anti-PER. Flies were dissected at ZT0, 4, 6, 8, 12, 16 and 20. Area, mean gray value and integrated density of the PER signal was measured for each of the 4 sLNvs per hemisphere, defined by PDF staining. Corrected total cell fluorescence (CTCF) of the cell body was calculated using the formula: CTCFCell = Integrated densityCell – (AreaCell × Mean fluorescenceBackground) (Dusik et al., 2014).
TH+ innervation density
Images were thresholded with the same settings across all images, and the thresholded area of TH+ neurites in the dFSB was measured. dFSB location was defined by use of anti-nc82 as a general anatomical stain. Innervation density was calculated as (area occupied by TH+ neurites)/(area of dFSB).
3D synapse counting (Brp-shortmCherry)
For each Z-slice, the FSB was selected and the surrounding signal was cleared. The full volume of the dFSB or vFSB was measured using the 3D Objects Counter function in Fiji with the settings: threshold = 1 min. puncta size = 1 Brp-shortmCherry puncta were counted using the 3D Objects Counter function with the settings: threshold = 52 min.=2 max.=80.
CaLexA analysis
GFP fluorescence was quantified in a region of interest (ROI) based on single optical sections from whole-mount fly brains; mean GFP signal was normalized to fluorescent signal in an adjacent background ROI.
TH+ immunofluorescence
GFP fluorescence was quantified in a region of interest (ROI) based on single optical sections from whole-mount fly brains; mean GFP signal was normalized to anti-nc82 signal in the same ROI.
RNA-Seq experiments
Dissection/RNA extraction
Request a detailed protocol40 brains per sample at the mid-pupal stage were dissected in cold AHL (108 mM NaCl, 5 mM KCl, 2 mM CaCl2, 8.2 mM MgCl2, 4 mM NaHCO3, 1 mM NaH2PO4-H2O, 5 mM trehalose, 10 mM sucrose, 5 mM HEPES). Four biological replicates (each with 40 brains) were dissected per genotype. Brains were transferred to 1 ml of Trizol and incubated for 5 min at room temperature (RT). 0.2 ml of chloroform was added and samples were inverted. Samples were incubated 2–3 min at RT, then centrifuged at 12000 g for 15 min at 4°C. Genomic DNA was removed using a gDNA eliminator column (RNeasy Plus Micro Kit, Qiagen). RNA was then extracted using the RNeasy MinElute Cleanup Kit (Qiagen).
RNA library preparation and sequencing
Request a detailed protocolSequence libraries for each sample were synthesized using the NEBNext Ultra II Directional RNA kit following supplier recommendations and were sequenced on Illumina HiSeq-4000 sequencer as single-reads of 100 base reads following Illumina’s instructions. The quality of the data was analyzed using fastqc v0.11.8 and multiqc v1.0.dev0.
Differential gene expression analysis
Request a detailed protocolThe sequenced reads were mapped to the Drosophila melanogaster genome assembly dm6 using STAR v2.7.0f (Dobin et al., 2013). STAR was run with the default parameters with the following exceptions: --outFilterMultimapNmax 1 and --twopassMode Basic. The aligned reads were assigned to genes and counted using featureCounts (v1.6.4) run with default options on the dmel-all-r6.27 version of the Drosophila melanogaster annotation. Differential gene expression was performed on the gene count data in R v3.4.2 using DEseq2 v1.22.2 (Love et al., 2014). The annotated genes exhibiting an adjusted-P value <0.05 and |log2FC| > 1.0 were considered differentially expressed compared to control. Visualization of differentially expressed genes was done using the R-package ggplot2 v3.2.0.
Gene set enrichment analysis
Request a detailed protocolGene set collections for Gene Ontology annotations were downloaded from public sources (http://www.go2msig.org/cgi-bin/prebuilt.cgi?taxid=7227). For comparison between the experimental and control groups, a gene signature was generated by ranking all expressed genes according to the DEseq2-derived test statistics. Enrichment analysis was performed with GSEA v3.0 (Subramanian et al., 2005) using weighted statistical analysis.
CHiP-Seq analysis
Request a detailed protocolWe accessed the ENCODE database eGFP-pdm3 CHiP-Seq experiment (ID ENCSR518FUJ, contributed by K. White) and downloaded the ENCFF757XFT.bed file (optimal IDR thresholded peaks) (Davis et al., 2018; ENCODE Project Consortium, 2012). CHiP-Seq protocol and analysis workflow is detailed at the ENCODE website (https://www.encodeproject.org/experiments/ENCSR518FUJ/). Peaks were sorted by 1) p-value and 2) Signal value. Peaks were annotated using the HOMER (Heinz et al., 2010) annotatePeaks function with version dm6 of the Drosophila melanogaster genome.
Generation of QUAS constructs
Request a detailed protocolQUAS-WALIUM20 vector was obtained from J. Zirin at the Fly Transgenic RNAi Project (Perkins et al., 2015). The HMJ21205 pdm3 RNAi hairpin, originally used to generate the UAS-pdm3 RNAi construct (BSC #53887), was cloned into the QUAS-WALIUM20 vector using the pWALIUM20 cloning protocol (available at www.flyrnai.org). Briefly, the following oligonucleotides were synthesized and annealed (21 NT hairpin sequence shown in capital letters): 5’ ctagcagtCAGCAACATTGTGAAGCGAGAtagttatattcaagcataTCTCGCTTCACAATGTTGCTGgcg 3’ and 5’aattcgcCAGCAACATTGTGAAGCGAGAtatgcttgaatataactaTCTCGCTTCACAATGTTGCTGactg-3’. The QUAS-WALIUM20 vector was linearized by NheI and EcoRI, and the DNA fragment containing the hairpin was ligated into the vector. DNA injection was prepared with the Midiprep Kit (Qiagen). Injections were performed by Rainbow Transgenic Flies, Inc for production of transgenic flies at the attP40 and VK00033 landing sites.
Statistical analysis
Request a detailed protocolAll analysis was done in GraphPad (Prism). Individual tests and significance are detailed in figure legends.
Data availability
RNA Sequencing data is available at the NCBI GEO database (GSE147337).
-
NCBI Gene Expression OmnibusID GSE147337. RNA-Seq of whole Drosophila brains (mid-pupal stage) with panneuronal pdm3 knockdown and controls.
References
-
Molecular mechanisms of sleep homeostasis in flies and mammalsCold Spring Harbor Perspectives in Biology 9:a027730.https://doi.org/10.1101/cshperspect.a027730
-
A genome-wide scan for common alleles affecting risk for autismHuman Molecular Genetics 19:4072–4082.https://doi.org/10.1093/hmg/ddq307
-
Developing sensorimotor systems in our sleepCurrent Directions in Psychological Science 24:32–37.https://doi.org/10.1177/0963721414551362
-
Unraveling the neurobiology of sleep and sleep disorders using DrosophilaCurrent Topics in Developmental Biology 121:253–285.https://doi.org/10.1016/bs.ctdb.2016.07.010
-
The POU-domain protein Pdm3 regulates axonal targeting of R neurons in the Drosophila ellipsoid bodyDevelopmental Neurobiology 72:1422–1432.https://doi.org/10.1002/dneu.22003
-
Form and function of sleep spindles across the lifespanNeural Plasticity 2016:1–16.https://doi.org/10.1155/2016/6936381
-
The encyclopedia of DNA elements (ENCODE): data portal updateNucleic Acids Research 46:D794–D801.https://doi.org/10.1093/nar/gkx1081
-
STAR: ultrafast universal RNA-seq alignerBioinformatics 29:15–21.https://doi.org/10.1093/bioinformatics/bts635
-
Courtship latency in male Drosophila melanogasterBehavior Genetics 7:359–372.https://doi.org/10.1007/BF01077449
-
Maturation of active zone assembly by Drosophila bruchpilotThe Journal of Cell Biology 186:129–145.https://doi.org/10.1083/jcb.200812150
-
Sleep and developmental plasticity not just for kidsProgress in Brain Research 193:221–232.https://doi.org/10.1016/B978-0-444-53839-0.00014-4
-
pySolo: a complete suite for sleep analysis in DrosophilaBioinformatics 25:1466–1467.https://doi.org/10.1093/bioinformatics/btp237
-
Developmental analysis of the dopamine-containing neurons of the Drosophila brainThe Journal of Comparative Neurology 525:363–379.https://doi.org/10.1002/cne.24069
-
Sleep in neurodevelopmental and neurodegenerative disordersSeminars in Pediatric Neurology 22:126–129.https://doi.org/10.1016/j.spen.2015.03.003
-
Mapping neural circuits with activity-dependent nuclear import of a transcription factorJournal of Neurogenetics 26:89–102.https://doi.org/10.3109/01677063.2011.642910
-
Spatiotemporal gene expression targeting with the TARGET and Gene-Switch systems inDrosophilaScience's STKE : Signal Transduction Knowledge Environment 2004:pl6.https://doi.org/10.1126/stke.2202004pl6
-
Drosophila Nesprin-1 controls glutamate receptor density at neuromuscular junctionsCellular and Molecular Life Sciences 71:3363–3379.https://doi.org/10.1007/s00018-014-1566-7
-
The neurocognitive effects of sleep disruption in children and adolescentsChild and Adolescent Psychiatric Clinics of North America 18:813–823.https://doi.org/10.1016/j.chc.2009.04.008
-
Sleep disturbances in neurodevelopmental disordersCurrent Psychiatry Reports 18:6.https://doi.org/10.1007/s11920-015-0638-1
-
Fiji: an open-source platform for biological-image analysisNature Methods 9:676–682.https://doi.org/10.1038/nmeth.2019
-
Mechanisms of clock output in the Drosophila circadian pacemaker systemJournal of Biological Rhythms 21:445–457.https://doi.org/10.1177/0748730406293910
-
Identification of a dopamine pathway that regulates sleep and arousal in DrosophilaNature Neuroscience 15:1516–1523.https://doi.org/10.1038/nn.3238
Article and author information
Author details
Leela Chakravarti Dilley

Ricardo Linares Saldana
Mubarak Hussain Syed
Funding
National Institutes of Health (K08 NS090461)
- Matthew S Kayser
National Institutes of Health (DP2 NS111996)
- Matthew S Kayser
National Institutes of Health (T32 HL007953)
- Leela Chakravarti Dilley
National Institutes of Health (F31 NS105447)
- Leela Chakravarti Dilley
Burroughs Wellcome Fund
- Rajan Jain
- Matthew S Kayser
March of Dimes Foundation
- Matthew S Kayser
Alfred P. Sloan Foundation
- Matthew S Kayser
The funders had no role in study design, data collection and interpretation, or the decision to submit the work for publication.
Acknowledgements
We would like to thank members of the Kayser lab and members of the Penn Chronobiology and Sleep Institute for helpful discussions/input, and the Next Generation Sequencing Core (University of Pennsylvania) for sequencing/analysis support. Figure 3A was created with BioRender.com. We thank Salina Yuan for assistance with creating Figure 8B.
Version history
- Received: October 11, 2019
- Accepted: March 4, 2020
- Accepted Manuscript published: March 23, 2020 (version 1)
- Version of Record published: April 27, 2020 (version 2)
Copyright
© 2020, Chakravarti Dilley et al.
This article is distributed under the terms of the Creative Commons Attribution License, which permits unrestricted use and redistribution provided that the original author and source are credited.
Metrics
-
- 3,017
- views
-
- 409
- downloads
-
- 10
- citations
Views, downloads and citations are aggregated across all versions of this paper published by eLife.
Download links
A two-part list of links to download the article, or parts of the article, in various formats.
Downloads (link to download the article as PDF)
Open citations (links to open the citations from this article in various online reference manager services)
Cite this article (links to download the citations from this article in formats compatible with various reference manager tools)
Identification of a molecular basis for the juvenile sleep state
eLife 9:e52676.
https://doi.org/10.7554/eLife.52676
Further reading
-
- Genetics and Genomics
- Neuroscience
Genome-wide association studies have revealed >270 loci associated with schizophrenia risk, yet these genetic factors do not seem to be sufficient to fully explain the molecular determinants behind this psychiatric condition. Epigenetic marks such as post-translational histone modifications remain largely plastic during development and adulthood, allowing a dynamic impact of environmental factors, including antipsychotic medications, on access to genes and regulatory elements. However, few studies so far have profiled cell-specific genome-wide histone modifications in postmortem brain samples from schizophrenia subjects, or the effect of antipsychotic treatment on such epigenetic marks. Here, we conducted ChIP-seq analyses focusing on histone marks indicative of active enhancers (H3K27ac) and active promoters (H3K4me3), alongside RNA-seq, using frontal cortex samples from antipsychotic-free (AF) and antipsychotic-treated (AT) individuals with schizophrenia, as well as individually matched controls (n=58). Schizophrenia subjects exhibited thousands of neuronal and non-neuronal epigenetic differences at regions that included several susceptibility genetic loci, such as NRG1, DISC1, and DRD3. By analyzing the AF and AT cohorts separately, we identified schizophrenia-associated alterations in specific transcription factors, their regulatees, and epigenomic and transcriptomic features that were reversed by antipsychotic treatment; as well as those that represented a consequence of antipsychotic medication rather than a hallmark of schizophrenia in postmortem human brain samples. Notably, we also found that the effect of age on epigenomic landscapes was more pronounced in frontal cortex of AT-schizophrenics, as compared to AF-schizophrenics and controls. Together, these data provide important evidence of epigenetic alterations in the frontal cortex of individuals with schizophrenia, and remark for the first time on the impact of age and antipsychotic treatment on chromatin organization.
-
- Cancer Biology
- Genetics and Genomics
Relapse of acute myeloid leukemia (AML) is highly aggressive and often treatment refractory. We analyzed previously published AML relapse cohorts and found that 40% of relapses occur without changes in driver mutations, suggesting that non-genetic mechanisms drive relapse in a large proportion of cases. We therefore characterized epigenetic patterns of AML relapse using 26 matched diagnosis-relapse samples with ATAC-seq. This analysis identified a relapse-specific chromatin accessibility signature for mutationally stable AML, suggesting that AML undergoes epigenetic evolution at relapse independent of mutational changes. Analysis of leukemia stem cell (LSC) chromatin changes at relapse indicated that this leukemic compartment underwent significantly less epigenetic evolution than non-LSCs, while epigenetic changes in non-LSCs reflected overall evolution of the bulk leukemia. Finally, we used single-cell ATAC-seq paired with mitochondrial sequencing (mtscATAC) to map clones from diagnosis into relapse along with their epigenetic features. We found that distinct mitochondrially-defined clones exhibit more similar chromatin accessibility at relapse relative to diagnosis, demonstrating convergent epigenetic evolution in relapsed AML. These results demonstrate that epigenetic evolution is a feature of relapsed AML and that convergent epigenetic evolution can occur following treatment with induction chemotherapy.


