Coordination of humoral immune factors dictates compatibility between Schistosoma mansoni and Biomphalaria glabrata
- Beibu Gulf University, China
- University of Alberta, Canada
- Zhejiang University, China
Abstract
Immune factors in snails of the genus Biomphalaria are critical for combating Schistosoma mansoni, the predominant cause of human intestinal schistosomiasis. Independently, many of these factors play an important role in, but do not fully define, the compatibility between the model snail B. glabrata, and S. mansoni. Here, we demonstrate association between four previously characterized humoral immune molecules; BgFREP3, BgTEP1, BgFREP2 and Biomphalysin. We also identify unique immune determinants in the plasma of S. mansoni-resistant B. glabrata that associate with the incompatible phenotype. These factors coordinate to initiate haemocyte-mediated destruction of S. mansoni sporocysts via production of reactive oxygen species. The inclusion of BgFREP2 in a BgFREP3-initiated complex that also includes BgTEP1 almost completely explains resistance to S. mansoni in this model. Our study unifies many independent lines of investigation to provide a more comprehensive understanding of the snail immune system in the context of infection by this important human parasite.
Introduction
Schistosomiasis, a disease caused by parasitic trematodes of the genus Schistosoma, is second only to malaria as the most socioeconomically devastating parasitic disease, with an estimated 252 million people infected worldwide in 2015 (Disease et al., 2016; Mortality and GBD 2015 Mortality and Causes of Death Collaborators, 2016). Larval digenean trematodes share a common feature in the use of snails (gastropod mollusks) as intermediate hosts for transmission to a vertebrate host (Esch et al., 2002). The snail Biomphalaria glabrata transmits several species of trematode, including Schistosoma mansoni, the predominant causal species of intestinal schistosomiasis (Pila et al., 2016a). The molecular interactions between B. glabrata and S. mansoni have been studied extensively towards better understanding this essential life cycle stage of an important human parasite (Adema, 2015).
Various genetically determined resistance phenotypes exist with respect to S. mansoni infection in B. glabrata (Richards, 1975a; Richards, 1975b). Some B. glabrata snails (such as BS-90 strain) naturally resist S. mansoni infection. Susceptible B. glabrata (such as M-line strain) can develop transient levels of acquired resistance following previous exposure to incompatible or radiation-attenuated parasites with modest cross protection to related digenean species (Lie and Heyneman, 1975; Lie et al., 1975; Sullivan et al., 1982). Previous research has focused on identifying the mechanisms responsible for determining resistance profiles. Using in vivo and in vitro models of B. glabrata snails, it has been demonstrated that the killing of S. mansoni larvae is associated with a haemocyte-mediated cytotoxic mechanism, and passive transfer of natural resistance to S. mansoni has been successfully accomplished when haemocytes from a susceptible B. glabrata strain are incubated in cell-free haemolymph (plasma) from a resistant strain (Bayne et al., 1980a; Bayne et al., 1980b; Granath and Yoshino, 1984; Loker and Bayne, 1982). Thus, haemocytes from resistant or susceptible B. glabrata strains do not appear to differ a priori in their cytotoxic capabilities, but their response requires activation by some humoral factor(s) (Bayne et al., 1980b; Granath and Yoshino, 1984; Vasquez and Sullivan, 2001), for proper recognition of S. mansoni and enhancing haemocyte cytotoxicity (Hahn et al., 2001).
Researchers have long sought immune determinants present in resistant B. glabrata plasma that specifically activate haemocytes to encapsulate and destroy S. mansoni sporocysts. Identified in B. glabrata, a large family of soluble lectins termed fibrinogen-related proteins (BgFREPs) attracted widespread interest because of their unique structure (Adema et al., 1997; Gordy et al., 2015), capacity for somatic diversification (Zhang et al., 2004), and immune function (Hanington et al., 2010; Hanington and Zhang, 2011). BgFREPs are composed of a C-terminal fibrinogen (FBG) domain and either one or two N-terminal immunoglobulin superfamily (IgSF) domains linked to the FBG domain by an interceding region (ICR) (Léonard et al., 2001; Zhang et al., 2001). Numerous studies have implicated BgFREP3 as playing a central role in B. glabrata resistance to digenetic trematodes (Hanington et al., 2010; Hanington et al., 2012; Hanington and Zhang, 2011; Lockyer et al., 2012; Lockyer et al., 2008; Pila et al., 2017b). BgFREP3 contains two tandem IgSF domains whereas BgFREP2 has one (Léonard et al., 2001). The expression of BgFREP2 in BS-90 snails is dramatically up-regulated (57-fold) after exposure to S. mansoni, whereas M-line snails do not feature such a drastic upregulation, thereby suggesting a role for BgFREP2 in resistance (Hertel et al., 2005). Interestingly, the time course for heightened BgFREP2 expression overlaps the interval within which sporocysts are encapsulated and killed, and only occurs in BS-90 haemocytes (Dinguirard et al., 2018; Hertel et al., 2005). Furthermore it was reported that BgFREP2 is reactive with S. mansoni polymorphic mucins (SmPoMucs) found on the tegumental surface of larval S. mansoni (Moné et al., 2010).
In addition to BgFREPs, other soluble immune effector factors which are involved in both the direct killing of sporocysts and preparation of haemocytes to mount a cell-mediated response have been characterized (Pila et al., 2017a). These factors include B. glabrata thioester-containing proteins (BgTEPs) (Bender et al., 1992; Moné et al., 2010; Portet et al., 2018) and Biomphalysin (Galinier et al., 2013). TEPs are key components of invertebrate and vertebrate immune responses, aiding in melanization, opsonization, and killing of invading pathogens (Baxter et al., 2007; Blandin et al., 2008; Levashina et al., 2001; Pila et al., 2017a; Portet et al., 2018; Povelones et al., 2013; Yassine and Osta, 2010). BgTEP was first characterized as an alpha macroglobulin proteinase inhibitor, and has recently re-emerged as a molecule of interest due to its association with BgFREP2 and SmPoMucs, and the capacity to bind to various invading pathogens (Bender et al., 1992; Moné et al., 2010; Portet et al., 2018). Biomphalysin is a cytolytic protein in B. glabrata belonging to the β pore-forming toxin (β-PFT) superfamily (Galinier et al., 2013). Biomphalysin binds to the surface of S. mansoni sporocysts in the absence of plasma, while its cytolytic activity is drastically increased when plasma is present, suggesting that other factor(s) within the plasma may mediate the conversion of the oligomeric pre-pore to a functional pore (Galinier et al., 2013). Although the functional mechanisms of these factors are not thoroughly understood, studies suggest that these factors function as key determinants in the final outcome of S. mansoni challenge of B. glabrata (Galinier et al., 2013; Moné et al., 2010).
While studies have implicated BgFREP3 in resistance to S. mansoni, the underlying mechanism of BgFREP3 function; how it binds to S. mansoni sporocyst surfaces, and then how recognition is translated into haemocyte engagement, activation, and ultimately parasite encapsulation, is still unknown (Hanington et al., 2010). Here, we report an association between BgFREP3, BgTEP1, Biomphalysin (UniProtKB/TrEMBL: A0A182YTN9 and A0A182YTZ4) and BgFREP2 (UniProtKB/TrEMBL: A0A2C9L9F5). BgFREP3 associates with BgTEP1 and Biomphalysin in both M-line and BS-90 strains, but only in BS-90 strain uniquely interacts with BgFREP2 and other versions of BgFREP3 (a variant of BgFREP3.3), providing us with an important insight into why BS-90 strain is refractory to S. mansoni infection. In this study, we demonstrate that BgFREP3 binds to S. mansoni sporocysts without any other soluble plasma factors, yet binding of BgFREP2 relies on BgTEP1. However, BgFREP3 still interacts with BgTEP1 to form unique immune complexes, which significantly enhance the ability of haemocytes and plasma from S. mansoni-susceptible B. glabrata (M-line) to kill S. mansoni sporocysts. A more striking finding is that the combination of BgFREP3, BgTEP1 and BgFREP2 renders M-line haemocytes capable of killing S. mansoni sporocysts at nearly the same level as S. mansoni-resistant BS-90 haemocytes. Reactive oxygen species (ROS) are shown to play an important role during this haemocyte-mediated killing of S. mansoni sporocysts. These results provide insight into how the numerous previously characterized immune factors known to be important in the anti-S. mansoni immune response to B. glabrata are acting in concert to defend the snail host.
Results
BgFREP3 interacts with BgTEP1, Biomphalysin, BgFREP2 and other BgFREP3 variants in snail plasma
To identify the factors in snail plasma which interact with BgFREP3, we produced recombinant BgFREP3 (rBgFREP3, GenBank: AY028461.1, M-line strain) using an insect expression system (Figure 1A and Figure 1—source data 1) and performed a series of pull-down experiments. We initiated our investigations with BgFREP3 because we observed that the cell-free plasma of BS-90 snails contained more BgFREP3 than does M-line snail plasma (Figure 1B). Among the proteins identified using liquid chromatography-tandem mass spectrometry (LC-MS/MS) in the eluent of these pull-down experiments was BgTEP1 (Figure 1C). We performed four replicate rBgFREP3 pull-down experiments, each yielded a band at approximately 200 kDa, which corresponded to the full-length BgTEP1, which was identified from both M-line and BS-90 strains (Figure 1C). In three instances, we excised the bands from SDS-PAGE gels for mass spectrometry identification, this showed twice that BgTEP1 was pulled down by rBgFREP3 in M-line plasma, while this was shown once in both M-line and BS-90 plasma (Figure 1D). From the LC-MS/MS analysis we obtained a total of 17 unique peptides, 16 peptides were detected from M-line strain, four peptides were from BS-90 strain, and three peptides were present in both BS-90 and M-line strains (Table. S2 and Figure 1D). While all peptides mapped to BgTEP, there was uncertainty as to which specific BgTEP proteins are present. Twelve peptides mapped to BgTEP (GenBank: ACL00841.1); 15 peptides mapped to BgTEP1.1 (GenBank: ADE45332.1, from a Brazilian strain of B. glabrata), BgTEP1.2 (GenBank: ADE45339.1, from a Brazilian strain of B. glabrata), BgTEP1.3 (GenBank: ADE45340.1, from a Brazilian strain of B. glabrata), BgTEP1.4 (GenBank: ADE45341.1, from a Brazilian strain of B. glabrata) and BgTEP1.5 (GenBank: ADE45333.1, from a Brazilian strain of B. glabrata), however, there was overlap between some of these peptides, which mapped to all known BgTEP sequences (Figure 1—source data 2). The BgTEP identified by MS here displayed a relatively large difference from BgTEP (ACL00841.1), but could not be distinguished from other BgTEP1 sequences (Figure 1—source data 2), so we termed it BgTEP1.
Figure 1 with 1 supplement see all
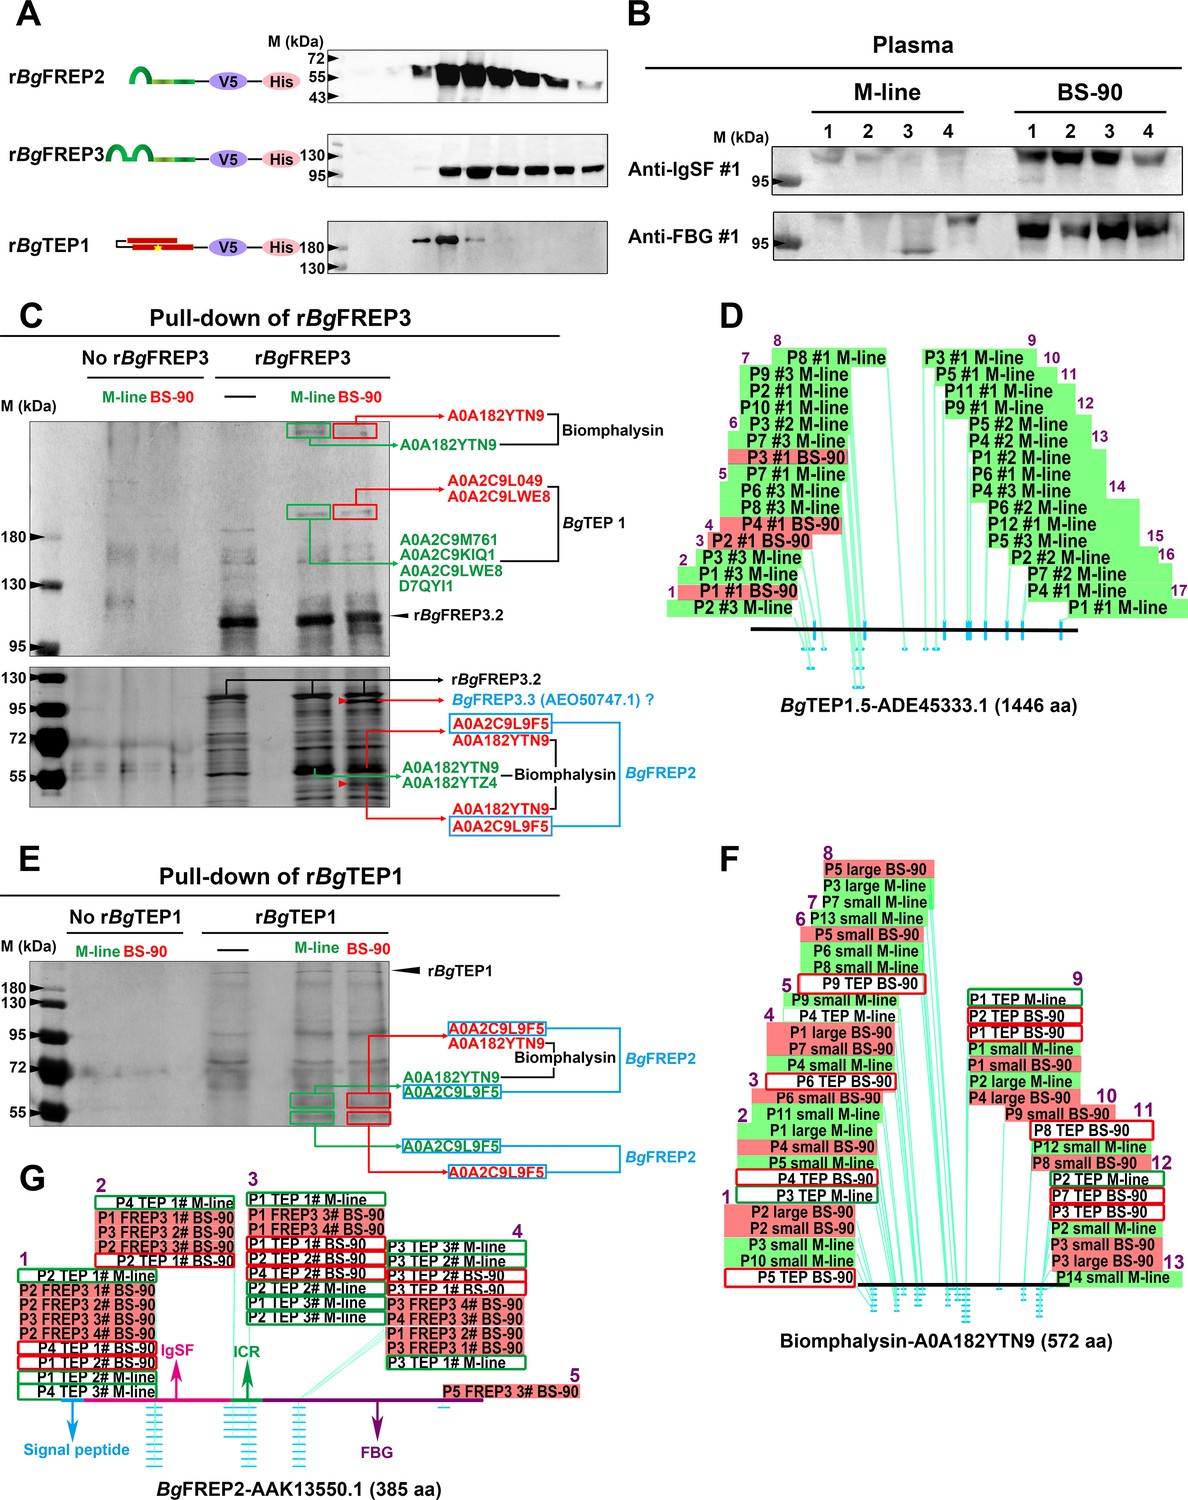
BgFREP3, which had special high abundance in BS-90 plasma, interacted with BgTEP1 and Biomphalysin derived from both M-line and BS-90 plasma, while uniquely associated with BgFREP2 and a BgFREP3 variant from BS-90 plasma.
(A) Schematic diagram and Western blot analysis of recombinant proteins, the ends of which are coupled to the tags V5 and ploy-His for protein immunoassay and purification operations. The yellow star in the schematic structure of rBgTEP1 represents the thioester motif. (B) The background expression of BgFREP3 in BS-90 snail plasma was significantly higher than that in M-line plasma. The haemolymph of four snails from each M-line and BS-90 strain was independently extracted, and haemocytes were removed by centrifugation to obtain plasma samples. After the plasma of each snail was quantified, the same amount of plasma was used for SDS-PAGE electrophoresis and Western blot analysis. Anti-IgSF #1 and anti-FBG #1 antibodies of BgFREP3 were used as primary antibodies. (C) The rBgFREP3 associated with BgTEP1 and Biomphalysin in both M-line and BS-90 plasma, but exclusively interacted with a BgFREP3 variant and BgFREP2 in BS-90 plasma. The eluent of rBgFREP3 pull-downs was collected and separated on 6% (upper panel) and 10% (lower panel) SDS-PAGE gels before silver staining. (E) The rBgTEP1 interacted with Biomphalysin and BgFREP2 in both M-line and BS-90 plasma. The eluent of pull-down experiments with rBgTEP1was separated on 10% SDS-PAGE gels. In the pull-down experiments with rBgFREP3 (C) and rBgTEP1 (E), cell-free plasma from M-line (green) or BS-90 (red) B. glabrata snails was incubated with Sf9 cell lysates expressing rBgFREP3 or concentrated medium containing rBgTEP1 together (interactome experiments, last two lanes) or alone (controls, first three lanes). Bands that differ between control and interactome experiments were cut, proteins submitted to tryptic digest and analyzed by LC-MS/MS for identification. In interactome experiments, bands that differ between M-line and BS-90 lanes were marked with red arrows. The results of mass spectrometry analysis are shown in the figure. Proteins (BgTEP1 and Biomphalysin) represented by black font interacted with rBgFREP3 in both M-line and BS-90 plasma. Proteins (BgFREP2 and BgFREP3.3) represented by blue font specially interacted with rBgFREP3 only in BS-90. (D, F and G) Distribution of peptides identified by LC-MS/MS on BgTEP1.5 (ADE45333.1), Biomphalysin (A0A182YTN9) and BgFREP2 (AAK13550.1). The text on the panels describes the peptides identified from different Pull-down experiments, and most peptides were identified multiple times. The text with the green background describes peptides identified from the plasma of M-line strain in the rBgFREP3 pull-down experiments, and corresponding the text with the red background represents the peptides from the plasma of BS-90 strain. Similarly, the text in the green frame box represents the peptides from the plasma of the M-line strain in the rBgTEP1 pull-down experiments, and corresponding the text in the red frame box represents the peptides from the plasma of the BS-90 strain. The horizontal lines in panels D, F and G represent the full-length amino acid sequences of BgTEP1.5, Biomphalysin and BgFREP2. The light blue dots and dashes indicate the location of the peptides. The purple Arabic numerals represent the number of identified peptide fragments that differ from each other.
-
Figure 1—source data 1
Nucleotide sequence for cloning rBgFREP3.
This sequence is derived from GenBank AY028461.1. There are differences in nucleotide sequence but the amino acids match 100%. The differences are due to codon-optimization for expression in insect Sf9 cells. GenBank annotations are used to locate the individual BgFREP3.2 domains: underline, signal peptide; gray shading, IgSF1 domain; double underline, small connecting region; gray shading plus frame, IgSF2 domain; wavy underline, ICR; bold underline, FBG domain; delete line, termination codon.
- https://cdn.elifesciences.org/articles/51708/elife-51708-fig1-data1-v2.docx
-
Figure 1—source data 2
The peptides identified by LC-MS/MS were distributed over the full-length BgTEP, but could not be used to distinguish which BgTEP variant was present.
Peptides identified by LC-MS/MS from rBgFREP3 pull-down experiments are highlighted in gray. The GenBank accession numbers of each entry are: BgTEP, ACL00841.1; BgTEP1.1, ADE45332.1; BgTEP1.2, ADE45339.1; BgTEP1.3, ADE45340.1; BgTEP1.4, ADE45341.1 and BgTEP1.5, ADE45333.1.
- https://cdn.elifesciences.org/articles/51708/elife-51708-fig1-data2-v2.docx
-
Figure 1—source data 3
The two Biomphalysin variants (UniProtKB/TrEMBL: A0A182YTN9 and A0A182YTZ4) identified by LC-MS/MS shared high sequence identities but were different from the previously published Biomphalysin (GenBank: AGG38744.1).
(A) Alignment analysis of AGG38744.1 and A0A182YTN9. (B) Alignment analysis of AGG38744.1 and A0A182YTZ4. (C) Multiple sequence alignment of AGG38744.1, A0A182YTN9 and A0A182YTZ4. The identified peptides in A, B and C are highlighted in gray. The yellow squares and red plus signs in A and B represent sites with differing amino acids. The red frame in A, B and C representing differences in peptide sequences that distinguish two Biomphalysin variants (A0A182YTN9 and A0A182YTZ4).
- https://cdn.elifesciences.org/articles/51708/elife-51708-fig1-data3-v2.docx
-
Figure 1—source data 4
The identified protein (UniProtKB/TrEMBL: A0A2C9L9F5) represented a variant of BgFREP2 members that was distinct from other BgFREP members, but was indistinguishable from other BgFREP2 variants.
(A) The amino acid sequence information of protein A0A2C9L9F5 derived from the B. glabrata proteome database (Genome Accession: GCA_000457365). Peptides identified by LC-MS/MS are highlighted in gray. (B) Alignment of multiple BgFREP amino acid sequences and distribution of identified peptides. Peptides identified by LC-MS/MS are highlighted in gray. The GenBank accession numbers of each entry are: BgMFREP1 partial, AAK13549; BgMFREP2 precursor, AAK13550; BgFREP3-2 precursor, AAK28656; BgMFREP4 precursor, AAK13551; BgMFREP5 partial, AAK13546; BgMFREP6 partial, AAK13552; BgFREP7.1 precursor, AAK28657; BgMFREP8 partial, AAK13553; BgMFREP9 partial, AAK13554; BgMFREP10 partial, AAK13555; BgMFREP11 partial, AAK13556; BgFREP12.1 precursor, AAO59918; BgFREP12-FBG2, AAT58639; BgFREP13.1 precursor, AAO59922 and BgFREP14, ABO61860. (C) Blast analysis of protein A0A2C9L9F5 in NCBI database. The top 30 proteins with the highest scores are listed. (D) Multiple sequence alignment of 30 BgFREP2 family proteins listed in C. Peptides identified by LC-MS/MS are highlighted in gray.
- https://cdn.elifesciences.org/articles/51708/elife-51708-fig1-data4-v2.docx
-
Figure 1—source data 5
Alignment of multiple BgFREP3 amino acid sequences and distribution of identified peptides.
Peptides identified by LC-MS/MS are highlighted in gray, the overlapping region of peptides are bold underline. GenBank annotations of BgFREP3.2 (AAK28656.1) are used for locate the individual BgFREP3 domains: orange, signal peptide; green, IgSF1 domain; blue, small connecting region; pink, IgSF2 domain; black, ICR; red, FBG domain.
- https://cdn.elifesciences.org/articles/51708/elife-51708-fig1-data5-v2.docx
The full-length sequences of BgTEP1 variants usually contain 1445 or 1446 amino acid residues (Figure 1—source data 2). The peptides identified by LC-MS/MS covered 16.3% of the full-length sequence (Figure 1—source data 2). The identified peptides were distributed over the full-length BgTEP1, with the peptides identified from the BS-90 strain being concentrated in the N-terminal region (Figure 1D). Background transcript abundance of BgTEP1 detected by qRT-PCR in M-line and BS-90 snails, suggested that there was no significant difference (p>0.05) in baseline BgTEP1 expression between the two strains (Figure 1—figure supplement 1). These results indicate that the interaction of BgFREP3 with BgTEP1 doesn’t require the involvement of any parasite components.
Recombinant BgTEP1 (rBgTEP1, GenBank: HM003907.1, Brazilian strain B. glabrata) was also used to perform a series of pull-down experiments (Figure 1A and E). Biomphalysin (UniProtKB/TrEMBL: A0A182YTN9 and A0A182YTZ4) was identified in both M-line and BS-90 plasma from rBgTEP1 pull-down experiments and was also present in the pull-down studies using rBgFREP3 (Figure 1C and E). Analysis suggested that Biomphalysin-A0A182YTN9 and Biomphalysin-A0A182YTZ4 amino acid sequences were 94% and 99% identical to the Biomphalysin (GenBank: AGG38744.1) previously reported (Galinier et al., 2013) (Figure 1—source data 3A,B). The 13 peptides identified by LC-MS/MS covered 28.3% of Biomphalysin (A0A182YTN9) amino acid sequence (Figure 1F, Supplementary file 2 and Figure 1—source data 3C). These peptides were evenly distributed throughout the Biomphalysin-A0A182YTN9 protein (Figure 1F and Figure 1—source data 3). The theoretical molecular weight of Biomphalysin is ~64 kDa. Peptides identified from protein pull-down that matched to Biomphalysin appeared at three different molecular weights, one at >400 kDa (Figure 1C), the second site at roughly 60 kDa (Figure 1C and E), which is in agreement with the theoretical molecular weight, and the third at around 55 kDa (Figure 1C), which might represent the size after proteolysis (Galinier et al., 2013).
Comparing rBgFREP3 pull-down results between M-line and BS-90 B. glabrata identified two unique proteins in the BS-90 lane (Figure 1C). One of these proteins was BgFREP2 (UniProtKB/TrEMBL: A0A2C9L9F5) (Figure 1C and E, Figure 1—source data 4A). Five peptides were identified by LC-MS/MS analysis and covered 16.6% of BgFREP2 precursor (GenBank: AAK13550.1) amino acid sequence and were located throughout the IgSF and FBG of the protein (Figure 1G, Supplementary file 2 and Figure 1—source data 4). Three of the five identified peptides specifically belonged to BgFREP2 precursor (AAK13550.1), thus, the identified BgFREP2-A0A2C9L9F5 appears to represent a specific BgFREP2 variant that is distinct from other BgFREP members that have been published (Figure 1—source data 4B), but not distinguishable from other BgFREP2 members (Figure 1—source data 4C,D). BLAST analysis indicated that BgFREP2-A0A2C9L9F5 had the highest identity (96.62%) to FREP A precursor (GenBank: NP_001298226.1) (Figure 1—source data 4C), which was constitutively expressed solely in haemocytes of the BS-90 resistant strain (Dinguirard et al., 2018).
Only BgFREP2 was identified, at ~55 kDa, from the BS-90 strain plasma when rBgFREP3 was used as the bait protein in pull-down experiments (Figure 1C). This contrasted with our other data in which BgFREP2 was identified from plasma of both M-line and BS-90 strains when rBgTEP1was used as bait in pull-down experiments (Figure 1E). BgFREP2 was identified by LC-MS/MS from two distinct molecular weight bands in the BS-90 lane of the rBgFREP3 study and the rBgTEP1 study. One band, at ~60 kDa also included peptides that mapped to Biomphalysin while the other band identified at ~55 kDa, contained peptides for only BgFREP2 (Figure 1C and E). Thus, all of the BgFREP2 peptides were identified from bands that were of greater molecular weight than the predicted BgFREP2, which was ~43 kDa. However, this was consistent with the observed molecular weight of BgFREP2 by Moné et al. (2010), and could be explained by post-translational modifications such as glycosylation (Adema et al., 1997; Moné et al., 2010; Zhang et al., 2008).
Another unique protein identified from the BS-90 lane in the rBgFREP3 pull-down experiments was a variant of BgFREP3 (Figure 1C). Of the nine peptides identified by LC-MS/MS, seven specifically matched BgFREP3.3 (Genbank: AEO50747.1), the other two matched other members of BgFREP3 family: BgFREP3.3 (GenBank: AAO59915.1), BgFREP3.2 (GenBank: AEO50746.1), BgFREP3.2 (GenBank: AAK28656.1) and BgMFREP3 (GenBank: AAK13548.1), suggesting that this protein was likely a FREP3 variant (Figure 1—source data 5 and Supplementary file 2). The seven peptides that specifically belonged to BgFREP3.3 (AEO50747.1) covered 15.6% of the amino acid sequence length and mainly concentrated in the ICR (five peptides), and one peptide in each of the IgSF2 domain and FBG domain (Figure 1—source data 5). These results suggest that BgFREP3, BgTEP1, Biomphalysin and BgFREP2 associate with each other in B. glabrata plasma, with M-line and BS-90 strains displaying differing interactomes. Our data indicates that BgFREP3 specially interacts with BgFREP2 and another unique BgFREP3 variant only in BS-90 B. glabrata. These results provide us with a new perspective to explore why M-line and BS-90 strains have differing compatibility phenotypes to S. mansoni infection.
BgFREP3 independently recognizes and binds to primary sporocysts of S. mansoni
Our data suggests a close and complex interaction between BgFREP3, BgTEP1, Biomphalysin and BgFREP2. These factors have each independently been reported to be involved in the recognition of S. mansoni sporocysts (Adema et al., 1997; Galinier et al., 2013; Hanington et al., 2010; Hanington et al., 2012; Moné et al., 2010; Portet et al., 2018; Wu et al., 2017). However, only Biomphalysin is known to directly bind to the surface of S. mansoni sporocysts without the aid of any other plasma factors (Galinier et al., 2013). The mechanism by which BgFREP3, BgTEP1 and BgFREP2 bind to primary sporocysts of S. mansoni is still not clear. To explore this issue, we produced rBgFREP3, rBgTEP1 and rBgFREP2 (GenBank: AY012700.1, M-line strain) to observe whether they associate with primary sporocysts of S. mansoni (Figure 1A). Immunocytochemistry clearly showed that rBgFREP3 and combination of rBgFREP3 and rBgTEP1 were able to interact with the outer tegument of S. mansoni sporocysts (Figure 2), while rBgTEP1 and rBgFREP2 alone did not have such capabilities (Figure 2 and Figure 2—figure supplement 1). However, incubation of sporocysts with pre-combined rBgFREP2 and rBgTEP1 yielded a signal, suggesting that these two factors required complex formation prior to being able to associate with S. mansoni sporocysts (Figure 2 and Figure 2—figure supplement 1). These results indicate the mechanisms by which BgFREP3 and BgFREP2 recognize S. mansoni sporocysts are different, that is, BgFREP3 does not require BgTEP1 in order to associate with targets on the S. mansoni sporocyst surface while BgFREP2 relies on BgTEP1 to bind to S. mansoni sporocysts.
Figure 2 with 1 supplement see all
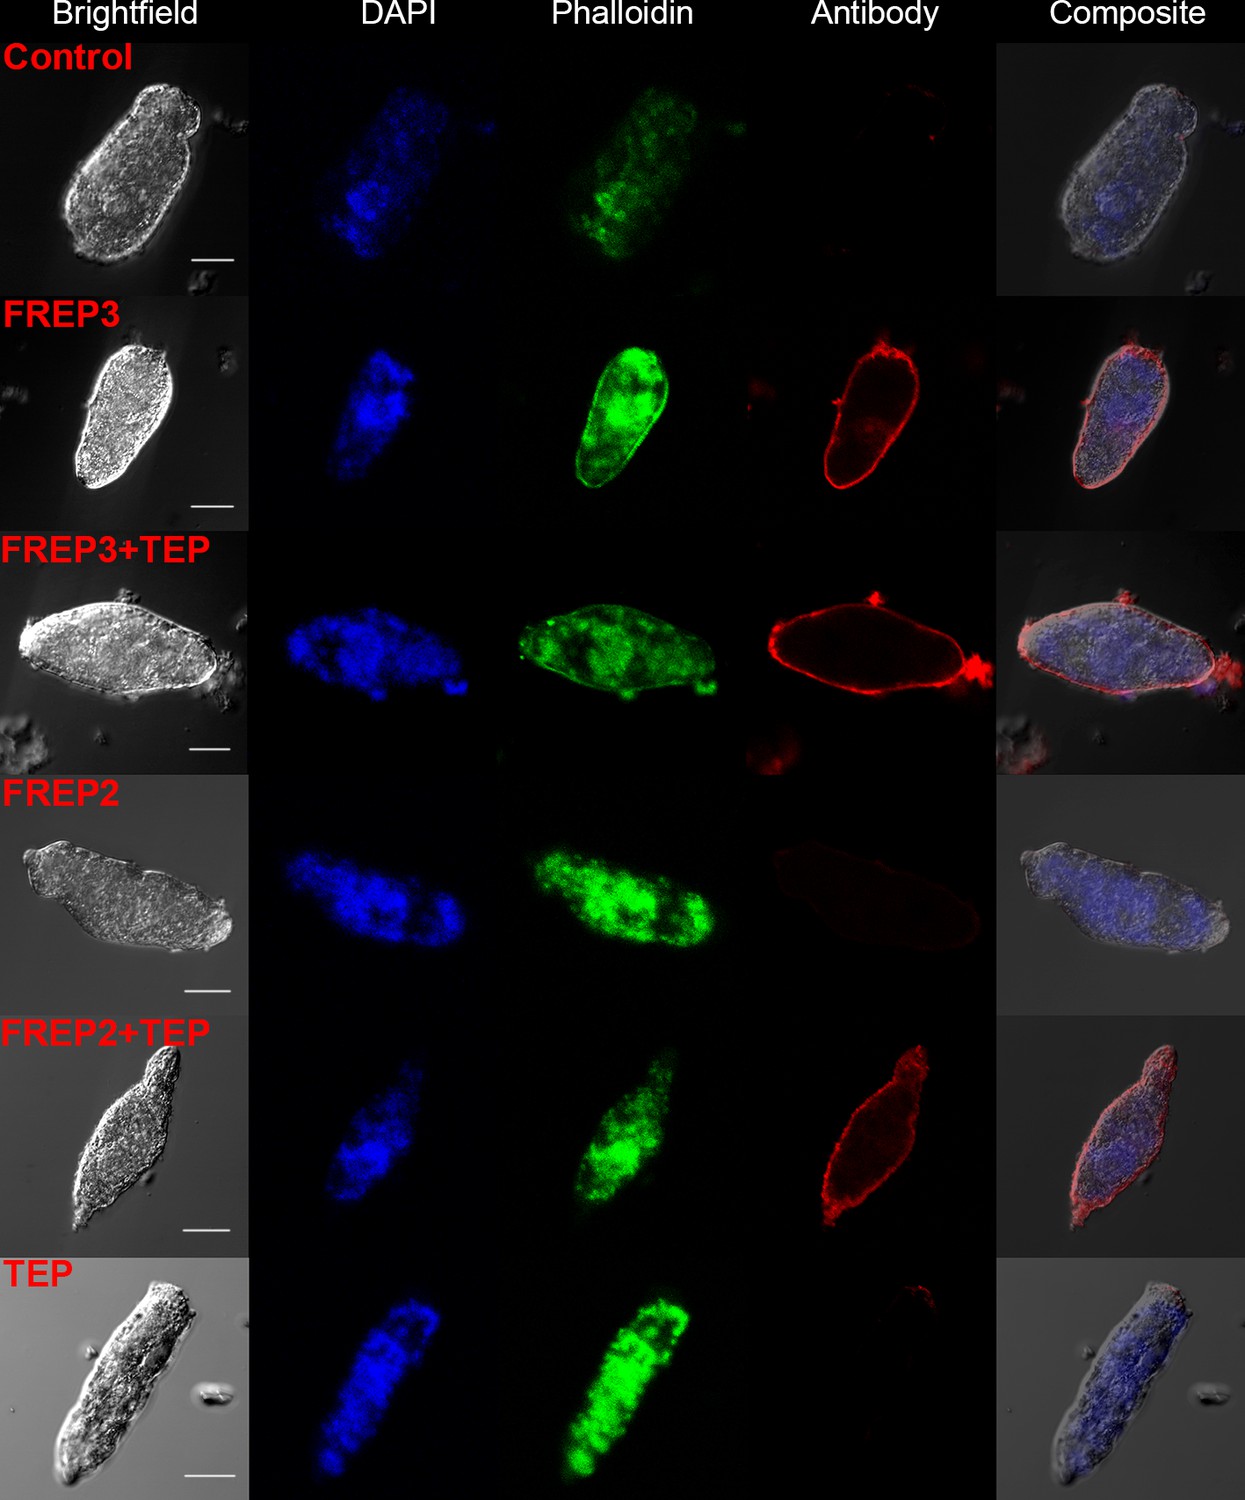
A combination of rBgFREP2 + rBgTEP1, and rBgFREP3 in the presence and absence of rBgTEP1, are capable of binding to the surface of S. mansoni sporocysts.
Fixed sporocysts were incubated with a vehicle control or recombinant proteins (rBgFREP3, rBgFREP2, and rBgTEP1 alone) and combinations of rBgFREP2+rBgTEP1 or rBgFREP3+rBgTEP, followed by immunostaining with anti-V5 primary IgG and Alexa Fluor 633 goat anti-mouse secondary antibody. White bar in the bright field column represents 25 μm.
BgFREP3 and BgTEP1 form an immune complex
To further investigate whether BgFREP3 and BgTEP1 form a complex, we carried out a set of immunoblotting experiments with recombinant proteins. As expected, rBgFREP3 did form a complex with rBgTEP1 (Figure 3A). The complex appeared in a region of high molecular weight (>460 kDa), and the signal decreased gradually with the decrease of rBgTEP1:rBgFREP3 ratios in a dose-dependent manner (Figure 3A). As shown in Figure 3A, rBgFREP3 was found as a high molecular weight multimer in a non-denatured state. The molecular weights of the rBgFREP3 multimer and the rBgFREP3-rBgTEP1 complex were both >460 kDa, thus, it was difficult to distinguish them using Western blot. To confirm the interaction between rBgFREP3 and rBgTEP1, a far-Western blotting approach, in which decreasing amounts of rBgTEP1 were separated by SDS-PAGE, and transferred to a nitrocellulose membrane, and then detected by using biotinylated rBgFREP3 was performed. A band was detected in the lane with 2 μg of rBgTEP1, confirming the interaction between rBgFREP3 and rBgTEP1 (Figure 3B).
Figure 3
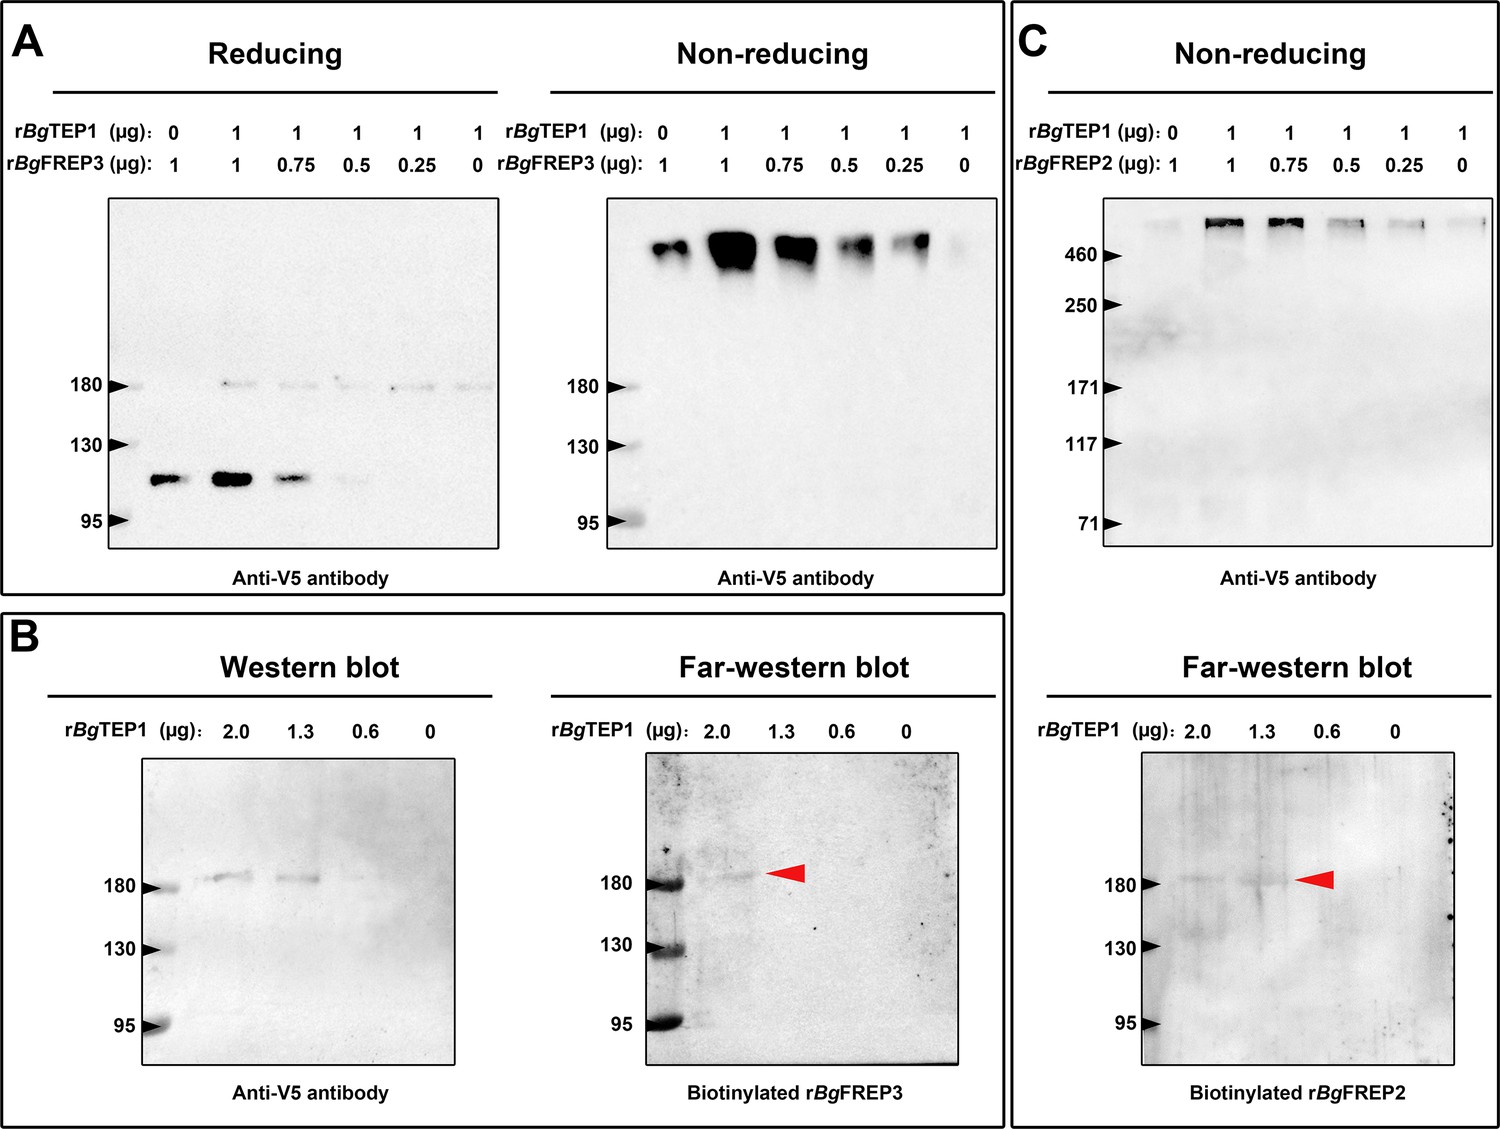
Both rBgFREP3 and rBgFREP2 interacted with rBgTEP1 to form complexes.
(A) Purified rBgTEP1 was incubated with rBgFREP3 in the indicated ratios (wt/wt in µg) for 2 hr at room temperature. After the incubation, Western blot analysis was carried out under denaturing (heating with reducing agent, the right) and non-denaturing (no heating, no reducing agent, the left) conditions, respectively. (B) Decreasing amounts of rBgTEP1 were blotted onto the membrane and then subjected to standard Western blot (the left) and far-Western blot (the right) analysis. (C) The interaction between rBgFREP2 and rBgTEP1. Western blot analysis under non-denaturing (the upper) and far-Western blot analysis (the below) was carried out, respectively. In the far-Western blot, the biotinylated rBgFREP3 and rBgFREP2 acts as a primary antibody and the secondary antibody is a streptavidin-HRP; the red arrow indicates the band that symbolizes the interaction between BgTEP1 and rBgFREP3 or rBgFREP2.
BgFREP2 and BgTEP1 have been shown to form immune complexes with SmPoMucs derived from S. mansoni (Moné et al., 2010), suggesting that BgFREP2 and BgTEP1 associate with each other in snail plasma. To test this assumption, we performed a set of immunoblot assays using rBgFREP2 and rBgTEP1. The results of Western blot under non-denaturing conditions showed a band (>460 kDa) after mixing rBgFREP2 and rBgTEP1 (Figure 3C upper panel). The intensity of this band decreased on the Western blot in a dose dependent manner along with the decrease of the rBgTEP1:rBgFREP2 ratios (Figure 3C upper panel). However, rBgFREP2 did not exist as a multimer under non-denaturing conditions (Figure 3C upper panel), which was consistent with the findings of (Zhang et al., 2008). In addition, we further verified the interaction between rBgFREP2 and rBgTEP1 by Far-Western blot (Figure 3C lower panel).
Association of BgFREP3 and BgTEP1 facilitates recognition and killing of S. mansoni sporocysts
BgFREP3 does not rely on BgTEP1 to recognize and bind to S. mansoni-associated proteins, but does associate with BgTEP1, because of this, we hypothesize that BgTEP1 plays a role in the downstream immune response triggered by BgFREP3 recognition of S. mansoni sporocysts. We treated primary sporocysts with haemocytes or plasma from BS-90 and M-line B. glabrata snails with rBgFREP3, rBgTEP1 and a combination of the two in vitro.
Plasma (haemoglobin-low/free) from the resistant BS-90 strain of B. glabrata snails was naturally able to kill 67% (SEM 3.7%; n = 10) of S. mansoni sporocysts by 48 hr post incubation, while plasma from the susceptible M-line strain, which killed 20% (SEM 4.5%; n = 10), was not significantly more effective than the medium control in which 13% (SEM 2.1%; n = 10) were killed at 48 hr (Figure 4A). The addition of rBgFREP3 (36% [SEM 5.0%; n = 10]) and rBgTEP1 (32% [SEM 3.3%; n = 10]) independently did not significantly enhanced the ability of M-line plasma to kill S. mansoni sporocysts by 48 hr (Figure 4A). However, the combined addition of rBgFREP3 and rBgTEP1 significantly increased M-line-plasma-mediated killing of S. mansoni sporocysts by 48 hr post incubation (56% [SEM 4.8%; n = 10]) compared to the application of either recombinant protein alone. The combined addition of rBgFREP3 and rBgTEP1 rendered the capacity of M-line plasma able to kill S. mansoni sporocysts statistically insignificant from BS-90 plasma (p>0.05) (Figure 4A). Recombinant proteins, in the absence of B. glabrata plasma, did not display any capacity to kill S. mansoni sporocysts (Figure 4—figure supplement 1A). This suggests that rBgFREP3 and rBgTEP1 activate one or more factors in plasma to confer the ability to kill sporocysts. Combined with the results of our rBgFREP3 and rBgTEP1 pull-down experiments, we speculate that Biomphalysin plays an important role in this process. However, an alternative mechanism underpinning plasma-mediated killing may be elevated circulating levels of ROS (e.g., H2O2) naturally occurring in the plasma of BS-90 compared to M-line B. glabrata. To address this possibility, catalase (a ROS scavenger) was pre-incubated with BS-90 plasma and M-line plasma. Catalase did not affect the S. mansoni sporocyst killing capacity of BS-90 plasma nor did it influence M-line plasma incubated with rBgFREP3 and rBgTEP1 (Figure 4—figure supplement 1B), suggesting that other factors besides ROS were activated by rBgFREP3 and rBgTEP1 to mediate sporocyst killing.
Figure 4 with 1 supplement see all
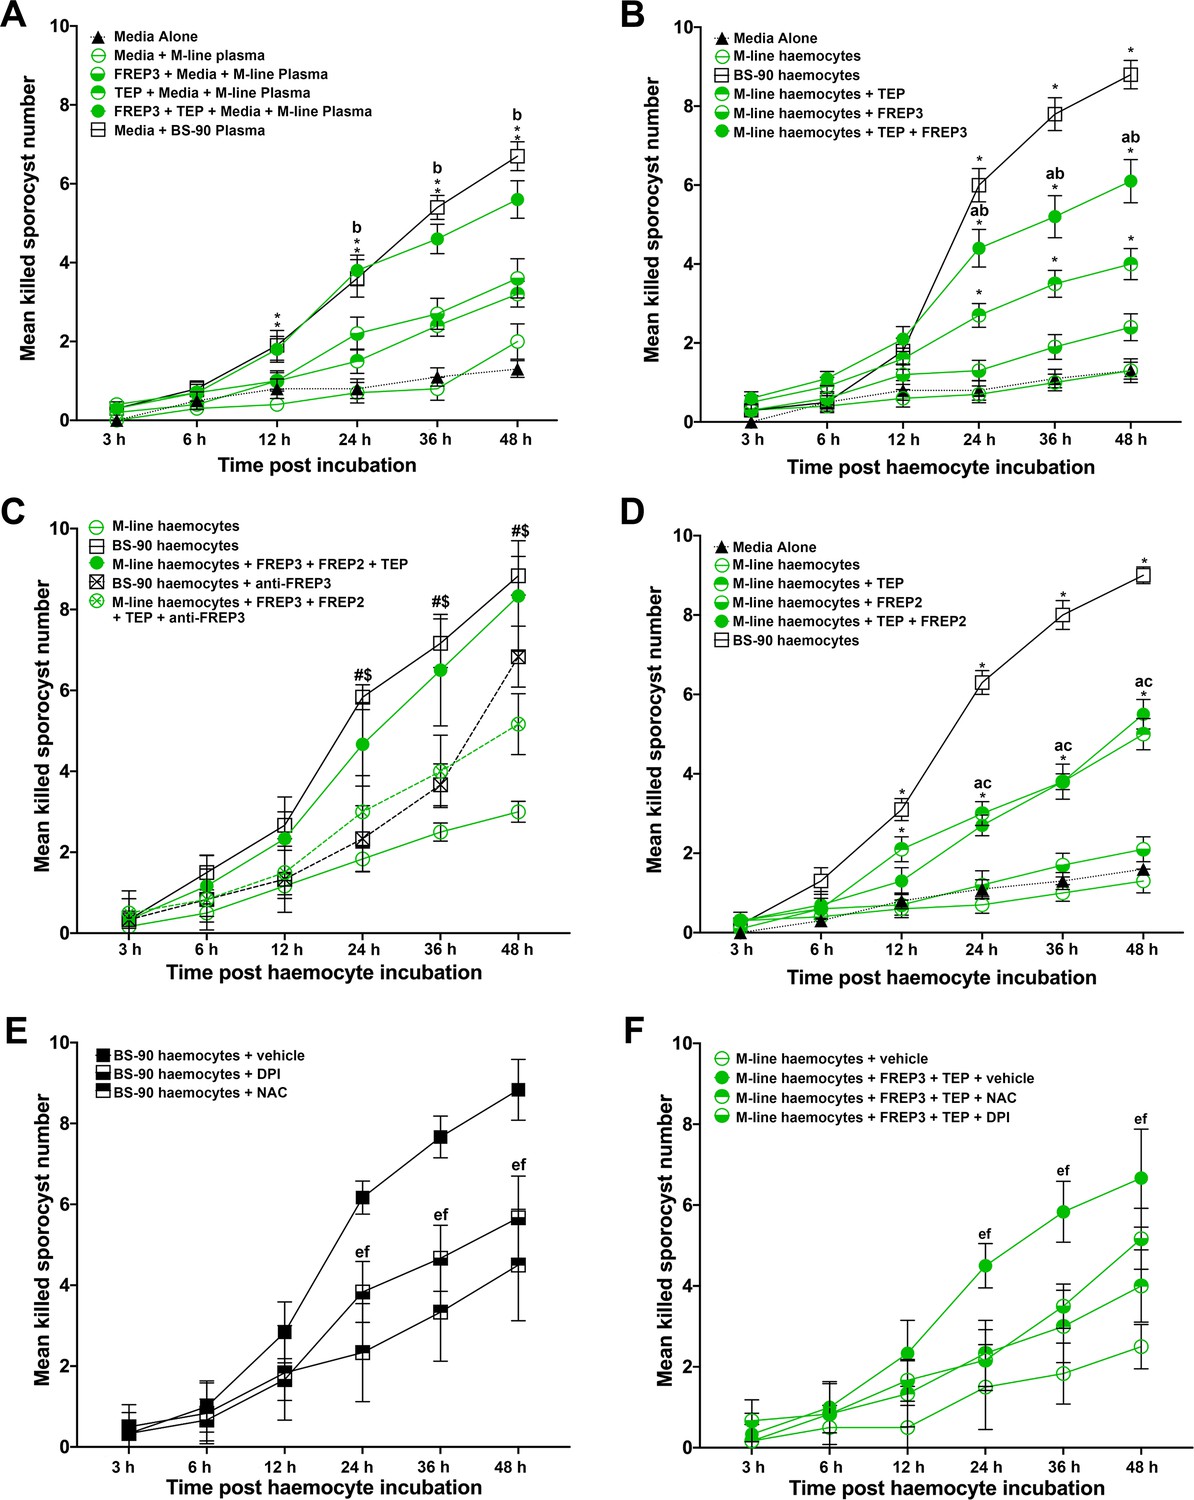
Association of rBgFREP3, rBgTEP1 and rBgFREP2 increased the ability of M-line snails to kill S. mansoni sporocysts.
Effects of rBgFREP3, rBgTEP1 and rBgFREP3-rBgTEP1 complex on killing of S. mansoni sporocysts by M-line plasma (A) and haemocytes (B). (C) Before being exposed to sporocysts, M-line haemocytes were pre-incubated with rBgFREP3-rBgTEP1-rBgFREP2 combination in presence or in absence of anti- BgFREP3 antibodies (abrogation treatment). BS-90 haemocytes were incubated with anti-BgFREP3 antibodies. (D) The effect of rBgFREP2, rBgTEP1 and rBgFREP2-rBgTEP1 complex on the destruction of sporocysts by M-line haemocytes. (E and F) The role of ROS in killing of S. mansoni sporocysts by haemocytes from B. glabrata snails. (E) The addition of ROS inhibitors NAC and DPI abolished the ability of BS-90 haemocytes to destroy sporocysts. (F) Killing sporocysts of M-line haemocytes rendered by rBgFREP3-rBgTEP1 complex was annulled by pre-incubation with ROS inhibitors NAC and DPI. Statistically significant difference symbols in A, B and D: asterisk (*) represents comparison with M-line haemocytes or plasma, *p<0.05, **p<0.01; a represents comparison with BS-90 haemocytes or plasma, p<0.05; b represents comparison with both single treatment (rBgTEP1/rBgFREP3 or rBgFREP2), p<0.05; c represents comparison with only BgFREPs treatment, p<0.05; bars represent SEM, n = 10. Statistically significant difference symbols in C: # represents comparison BS-90 haemocytes with BS-90 haemocytes+anti-rBgFREP3 antibodies, p<0.05; $ represents comparison M-line haemocytes+rBgFREP3+rBgFREP2+rBgTEP1 with M-line haemocytes+rBgFREP3+rBgFREP2+rBgTEP1+anti-rBgFREP3 antibodies, p<0.05; bars represent SEM, n = 10. Statistically significant difference symbols in E and F e represents comparison NAC treatment with BS-90 haemocytes or M-line haemocytes+rBgFREP3+rBgTEP1, p<0.05; f represents comparison DPI treatment with BS-90 haemocytes or M-line haemocytes+rBgFREP3+rBgTEP1, p<0.05; bars represent SEM, n = 6.
-
Figure 4—source data 1
S. mansoni sprorcyst killing assay raw data.
- https://cdn.elifesciences.org/articles/51708/elife-51708-fig4-data1-v2.xls
Haemocytes derived from BS-90 strain B. glabrata were innately capable of destroying S. mansoni sporocysts, killing 88% (SEM 3.6%; n = 10) of sporocysts after 48 hr of incubation in vitro (Figure 4B). The basal ability of M-line haemocytes to kill sporocysts (13% [SEM 3%; n = 10]) was not significantly different from the medium-alone control (13% [SEM 2.1%; n = 10]), and was only slightly increased by adding rBgFREP3 (24% [SEM 3.4%; n = 10]) at 48 hr (Figure 4B). Addition of rBgTEP1 did significantly increase sporocyst killing by M-line haemocytes to 40% (SEM 3.9%; n = 10) (Figure 4B), however, this killing response was significantly enhanced to 61% (SEM 5.5%; n = 10) when rBgFREP3 and rBgTEP1 were incubated with M-line haemocytes together (Figure 4B). However, the combination of rBgFREP3 and rBgTEP1 did not convey a killing capacity to M-line snails that paralleled BS-90 haemocytes (Figure 4B). This suggests that there is yet another factor(s) affecting this process, causing haemocytes from BS-90 and M-line to differ in their ability to destroy sporocysts. In our rBgFREP3 pull-down experiments, BgFREP2 was one of the two proteins uniquely identified as associating with rBgFREP3 in the plasma of BS-90 B. glabrata (Figure 1C). Incubation of rBgFREP2 in combination with rBgFREP3 and rBgTEP1 enabled M-line haemocytes to kill S. mansoni sporocysts (83% [SEM 4.8%; n = 6]) to statistically indistinguishable (p>0.05) levels as BS-90 haemocytes (88% [SEM 4.7%; n = 6]) (Figure 4C). To verify whether the rBgFREP2-rBgTEP1 complex dramatically enhanced the ability of M-line haemocytes to killing S. mansoni sporocysts above either factor independently, as did the rBgFREP3-rBgTEP1 complex, a similar experiment was performed, showing that rBgFREP2-rBgTEP1 did not play such a role (Figure 4D). Independent treatments of rBgFREP2 (21% [SEM 3.1%; n = 10]) and rBgTEP1 served as controls (Figure 4—figure supplement 1C), demonstrating that BgFREP2 alone did not facilitate sporocyst killing above control, whereas rBgTEP1 killing (50% [SEM 3.9%; n = 10]) was indistinguishable (p>0.05) from rBgFREP2 and rBgTEP1 combined (55% [SEM 3.7%; n = 10]) (Figure 4D).
These results made us speculate that BgFREP3 was the determining factor controlling immune engagement with sporocysts and subsequent killing. Addition of three anti-rBgFREP3 antibodies to the mixture of rBgFREP3, rBgTEP1 and rBgFREP2 significantly abrogated the increase in the ability of M-line haemocytes to kill sporocysts (51% [SEM 3.1%; n = 6] compared to 83% [SEM 4.8%; n = 6]) (Figure 4C). Pre-incubation of BS-90 haemocytes with the anti-rBgFREP3 antibodies also significantly reduced their ability to destroy sporocysts (68% [SEM 3.1%; n = 6] compared to 88% [SEM 4.7%; n = 6]) (Figure 4C). Combined pre-immunized IgG purified from serum from the same rabbits from which the antibodies were produced was used as a negative control, demonstrating that it did not significantly affect the killing S. mansoni sporocysts by M-line (51% [SEM 3%; n = 6]) and BS-90 haemocytes (90% [SEM 3.7%; n = 6]) (Figure 4—figure supplement 1D). These results suggest that rBgFREP3 plays a central role in initiating the snail haemocyte-mediated anti-S. mansoni immune responses.
Finally, we hypothesize that haemocyte-mediated killing likely involves the production of ROS, which is crucial to the clearance of S. mansoni sporocysts (Hahn et al., 2000; Hahn et al., 2001). To investigate the role of ROS in the combined ability of rBgFREP3 and rBgTEP1 to enhance the ability of M-line haemocytes to kill S. mansoni sporocysts, ROS inhibitors N-acetyl-L-cysteine (NAC), Diphenyleneiodonium (DPI) and catalase were applied to the sporocyst killing assays. Co-incubation of BS-90 haemocytes with NAC, DPI and catalase significantly reduced their ability to kill S. mansoni sporocysts (45% [SEM 5.6%; n = 6], 57% [SEM 4.2%; n = 6] and 60% [SEM 5.9%; n = 6] respectively) compared to BS-90 haemocytes in the vehicle control (89% [SEM 3.1%; n = 6]) by 48 hr post incubation (Figure 4E, Figure 4—figure supplement 1A). The ability of M-line haemocytes primed by the rBgFREP3-rBgTEP1 complex to destroy sporocysts (67% [SEM 4.9%; n = 6]) was also significantly abrogated by the addition of NAC (40% [SEM 3.7%; n = 6]) or DPI (52% [SEM 3.1%; n = 6]) (Figure 4F).
Discussion
In 1984, Granath and Yoshino successfully achieved passive transfer of resistance to S. mansoni from a refractory B. glabrata strain to susceptible snails via injection of cell-free haemolymph (plasma). Similar passive transfer of resistance had previously been shown using an in vitro model (Bayne et al., 1980a; Bayne et al., 1980b; Loker and Bayne, 1982). Although the oxidation of haemoglobin, which is the main protein component (97% of total protein) in B. glabrata plasma was later found to be toxic to S. mansoni sporocysts in long-term cultures (Bender et al., 2002), and thus likely explained the passive transfer study results, further studies suggest that specific anti-parasitic factors must be present at or above a certain threshold level in S. mansoni-resistant snail plasma to stimulate a haemocyte-mediated destruction of sporocysts within 24–48 hr post-infection (Dinguirard et al., 2018). Although many important immune factors have been identified from B. glabrata plasma/haemocytes, such as BgFREPs (Adema et al., 1997), BgTEP1 (Moné et al., 2010), Biomphalysin (Galinier et al., 2013), Toll-like receptors (BgTLRs) (Pila et al., 2016b), granulin (BgGRN) (Pila et al., 2016a) and macrophage migration inhibitory factor (BgMIF) (Baeza Garcia et al., 2010), it is still not known which factors ultimately underpin B. glabrata immunity to S. mansoni. Here, we provide insight into the broader interactions that take place between B. glabrata immune factors that leads to development of an S. mansoni-resistant phenotype.
Previous studies have shown that BgFREPs are capable of binding to digenean trematode sporocysts and are up-regulated in response to larval infection (Adema et al., 1997; Wu et al., 2017; Zhang et al., 2001). BgFREP3 has been shown to be a central part of the anti-S. mansoni immune response (Hanington et al., 2010). BgFREP3 is up-regulated based on three characteristics (age, strain, and acquired resistance) of resistance of B. glabrata to infection with S. mansoni or Echinostoma paraensei (Hanington et al., 2010). Knock-down of BgFREP3 in resistant snails using siRNA-mediated interference altered the phenotype of resistant B. glabrata by increasing susceptibility to E. paraensei infection (Adema, 2015; Hanington et al., 2010). Nevertheless, we have little knowledge of the underlying mechanism by which BgFREP3 interacts with other snail plasma factors in order to signal and trigger an immune response after recognizing the pathogen. In order to explore this mechanism, we conducted a series of pull-down experiments that allowed us to discover the interaction between BgTEP1, Biomphalysin and BgFREP2 with BgFREP3 (Figure 1).
Proteomic analysis of B. glabrata plasma revealed that BgFREP3, BgTEP1 and BgFREP2 display affinity for S. mansoni sporocyst tegumental membrane proteins (Portet et al., 2018; Wu et al., 2017). BgTEP1 was previously reported to play a role in BgFREP2 recognition of S. mansoni sporocyst SmPoMucs, (Moné et al., 2010; Portet et al., 2018). Our immunofluorescence results illustrate that BgFREP3 independently recognizes S. mansoni sporocysts, whereas BgFREP2 must be involved with the participation of BgTEP1 (Figure 2). We speculate that this may be due to their structural differences: BgFREP3 possesses two IgSF domains, yet BgFREP2 has only one; BgFREP3 exists as a multimer in its natural state (Figure 3), whereas BgFREP2 does not (Zhang et al., 2008). Alternatively, it is possible that the targets they recognize are different, so the immunoaffinity reactions that occur are also fundamentally different. A recent report suggests that BgFREPs are likely to form multimers through the coiled-coil region of the ICR. However, this has not been supported by experimental evidence and does not completely rule out the possibility that BgFREP multimer formation is mediated by the FBG or IgSF domain (Gorbushin, 2019).
BgTEP1 and BgFREP3 form a complex without any S. mansoni molecules present (Figure 3). We do not yet know exactly how BgTEP1 is activated during infection. It is possible that BgFREP3 is stabilizing BgTEP1 like the leucine-rich repeat immune protein (LRIM)/Anopheles Plasmodium-responsive Leucine-rich repeat protein 1 (APL1C) complex that has been found to stabilize TEP in Anopheles gambiae, while also guiding it to the sporocyst’s surface (Fraiture et al., 2009). Additionally, our LC-MS/MS results seem to indicate that BgFREP3 interacted with a full-length form of BgTEP1, while previous work has only found the C-terminal portion of BgTEP1 associating with SmPoMucs (Moné et al., 2010). This may indicate that once brought in association with the parasite, BgTEP1 becomes cleaved/activated. BgFREP3 does not require BgTEP1 to recognize pathogens, this suggests BgTEP1 is more likely to play a role in the downstream immune response initiated by BgFREP3. Following the addition of rBgFREP3 and rBgTEP1, plasma demonstrated an increased capacity to kill sporocysts compared to controls (Figure 4A). Toxicity of haemoglobin oxidation to S. mansoni sporocysts was ruled out as a possible mechanism underpinning sporocyst killing because the B. glabrata plasma used in these tests had haemoglobin removed. These studies also demonstrated that recombinant BgFREP3 and BgTEP1 alone were not able to increase sporocyst killing, but showed that the addition of cell-free plasma with both recombinants was required, thereby implying the necessity of another factor(s). Based on our pull-down experiments, we suggest that this factor could be a Biomphalysin. Biomphalysin possesses many similarities to members of the β-PFT superfamily (Howard and Buckley, 1985; MacKenzie et al., 1999; Wilmsen et al., 1992; Xu et al., 2014), and has been shown to have cytolytic activity that is mediated by a plasma factor(s) that remains to be identified (Galinier et al., 2013). Our results suggest a scenario in which BgFREP3 and/or BgTEP1 could be the factors associating with Biomphalysin to promote plasma-mediated sporocyst killing. BgFREP3 and/or BgTEP1 might activate Biomphalysin in an unknown manner, assist in the oligomerization of Biomphalysin while it forms its heptameric channel, or mediate the conversion of the oligomeric pre-pore to a functional pore. Further investigation is warranted to illustrate the role of BgFREP3 and BgTEP1 in the activation of Biomphalysin.
Within 2–3 hr of S. mansoni entry into B. glabrata, haemocytes surround the developing sporocysts forming multi-layered cellular capsules that kill encapsulated larvae within 24–48 hr post-infection (Dinguirard et al., 2018; Loker and Bayne, 1982). This occurs in both susceptible and resistant snail strains and has been replicated in our in vitro functional studies, where only resistant snails can eventually destroy the sporocysts without external assistance. Dinguirard et al. conducted a comparative proteomic analysis on the responses of haemocytes participating in S. mansoni sporocyst encapsulation reactions from susceptible and resistant B. glabrata strains, showing a striking differences in proteins expressed, with susceptible snail haemocytes exhibiting extensive downregulation of protein expression and a lower level of constitutively expressed proteins involved immunity (e.g., BgFREP2) and ROS production compared to resistant snails (Dinguirard et al., 2018). This could explain why BS-90 haemocytes alone can kill S. mansoni sporocysts under normal in vivo conditions. After challenge, the transcript abundance of numerous BgFREPs increases by 3-fold or greater in BS-90 compared to M-line B. glabrata (Adema et al., 1997). Noteworthy in the context of our current study is that following challenge BS-90 snails with S. mansoni, transcript abundance for BgFREP2 increases over 50-fold by 1 day post-exposure (Dinguirard et al., 2018; Hertel et al., 2005), BgFREP3 increases around 4-fold by 1 day post-exposure (Hanington et al., 2010), and BgTEP1 which increases by 2- to 3.5-fold from 6 to 24 hr post-exposure (Portet et al., 2018). These dramatic increases in the abundance of immune-relevant transcripts occurring over the first 12–24 hr post exposure to S. mansoni sporocysts in BS-90 snails aligns closely with our results that demonstrate sporocyst killing by BS-90 haemocytes rapidly increases after 12 hr post-exposure (Figure 4).
Numerous studies have demonstrated the production of ROS by haemocytes in B. glabrata, especially H2O2, which plays a vital role in anti-schistosome defense (Galinier et al., 2013; Hahn et al., 2000; Hahn et al., 2001). Haemocytes from S. mansoni-resistant snails produce significantly more ROS than susceptible snails (Bender et al., 2005; Bender et al., 2007; Goodall et al., 2004). In our study, ROS was critical in BS-90 haemocyte-mediated S. mansoni sporocyst killing, as this ability was significantly reduced after pre-incubation with the ROS inhibitors NAC and DPI (Figure 4E). However, according to the phenomenon of passively transferred resistance, the cytotoxic potential of susceptible haemocytes may not be fundamentally different from resistant snails (Granath and Yoshino, 1984). We infer that M-line plasma may lack some factors or may not achieve sufficient thresholds of certain factors to stimulate haemocytes to produce ROS. It is also possible that M-line haemocytes are lacking specific receptors to receive signals that upregulate ROS to effective levels able to kill S. mansoni sporocysts. Previously, our team identified a toll-like receptor (BgTLR) from haemocyte surface of B. glabrata snails, which differed in abundance between M-line and BS-90 strains (Pila et al., 2016b). It has been repeatedly demonstrated in other organisms that activation of Toll-like receptors is associated with increased intracellular ROS (Asehnoune et al., 2004; Tsung et al., 2007; Wong et al., 2009).
Our results indicate that the BgFREP3-BgTEP1 complex plays a role in raising ROS levels in M-line haemocytes (Figure 4F). We found that BS-90 haemolymph contains more BgFREP3 protein than M-line (Figure 1B). Moreover, the BS-90 haemocytes significantly increased the expression level of BgFREP2 during encapsulating S. mansoni sporocysts compared with susceptible snail haemocytes (Dinguirard et al., 2018). These suggest that BgFREP3 and BgFREP2 may play a crucial role in inducing haemocytes which take part in encapsulating sporocysts to generate ROS. We suppose that BgTEP1 also plays an opsonin role in the B. glabrata snail haemolymph, which interacts with molecules on the surface of haemocytes, thereby promoting the phagocytosis of pathogens.
Our data suggests that there are fundamental differences between the BgFREP3-mediated immune response between BS-90 and M-line B. glabrata. Protein Pull-down experiments yielded two obvious and unique protein bands that were present in BS-90 but not M-line pull-downs. We identified the bands to be a variant of BgFREP3.3 and BgFREP2 (Figure 1C), showing different immune factor interactomes between different strains. This suggests that BgFREP3 variants and BgFREP2 in BS-90 plasma are more prone to rBgFREP3 binding, and the combination of different versions of BgFREPs seems to play an important and unknown role in snail resistance. Both BgFREP2 and BgFREP3 are characterized by high diversity, our results imply that the versions of BgFREP2 and BgFREP3 in the two snail strains are different. After exposure to S. mansoni, the expression of BgFREP2 in resistant snails is superior to that of susceptible snails (Dinguirard et al., 2018; Gordy et al., 2015; Hertel et al., 2005). This again suggests that BgFREP2 is important in determining the outcome of the compatibility of B. glabrata against S. mansoni. Our study implies that BgFREP3 seems to play an ‘all or none’ switching effect in determining B.glabrata-S. mansoni compatibility, while BgFREP2 seems to play an additive role.
It has been decades since the discovery and initial characterization of BgFREPs in the B. glabrata immune response to S. mansoni. While numerous studies since have implicated BgFREP3 and BgFREP2 along with a suite of other immune factors, as being important elements of the snail immune response to S. mansoni, how the response is coordinated has remained elusive. Our study presents a model in which many of the known determinants of snail resistance to S. mansoni work in concert to protect the snail host against infection. We map a mechanism for the interaction of BgFREP3, BgTEP1, BgFREP2 and Biomphalysin with S. mansoni sporocysts in B. glabrata snail haemolymph that ultimately leads to sporocyst killing (Figure 5). Central to this response is BgFREP3, which is able to recruit unique representatives of both BgFREP2 and BgFREP3 in S. mansoni-resistant BS-90 B. glabrata. With this new-found understanding of the B. glabrata immune response comes the ability to now undertake comprehensive assessments of how modifications to both the snail host and the parasite influence the underpinning immunological drivers of compatibility in this important model for studying human schistosomes.
Figure 5
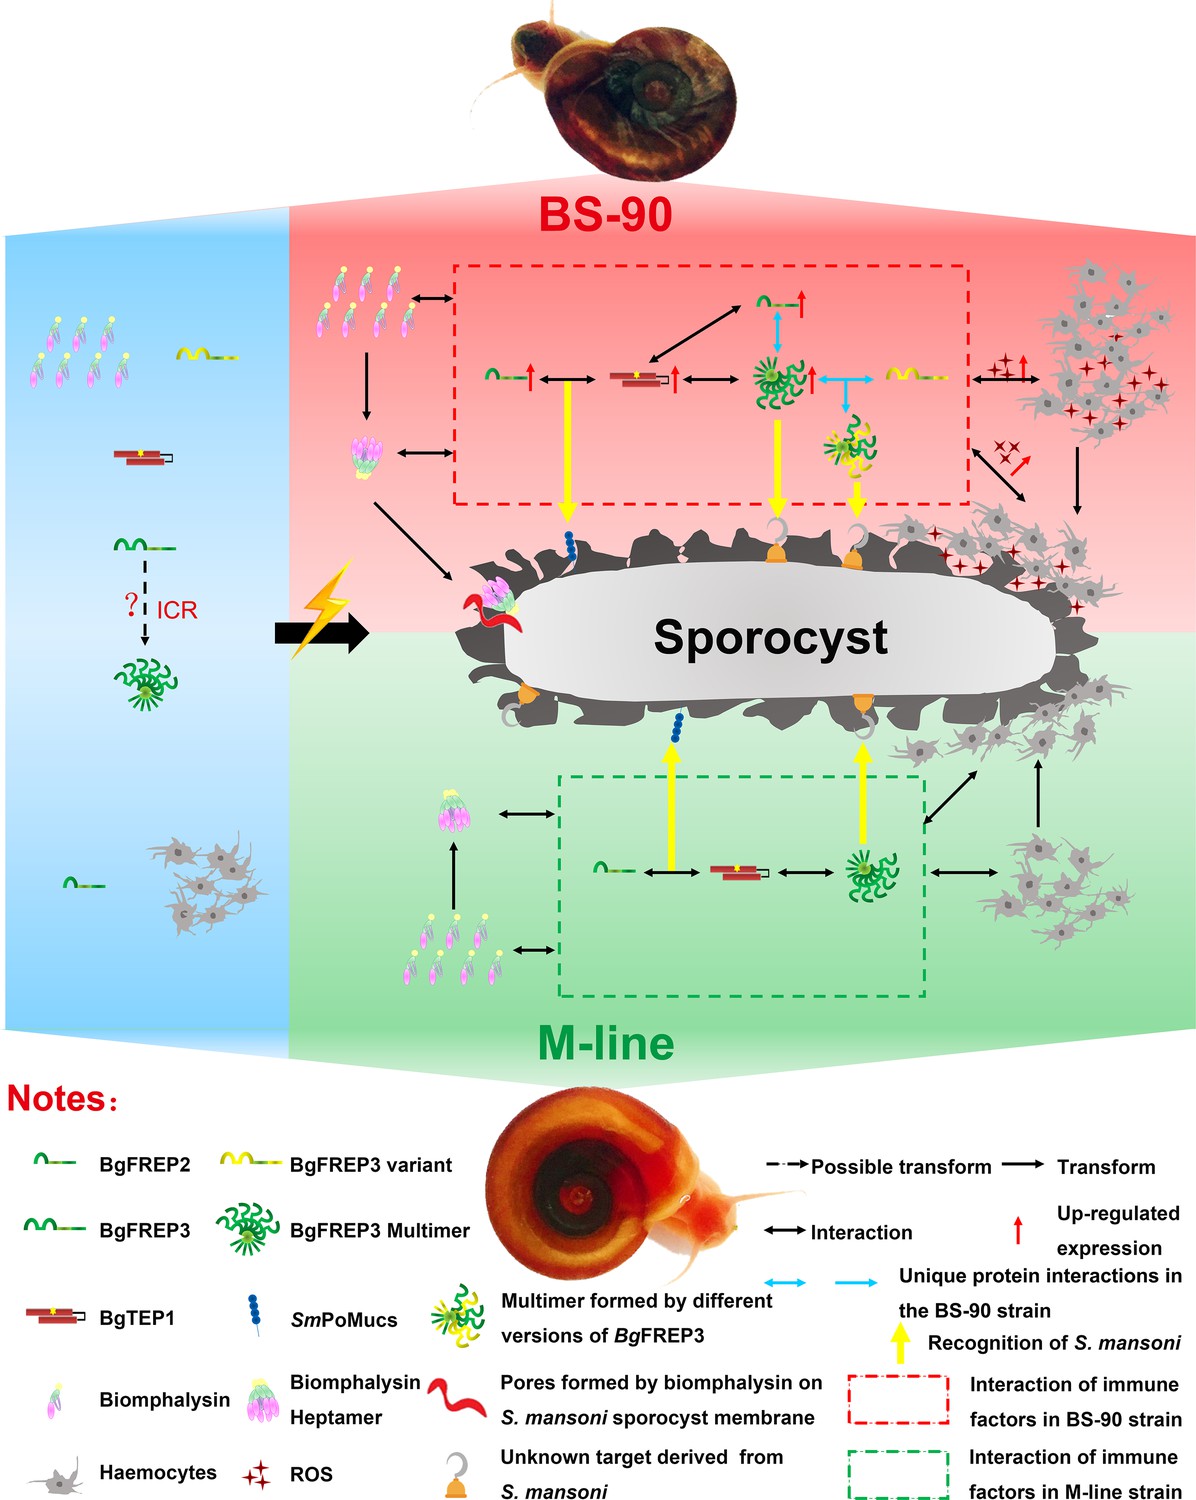
Interaction of BgFREP3, BgFREP2, BgTEP1 and Biomphalysin in B. glabrata snail haemolymph and possible functional mechanisms against S. mansoni infection.
This figure is a schematic drawing based on the results of previous studies and our work. In the absence of S. mansoni invasion (blue background area), both M-line and BS-90 B. glabrata snail hemolymphs contain BgFREPs, BgTEP1 and Biomphalysin and other immune factors. Upon S. mansoni infection, BS-90 strain (red background area) and M-line (green background area) strains demonstrate different protein interaction repertoires (red dotted frame in BS-90, green dotted frame in M-line). According to our pull-down results, BgFREP3 in BS-90 plasma specifically interacts with BgFREP2 and other versions of BgFREP3 (blue horizontal one-way or two-way arrows). In addition, compared with the M-line strain, the BS-90 strain has more haemocytes (immune effector cells) in the snail haemolymph, and BgFREP3, BgFREP2, and BgTEP1 are all up-regulated (red upward arrow). The more complex interactome of immune factors in BS-90 plasma results in higher levels of ROS (with cytotoxic activity) secreted by haemocytes. In conclusion, different coordination of humoral immune factors between BS-90 and M-line strains aids in dictating compatibility to S. mansoni infection.
Materials and methods
Live material and experimental treatments
Request a detailed protocolM-line and BS-90 strain B. glabrata snails were used in this study. M-line and BS-90 strain B. glabrata snails, and S. mansoni were maintained at the University of Alberta as described previously (Pila et al., 2016a). NMRI strain of S. mansoni was obtained from infected Swiss-Webster mice provided by the NIH/NIAID Schistosomiasis Resource Center at the Biomedical Research Institute (Cody et al., 2016). All animal work observed ethical requirements and was approved by the Canadian Council of Animal Care and Use Committee (Biosciences) for the University of Alberta (AUP00000057).
Recombinant BgFREP3, BgTEP1 and BgFREP2 Synthesis and Purification
Request a detailed protocolRecombinant BgFREP3 (rBgFREP3, derived from GenBank: AY028461.1 sequence information from M-line strain, Synthesized by GenScript), BgTEP1 (rBgTEP1, GenBank: HM003907.1, sequence information from Brazil strain, isolated from M-line strain) and BgFREP2 (rBgFREP2, GenBank: AY012700.1, sequence information from M-line strain, isolated from M-line strain) were generated by using the Gateway cloning system according to the manufacturer’s instructions (Life Technologies) as previously described (Hambrook et al., 2018; Pila et al., 2016a; Pila et al., 2017b; Pila et al., 2016b), with primer information as shown in Table. S1 and Sf9 cell codon-optimized BgFREP3 gene sequence information as shown in Figure 1—figure supplement 1. Briefly, the coding regions of BgFREP3, BgTEP1 and BgFREP2 were amplified with Phusion high-fidelity DNA polymerase from targeted DNA templates in pUC57 plasmids (synthesized by GenScript) or cDNA generated by reverse transcription of mRNA derived from M-line strain. Blunt-end PCR products were cloned into the pENTR/D-TOPO vectors to generate entry clones. Plasmids from these entry clones were extracted and cloned into pIB/V5-His-DEST vectors in a Clonase recombination reaction to produce the expression clones. Recombinant plasmids were extracted from the expression clones and then transfected into Sf9 insect cells using Cellfectin reagent (Life Technologies). Cells that survived the screening of the antibiotic blasticidin (Thermo Fisher Scientific) were collected and lysed. Protein expression of rBgFREP3, rBgTEP1 and rBgFREP2 were detected by Western blot using monoclonal antibody against the V5 tag (Thermo Fisher Scientific) on the recombinant proteins.
Sf9 cells stably expressing recombinant rBgFREP3, rBgTEP1 and rBgFREP2 were selected, some of them were frozen as a seed stock and the rest were maintained in a medium containing blasticidin. Cultures of Sf9 cells expressing recombinant proteins were scaled up, and the pellet (containing rBgFREP3) or the medium (containing secreted rBgTEP1 and rBgFREP2) was collected. Recombinant proteins were purified from the cell pellet lysate or the culture medium with HisTrap FF (GE Healthcare) columns using fast protein liquid chromatography (ÄKTA Pure, GE Healthcare). Purified rBgFREP3, rBgTEP1 and rBgFREP2 were dialyzed against PBS buffer twice for 2 hr each and then once overnight using Slide-A-Lyzer dialysis kit (Thermo Scientific).
Preparation of B. glabrata plasma and pull-down experiment
Request a detailed protocolHaemolymph was obtained from M-line and BS-90 strain B. glabrata snails by the head-foot retraction method (Pila et al., 2016a). Upon collection, haemolymph from ~5 snails of each strain (8–12 mm in diameter) was immediately placed in 1.5 mL tubes on ice, EDTA was added to a final concentration of 0.5 mM. Samples were centrifuged twice at 20,000 × g for 15 min and the cell-free fraction was collected. The 4 M Imidazole Stock Solution was added to a final concentration of 10 mM imidazole. Plasma samples were used immediately for subsequent pull-down experiment.
Pull-down assays were conducted by using Pull-Down PolyHis Protein:Protein Interaction Kit (Thermo Scientific) according to the manufacturer’s instructions with some modifications. Briefly, first we prepared the ‘bait’ proteins, rBgFREP3 and rBgTEP1, from previously purified proteins or Sf9 cell lysate expressing rBgFREP3 or concentrated medium containing rBgTEP1. We then loaded the HisPur Cobalt Resin equilibrated for at least 30 min at room temperature onto the column according to the kit instructions. The prepared polyhistidine-tagged rBgFREP3 and rBgTEP1 was immobilized on the columns after five times washing with wash solution [1:1 of Tris-buffered saline (TBS) solution: Pierce Lysis Buffer containing 10 mM imidazole]. For cell lysates or concentrated medium containing rBgFREP3 and rBgTEP1, protein expression was previously analyzed by SDS-PAGE and Western blot, and 800 μL was added; for purified rBgFREP3, at least 150 µg (about 500 μL) was added. After incubation for 2 hr at room temperature or overnight at 4°C, the columns were washed 5–8 times with wash solution and then 800 µL of prepared plasma (prey) containing 10 mM imidazole was added to the columns. The columns were incubated at 4°C for overnight with gentle rocking motion every few hours. After that, the columns were washed 5–8 times with the wash solution, and then eluent (washing solution containing 290 mM imidazole) was added and incubated at room temperature for 30 min with gentle rocking on a rotating platform.
The eluent collected by centrifugation was heat-treated in a Laemmli loading buffer containing a reducing agent (β-mercaptoethanol) followed by SDS-PAGE analysis and silver staining (Pierce Silver Stain for Mass Spectrometry, Thermo Scientific) was performed according to the manufacturer's instructions. After silver staining, we excised the desired bands for LC-MS/MS to identify the proteins.
Mass spectrometry analysis
Request a detailed protocolMass spectrometry and protein identification was completed by Alberta Proteomics and Mass Spectrometry Facility at University of Alberta. In-gel trypsin digestion was performed on the samples. Briefly, the excised gel bands were reduced (10 mM mercaptoethanol in 100 mM bicarbonate) and alkylated (55 mM iodoacetamide in 100 mM bicarbonate). After dehydration enough trypsin (6 ng/μL, Promega Sequencing grade) was added to just cover the gel pieces and the digestion was allowed to proceed overnight (~16 hr) at room temperature. Tryptic peptides were first extracted from the gel using 97% water/2% acetonitrile/1% formic acid followed by a second extraction using 50% of the first extraction buffer and 50% acetonitrile.
The digested samples containing tryptic peptides were resolved and ionized by using nanoflow HPLC (Easy-nLC II, Thermo Scientific) coupled to an LTQ Orbitrap XL hybrid mass spectrometer (Thermo Scientific). Nanoflow chromatography and electrospray ionization were accomplished by using a PicoFrit fused silica capillary column (ProteoPepII, C18) with 100 μm inner diameter (300 Å, 5 μm, New Objective). The mass spectrometer was operated in data-dependent acquisition mode, recording high-accuracy and high-resolution survey Orbitrap spectra using external mass calibration, with a resolution of 30,000 and m/z range of 400–2000. The fourteen most intense multiply charged ions were sequentially fragmented by using collision induced dissociation, and spectra of their fragments were recorded in the linear ion trap; after two fragmentations all precursors selected for dissociation were dynamically excluded for 60 s. Data was processed using Proteome Discoverer 1.4 (Thermo Scientific) and a B. glabrata proteome database (UniProt) was searched using SEQUEST (Thermo Scientific). The proteome database was a genome assembly (Genome Accession: GCA_000457365) (Adema et al., 2017) , with download link https://www.uniprot.org/proteomes/UP000076420. Search parameters included a precursor mass tolerance of 10 ppm and a fragment mass tolerance of 0.8 Da. Peptides were searched with carbamidomethyl cysteine as a static modification and oxidized methionine and deamidated glutamine and asparagine as dynamic modifications.
Sporocyst transformations of S. mansoni and immunofluorescence staining
Request a detailed protocolMiracidia were obtained from eggs isolated from the livers of mice infected with S. mansoni (NMRI) as described previously (Hambrook et al., 2018). Briefly, newly hatched miracidia were collected for cultivation in Chernin’s Balanced Salt Solution (CBSS) (Chernin, 1963) containing 1 g/L each of glucose and trehalose as well as 1% pen-strep antibiotics (Life Technologies). After cultivation for 24 hr at 26°C under normoxic conditions, most miracidia transformed to primary sporocysts. These experiments were divided into two different treatment methodologies, and carried out in parallel. One treatment method was the interaction of fixed sporocysts with recombinant proteins. In this method, sporocysts were washed five times with snail PBS (sPBS) (Yoshino and Laursen, 1995), grouped and transferred to 15 mL centrifuge tubes (Corning). All in-tube washes were performed by centrifugation for 2 min at 300 × g. Primary sporocysts were fixed with 2% paraformaldehyde/sPBS (pH 7.2) at 4°C overnight, followed by five washes with sPBS and 1 hr incubation in 5% BSA/0.02% azide/sPBS (blocking buffer) at room temperature. Sporocysts were then incubated with rBgFREP3 (450 ng/μL), rBgTEP1 (18 ng/μL) and rBgFREP2 (70 ng/μL) in blocking buffer overnight at 4°C; while control groups were incubated in blocking buffer without recombinant proteins.
In the other treatment method, live primary sporocysts were collected and grouped, washed three times with CBSS, and directly incubated with recombinant proteins (concentrations the same as in the fixed treatment method) in a 26°C incubator. Sporocysts were then washed, fixed, washed, and blocked, as per the same steps as the previous treatment method.
From then on, sporocysts from both fixed and alive treatment methods were washed five times with 1% BSA/sPBS, sporocysts and then treated with anti-V5 antibody (Life Technologies) diluted 1:400 in blocking buffer. Following primary antibody treatment, sporocysts were washed five times with 1% BSA/sPBS and incubated with a solution containing 7.5 U/mL Alexa Fluor 488 phalloidin (Invitrogen) and 4 µg/mL Alexa Fluor 633 goat anti-mouse secondary antibody (Invitrogen) in blocking buffer overnight at 4°C. Finally, sporocysts were washed five times with 1% BSA/sPBS, given 25 μL of DAPI, incubated for 5 min at room temperature, and transferred into glass bottom microwell dishes (MatTeK, USA). Sporocysts were imaged using an Leica TCS SP5 laser scanning confocal microscope and analyzed using ImageJ (NIH) and Photoshop CS4 (Adobe Systems Inc, USA).
Anti- BgFREP3 polyclonal antibody generation and validation
Request a detailed protocolThe IgSF1 and FBG domains of BgFREP3 (AAK28656.1) were screened for regions of presumed antigenicity using the Optimum Antigen design tool (GenScript). Three polyclonal antibodies were generated specific for different peptides (14–15 amino acids long,~4.4 kDa) targeting each domain. The information of these peptides is: anti-IgSF #1: CSFKKDDLSDSKQRS; anti-IgSF #2: CHNKYSEGRIDKSSN; anti-IgSF #3: CNINKDLDFKEQNIT; anti-FBG #1: TTFDRDNDEYSYNC; anti-FBG #2: GWKEYRDGFGDYNIC and anti-FBG #3: CLNGKWGSSDFAKGV. Peptides were synthesized by GenScript and used to immunize rabbits. Rabbits received a primary immunization and two secondary boosts at 2 and 5 weeks. One week after the second boost, rabbits were exsanguinated and the serum IgG was affinity-purified using protein A/G affinity column. These were further purified using affinity resin conjugated with the immunization peptides. The anti-BgFREP3 antibodies used in this study were effective for Western blot detections at a concentration of 1:1000.
The purified antibodies were supplied by GenScript along with synthesized peptides and pre-immune serum. Specificity of the antibodies was tested against the respective peptides as well as snail plasma and haemocyte lysates. Dot blots were initially used to determine whether the antibodies recognized their peptides as well as the specificity of the recognition. Briefly, 2 µL of each supplied peptide was slowly pipetted in one spot on a nitrocellulose membrane that was divided into a grid with a pencil. The deposited peptides were dried at room temperature for about 10 min, creating a spot of approximately 2–3 mm. The membrane was then incubated in blocking buffer and processed using the same procedure described for Western blot following sample transfer to nitrocellulose membranes. In order to determine that the peptides were not being recognized by any pre-immune serum components, the above procedure was followed exactly with the exception that the respective pre-immune sera were used for the primary incubations in place of antibodies.
Western and far-Western blot analysis
Request a detailed protocolTo test whether rBgTEP1 complexes with rBgFREP3 and rBgFREP2, purified rBgTEP1 was incubated with rBgFREP3 or rBgFREP2 in the following ratios (wt/wt in µg): 1:1, 1:0.75, 1:0.5, and 1:0.25 in 1.5 mL tubes for 2 hr at room temperature on a Labquake shaker (ThermoFisher Scientific) to allow potential complexes to form. After the incubation, samples were subjected to Western blot detection under denaturing (Laemmli protein loading buffer with β-mercaptoethanol and heated at 95°C for 10 min) and non-denaturing (no β-mercaptoethanol nor heating) conditions, respectively.
The Western blot experiment process was as described previously (Pila et al., 2017b). Samples were loaded on 6–14% (vol/vol) SDS-PAGE gels and run on the Mini PROTEAN Tetra system (Bio-Rad) at 150 V for 1.5–2 hr. Samples were then transferred for 1.5 hr onto 0.45 μm supported nitrocellulose membranes (Bio-Rad). Blocking was done for 1 hr at room temperature in 5% (wt/vol) skimmed milk or bovine serum albumin (BSA) prepared in TBS solution plus 0.1% Tween-20 (TBS-T buffer) before staining for 1 hr in anti-V5 mouse primary antibody at a dilution of 1:5000 in blocking buffer. Membranes were washed in TBS-T buffer for 10 min, then twice for 5 min each and once in TBS solution for 5 min. Membranes were then incubated for 1 hr in HRP-conjugated goat anti-mouse antibody diluted 1:5000 in blocking buffer followed by a wash step as described above. Finally, the blot was developed by incubating the membranes in SuperSignal West Dura Extended Duration substrate (Thermo Scientific). Chemiluminescent signals were acquired on the ImageQuant LAS 4000 machine (GE Healthcare).
To detect the BgFREP3 background expression in the B. glabrata snail plasma, the haemolymph of four snails was obtained from each of M-line and BS-90 strain B. glabrata snails. The haemolymph from each snail was diluted twice with sPBS buffer (containing 0.5 mM EDTA). Samples were centrifuged at 20,000 × g for 5 min and the supernatant (cell-free plasma) was transferred into new 1.5 mL tubes. After being centrifuged at 20,000 × g for 5 min again, the supernatant was collected and used for quantification. Samples (330 μg/well) were used for subsequent Western blot analysis. The primary antibodies were polyclonal antibodies raised in rabbits against the IgSF and FBG domains of rBgFREP3 (1:500 dilution) and the secondary antibody was a HRP-conjugated goat anti-rabbit IgG (1:5000 dilution).
Far-Western blotting is used to probe a membrane containing transferred protein with another protein to detect specific protein-protein interactions (Wu et al., 2007). In our study, we detected rBgTEP1 (‘prey’ protein) that were separated by SDS-PAGE and transferred onto a nitrocellulose membrane before being detected by biotinylated rBgFREP3 and rBgFREP2 (‘bait’ or ‘probe’ proteins) and a streptavidin-HRP chemiluminescent detection system. If rBgTEP1 forms a complex with rBgFREP3 or rBgFREP2, rBgFREP3 would be detected on spots in the membrane where rBgTEP1 was located. First, rBgFREP3 and rBgFREP2 was biotinylated with EZ-Link Sulfo-NHS-LC-Biotin (Thermo Scientific) according to the manufacturer's instructions. Gradually decreasing amounts (2.0, 1.3, 0.6 and 0 µg) of rBgFREP1 were separated by SDS-PAGE, and transferred to a membrane, as in a standard Western blot. Recombinant BgTEP1 in the membrane was then denatured and renatured as described previously (Wu et al., 2007). The membrane was then blocked and probed with biotinylated rBgFREP3 or rBgFREP2. After washing as described above in a standard Western blot, the membrane was incubated with streptavidin-HRP diluted 1:100,000 in blocking buffer at room temperature for 1 hr. Chemiluminescent signals were detected using the ImageQuant LAS 4000 machine (GE Healthcare).
Quantitative real-time PCR analysis of BgTEP1 expression
Request a detailed protocolA TRIzol reagent was utilized to extract total RNA from five whole unchallenged snails from each strain independently, after which RNA was purified using a PureLink RNA mini kit (Life Technologies). A NanoVue spectrophotometer (ThermoFisher Scientific) was used to determine RNA concentration, and first-strand cDNA synthesis using the qScript cDNA synthesis kit (Quanta Biosciences) was performed using 1 μg of RNA template. The cDNA was diluted fivefold, and 5 µL was used as template in RT-PCR using primers (Supplementary file 1) specific for BgTEP1 and B. glabrata β-actin (BgActin) in a SYBR Green detection system (PerfeCTa SYBR Green FastMix; Quanta Biosciences). All RT-PCRs were performed on a QuantStudio 3 PCR system (Applied Biosystems) using the following thermocycling conditions: initial hold at 95°C for 10 min, followed by 40 cycles of 95°C for 15 s and 60°C for 1 min, with data collection every cycle. Specificity for the gene specific primers RT-PCR was confirmed by continuous melt curve analysis.
In vitro S. mansoni sporocyst killing assays
Request a detailed protocolHaemolymph from 25 M-line or BS-90 strain B. glabrata, sterilized as reported in Hahn et al. (2001), was pooled into 1.5 mL tubes and kept on ice. Haemocytes were isolated from plasma by centrifugation at 70 × g for 10 min at 4°C followed by aspiration of the cell free plasma, which was kept for assessment of plasma-mediated killing of sporocysts. Haemocytes were resuspended in modified Bge-cell medium (mBge) medium [22% Schneider’s Drosophila medium (Thermo Scientific), 7 mM D-glucose, 24 mM NaCl, and 20 mg/mL gentamicin at pH 7.4] and washed three times following the same centrifugation protocol. Haemocytes were then resuspended to a final concentration of 50 cells/µL in mBge medium and 200 µL of this suspension was added to the wells of a 96-well tissue culture plate pre-treated with poly-L-lysine that contained 10 s. mansoni sporocysts that were transformed using previously published protocols (Hambrook et al., 2018). Treatment consisted of 200 pM of each recombinant protein (BgFREP3, BgTEP1, BgFREP2). Three anti-BgFREP3 antibodies (anti-IgSF #1 and #3, anti-FBG #1) that were generated to peptides within the IgSF and FBG domains were used as a cocktail (combined concentration of 2.5 mg/mL) were used the antibody blocking assays. Sporocyst viability was assessed using the protocol published by Hahn et al. (2001). Briefly, Propidium iodide (Millipore Sigma), was added to each well to a final concentration of 10 µg/mL. Sporocyst viability was assessed using a fluorescent inverted microscope (Zeiss) starting at 3 hr post incubation with haemocytes/plasma and then measured again at 6, 12, 24, 36 and 48 hr post incubation. Sporocyst death was determined by propidium iodide-staining of the nuclei of the sporocyst. Any sporocyst deemed dead, was left in the well until the end of the time-course so that the experimental conditions were not disturbed differentially in wells where sporocyst mortality was more frequent.
Cell-free plasma from M-line and BS-90 snails was ultracentrifuged at 30,000 rpm for 3 hr at 4°C to remove haemoglobin, which is known to have a toxic effect on sporocysts (Bender et al., 2002). Haemoglobin removal using ultracentrifugation has been shown to lead to no qualitative differences in plasma protein composition other than the depletion of haemoglobin (Zelck et al., 1995). Ultracentrifuged plasma was mixed 50:50 with mBge medium at room temperature and then incubated with 10 s. mansoni sporocysts according to the protocol outlined above.
Assessment of reactive oxygen species production by haemocytes in vitro
Request a detailed protocolTo assess the role that ROS had on sporocyst killing by haemocytes the above haemocyte in vitro killing assays were repeated with addition of three well characterized inhibitors of ROS; diphenyleneiodonium chloride (DPI) and N-acetyl-L-cysteine (NAC) and catalase. All ROS inhibitors (DPI at a final concentration of 150 nM, NAC at a final concentration of 1 mM and a working concentration of 14000 units of catalase/mL) were incubated along with haemocytes (and plasma in the case of catalase) and S. mansoni sporocysts as described above in the haemocyte-based sporocyst killing assay.
Bioinformatic and statistical analysis
Request a detailed protocolWe used Clustal Omega (https://www.ebi.ac.uk/Tools/msa/clustalo/) to align the amino acid sequences for BgTEPs, Biomphalysins and BgFREPs which acquired from GenBank [National Center for Biotechnology Information (NCBI)]. The alignment files were downloaded and visually inspected for obvious inaccuracies, modified if need be, and then annotated based on information provided by NCBI. To show the distribution of the identified peptides over a full length sequence, the amino acid sequences of BgTEP1.5 (ADE45333.1), Biomphalysin (A0A182YTN9) and BgMFREP2 (AAK13550.1) were imported into Vector NTI Advance 11.5 (Thermo Fisher Scientific) and the identified peptides were annotated. Images produced by Vector NTI software were saved by FSCapture and further processed with FSCapture and Adobe Photoshop CS4. To determine significant differences in sporocysts killing assays, one-way ANOVA with Tukey’s post hoc tests were performed using GraphPad Prism version 6.0 f for Mac OS X (GraphPad; www.graphpad.com). Statistical significance threshold was set at p≤0.05.
Data availability
All data generated or analysed during this study are included in the manuscript and supporting files.
References
-
Fibrinogen-Related proteins (FREPs) in mollusksResults and Problems in Cell Differentiation 57:111–129.https://doi.org/10.1007/978-3-319-20819-0_5
-
Whole genome analysis of a schistosomiasis-transmitting freshwater snailNature Communications 8:15451.https://doi.org/10.1038/ncomms15451
-
Involvement of reactive oxygen species in Toll-like receptor 4-dependent activation of NF-kappa BThe Journal of Immunology 172:2522–2529.https://doi.org/10.4049/jimmunol.172.4.2522
-
Macrophagelike hemocytes of resistant Biomphalaria glabrata are cytotoxic for sporocysts of Schistosoma mansoni in vitroThe Journal of Parasitology 66:413–419.https://doi.org/10.2307/3280740
-
Proteinase inhibitory activity in the plasma of a mollusc: evidence for the presence of α-macroglobulin in Biomphalaria glabrataComparative Biochemistry and Physiology Part B: Comparative Biochemistry 102:821–824.https://doi.org/10.1016/0305-0491(92)90086-7
-
Variation in expression of Biomphalaria glabrata SOD1: a potential controlling factor in susceptibility/resistance to Schistosoma mansoniDevelopmental & Comparative Immunology 31:874–878.https://doi.org/10.1016/j.dci.2006.12.005
-
Observations on hearts explanted in vitro from the snail australorbis glabratusThe Journal of Parasitology 49:353–364.https://doi.org/10.2307/3275797
-
The NIH-NIAID schistosomiasis resource center at the biomedical research institute: molecular reduxPLOS Neglected Tropical Diseases 10:e0005022.https://doi.org/10.1371/journal.pntd.0005022
-
The transmission of digenetic Trematodes: style, elegance, complexityIntegrative and Comparative Biology 42:304–312.https://doi.org/10.1093/icb/42.2.304
-
Constitutive differences in cu/Zn superoxide dismutase mRNA levels and activity in hemocytes of Biomphalaria glabrata (Mollusca) that are either susceptible or resistant to Schistosoma mansoni (Trematoda)Molecular and Biochemical Parasitology 137:321–328.https://doi.org/10.1016/j.molbiopara.2004.06.011
-
Derivatives of the lectin complement pathway in lophotrochozoaDevelopmental & Comparative Immunology 94:35–58.https://doi.org/10.1016/j.dci.2019.01.010
-
The role of fibrinogen-related proteins in the gastropod immune responseFish & Shellfish Immunology 46:39–49.https://doi.org/10.1016/j.fsi.2015.03.005
-
Production of reactive oxygen species by hemocytes of Biomphalaria glabrata: carbohydrate-specific stimulationDevelopmental & Comparative Immunology 24:531–541.https://doi.org/10.1016/S0145-305X(00)00017-3
-
A somatically diversified defense factor, FREP3, is a determinant of snail resistance to schistosome infectionPLOS Neglected Tropical Diseases 6:e1591.https://doi.org/10.1371/journal.pntd.0001591
-
The primary role of fibrinogen-related proteins in invertebrates is defense, not coagulationJournal of Innate Immunity 3:17–27.https://doi.org/10.1159/000321882
-
Activation of the hole-forming toxin aerolysin by extracellular processingJournal of Bacteriology 163:336–340.https://doi.org/10.1128/JB.163.1.336-340.1985
-
Studies on resistance in snails: specific resistance induced by irradiated miracidia of Echinostoma lindoense in Biomphalaria glabrata snailsInternational Journal for Parasitology 5:627–631.https://doi.org/10.1016/0020-7519(75)90062-4
-
Studies on resistance in snails: a specific tissue reaction to Echinostoma lindoense in Biomphalaria glabrata snailsInternational Journal for Parasitology 5:621–625.https://doi.org/10.1016/0020-7519(75)90061-2
-
In vitro encounters between Schistosoma mansoni primary sporocysts and hemolymph components of susceptible and resistant strains of Biomphalaria glabrataThe American Journal of Tropical Medicine and Hygiene 31:999–1005.https://doi.org/10.4269/ajtmh.1982.31.999
-
Analysis of receptor binding by the channel-forming toxin aerolysin using surface plasmon resonanceJournal of Biological Chemistry 274:22604–22609.https://doi.org/10.1074/jbc.274.32.22604
-
Schistosomiasis from a snail's Perspective: Advances in Snail ImmunityTrends in Parasitology 33:845–857.https://doi.org/10.1016/j.pt.2017.07.006
-
The protein pheromone temptin is an attractant of the gastropod Biomphalaria glabrataJournal of Comparative Physiology A 203:855–866.https://doi.org/10.1007/s00359-017-1198-0
-
Genetic studies of pathologic conditions and susceptibility to infection in Biomphalaria glabrataAnnals of the New York Academy of Sciences 266:394–410.https://doi.org/10.1111/j.1749-6632.1975.tb35118.x
-
HMGB1 release induced by liver ischemia involves Toll-like receptor 4 dependent reactive oxygen species production and calcium-mediated signalingThe Journal of Experimental Medicine 204:2913–2923.https://doi.org/10.1084/jem.20070247
-
Detecting protein-protein interactions by far western blottingNature Protocols 2:3278–3284.https://doi.org/10.1038/nprot.2007.459
-
Anopheles gambiae innate immunityCellular Microbiology 12:1–9.https://doi.org/10.1111/j.1462-5822.2009.01388.x
-
The plasma proteins of Biomphalaria glabrata in the presence and absence of Schistosoma mansoniDevelopmental & Comparative Immunology 19:181–194.https://doi.org/10.1016/0145-305X(95)00012-I
Article and author information
Author details
Funding
Natural Sciences and Engineering Research Council of Canada (2018-05209)
- Patrick Hanington
Natural Sciences and Engineering Research Council of Canada (2018- 522661)
- Patrick Hanington
National Natural Science Foundation of China (31272682)
- Xinzhong Wu
Natural Science Foundation of Guangxi Province (2016JJD130059)
- Xinzhong Wu
The funders had no role in study design, data collection and interpretation, or the decision to submit the work for publication.
Acknowledgements
B. glabrata snails provided by the NIAID Schistosomiasis Resource Center of the Biomedical Research Institute (Rockville, MD) through NIH-NIAID Contract HHSN272201700014I for distribution through BEI Resources. Microscopy was performed in the University of Alberta, Faculty of Medicine and Dentistry’s Cell Imaging Core. These studies were supported by funds provided by the Natural Sciences and Engineering Research Council of Canada #2018–05209 and 2018–522661 (PCH), and National Natural Science Foundation of China (NSFC 31272682), Guangxi Natural Science Foundation for Young Scientists (2018JJB140423), Guangxi 16 Natural Science Foundation (Key Project, 2016JJD130059) Special Fund for Team Building, Beibu Gulf University (Former Qinzhou University, 2015).
Ethics
Animal experimentation: All animal work observed ethical requirements and was approved by the Canadian Council of Animal Care and Use Committee (Biosciences) for the University of Alberta (AUP00000057).
Version history
- Received: September 7, 2019
- Accepted: January 7, 2020
- Accepted Manuscript published: January 9, 2020 (version 1)
- Version of Record published: January 20, 2020 (version 2)
Copyright
© 2020, Li et al.
This article is distributed under the terms of the Creative Commons Attribution License, which permits unrestricted use and redistribution provided that the original author and source are credited.
Metrics
-
- 1,241
- views
-
- 216
- downloads
-
- 18
- citations
Views, downloads and citations are aggregated across all versions of this paper published by eLife.
Download links
A two-part list of links to download the article, or parts of the article, in various formats.
Downloads (link to download the article as PDF)
Open citations (links to open the citations from this article in various online reference manager services)
Cite this article (links to download the citations from this article in formats compatible with various reference manager tools)
Coordination of humoral immune factors dictates compatibility between Schistosoma mansoni and Biomphalaria glabrata
eLife 9:e51708.
https://doi.org/10.7554/eLife.51708
Further reading
-
- Microbiology and Infectious Disease
In the Firmicutes phylum, GpsB is a membrane associated protein that coordinates peptidoglycan synthesis with cell growth and division. Although GpsB has been studied in several bacteria, the structure, function, and interactome of Staphylococcus aureus GpsB is largely uncharacterized. To address this knowledge gap, we solved the crystal structure of the N-terminal domain of S. aureus GpsB, which adopts an atypical, asymmetric dimer, and demonstrates major conformational flexibility that can be mapped to a hinge region formed by a three-residue insertion exclusive to Staphylococci. When this three-residue insertion is excised, its thermal stability increases, and the mutant no longer produces a previously reported lethal phenotype when overexpressed in Bacillus subtilis. In S. aureus, we show that these hinge mutants are less functional and speculate that the conformational flexibility imparted by the hinge region may serve as a dynamic switch to finetune the function of the GpsB complex and/or to promote interaction with its various partners. Furthermore, we provide the first biochemical, biophysical, and crystallographic evidence that the N-terminal domain of GpsB binds not only PBP4, but also FtsZ, through a conserved recognition motif located on their C-termini, thus coupling peptidoglycan synthesis to cell division. Taken together, the unique structure of S. aureus GpsB and its direct interaction with FtsZ/PBP4 provide deeper insight into the central role of GpsB in S. aureus cell division.
-
- Microbiology and Infectious Disease
Mechanisms by which Mycobacterium tuberculosis (Mtb) evades pathogen recognition receptor activation during infection may offer insights for the development of improved tuberculosis (TB) vaccines. Whilst Mtb elicits NOD-2 activation through host recognition of its peptidoglycan-derived muramyl dipeptide (MDP), it masks the endogenous NOD-1 ligand through amidation of glutamate at the second position in peptidoglycan side-chains. As the current BCG vaccine is derived from pathogenic mycobacteria, a similar situation prevails. To alleviate this masking ability and to potentially improve efficacy of the BCG vaccine, we used CRISPRi to inhibit expression of the essential enzyme pair, MurT-GatD, implicated in amidation of peptidoglycan side-chains. We demonstrate that depletion of these enzymes results in reduced growth, cell wall defects, increased susceptibility to antibiotics, altered spatial localization of new peptidoglycan and increased NOD-1 expression in macrophages. In cell culture experiments, training of a human monocyte cell line with this recombinant BCG yielded improved control of Mtb growth. In the murine model of TB infection, we demonstrate that depletion of MurT-GatD in BCG, which is expected to unmask the D-glutamate diaminopimelate (iE-DAP) NOD-1 ligand, yields superior prevention of TB disease compared to the standard BCG vaccine. In vitro and in vivo experiments in this study demonstrate the feasibility of gene regulation platforms such as CRISPRi to alter antigen presentation in BCG in a bespoke manner that tunes immunity towards more effective protection against TB disease.


