
Introduction
Approximately 10% of all bone fractures in the U.S. result in delayed union or nonunion after treatment.1,2 In these cases, patients experience prolonged pain and disability along with overall increased utilization of healthcare resources such as pain medication, physical therapy, and subsequent surgery, sometimes requiring inpatient admission. Nonunion is associated with high complication rates and poor long-term outcomes.3–7 Higher nonunion rates are correlated with comorbidities such as higher body mass index (BMI), smoking and diabetes.8–12 Non-united fractures continue to represent a significant clinical challenge and socioeconomic burden. To this end, osteogenesis stimulator devices are a safe and low-cost, non-invasive option to aid healing in nonunion cases, and thus reduce costs associated with treatment. The present study evaluated the real-world impact of osteogenesis stimulator device usage on a variety of healthcare utilization endpoints by retrospectively analyzing a large claims-based database.
The definition of nonunion during bone healing has evolved over the past 25 years. Historically, orthopedic thought leaders considered a nonunion to be a minimum of nine months post-fracture with no progressive signs of healing for the most recent 3 months. However, some surgeons use a minimum of 6 months post-fracture as a benchmark.13 Currently, U.S. FDA and payor definitions focus on no visibly progressive signs of healing for the previous 3 months.
Noninvasive biophysical treatments, such as the use of electromagnetic fields or pulsed ultrasound, are commonly utilized to treat fracture nonunion. These biophysical treatments are all relatively low energy to ensure no thermal changes at the nonunion site. Pulsed electromagnetic field (PEMF) stimulation for the treatment of delayed union or nonunion has been shown to be an effective adjunct.14 Stimulation devices have been utilized as a post-surgical treatment modality for decades. One PEMF device (PhysioStim, Orthofix US LLC, Lewisville, TX, USA) was evaluated in a multicenter, controlled study of 139 subjects with nonunions. Nonunion sites in the study included both long bones and smaller bones, with an overall healing success rate of 80.0% following PhysioStim treatment.15 Treatment success was unaffected by long vs. short bone, open vs. closed fractures, age of patient (> or < 60 years of age), gender, recalcitrant vs first time treatment, or infected vs. noninfected nonunions. More recent studies on PEMF have confirmed that approximately 80% of fractures heal and that comorbidities do not negatively impact tibia and femur fractures.16,17 One reason for impaired healing is, in part, due to deficient biological properties. PEMF has shown effectiveness in overcoming these deficiencies by stimulating cell proliferation, differentiation and mineralization.18
This study evaluated a large claims-based database to determine the economic benefit of using electrical bone growth stimulator technologies for treatment of nonunions. Endpoints evaluated included clinical outcomes and cost of healthcare utilization.
Materials and Methods
Ethical Considerations: The study was conducted using de-identified data from a claims database, thus ethical review or approval was not required.
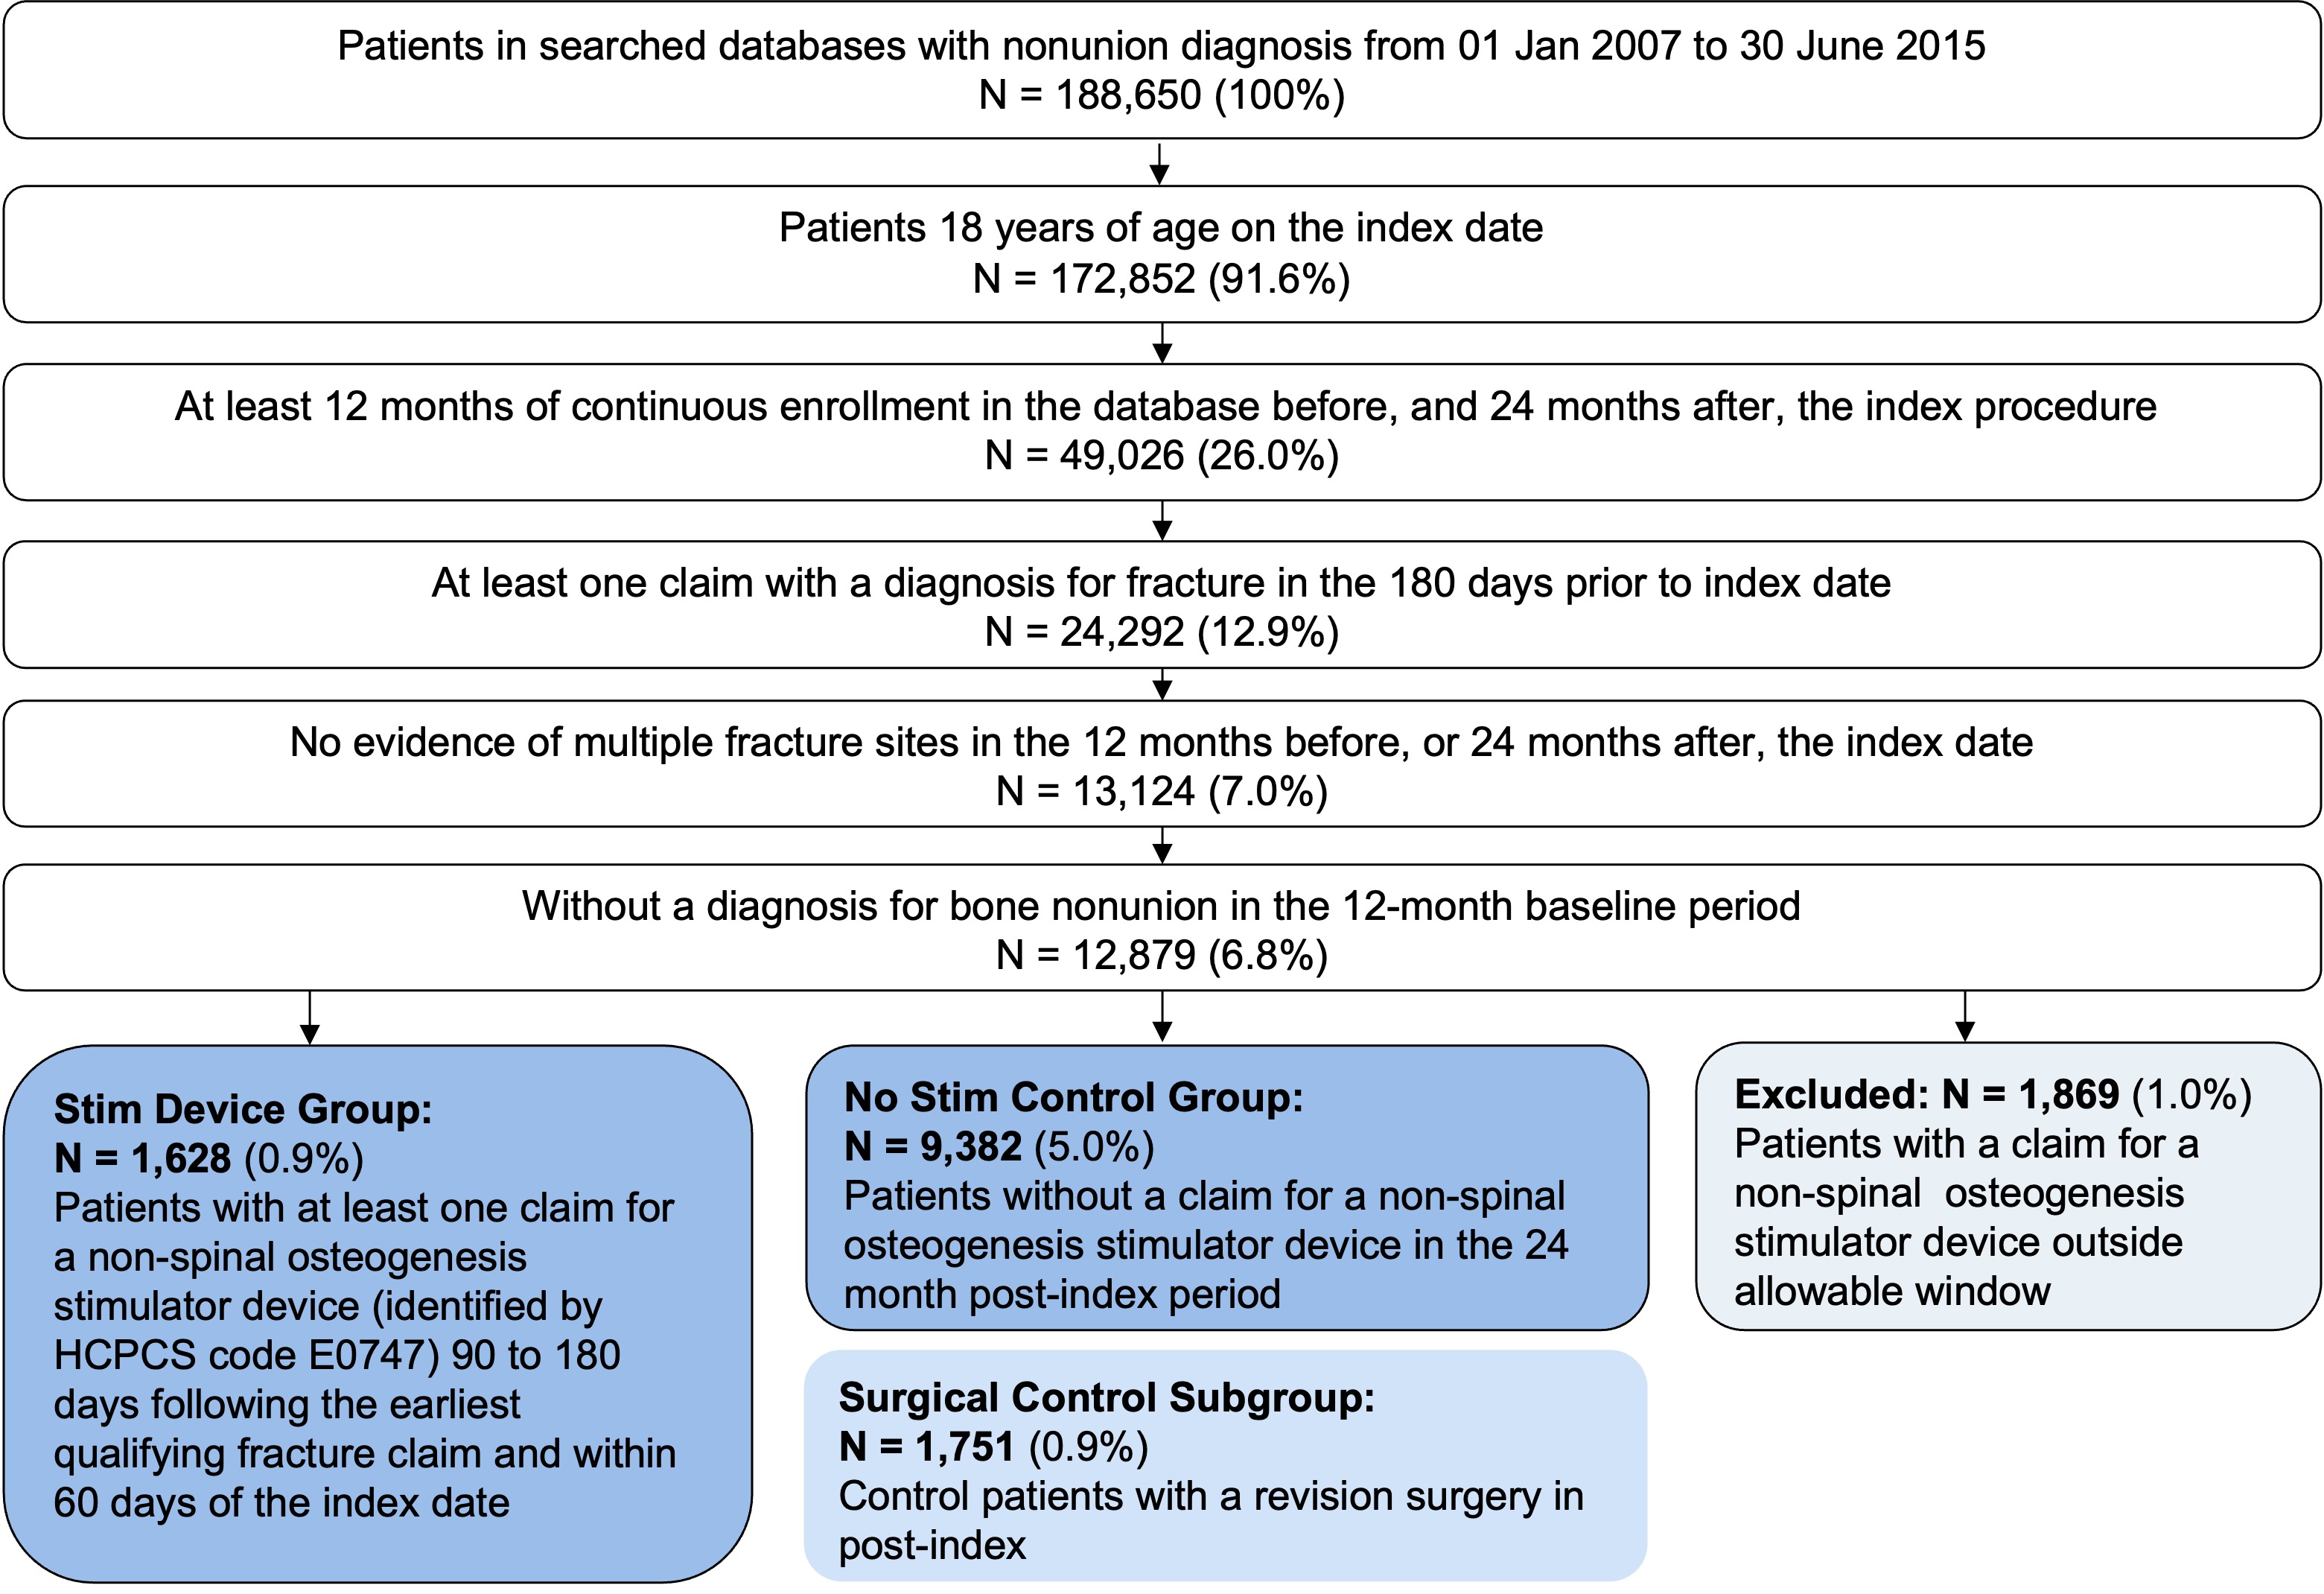
Database Search: A search was conducted using the MarketScan Commercial or Medicare Databases for patients with a diagnosis of bone nonunion from January 1, 2007 through June 15, 2015. On the index date, patients had to be ≥ 18 years of age with a minimum of 12 months of continuous enrollment in the database before procedure, and 24 months post the index procedure. Patients had to have at least one claim with a diagnosis of fracture in the 180 days prior to the index date, and without a diagnosis for bone nonunion during 12-month baseline period. For the Stim Device group, patients with at least one claim for a non-spinal electrical osteogenesis simulator device and determined by HCPCS code E0747 90 to 180 days following the earliest qualified fracture claim. Control group patients were selected by the same criteria without a claim for a non-spinal osteogenesis stimulator. In addition, there were surgical patients selected who had surgical revisions as an additional stratification of the control group.
Demographics: Baseline measures were taken of patient characteristics (e.g., age, sex, payor, index year), clinical characteristics (e.g., closed or open fracture, surgery), and pain medication utilization (i.e., opioids, non-opioid analgesics).
Clinical Outcomes: Study outcomes were assessed by surgical intervention measures and medication utilization factors. Surgical intervention was measured by 1) Proportion of patients needing surgical intervention, 2) Proportion of patients with codes indicating repair of fracture (e.g., open reduction, bone grafts), 3) Proportion of patients having codes specifically indicating repair of nonunion, and 4) Pain Medication Utilization.
Healthcare resource utilization measures included 1) Inpatient admission rates, 2) Utilization of outpatient services, 3) Inpatient costs, 4) Outpatient costs, and 5) Total healthcare costs (stratified yearly).
Statistical Analysis: Descriptive analysis included all outcomes and baseline measures – continuous measures are presented as mean and standard deviation with categorical measures presented as counts and percentages. Statistical tests were performed between use of osteogenesis stimulator device patients and control patients with no devices or patients that had undergone revision surgery. Statistical tests utilized were two tailed Student’s T tests or ANOVA for continuous variables and Chi-squared tests for categorical variables. A priori p-value of less than 0.05 was set as the threshold for statistical significance.
Results
Database Analysis: A total of 188,650 patients were identified in the MarketScan Commercial and Medicare Databases. After selection criteria, 1,628 patients were assigned to the Stim Device group and 9,382 were assigned to the control group (No Stim). A total of 1,751 patients from the No Stim group were sub-grouped into surgical/operative controls (No Stim - Surgical group). The study design is presented in Figure 1, and group assignment in Figure 2.


Patient Demographics: A total of 1,628 patients were enrolled into the Stim Device group, 9,382 patients were enrolled into the Control No Stim group (without device utilization), and 1,751 patients were enrolled into the Surgical group. The overall mean patient age was 50.3 years (Stim Device group: 51.1 years; No Stim group: 51.1 years; Surgical group: 48.6 years). The majority of patients evaluated were female (Stim Device group: 65.3%; No Stim group: 58.1%; Surgical group: 56.8%).
Clinical Outcomes
Stim Device patients had lower rates of surgical intervention for bone nonunion compared to the No Stim group (214/1,628, 13.1% vs. 1,751/9,382, 18.7%, p < 0.001). The rate of additional repair of fracture in the Stim Device group was significantly lower, and more clinically superior, compared with the No Stim group (8.8% vs. 10.7%, p = 0.02). The rate of repair for nonunions was also significantly lower, more clinically superior, in the Stim Device group compared to the No Stim group (8.2% vs. 11.2%, p < 0.001). These data show that utilization of the Stim Device was associated with improved bone healing and lower need for surgery based on results for codes representing repair of fractures and nonunions (Table 1).
Pain Medication Utilization: Stim Device patients had lower rates of opioid utilization post-index compared to No Stim patients (948/1,628, 58.2% vs. 6,359/9,382, 67.8%, p < 0.001), despite having higher use prior to nonunion diagnosis (Table 2).
Healthcare Resource Utilization: Measured as inpatient admission rates, outpatient services utilization, inpatient costs, outpatient costs, and total healthcare costs.
Inpatient admission rates showed a 48.2% decrease in the Stim Device group compared to the No Stim group (11.6 vs. 22.4%, respectively at year 1). This correlated with a decrease of inpatient days from 1.4 in the No Stim group to 0.6 in the Stim Device group (p < 0.001). Inpatient days in the Surgical group (1.6 days) also showed a significant difference compared to the Stim Device group (0.6 days).
The proportion of patients utilizing outpatient services was similar between groups at year 1 (All groups 100%) and year 2 post index (Stim Device group: 95.9%; No Stim group: 94.3%; Surgical group: 94.7%). However, when measured by number of visits per patient, the Stim Device group spent significantly less time compared with control groups at 1-year post-index (39.6 vs. 42.5, p = 0.005; and 39.6 vs. 48.6, p < 0.001).
Inpatient costs were significantly reduced in the Stim Device group compared to the No Stim group. Mean inpatient costs in the No Stim group were $9,213 dollars compared to $4,018 dollars in the Stim Device group (p < 0.001).
Outpatient costs (including emergency visits and rehabilitation services) were significantly reduced at year 1 post-index in the Stim Device group ($308) compared with No Stim ($403; p = 0.022) and Surgical ($413; p = 0.012) control groups. Outpatient costs at year 2 were not significantly different. For outpatient rehabilitation services, at year 1 post-index the Stim Device group had significantly lower costs ($325) compared with the No Stim ($464; p < 0.001), and Surgical ($579; p < 0.001) control groups. The costs associated at year 2 post-index were not significantly different.
Total healthcare costs at year 1 post-index (including outpatient office visits, pharmacy, and physical therapy) were significantly reduced at year 1 post-index in the Stim Device group ($21,654) compared with No Stim ($29,101; p < 0.001) and Surgical ($35,914; p < 0.001) control groups. The costs associated at year 2 post-index were significantly different for the Stim Device group compared to the Surgical control group ($15,553 vs. $18,450, p = 0.015) (Table 3).
Discussion
The current study investigated real-world data of osteogenesis stimulator device usage on a variety of healthcare utilization endpoints including surgical intervention for nonunion, pain medication use, and overall healthcare costs. Our findings showed that patients using osteogenesis stimulator devices had lower rates of surgical intervention, lower use of opioid medication, and had lower overall healthcare costs compared to control groups that did not use osteogenesis stimulator device treatments.
Based on the population analyzed in this study, only 17.0% of patients were prescribed an osteogenesis stimulator device for nonunion treatment. Such a low proportion of the study population may be due to several reasons. Osteogenesis stimulator devices are classified by the FDA as a Class III device which sets a challenging hurdle for medical device manufacturers. Private payors in this database may not be convinced of the cost/benefit ratio that these devices provide. These devices can be a significant investment (approximately $3,000), however, recent data confirm the overall cost of outpatient services for those that do use a Stim Device are significantly less; economically the therapy is worth investing.19 Medical insurance reimbursement policies for bone growth stimulators are quite restrictive, as noted by recent data from the Centers for Medicare and Medicaid Services.20 An additional layer of complication exists in the fact that medical services in the U.S. are tied to for-profit business models. Mehta et al. suggested the economic benefit of cost savings is not necessarily the highest priority of healthcare administrative structure.21 For example, Tarride et al. offer evidence suggesting healthcare providers avoid cheaper therapies that require more time investment, regardless of patient or economic outcomes.22 There is a dearth of published literature or economic models that definitively show these stimulation modalities do in fact present superior clinical outcomes.
Focusing on one particular set of nonunions, tibia shaft fractures, a research group performed a cost analysis of treatment comparing tibia nonunions to tibia fractures that healed normally. These authors used the MarketScan database limited to one year (2006) analyzing 16 million lives for incidence of tibial fractures. In this population they identified 853 patients with tibia shaft fractures, of which 12% (99 patients) had a nonunion. Total mean healthcare costs for tibial nonunions in this study totaled $53,506; compared to tibial fractures that healed normally (mean total $20,983). Opioid use was higher as a percentage in nonunion (90%) compared to normal fracture healing (76%) and for a longer duration – 5.4 months for nonunions compared to 2.8 months for normal tibial fracture healing.23 Consistent with our findings in the present study, these results show an increased economic burden for fractures that do not heal normally and become nonunions.
Previous economic analyses have looked at the benefit of osteogenesis stimulator devices. A recent publication looked specifically at the LIPUS pulsed ultrasound technology for nonunion treatment in a comparison study between LIPUS treatment and surgery. Data in this study came over a 3-year period from the IMS Health Claims Database that included claims on approximately 80 million patients. Nonunions were found in 22,789 patients. LIPUS was used in 579 of these patients and matched surgical controls were identified and compared. Nonunion-related costs were $4,986 for the LIPUS cohort compared to $11,276 for the surgical cohort. Most of the costs for the LIPUS group centered on outpatient costs where the surgical group also had inpatient costs associated with their surgical treatment. These authors point out that if there are 600,000 nonunions per year in the US the cost of surgical treatment would be an additional $3.7 billion annually. These data are consistent with our findings and point to a positive impact on both clinical and economic outcomes.
A comprehensive study on electrical bone growth stimulators (EBGS) compared to LIPUS or no stim by Wu et al. used the MarketScan database limited to five years (2005 - 2010) and analyzed patient claims in patients ≤ 64 years old for incidence of fracture nonunions (not including the Medicare population).19 In this claim population, they identified 57,336 patients with nonunions, of which 20.3% (11,628 patients) received either LIPUS, EBGS, or no stim (more than 50.0% of these patients went on to have surgery for treatment of their nonunion). In the first year after treatment, total health care costs were significantly reduced for the EBGS cohort ($20,743) compared to no stim ($24,315).
Limitations exist when interpreting data presented in this study. The only information able to be analyzed in a claims-based study, is that for which a claim was filed. While some assurances can be made about the completeness and validity of the data, this information may not be as accurate as that from a primary research study where subjects are followed specifically for the purpose of conducting the research. However, the database used in this study has been historically used for many similar published studies across a variety of time periods and treatment sub-specialties. Another factor to consider is the design of our groups. This study employed windows around the index date for inclusion of subjects. In practice there is some disagreement about the definition of nonunion and when a fracture nonunion has occurred. While we are able to see claims indicating the use of osteogenesis stimulator devices, we have no actual data to see to what extent the device was used by the patients included in the Stim Device group. The assumption is that if there was a claim for the stimulator device, it was used as directed by the patient, with a sufficient level of compliance.
Conclusion
Our results demonstrate a significant benefit to cost savings per patient in total health care costs using osteogenesis stimulator devices compared to surgical and non-surgical nonunion treatment. In addition to the financial benefits, patients receiving osteogenesis stimulator device treatment required less opioids and other healthcare services which represents an increased quality of life. Despite these benefits, use of these devices remains an underutilized resource in treating nonunion. Further work is needed to expand awareness of this useful therapeutic tool for treating nonunions, and to determine real world practical solutions to enhance physician toolkits with therapeutics that are safe and effective.
Author contributions
-
Substantial contributions to the conception or design of the work; or the acquisition, analysis, or interpretation of data for the work (DNS, JTR)
-
Drafting the work or revising it critically for important intellectual content (DNS, JTR)
-
Final approval of the version to be published (DNS, JTR)
-
Agreement to be accountable for all aspects of the work in ensuring that questions related to the accuracy or integrity of any part of the work are appropriately investigated and resolved (DNS, JTR)
Financial Disclosure / COA
DNS has nothing to disclose.
JTR was an employee of Orthofix during the period when the study was conducted. JTR is no longer an employee of Orthofix.