the Creative Commons Attribution 4.0 License.
the Creative Commons Attribution 4.0 License.
 | 17 Jul 2023
Antarctic Bedmap data: Findable, Accessible, Interoperable, and Reusable (FAIR) sharing of 60 years of ice bed, surface, and thickness data
Peter Fretwell
Julien A. Bodart
Hamish D. Pritchard
Alan Aitken
Jonathan L. Bamber
Robin Bell
Cesidio Bianchi
Robert G. Bingham
Donald D. Blankenship
Gino Casassa
Ginny Catania
Knut Christianson
Howard Conway
Hugh F. J. Corr
Xiangbin Cui
Detlef Damaske
Volkmar Damm
Reinhard Drews
Graeme Eagles
Olaf Eisen
Hannes Eisermann
Fausto Ferraccioli
Elena Field
René Forsberg
Steven Franke
Shuji Fujita
Yonggyu Gim
Vikram Goel
Siva Prasad Gogineni
Jamin Greenbaum
Benjamin Hills
Richard C. A. Hindmarsh
Andrew O. Hoffman
Per Holmlund
Nicholas Holschuh
John W. Holt
Annika N. Horlings
Angelika Humbert
Robert W. Jacobel
Daniela Jansen
Adrian Jenkins
Wilfried Jokat
Tom Jordan
Edward King
Jack Kohler
William Krabill
Mette Kusk Gillespie
Kirsty Langley
Joohan Lee
German Leitchenkov
Carlton Leuschen
Bruce Luyendyk
Joseph MacGregor
Emma MacKie
Kenichi Matsuoka
Mathieu Morlighem
Jérémie Mouginot
Frank O. Nitsche
Yoshifumi Nogi
Ole A. Nost
John Paden
Frank Pattyn
Sergey V. Popov
Eric Rignot
David M. Rippin
Andrés Rivera
Jason Roberts
Neil Ross
Anotonia Ruppel
Dustin M. Schroeder
Martin J. Siegert
Andrew M. Smith
Daniel Steinhage
Michael Studinger
Bo Sun
Ignazio Tabacco
Kirsty Tinto
Stefano Urbini
David Vaughan
Brian C. Welch
Douglas S. Wilson
Duncan A. Young
Achille Zirizzotti
One of the key components of this research has been the mapping of Antarctic bed topography and ice thickness parameters that are crucial for modelling ice flow and hence for predicting future ice loss and the ensuing sea level rise. Supported by the Scientific Committee on Antarctic Research (SCAR), the Bedmap3 Action Group aims not only to produce new gridded maps of ice thickness and bed topography for the international scientific community, but also to standardize and make available all the geophysical survey data points used in producing the Bedmap gridded products. Here, we document the survey data used in the latest iteration, Bedmap3, incorporating and adding to all of the datasets previously used for Bedmap1 and Bedmap2, including ice bed, surface and thickness point data from all Antarctic geophysical campaigns since the 1950s. More specifically, we describe the processes used to standardize and make these and future surveys and gridded datasets accessible under the Findable, Accessible, Interoperable, and Reusable (FAIR) data principles. With the goals of making the gridding process reproducible and allowing scientists to re-use the data freely for their own analysis, we introduce the new SCAR Bedmap Data Portal (https://bedmap.scar.org, last access: 1 March 2023) created to provide unprecedented open access to these important datasets through a web-map interface. We believe that this data release will be a valuable asset to Antarctic research and will greatly extend the life cycle of the data held within it. Data are available from the UK Polar Data Centre: https://data.bas.ac.uk (last access: 5 May 2023). See the Data availability section for the complete list of datasets.
- Article
(5297 KB) - Full-text XML
-
Supplement
(573 KB) - BibTeX
- EndNote


Detailed and extensive information on ice thickness and bed topography is needed to reconstruct the geological and geomorphic history of Antarctica and to model ice flow in order to predict the ice sheet's future contribution to sea level rise (Fretwell et al., 2013; DeConto and Pollard, 2016; Scambos et al., 2017; The IMBIE team, 2018; Rignot et al., 2019; Morlighem et al., 2020; DeConto et al., 2021; Fox-Kemper et al., 2021). This information has primarily been gathered using ground-based or airborne radio-echo sounding (RES) and seismic surveys conducted by over 50 institutions under multiple national programmes across Antarctica over the last 60 years. However, up until now, these survey datasets have not been held centrally or been standardized, thus limiting their accessibility to the wider Antarctic community. Consequently, previous attempts to map the ice sheet on the continental scale, such as Bedmap1 (Lythe and Vaughan, 2001), Bedmap2 (Fretwell et al., 2013) and Bedmachine Antarctica (Morlighem et al., 2020), have had to first find data, gain permissions, and download, clean and standardize hundreds of datasets from survey campaigns of many different sources before finally constructing the grids. These constraints have led to only a limited number of gridded products being made, often years apart and with a long lag after the surveys have been completed. Given the rapidity of change affecting large parts of the Antarctic Peninsula and threatening the stability of the West Antarctic Ice Sheet, together with the urgency in predicting future ice loss (e.g. Mouginot et al., 2014; Golledge et al., 2015; DeConto and Pollard, 2016; Gardner et al., 2018; Seroussi et al., 2020; Levermann et al., 2020), it is essential, beyond the legal imperative stated in Section III 1-c of the Antarctic Treaty, for these data to be freely available to the international community.
Supported by the Scientific Committee of Antarctic Research (SCAR) Bedmap3 Action Group, this paper presents the release of all of the underlying ice bed, surface, and thickness survey data points that have been used in the previous and upcoming versions of Bedmap gridded products (Bedmap1, Bedmap2, and Bedmap3). We discuss the standardization of the data following the Findable, Accessible, Interoperable, and Reusable (FAIR) data principles (Wilkinson et al., 2016) and the use of consistent data formats and attributes, as agreed to by the international community through the Bedmap project. Additionally, we introduce the SCAR Bedmap Data Portal (https://bedmap.scar.org, last access: 1 March 2023), which offers the ability to search individual datasets within one stand-alone map-based platform and increases the discoverability and accessibility of the data. Our aim is to make the gridding process as reproducible as possible by making the source survey data fully standardized, openly available, and easily accessible through one portal. It is expected that the data presented in this paper will facilitate the creation of a range of new gridded products at different spatial resolutions, enable the application of emerging techniques such as machine-learning and geostatistical techniques to fill gaps between direct measurements, and provide a common data-sharing baseline for future geophysical surveying of Antarctica. A follow-up publication to this paper will introduce the new gridded products from Bedmap3.
Section 2 of this paper discusses the background and evolution of past surveying of Antarctica using geophysical techniques. Section 3 presents how the source data have been standardized. Section 4 details how the data are published following the FAIR data principles.
2.1 1950–1980: first geophysical measurements of ice thickness in Antarctica
Prior to the start of radio-echo-sounding (RES) measurements over Antarctica, ice thickness was primarily obtained from seismic techniques (Schroeder et al., 2020). RES was developed in the 1950s after studying the transparency of ice to specific radio frequencies and the realization of its potential for glaciological research by Armory Waite and Stanley Evans (Turchetti et al., 2008). After several years of developments and tests, the first long-range airborne radio-echo sounding of the Antarctic Ice Sheet was undertaken by the Scott Polar Research Institute (SPRI), with support from the United States National Science Foundation and the Technical University of Denmark in the late 1960s (Robin et al., 1970). By 1975, the elevation data from the 1971–1975 Antarctic field seasons were compiled into a series of topographic maps of Antarctica (Drewry, 1975). These became the first comprehensive topographic maps of the Antarctic continent and would lead to more sophisticated compilation grids in the following years.
2.2 1980–1990: first compilation efforts to map Antarctica
By 1983, around 50 % of the Antarctic Ice Sheet had at least some airborne RES survey measurements (i.e. within a 50 to 100 km square grid cell) (Drewry et al., 1982), and the first compilation bed elevation map was published. Sheets 3 and 4 in the SPRI Glaciology and Geophysical Folio Series (Drewry, 1983) became a reference for bedrock surface and ice thickness for Antarctica. The grid contours of bed elevation were drawn from ice thickness data collected on sparse surface traverses and by airborne surveys over the entire continent using state-of-the-art digital-mapping techniques, although in many areas survey lines were separated by hundreds of kilometres (Lythe and Vaughan, 2000).
2.3 1990–2020: the Bedmap era
In the mid-1990s, advances in radar data acquisition and development of modern global navigation satellite systems (GNSSs) led to substantial improvements in the coverage and accuracy of the data collected. Until then the positioning was often inferred using the “unaided inertial navigation” technique which often had substantial positioning errors (Schroeder et al., 2020).
In 1996, the first BEDMAP consortium group (here termed Bedmap1) was set up under the joint sponsorship of the European Ice Sheet Modelling Initiative (EISMINT) and SCAR. It led to the publication of the first Bedmap products: a printed map published in 2000 (Lythe and Vaughan, 2000) and its associate digital version in 2001 (Lythe and Vaughan, 2001). For more than a decade, Bedmap1 played a crucial role in providing large-scale boundary conditions of the Antarctic Ice Sheet for observational and modelling applications (e.g. Pollard and DeConto, 2009; Shepherd et al., 2012). The gridded map contained ice thickness data from direct measurements, including ground-based and airborne RES but also from seismic and gravimetric measurements (Lythe and Vaughan, 2001). Although pioneering, this first gridded product had a relatively low resolution of 5 km and suffered from large data gaps, particularly over East Antarctica, which resulted in low-confidence values in those areas (see Fig. 1a).
Motivated by a wealth of newly acquired data over Antarctica and improved geographic information system techniques, the second version of Bedmap was published in 2013 (Fretwell et al., 2013). The Bedmap2 product was composed of several grids including ice bed, surface, and thickness data for Antarctica and their associated uncertainties, in addition to several masks (e.g. continental ice edge, grounding line, ice shelf extent) useful for ice sheet modelling. This compilation included 25 million measurements, an order of magnitude more than were used in Bedmap1. This time, the ice thickness, bed elevation, and surface elevation grids were provided at a uniform 1 km spacing but still with a native interpolation resolution of 5 km to satisfy the data providers' conditions for use (Fretwell et al., 2013).
Since 2012, new RES datasets have been collected across Antarctica, with a particular focus on the “poles of ignorance” identified in Bedmap2 (Pritchard, 2014), thus filling known data gaps in key areas of East Antarctica (see Sect. 3.1). In addition, new hybrid compilation efforts such as BedMachine Antarctica have used a combined modelling–observation approach, including a mass conservation method, to generate improved bed topography and ice thickness in data-deficient areas of the Antarctic coastline (Morlighem et al., 2020).
2.4 2020–present: general approach for Bedmap3
In 2020, the SCAR Bedmap3 Action Group was tasked with producing an updated version of the Bedmap gridded products and with improving the accessibility of the underlying survey datasets of Antarctic ice thickness and bed topography (see Fig. 1a–c) through standardization and dissemination of the data via the new SCAR Bedmap Data Portal. This will serve as a common endpoint to discover and interact with all underlying Bedmap data.
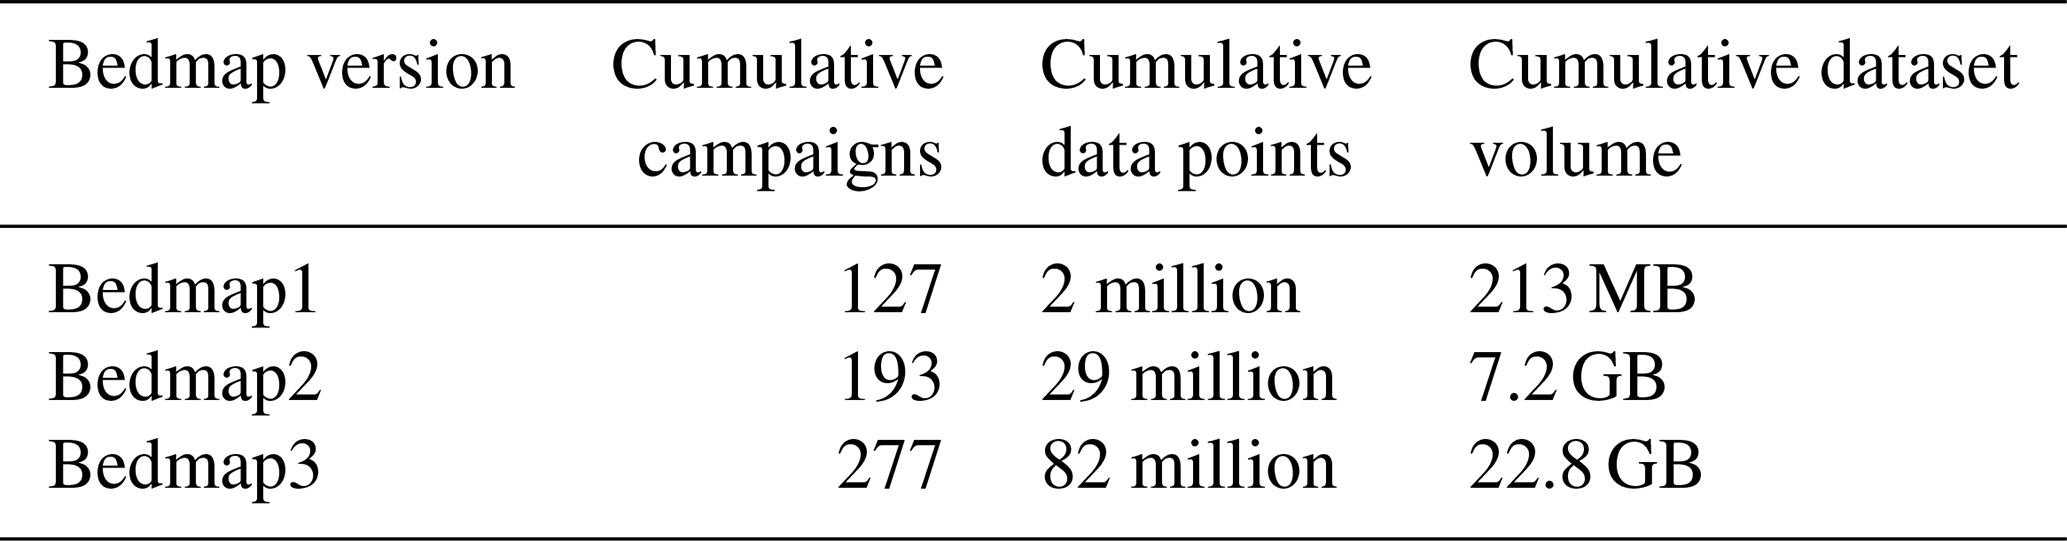
The Bedmap3 gridded products will be constructed using a similar process to Bedmap2 but will offer a significant improvement in survey data coverage along with a newly updated grounding line, updated altimetry-derived surface topography, and updated ice extent and bathymetry. Each iteration of Bedmap contains large survey data additions that have increased the accuracy of the gridded products. In total, Bedmap3 contains 82 million points and thus includes twice the number of new data points available to Bedmap2 (Fig. 1d, Tables 1 and S2).
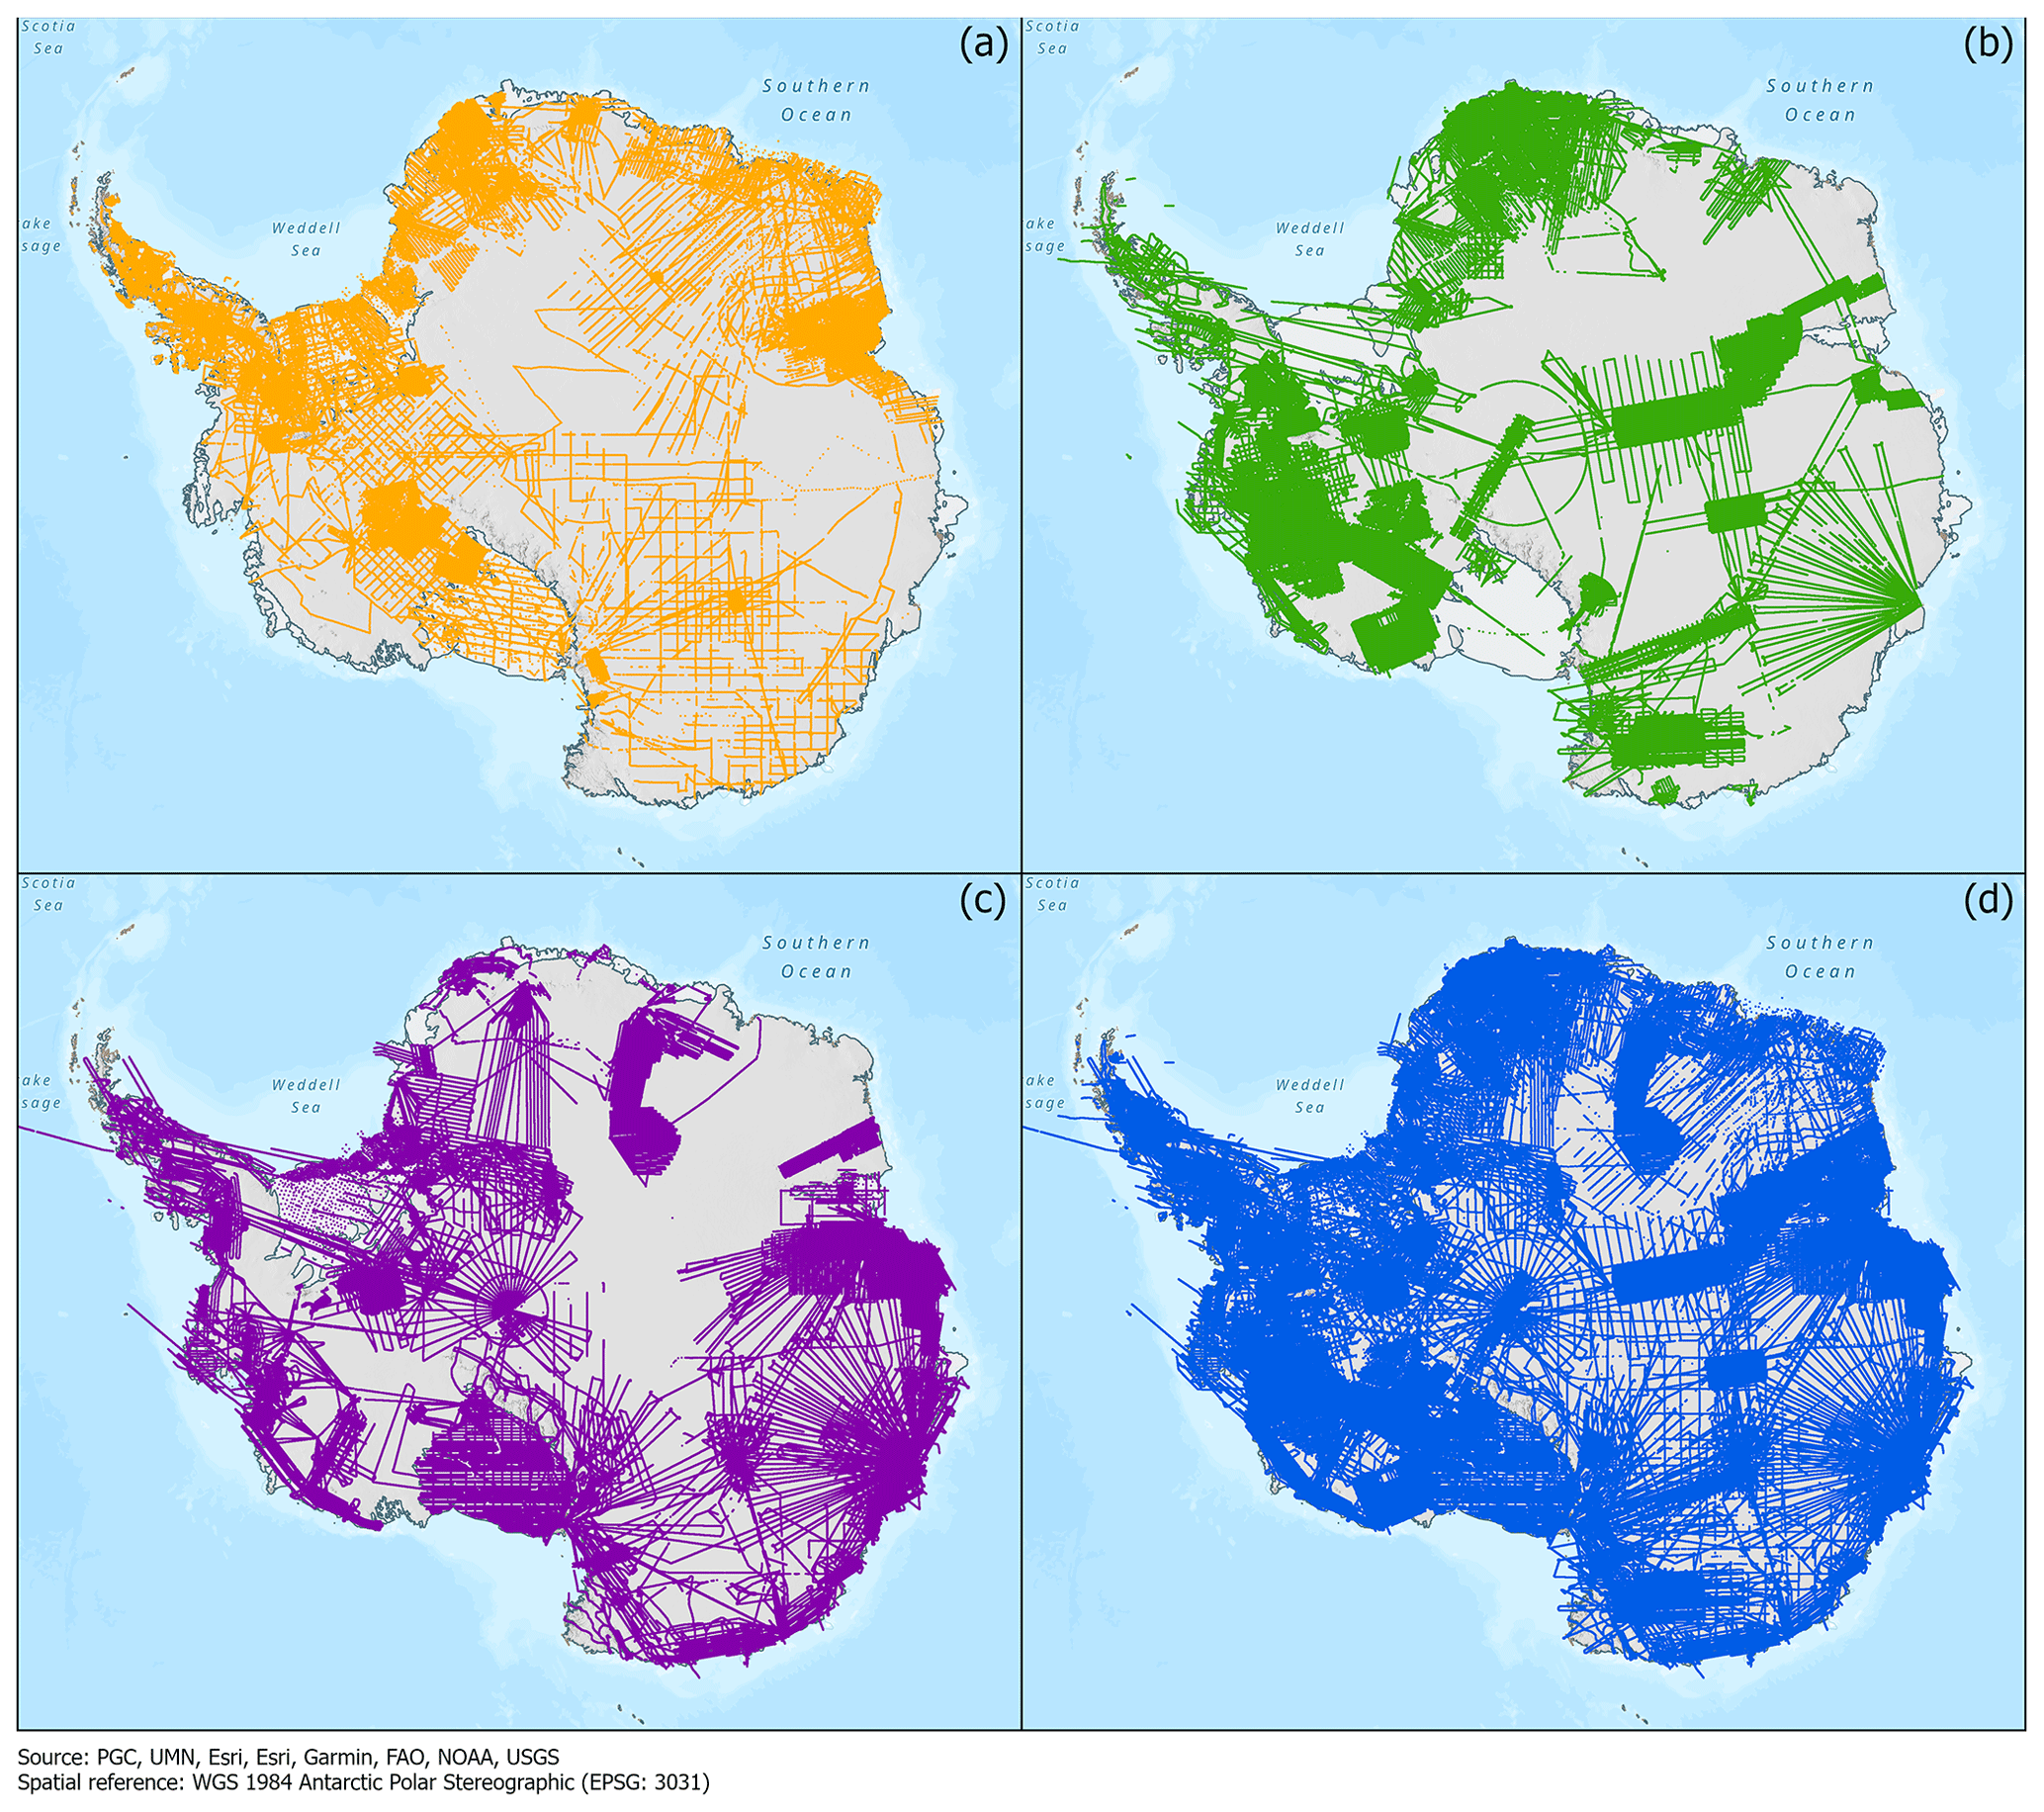
Figure 1Data coverage for the three generations of Bedmap products. (a) Data coverage for Bedmap1. (b) Additional data coverage for Bedmap2. (c) Additional data coverage for Bedmap3. (d) Total combined coverage now available.
3.1 Ice thickness, surface and bed elevation data
The primary source data consist of survey point measurements of ice thickness, bed elevation and surface elevation, which principally come from airborne radar surveys and seismic soundings and to a smaller extent from ground-based radar surveys. We present here the data compiled within each version of Bedmap.
Bedmap1 source data (1950s–1990s) often lack the campaign metadata available for more modern datasets, and so we present these as a single dataset. In total, the data standardized for Bedmap1 consist of almost 2 million points from 127 individual campaigns (Table 1). While the data coverage is substantial, especially over West Antarctica and the Antarctic Peninsula (Fig. 1a), the distance between individual flight lines and soundings is much larger than those of the Bedmap2 and Bedmap3 data. In addition, though efforts continue to leverage modern data to improve the geometric, positioning, and radiometric calibration for these archival data, the spatial accuracy of the survey data is poorer due to the use of older navigation techniques prior to the GNSS era (see Schroeder et al., 2019, 2021).
Additional Bedmap2 source data were acquired from 2000 to 2012 by 66 new surveys that contributed a further 27 million points (Table S1), filling major gaps over West Antarctica's fast-flowing ice streams such as the Pine Island (Vaughan et al., 2006) and Thwaites (Holt et al., 2006) glaciers as well as over East Antarctica's Gamburtsev Subglacial Mountains (Sun et al., 2009; Bell et al., 2011; Ferraccioli et al., 2011) and Wilkes Subglacial Basin (Frederick et al., 2016) (Fig. 1b).
Further new data available to Bedmap3 come from 84 new surveys by 15 data providers, representing an additional 52 million data points and 1.9 million line kilometres of measurements (Table S2). These latest data have filled major gaps, particularly in the key sector of East Antarctica, including the South Pole (Jordan et al., 2018) and Pensacola basin (Paxman et al., 2019), Dronning Maud Land, Recovery Glacier (Forsberg et al., 2017) and Dome Fuji (Eagles et al., 2018; Karlsson et al., 2018), and Princess Elizabeth Land (Cui et al., 2020; Popov, 2020). Additional data covering glacier troughs and floating ice shelves give insights into previously undersampled sectors, such as over the Antarctic Peninsula, West Antarctic coastlines, or the Transantarctic Mountains as part of NASA Operation IceBridge (MacGregor et al., 2021).
Table 1Comparison of data campaigns and coverage of the different Bedmap generations.
3.2 Standardization
Due to the large number of data providers and the lack of common protocols, the data received as part of Bedmap data calls came in various forms, including text, comma-separated value (CSV), ASCII or Excel files. To ensure long-term accessibility, all submitted data files were standardized based upon a template agreed to by the SCAR Action Group and converted to a specific CSV format. Open and easy to use, this format has been widely used in the scientific community and is well suited for storing tabular data.
As an ASCII-delimited file, the CSV format allows long-term preservation of the data thanks to its very simple structure. This format is often recommended (e.g. https://www.gov.uk/government/publications/recommended-open-standards-for-government/tabular-data-standard, last access: 1 March 2023, UK Government, 2020), but no strict definition exists. One common definition is the RFC 4180 definition (https://www.ietf.org/rfc/rfc4180.txt, last access: 1 March 2023, IETF RFC 4180, 2005), which describes the CSV format as tabular data with zero to one header rows, followed by the same number of fields separated by commas. With only one row header, the metadata allowed by this definition are extremely poor. To add information, a solution is to repeatedly add the metadata to each data row but at the cost of greatly increasing the file size. That is why the CSV on the Web (CSVW) standard developed by the W3C working group (https://www.w3.org/TR/tabular-data-primer/, last access: 1 March 2023, CSV on the Web, 2016) or NCCSV, a NetCDF-compatible ASCII CSV file (https://coastwatch.pfeg.noaa.gov/erddap/download/NCCSV.html, last access: 1 March 2023, NCCSV, 2023) developed by NOAA, recommend adding the metadata or notes in a separated JSON or CSV file. Although the metadata as described by the CSVW or NCCSV recommendations are excellent in terms of machine readability, the metadata are hidden in a complicated structure that compromises human readability. For this reason, we used an extended version of CSV that purposely does not follow the RFC 4180 definition but provides the possibility of adding metadata in the data file itself. Different definitions of such a format exist, such as the geoCSV format developed within the GeoWS project (http://geows.ds.iris.edu/documents/GeoCSV.pdf, last access: 1 March 2023, IRIS, 2015) or the extCSV format recommended by the World Ozone and Ultraviolet Radiation Data Centre (https://woudc.org/about/formats.php, last access: 1 March 2023, Canada World Ozone and Ultraviolet Radiation Data Centre, 2023).
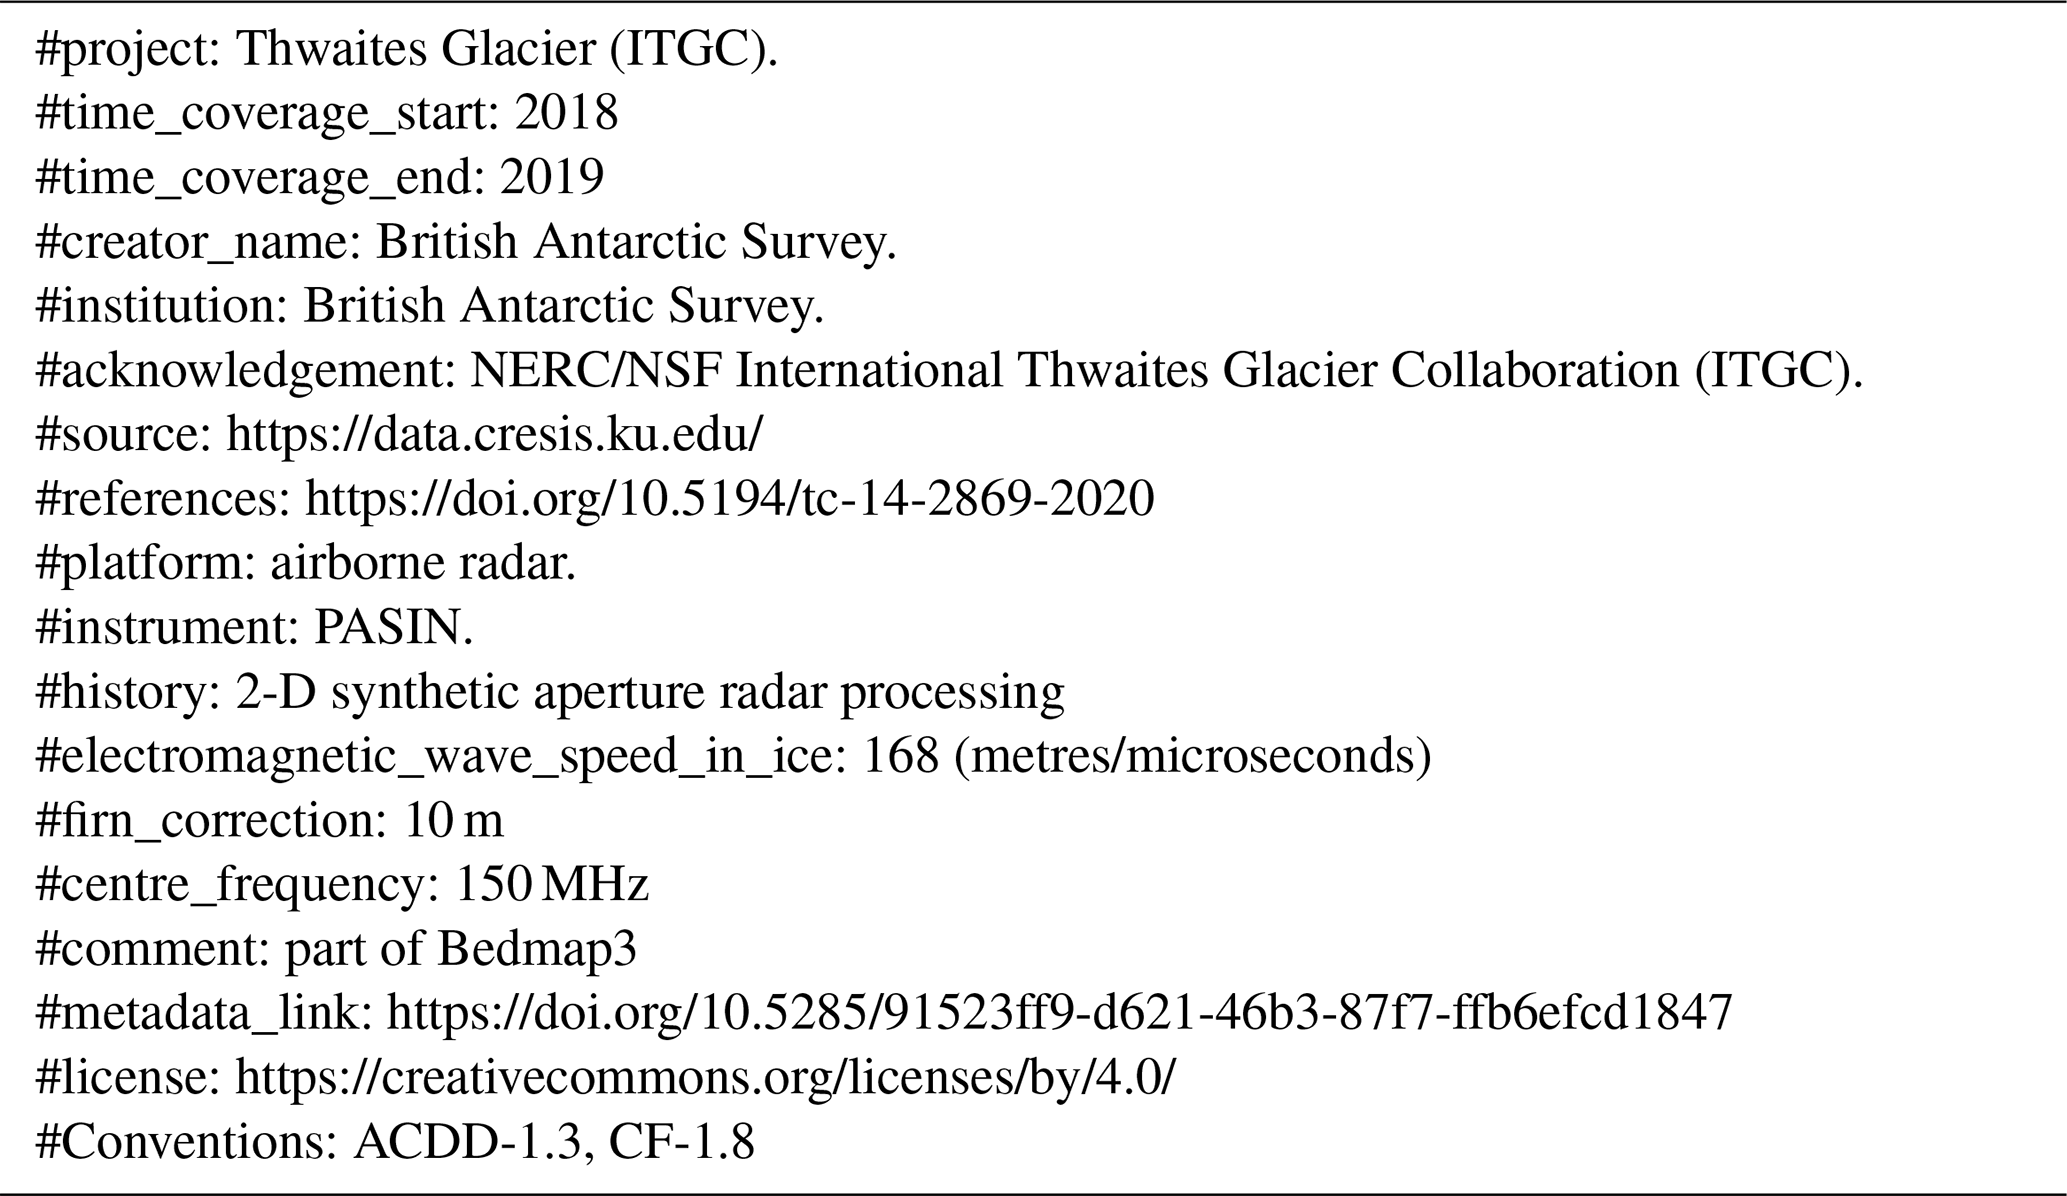
The format used for the Bedmap Data Portal follows most of the geoCSV recommendations, and headers are compliant with the Climate and Forecast (CF) Metadata Conventions (https://cfconventions.org/, last access: 1 March 2023, Hassell et al., 2017) and include recommended attributes from the Attribute Convention for Data Discovery (ACDD, https://wiki.esipfed.org/Attribute_Convention_for_Data_Discovery_1-3, last access: 1 March 2023, Earth Science Information Partners, 2023). As part of the standardization, a specific header and structure consisting of identical variable names in a strict order for all the ice thickness data were developed in order to simplify access, particularly for programming purposes. The format consists of (i) an extended header section, (ii) a header row composed of the column name following the CF convention and units in parentheses, and finally (iii) the data using a comma as the separator. The extended header consists of general information regarding each campaign, such as the year, the name of the main investigator, and funding and processing details as shown in Table 3. The complete list and order of the attributes and variables are given in Table 2.
The developed format is machine-readable, making the conversion of the files to CSVW or NCCSV standards straightforward if necessary.
Table 2List of variable and attribute names provided in the CSV files. To guarantee the machine readability of the variable names, the use of special characters was avoided. Conventions include the CF convention (https://cfconventions.org/, last access: 1 March 2023, Hassell et al., 2017) and recommended attributes from the Attribute Convention for Data Discovery (ACDD, https://wiki.esipfed.org/Attribute_Convention_for_Data_Discovery_1-3, last access: 1 March 2023, Earth Science Information Partners, 2023).
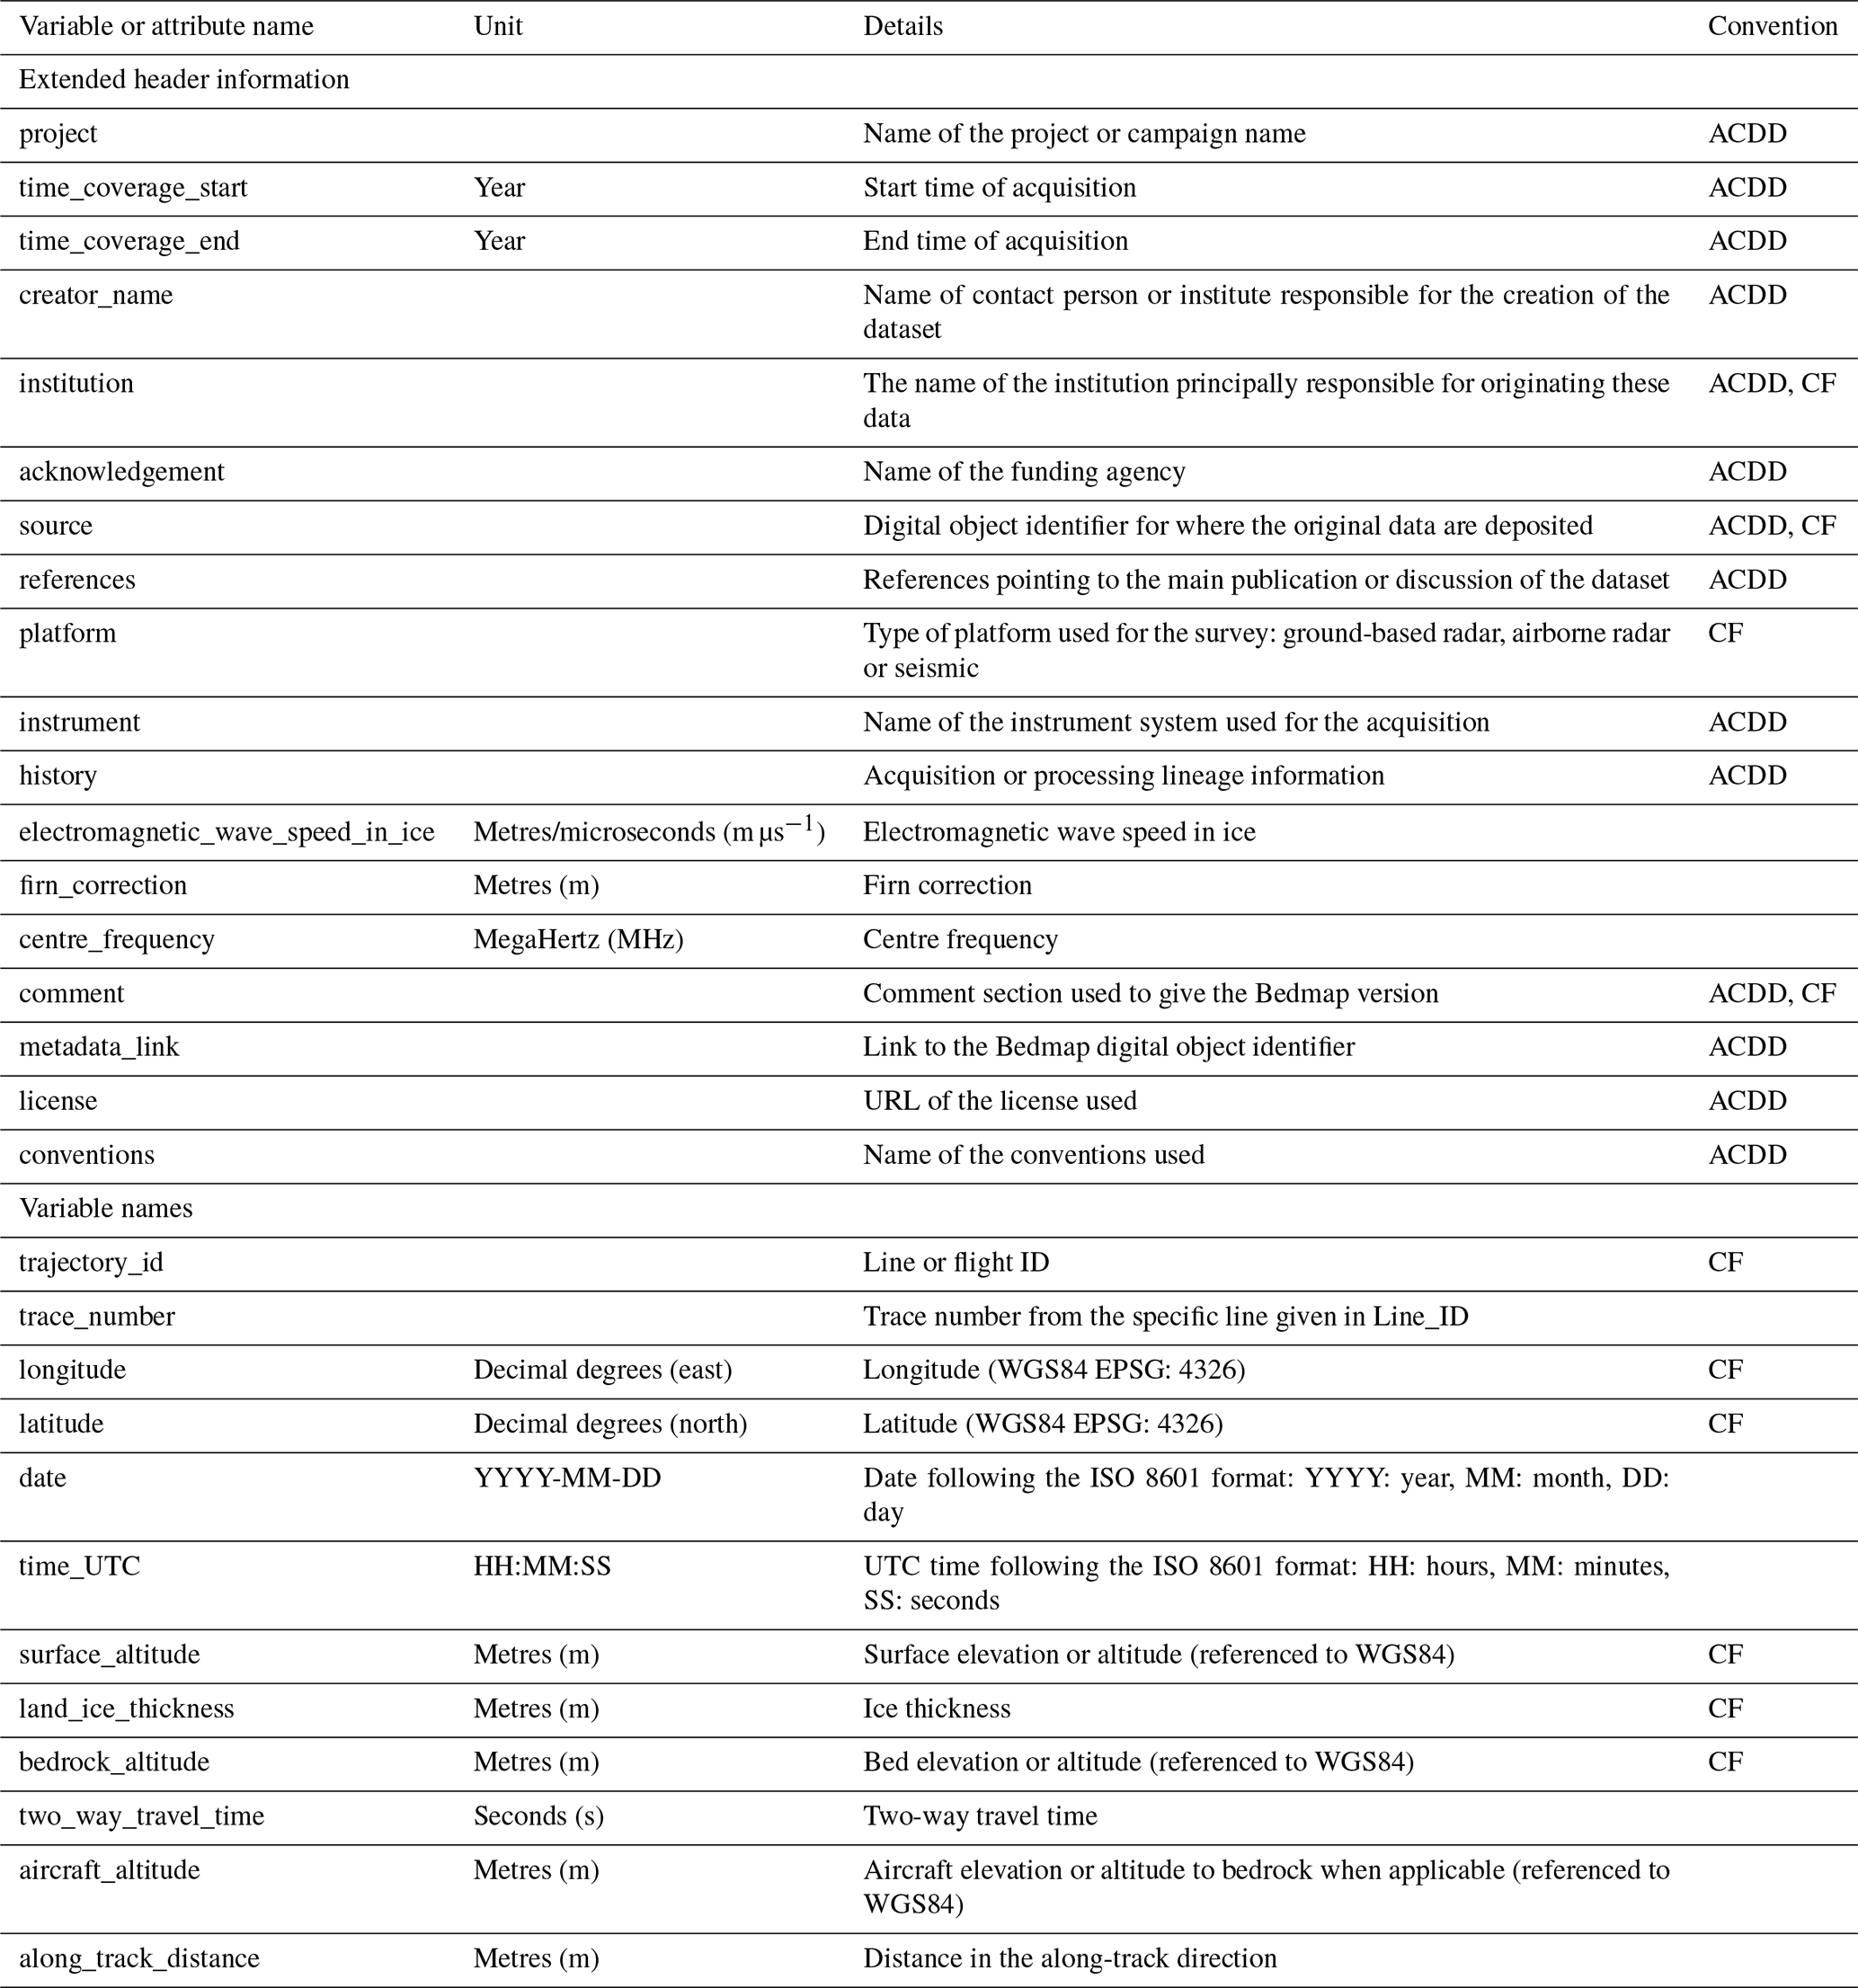
Table 3Example of header information provided for the 2018 Thwaites Glacier radar data. The extended header section can be described as follows: (a) each line is introduced by a comment (“#”) character, (b) each line contains a single header item, (c) the colon character (“:”) is used as the key/value separator, (d) units are in parentheses and (e) attributes preferably use a common vocabulary such as the CF convention and include attributes from the ACDD.
The links provided in the table below were last accessed on 29 May 2023.
3.3 Summarized point data
In addition to providing standardized CSV data (see Sect. 3.1), we also provide the data as shapefile and geopackage lines and statistically summarized points. Lines were calculated automatically from the point data and split each time a gap of more than 5 km between two data points was found. For Bedmap1, due to the sparsity of points, it was not possible to convert the data to shapefile or geopackage lines; thus, only the Bedmap1 shapefile points are provided as part of this data release. Please also note that the Bedmap1 data are not split per campaign as per Bedmap2 and Bedmap3 and are only provided as a single geopackage or as shapefile point files.
The spatial distribution of the full-resolution survey point data is heterogeneous with, for example, dense, metre-scale sampling along modern flight lines that are often separated across-track by kilometres to hundreds of kilometres, and this heterogeneity varies between campaigns and data providers. Uneven data distribution can cause gridding algorithms to be overly weighted to those areas with the highest sampling frequency, to the detriment of adjacent areas with valid data but sparser sampling. To reduce the impact of data density on gridding, the statistically summarized shapefile/geopackage point dataset (centred on a continent-wide 500 m × 500 m grid) reports the average values of the full-resolution survey data plus information on their distribution (Table 4). These summary statistics enable assessment of the confidence in the averaged data values and the variability of the measurements within each cell (e.g. bed roughness). Figure 2 gives an insight into the mean values of ice thickness, bed elevation, and surface elevation as well as the number of points per cells used for the calculation.
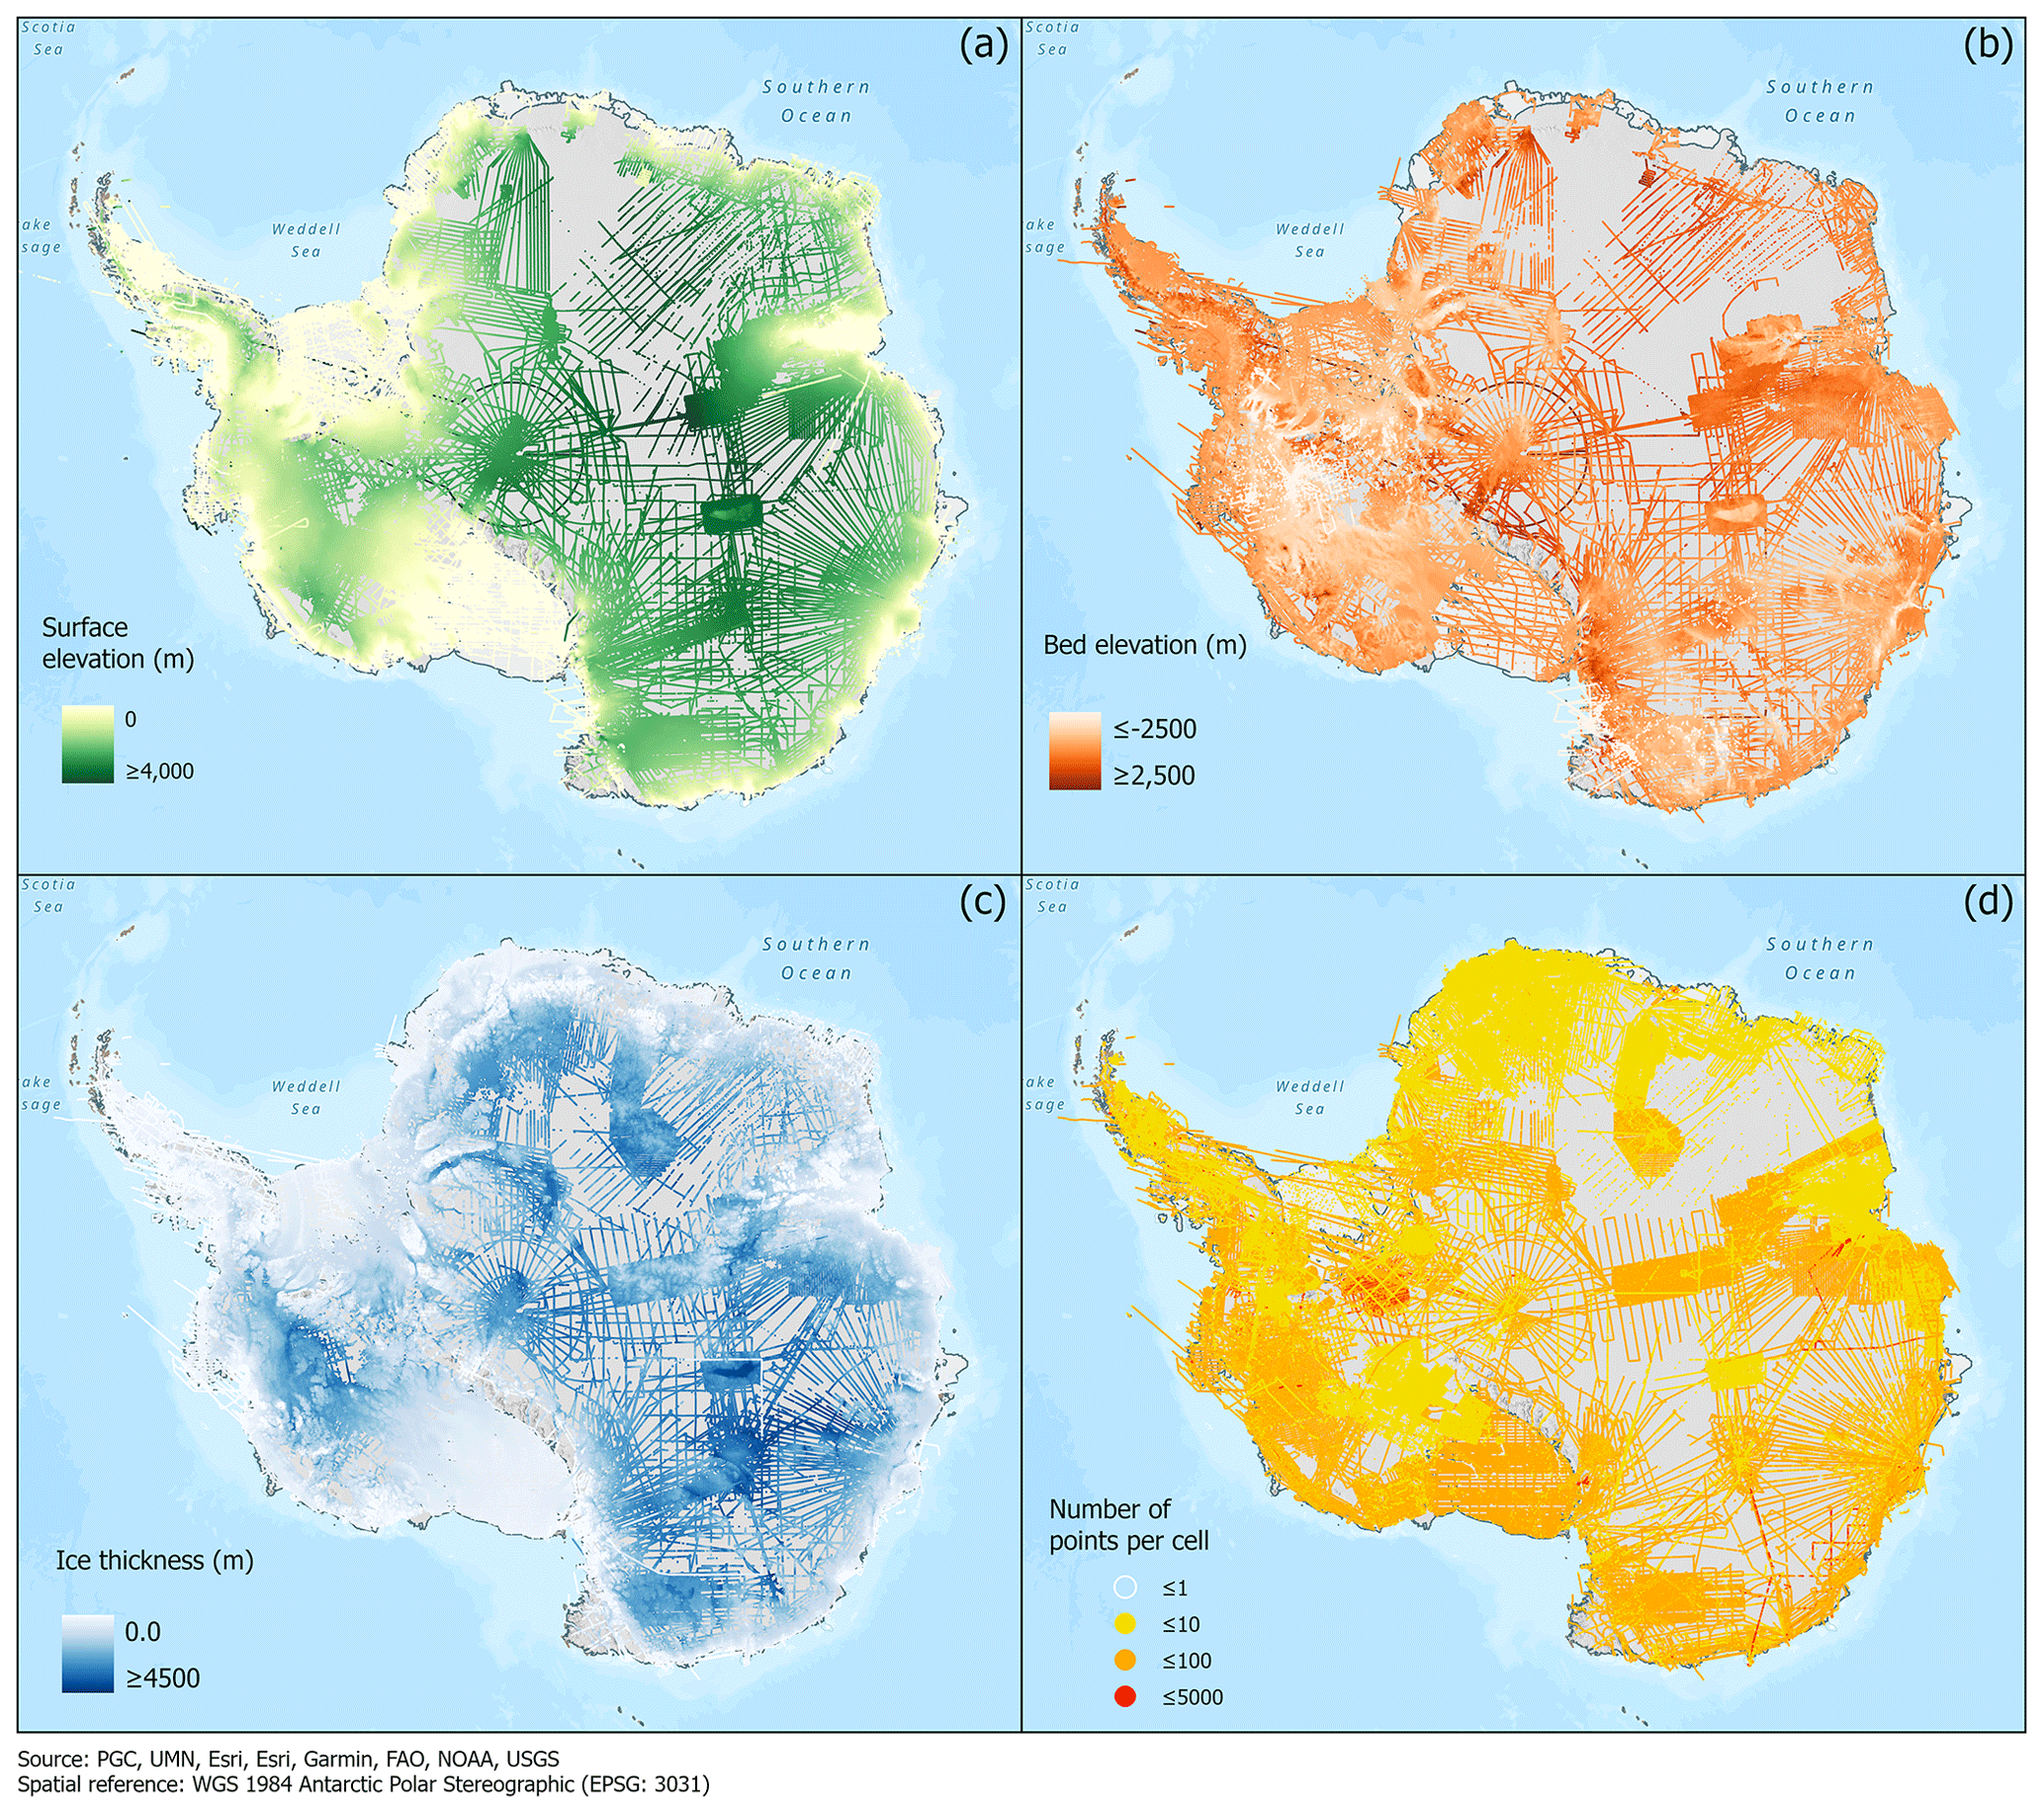
Figure 2Statistically summarized data points. (a) Mean surface elevation in metres over Antarctica. (b) Mean bed elevation in metres over Antarctica. (c) Mean ice thickness in metres over Antarctica. (d) Number of points per cell used for the calculation of ice thickness. All elevation values in panels (a)–(b) are given with reference to the WGS84 ellipsoid.
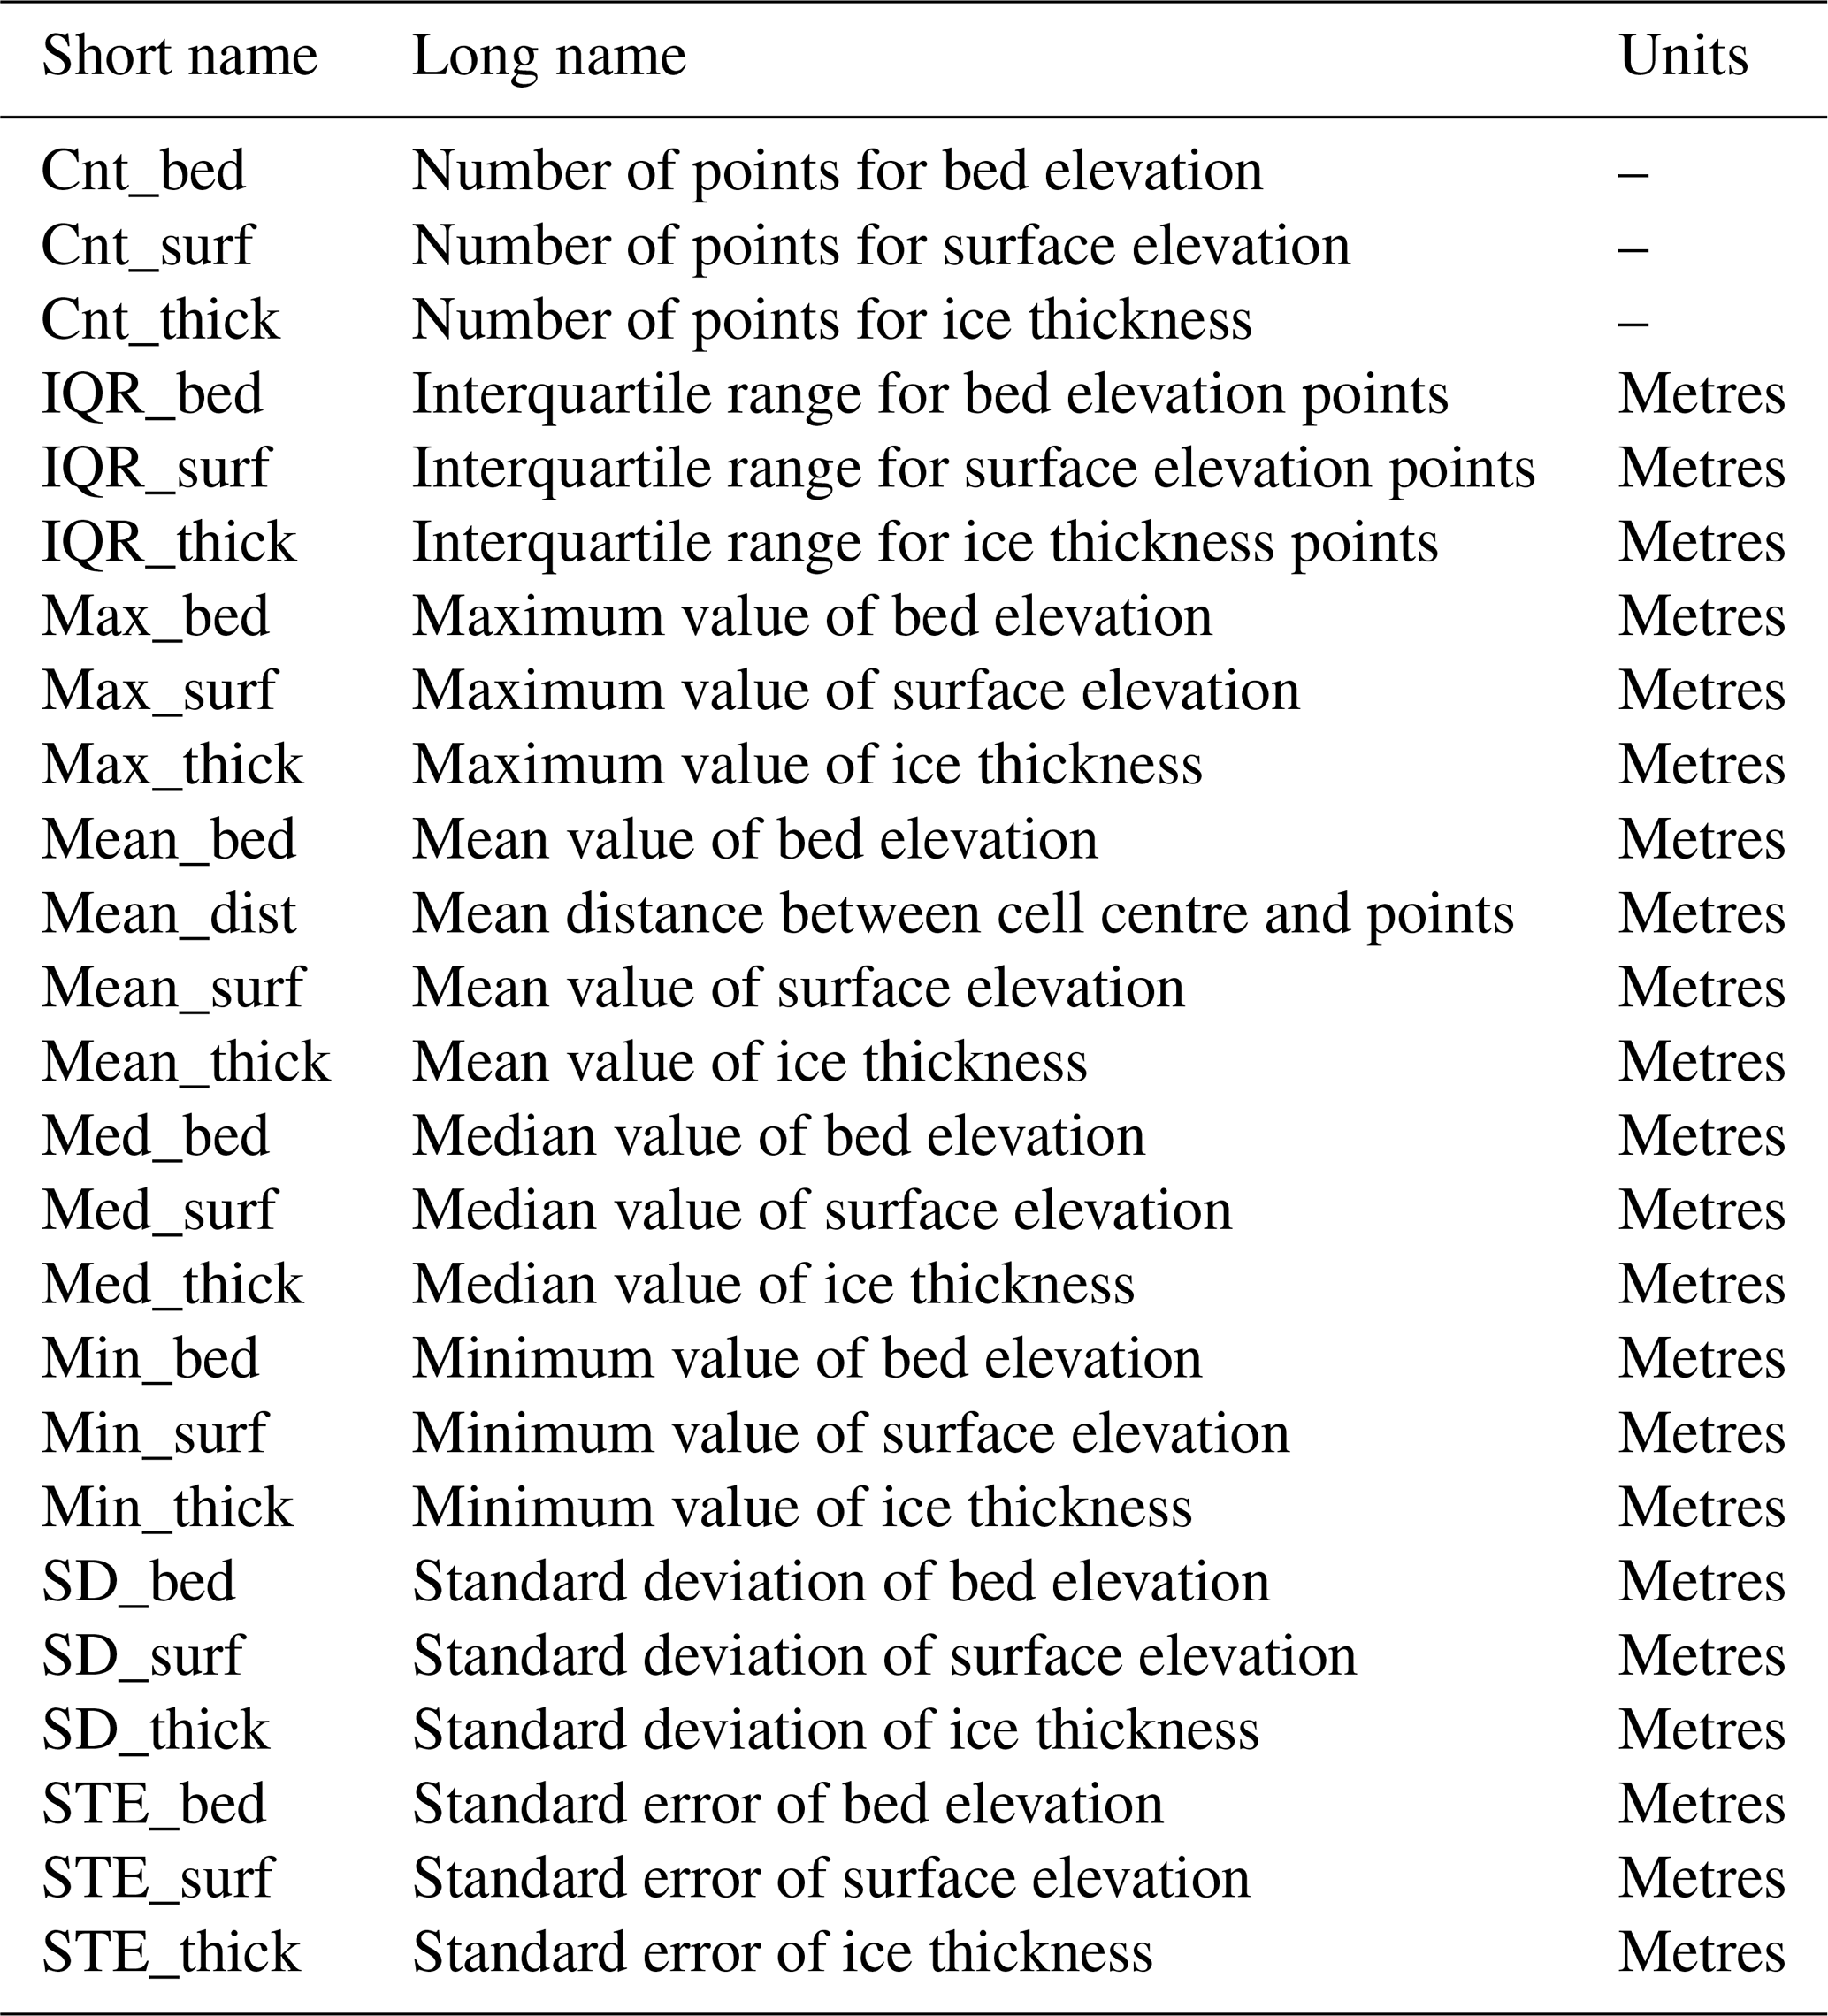
Table 4List of summary statistics calculated for each shapefile point. For each variable, we provide its short name, long name and associated unit when applicable. These statistics are calculated for each point of the shapefile point file.
3.4 Quality control and limitations
The purpose of this data release is to include all possible data collected over the last 60 years without discriminating the quality of the data. Data have been directly compiled from the data providers, with only minimal quality checks: all non-value data were converted to −9999, including any negative ice thickness values and any points with clear outliers. We checked the minimum and maximum values of each field to ensure the data are in a reasonable range and calculated the mean and standard deviation on each dataset to identify potential issues. For example, if longitude–latitude values did not fall within the expected −180 to 180∘ or −50 to −90∘ ranges respectively, the entire row was removed. When no ice thickness values were provided but surface and bed elevation values existed, we simply calculated ice thickness by subtracting the surface value from the bed value. At times, bed elevation was higher than surface elevation, likely due to issues with the semi-automatic picker used to extract the surface and bed reflector or a lack of distinctive reflectors in areas of shallow ice. To prevent this from affecting the gridded product, we converted these values to −9999 for both the surface and the bed. Finally, we also conducted routine checks on the ice thickness data by comparing the given ice thickness value with the inferred ice thickness calculated from subtracting surface with bed. If these did not match, we placed −9999 on the ice thickness values.
File-naming conventions were also used throughout to easily identify a specific dataset as follows: DataProvider_Year_CampaignName_TypeofData_BM3. The type of data used were separated into three categories: airborne radar (AIR), ground-based radar (GRN), and seismic (SEI) data. The “BM3” abbreviation at the end identifies the datasets as part of the Bedmap3 compilation to differentiate them from the Bedmap1 and Bedmap2 (BM1 and BM2) compilations. For instance, the file named “NASA_2019_ICEBRIDGE_AIR_BM3.csv” refers to the ICEBRIDGE airborne campaign led by NASA in 2019. Providing an overall uncertainty value for all the bed elevations compiled by Bedmap is challenging due to the number of data providers and radar systems used in the last 60 years (see the Appendix tables). This uncertainty is often calculated as the root-mean-square error (RMSE) of bed elevation values at crossover points across a survey area (e.g. Fremand et al., 2022a). This error typically amounts to tens of metres and is constrained by changing bed characteristics, the radar system used, the processing of the data, and the value used for the propagation of radar waves through ice which is used to convert the radar two-way travel time to depth in metres. The metadata compiled by Bedmap for each survey provide information on whether any firn correction has been applied to the elevation values and on the value used for speed of electromagnetic waves through the ice.
In order to address the uncertainty in elevation values for the entire Bedmap dataset, we provide standard deviation, interquartile range, and standard error statistical parameters which are key to determining the variability of values in each 500 m × 500 m cell. The standard deviation represents the typical deviation of each data point to the mean value of the specific cell and thus can be used to assess how accurately the mean value is representative of the real values. The standard error gives information about the variability across all the data points in the specific cell and is used to estimate how well a specific data point is representative of the whole population. A high standard error indicates that the data within a specific cell are widely spread around the population mean. The interquartile range calculates the difference between the first quartile and the third quartile and is used to measure the variability of the middle 50 % of all the values. In contrast to the standard error and standard deviation, the interquartile range is not affected by extreme outliers that are present in a specific cell. Together, these parameters are used to assess the level of confidence in the data, where low values reflect a stronger fidelity in the data.
We also note that the spatial accuracy of datasets included in Bedmap2 and Bedmap3 is significantly higher than for Bedmap1 due to the use of high-resolution GPS data, which have allowed for much better accuracy in the location of the measurements for all surveys acquired from the 1990s onwards. The accuracy of each bed elevation or ice thickness value can vary from sub-metre accuracy for modern GPS measurements (Fremand et al., 2022a) to several kilometres for data compiled as part of the Bedmap1 dataset (Schroeder et al., 2019). As this spatial uncertainty directly impacts the position of the elevation values and therefore their accuracy, the elevation uncertainty statistical parameters can be used to indirectly assess the confidence in the spatial accuracy. However, the statistical parameters are only meaningful if a representative set of points is used to calculate the ice thickness, bed elevation, and surface elevation.
As part of the follow-up publication to this paper introducing the new Bedmap3 gridded products, we will include the final grids and maps that will study and exclude possible crossover errors and other possible problems in order to provide high-quality gridded products.
The Bedmap source data are available via the UK Polar Data Centre (PDC, https://www.bas.ac.uk/data/uk-pdc/, last access: 1 March 2023), a trusted repository whose purpose is to manage polar datasets. Part of the Environment Data Services (EDS) of the Natural Environment Research Council (NERC) and certified by the CoreTrustSeal (https://www.coretrustseal.org/, last access: 1 March 2023), the PDC applies best data management practices and requirements to facilitate re-use of the datasets stored in its data catalogue (https://data.bas.ac.uk/, last access: 1 March 2023). To increase the discoverability of the datasets, a specific data portal – the SCAR BEDMAP Data Portal (https://bedmap.scar.org, last access: 1 March 2023) – has been developed by the Mapping And Geographic Information Centre (MAGIC) team from the British Antarctic Survey (BAS). The publishing procedure described here is expected to be used for all upcoming versions of Bedmap with regular updates allowing new source data to be easily accessible to the community.
Below, we discuss the release of the datasets centred around the FAIR data principles (Sect. 4.1) and present the data portal infrastructure and its functionalities (Sect. 4.2).
4.1 FAIR data publishing
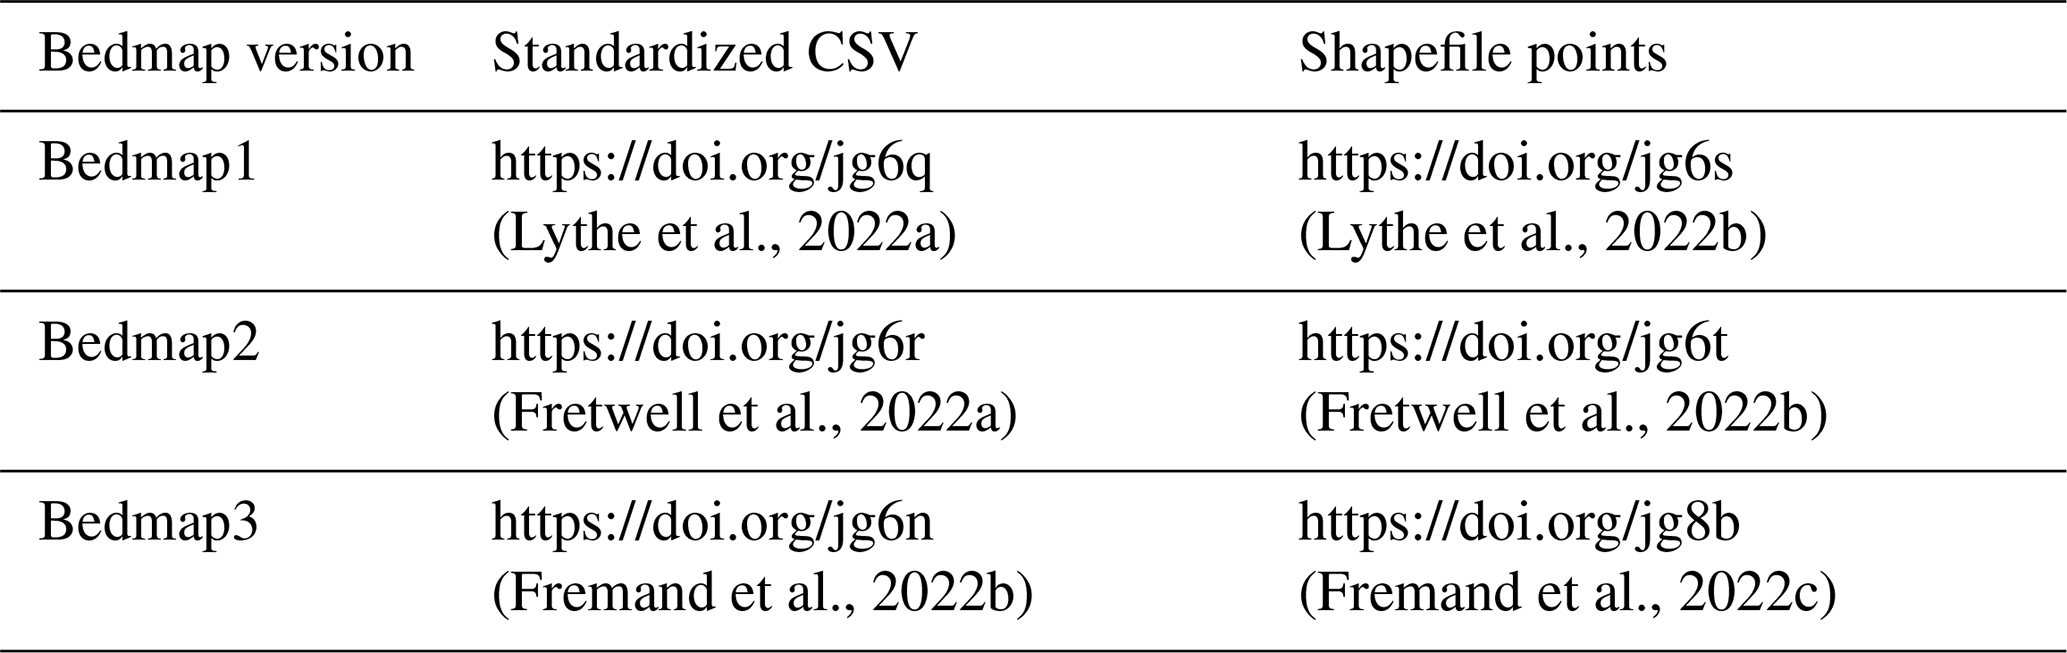
The source data for each version of Bedmap have been published as two separate digital object identifier (DOI) datasets: the first dataset contains all the standardized CSV files described in Sect. 3.1, and the second dataset contains all the lines and point shapefiles as discussed in Sect. 3.2.
The derived gridded Bedmap products are also published as separate DOI datasets. Previously available through ftp services, Bedmap1 and Bedmap2 products are now citable and properly stored for long-term preservation. Table 5 presents the different links to the data for the different versions of Bedmap.
Table 5List of references for the Bedmap products. For each Bedmap product (Bedmap1, Bedmap2, and Bedmap3), we provide the link to the standardized CSV and shapefile data.
To make the data findable, ISO 19115/19139 metadata are provided for each dataset. Each metadata record provides general information about the dataset and is registered and indexed accordingly in the UK PDC data catalogue Discovery Metadata System (https://data.bas.ac.uk/, last access: 1 March 2023) and the NERC data catalogue (https://data-search.nerc.ac.uk/, last access: 1 March 2023). More detailed information can be found in the extended header of the CSV data, such as the name of the data providers, the funding received, and a reference to cite the data. Although the metadata are succinct, it is possible to easily transform the CSV data to NetCDF with extended metadata as shown in the Geophysics Book (https://antarctica.github.io/PDC_GeophysicsBook/BEDMAP/Get_full_metadata_from_CSV_file.html, last access: 1 March 2023).
A DOI is provided for every Bedmap dataset (Table 5), making them retrievable and citable. For previously published datasets, the original DOI is provided in the source metadata (Sect. 3.2) to ensure traceability and should be used when the survey is used individually.
For universal accessibility, the data are downloadable through a standard HTTPS protocol where no login account is required. We used the web-based RAMADDA (Repository for Archiving and MAnaging Diverse DAta; https://geodesystems.com/, last access: 5 May 2023) data repository system, which is an open-source content and data management platform and which works following a simple folder structure, with datasets organized by data-provider name to replicate the structure of the data portal.
To enhance interoperability and reusability, we published the underlying data using a specific CSV format, with detailed and standardized variable names coming from FAIR vocabularies (see Table 4 and Sect. 3.2). To be re-usable, the data are released under Creative Commons license CC-BY (https://creativecommons.org/licenses/by/4.0/, last access: 1 March 2023, Creative Commons – Attribution 4.0 International – CC BY 4.0, 2023), which allows any user to use the data freely and with flexibility while at the same time ensuring acknowledgment of those involved in the collection and processing of the data. Keywords from the Global Change Master Directory (GCMD, 2023) are used to describe the data in a consistent and comprehensive manner and to increase the interoperability of the datasets. The end goal is to provide all the information necessary for effective, long-term data re-use. In addition, we developed interactive, open-source Jupyter Notebook tutorials written in Python to interact with the data programatically. Codes to convert the standardized CSV files to the point and line files as described in Sect. 3.3 are provided for example. These resources are archived in the BAS GitHub repository and provided via an interactive web interface using Jupyter Book (https://antarctica.github.io/PDC_GeophysicsBook, last access: 1 March 2023, UK Polar Data Centre, 2023a). In addition, a specific Python package allows one to read and plot the specific CSV-formatted data (https://github.com/paul-breen/xcsv, last access: 5 May 2023, Breen, 2023). We believe these to be beneficial for assisting users in accessing the data and reproducing their own gridded products independently of the Bedmap project.
4.2 The SCAR Bedmap Data Portal
The newly developed SCAR Bedmap Data Portal (https://bedmap.scar.org, last access: 1 March 2023) provides a common endpoint for interacting with the Bedmap source data and products. The web-map architecture is based upon the well-used SCAR Antarctic Digital Database web map (https://add.scar.org, last access: 1 March 2023). The data portal is divided into five layer menus: “Base layers”, “Topographic information”, “BEDMAP1”, “BEDMAP2”, and “BEDMAP3”. The first menu contains the gridded products: ice bed, surface, and thickness grids for Antarctica currently contain Bedmap2 grids; these will be updated with new Bedmap3 grids as they become available. The second menu contains general topographic information such as coastline and ice–land surface contours taken from the Antarctic Digital Database (Gerrish et al., 2023). The three Bedmap tabs contain the shapefile layers for individual campaigns. When clicking on a point of the map, the user has direct access to the information of the survey and statistics for the specific point (see Table 4).
At the top of the interface, several widgets are available, designed to help users with basic tasks such as measuring distances, areas, and elevations or to search for specific place names. The link to the direct download repository is also provided.
All the data included in this paper are freely available from the UK Polar Data Centre (https://data.bas.ac.uk, last access: 1 March 2023) and the SCAR Bedmap Data Portal (https://bedmap.scar.org, last access: 1 March 2023).
-
BEDMAP1:
-
https://doi.org/jg6q (Lythe et al., 2022a);
-
https://doi.org/jg6s (Lythe et al., 2022b);
-
https://doi.org/j2vz (Lythe et al., 2023).
-
-
BEDMAP2:
-
https://doi.org/jg6r (Fretwell et al., 2022a);
-
https://doi.org/jg6t (Fretwell et al., 2022b);
-
https://doi.org/jg6p (Fretwell et al., 2022c).
-
-
BEDMAP3:
-
https://doi.org/jg6n (Fremand et al., 2022b);
-
https://doi.org/jg8b (Fremand et al., 2022c).
-
The data can be downloaded directly from the RAMADDA interface by clicking on the “GET DATA” link from the metadata page or using wget commands as documented in the following instructions: https://antarctica.github.io/PDC_GeophysicsBook/BEDMAP/Downloading_the_Bedmap_data.html (last access: 1 March 2023, UK Polar Data Centre, 2023b).
When using these data, please also cite the DOI citation provided in the source CSV metadata if this exists.
The user guide for the data portal and the Jupyter Notebook tutorials designed for reading the standardized CSV ice bed, elevation, and thickness data or creating the shapefiles are accessible on the Jupyter Book interface in the BEDMAP3 section (https://antarctica.github.io/PDC_GeophysicsBook, last access: 1 March 2023, UK Polar Data Centre, 2023a) or via the BAS GitHub repository (https://github.com/antarctica/PDC_GeophysicsBook, last access: 1 March 2023; DOI: https://doi.org/10.5281/zenodo.7821671, Fremand, 2023). A specific library called xcsv (https://github.com/paul-breen/xcsv, last access: 1 March 2023, Breen, 2023, last access: 1 March 2023) allows one to read and plot data in the extended CSV format as described in Section 3.2.
We have presented here the release of the source survey data on ice thickness, bed elevation, and surface elevation data used in Bedmap gridded products, including the upcoming Bedmap3. Altogether, this data release represents over 82 million data points collected as part of 277 campaigns since the 1950s. In addition to the previous Bedmap1 and Bedmap2 datasets, here we have gathered new ice thickness data from 84 surveys, adding 50 million additional data points to those previous compilations. We have developed a standardized CSV format in order to ensure interoperability between the different datasets, which we have checked following a specific quality-control procedure and summarized on a 500 m × 500 m grid to provide key statistics at the scale needed for the Bedmap3 gridded products.
The data have been published following the FAIR data principles. In particular, we have provided extensive metadata with commonly used keywords and have developed a data portal that provides a user-friendly interface to interact with and download the data. By providing and displaying both the source data and grids, the data portal allows any user to investigate the uncertainty of the gridding in specific areas and analyse differences between measurements and gridded interpolations.
We believe that this data release will benefit the glaciology and broader Earth science community, particularly in emerging fields such as machine learning and geostatistics which can now make use of these standardized data and reproduce and create new compilation grids at different scales independently of the Bedmap grids. These standardized, freely available, and previously unpublished datasets will lead to improved assessment of fundamental properties of the Antarctic Ice Sheet and predictions of its future contribution to sea level rise, increasing the value of these important data.
The supplement related to this article is available online at: https://doi.org/10.5194/essd-15-2695-2023-supplement.
ACF, PF, and JAB co-led this data release. ACF and JAB standardized the data. The Jupyter Notebook was developed by ACF. PF and HDP initiated the collaboration and PF liaised with all the data providers. ACF wrote the initial manuscript with input from PF, JAB, and HDP. PF designed and populated the web map. EF helped with the design of the web map.
AA, BS, OE, PF, JG, JL, KM, MM, FP, SVP, HDP, ACF, JAB, JR, DMS, MJS, DS, KT, XC, and DAY were all members of the Bedmap3 SCAR Core Group and contributed to the overall project and standardization criteria.
PF, HDP, AA, JLB, RB, CB, RGB, DDB, GCas, GCat, KC, HC, HFJC, XC, DD, VD, RD, GE, OE, HE, FF, RF, StF, ShF, YG, VG, SPG, JG, BH, RCAH, AOH, PH, NH, JWH, ANH, AH, RWJ, DJ, AJ, WJ, TJ, EK, JK, WK, MKG, KL, JL, GL, CL, BL, JMa, EM, KM, JMo, FON, YN, OAN, JP, FP, SVP, ER, DMR, ARi, JR, NR, ARu, DMS, MJS, AMS, DS, MS, BS, IT, KT, SU, DV, BCW, DSW, DAY, and AZ contributed to the data. All the authors commented on and contributed to the final edits of the manuscript prior to publication.
At least one of the (co-)authors is a member of the editorial board of Earth System Science Data. The peer-review process was guided by an independent editor, and the authors also have no other competing interests to declare.
Publisher’s note: Copernicus Publications remains neutral with regard to jurisdictional claims in published maps and institutional affiliations.
We would like to thank the Bedmap3 SCAR Action Group for their role in the coordination and guidance in the project.
We would like to dedicate this paper to the many scientists who have collected geophysical field data in harsh and extreme conditions over the Antarctic ice sheets over the last 60 years. Their commitment, dedication, and drive have populated this dataset and have greatly advanced polar science.
Funding for the British Antarctic Survey staff came from Natural Environment Research Council core funds.
Funding for the data collection came from many grants, institutions, and projects. These are individually cited where appropriate in the metadata of the datasets.
This research has been supported by the Natural Environment Research Council (grant no. NE/R016038/1).
This paper was edited by Ken Mankoff and reviewed by Johnathan Kool and one anonymous referee.
Bell, R. E., Ferraccioli, F., Creyts, T. T., Braaten, D., Corr, H., Das, I., Damaske, D., Frearson, N., Jordan, T., Rose, K., and Studinger, M.: Widespread persistent thickening of the East Antarctic Ice Sheet by freezing from the base, Science, 331, 1592–1595, https://doi.org/10.1126/science.1200109, 2011.
Breen, P.: xcsv, GitHub [code], https://github.com/paul-breen/xcsv, last access: 1 March 2023.
Canada World Ozone and Ultraviolet Radiation Data Centre: File formats, https://woudc.org/about/formats.php, last access: 1 March 2023.
Creative Commons – Attribution 4.0 International – CC BY 4.0: https://creativecommons.org/licenses/by/4.0/, last access: 1 March 2023.
CSV on the Web: A Primer, https://www.w3.org/TR/tabular-data-primer/ (last access: 29 July 2022), 2016.
Cui, X., Jeofry, H., Greenbaum, J. S., Guo, J., Li, L., Lindzey, L. E., Habbal, F. A., Wei, W., Young, D. A., Ross, N., Morlighem, M., Jong, L. M., Roberts, J. L., Blankenship, D. D., Bo, S., and Siegert, M. J.: Bed topography of Princess Elizabeth Land in East Antarctica, Earth Syst. Sci. Data, 12, 2765–2774, https://doi.org/10.5194/essd-12-2765-2020, 2020.
DeConto, R. M. and Pollard, D.: Contribution of Antarctica to past and future sea-level rise, Nature, 531, 591–597, https://doi.org/10.1038/nature17145, 2016.
DeConto, R. M., Pollard, D., Alley, R. B., Velicogna, I., Gasson, E., Gomez, N., Sadai, S., Condron, A., Gilford, D. M., Ashe, E. L., Kopp, R. E., Li, D., and Dutton, A.: The Paris Climate Agreement and future sea-level rise from Antarctica, Nature, 593, 83–89, https://doi.org/10.1038/s41586-021-03427-0, 2021.
Drewry, D. J.: Radio echo sounding map of Antarctica, (∼ 90∘ E–180∘), Polar Rec., 17, 359–374, https://doi.org/10.1017/S0032247400032186, 1975.
Drewry, D. J.: Antarctica: glaciological and geophysical folio, University of Cambridge, Scott Polar Research Institute Cambridge, UK, ISBN 0-901021-04-0, 1983.
Drewry, D. J., Jordan, S. R., and Jankowski, E.: Measured Properties of the Antarctic Ice Sheet: Surface Configuration, Ice Thickness, Volume and Bedrock Characteristics, Ann. Glaciol., 3, 83–91, https://doi.org/10.3189/S0260305500002573, 1982.
Eagles, G., Karlsson, N.B., Ruppel, A., Steinhage, D., Jokat, W., and Läufer, A.: Erosion at extended continental margins: Insights from new aerogeophysical data in eastern Dronning Maud Land, Gondwana Res., 63, 105–116, https://doi.org/10.1016/j.gr.2018.05.011, 2018.
Earth Science Information Partners: Attribute Convention for Data Discovery 1–3, https://wiki.esipfed.org/Attribute_Convention_for_Data_Discovery_1-3, last access: 1 March 2023.
Ferraccioli, F., Finn, C. A., Jordan, T. A., Bell, R. E., Anderson, L. M., and Damaske, D.: East Antarctic rifting triggers uplift of the Gamburtsev Mountains, Nature, 479, 388–392, https://doi.org/10.1038/nature10566, 2011.
Forsberg, R., Olesen, A. V., Ferraccioli, F., Jordan, T. A., Matsuoka, K., Zakrajsek, A., Ghidella, M., and Greenbaum, J. S.: Exploring the Recovery Lakes region and interior Dronning Maud Land, East Antarctica, with airborne gravity, magnetic and radar measurements, Geological Society, London, Special Publications, 461, 23, https://doi.org/10.1144/SP461.17, 2017.
Fox-Kemper, B., Hewitt, H. T., Xiao, C., Aðalgeirsdóttir, G., Drijfhout, S. S., Edwards, T. L., Golledge, N. R., Hemer, M., Kopp, R. E., Krinner, G., Mix, A., Notz, D., Nowicki, S., Nurhati, I. S., Ruiz, L., Sallée, J.-B., Slangen, A. B. A., and Yu, Y.: Ocean, Cryosphere and Sea Level Change, in: Climate Change 2021: The Physical Science Basis. Contribution of Working Group I to the Sixth Assessment Report of the Intergovernmental Panel on Climate Change, edited by: Masson-Delmotte, V., Zhai, P., Pirani, A., Connors, S. L., Péan, C., Berger, S., Caud, N., Chen, Y., Goldfarb, L., Gomis, M. I., Huang, M., Leitzell, K., Lonnoy, E., Matthews, J. B. R., Maycock, T. K., Waterfield, T., Yelekçi, O., Yu, R., and Zhou, B., Cambridge University Press, Cambridge, United Kingdom and New York, NY, USA, 1211–1362, https://doi.org/10.1017/9781009157896.011, 2021.
Frederick, B. C., Young, D. A., Blankenship, D. D., Richter, T. G., Kempf, S. D., Ferraccioli, F., and Siegert, M. J.: Distribution of subglacial sediments across the Wilkes Subglacial Basin, East Antarctica, J. Geophys. Res.-Earth, 121, 790–813, https://doi.org/10.1002/2015JF003760, 2016.
Fremand, A.: Polar Data Centre Geophysics book including Jupyter Notebooks for airborne geophysics and Bedmap projects – Snapshot (1.0), Zenodo [code], https://doi.org/10.5281/zenodo.7821671, 2023.
Frémand, A. C., Bodart, J. A., Jordan, T. A., Ferraccioli, F., Robinson, C., Corr, H. F. J., Peat, H. J., Bingham, R. G., and Vaughan, D. G.: British Antarctic Survey's aerogeophysical data: releasing 25 years of airborne gravity, magnetic, and radar datasets over Antarctica, Earth Syst. Sci. Data, 14, 3379–3410, https://doi.org/10.5194/essd-14-3379-2022, 2022a.
Fremand, A., Fretwell, P., Bodart, J., et al.: BEDMAP3 – Ice thickness, bed and surface elevation for Antarctica – standardised data points (Version 1.0), NERC EDS UK Polar Data Centre [data set], https://doi.org/jg6n, 2022b.
Fremand, A., Bodart, J., Fretwell, P., et al.: BEDMAP3 – Ice thickness, bed and surface elevation for Antarctica – standardised shapefiles and geopackages (Version 1.0), NERC EDS UK Polar Data Centre [data set], https://doi.org/jg8b, 2022c.
Fretwell, P., Pritchard, H. D., Vaughan, D. G., Bamber, J. L., Barrand, N. E., Bell, R., Bianchi, C., Bingham, R. G., Blankenship, D. D., Casassa, G., Catania, G., Callens, D., Conway, H., Cook, A. J., Corr, H. F. J., Damaske, D., Damm, V., Ferraccioli, F., Forsberg, R., Fujita, S., Gim, Y., Gogineni, P., Griggs, J. A., Hindmarsh, R. C. A., Holmlund, P., Holt, J. W., Jacobel, R. W., Jenkins, A., Jokat, W., Jordan, T., King, E. C., Kohler, J., Krabill, W., Riger-Kusk, M., Langley, K. A., Leitchenkov, G., Leuschen, C., Luyendyk, B. P., Matsuoka, K., Mouginot, J., Nitsche, F. O., Nogi, Y., Nost, O. A., Popov, S. V., Rignot, E., Rippin, D. M., Rivera, A., Roberts, J., Ross, N., Siegert, M. J., Smith, A. M., Steinhage, D., Studinger, M., Sun, B., Tinto, B. K., Welch, B. C., Wilson, D., Young, D. A., Xiangbin, C., and Zirizzotti, A.: Bedmap2: improved ice bed, surface and thickness datasets for Antarctica, The Cryosphere, 7, 375–393, https://doi.org/10.5194/tc-7-375-2013, 2013.
Fretwell, P., Fremand, A., Bodart, J., et al.: BEDMAP2 – Ice thickness, bed and surface elevation for Antarctica – standardised data points (Version 1.0), NERC EDS UK Polar Data Centre [data set], https://doi.org/jg6r, 2022a.
Fretwell, P., Pritchard, H., Vaughan, D., et al.: BEDMAP2 – Ice thickness, bed and surface elevation for Antarctica – standardised shapefiles and geopackages (Version 1.0), NERC EDS UK Polar Data Centre [data set], https://doi.org/jg6t, 2022b.
Fretwell, P., Pritchard, H. D., Vaughan, D. G., Bamber, J. L., Barrand, N. E., Bell, R., Bianchi, C., Bingham, R. G., Blankenship, D. D., Casassa, G., Catania, G., Callens, D., Conway, H., Cook, A. J., Corr, H. F. J., Damaske, D., Damm, V., Ferraccioli, F., Forsberg, R., Fujita, S., Gim, Y., Gogineni, P., Griggs, J. A., Hindmarsh, R. C. A., Holmlund, P., Holt, J. W., Jacobel, R. W., Jenkins, A., Jokat, W., Jordan, T., King, E. C., Kohler, J., Krabill, W., Riger-Kusk, M., Langley, K. A., Leitchenkov, G., Leuschen, C., Luyendyk, B. P., Matsuoka, K., Mouginot, J., Nitsche, F. O., Nogi, Y., Nost, O. A., Popov, S. V., Rignot, E., Rippin, D. M., Rivera, A., Roberts, J., Ross, N., Siegert, M. J., Smith, A. M., Steinhage, D., Studinger, M., Sun, B., Tinto, B. K., Welch, B. C., Wilson, D., Young, D. A., Xiangbin, C., and Zirizzotti, A.: BEDMAP2 – Ice thickness, bed and surface elevation for Antarctica – gridding products (Version 1.0), NERC EDS UK Polar Data Centre [data set], https://doi.org/jg6p, 2022c.
Gardner, A. S., Moholdt, G., Scambos, T., Fahnstock, M., Ligtenberg, S., van den Broeke, M., and Nilsson, J.: Increased West Antarctic and unchanged East Antarctic ice discharge over the last 7 years, The Cryosphere, 12, 521–547, https://doi.org/10.5194/tc-12-521-2018, 2018.
Gerrish, L., Ireland, L., Fretwell, P., and Cooper, P.: High resolution vector polygons of the Antarctic coastline (7.7), UK Polar Data Centre, Natural Environment Research Council, UK Research & Innovation [data set], https://doi.org/10.5285/0be5339c-9d35-44c9-a10f-da4b5356840b, 2023.
Global Change Master Directory (GCMD): GCMD Keywords, Version 15.9, Earth Science Data and Information System, Earth Science Projects Division, Goddard Space Flight Center (GSFC), National Aeronautics and Space Administration (NASA), https://forum.earthdata.nasa.gov/app.php/tag/GCMD+Keywords, last access: 29 May 2023.
Golledge, N. R., Kowalewski, D. E., Naish, T. R., Levy, R. H., Fogwill, C. J., and Gasson, E. G. W.: The multi-millennial Antarctic commitment to future sea-level rise, Nature, 526, 421–425, https://doi.org/10.1038/nature15706, 2015.
Hassell, D., Gregory, J., Blower, J., Lawrence, B. N., and Taylor, K. E.: A data model of the Climate and Forecast metadata conventions (CF-1.6) with a software implementation (cf-python v2.1), Geosci. Model Dev., 10, 4619–4646, https://doi.org/10.5194/gmd-10-4619-2017, 2017.
Holt, J. W., Blankenship, D. D., Morse, D. L., Young, D. A., Peters, M. E., Kempf, S. D., Richter, T. G., Vaughan, D. G., and Corr, H. F.: New boundary conditions for the West Antarctic Ice Sheet: Subglacial topography of the Thwaites and Smith glacier catchments, Geophys. Res. Lett., 33, L09502, https://doi.org/10.1029/2005GL025561, 2006.
IETF RFC 4180: Common Format and MIME Type for Comma-Separated Values (CSV) Files, https://www.ietf.org/rfc/rfc4180.txt (last access: 1 March 2023), 2005.
IRIS: GeoCSV: Tabular text formatting for geoscience data, http://geows.ds.iris.edu/documents/GeoCSV.pdf (last access: 29 May 2023), 2015.
Jordan, T. A., Martin, C., Ferraccioli, F., Matsuoka, K., Corr, H., Forsberg, R., Olesen, A., and Siegert, M.: Anomalously high geothermal flux near the South Pole, Sci. Rep., 8, 16785, https://doi.org/10.1038/s41598-018-35182-0, 2018.
Karlsson, N. B., Binder, T., Eagles, G., Helm, V., Pattyn, F., Van Liefferinge, B., and Eisen, O.: Glaciological characteristics in the Dome Fuji region and new assessment for “Oldest Ice”, The Cryosphere, 12, 2413–2424, https://doi.org/10.5194/tc-12-2413-2018, 2018.
Levermann, A., Winkelmann, R., Albrecht, T., Goelzer, H., Golledge, N. R., Greve, R., Huybrechts, P., Jordan, J., Leguy, G., Martin, D., Morlighem, M., Pattyn, F., Pollard, D., Quiquet, A., Rodehacke, C., Seroussi, H., Sutter, J., Zhang, T., Van Breedam, J., Calov, R., DeConto, R., Dumas, C., Garbe, J., Gudmundsson, G. H., Hoffman, M. J., Humbert, A., Kleiner, T., Lipscomb, W. H., Meinshausen, M., Ng, E., Nowicki, S. M. J., Perego, M., Price, S. F., Saito, F., Schlegel, N.-J., Sun, S., and van de Wal, R. S. W.: Projecting Antarctica's contribution to future sea level rise from basal ice shelf melt using linear response functions of 16 ice sheet models (LARMIP-2), Earth Syst. Dynam., 11, 35–76, https://doi.org/10.5194/esd-11-35-2020, 2020.
Lythe, M. B. and Vaughan, D. G.: BEDMAP-bed topography of the Antarctic, British Antarctic Survey, Natural Environment Research Council, https://searchworks.stanford.edu/view/6750519 (last access: 29 May 2023), 2000.
Lythe, M. B. and Vaughan, D. G.: BEDMAP: A new ice thickness and subglacial topographic model of Antarctica, J. Geophys. Res.-Sol. Ea., 106, 11335–11351, https://doi.org/10.1029/2000JB900449, 2001.
Lythe, M., Vaughan, D., BEDMAP 1, consortia, Fremand, A., and Bodart, J.: BEDMAP1 – Ice thickness, bed and surface elevation for Antarctica – standardised data points (Version 1.0), NERC EDS UK Polar Data Centre [data set], https://doi.org/jg6q, 2022a.
Lythe, M., Vaughan, D., BEDMAP 1, consortia, Fremand, A., and Bodart, J.: BEDMAP1 – Ice thickness, bed and surface elevation for Antarctica – standardised shapefiles and geopackages (Version 1.0), NERC EDS UK Polar Data Centre [data set], https://doi.org/jg6s, 2022b.
Lythe, M., Vaughan, D., and BEDMAP 1 Consortia: BEDMAP1 – Ice thickness, bed and surface elevation for Antarctica – gridding products (Version 1.0), NERC EDS UK Polar Data Centre [data set], https://doi.org/j2vz, 2023.
MacGregor, J. A., Boisvert, L. N., Medley, B., Petty, A. A., Harbeck, J. P., Bell, R. E., Blair, J. B., Blanchard-Wrigglesworth, E., Buckley, E. M., Christoffersen, M. S., Cochran, J. R., Csathó, B. M., De Marco, E. L., Dominguez, R. T., Fahnestock, M. A., Farrell, S. L., Gogineni, S. P., Greenbaum, J. S., Hansen, C. M., Hofton, M. A., Holt, J. W., Jezek, K. C., Koenig, L. S., Kurtz, N. T., Kwok, R., Larsen, C. F., Leuschen, C. J., Locke, C. D., Manizade, S. S., Martin, S., Neumann, T. A., Nowicki, S. M. J., Paden, J. D., Richter-Menge, J. A., Rignot, E. J., Rodríguez-Morales, F., Siegfried, M. R., Smith, B. E., Sonntag, J. G., Studinger, M., Tinto, K. J., Truffer, M., Wagner, T. P., Woods, J. E., Young, D. A., and Yungel, J. K.: The Scientific Legacy of NASA's Operation IceBridge, Rev. Geophys., 59, e2020RG000712, https://doi.org/10.1029/2020RG000712, 2021.
Morlighem, M., Rignot, E., Binder, T., Blankenship, D., Drews, R., Eagles, G., Eisen, O., Ferraccioli, F., Forsberg, R., Fretwell, P., Goel, V., Greenbaum, J. S., Gudmundsson, H., Guo, J., Helm, V., Hofstede, C., Howat, I., Humbert, A., Jokat, W., Karlsson, N. B., Lee, W. S., Matsuoka, K., Millan, R., Mouginot, J., Paden, J., Pattyn, F., Roberts, J., Rosier, S., Ruppel, A., Seroussi, H., Smith, E. C., Steinhage, D., Sun, B., Broeke, M. R. van den, Ommen, T. D. van, Wessem, M. van, and Young, D. A.: Deep glacial troughs and stabilizing ridges unveiled beneath the margins of the Antarctic ice sheet, Nat. Geosci., 13, 132–137, https://doi.org/10.1038/s41561-019-0510-8, 2020.
Mouginot, J., Rignot, E., and Scheuchl, B.: Sustained increase in ice discharge from the Amundsen Sea Embayment, West Antarctica, from 1973 to 2013, Geophys. Res. Lett., 41, 1576–1584, https://doi.org/10.1002/2013GL059069, 2014.
NCCSV: A NetCDF-Compatible ASCII CSV File Specification, https://coastwatch.pfeg.noaa.gov/erddap/download/NCCSV.html, last access: 1 March 2023.
Paxman, G. J. G., Jamieson, S. S. R., Ferraccioli, F., Jordan, T. A., Bentley, M. J., Ross, N., Forsberg, R., Matsuoka, K., Steinhage, D., Eagles, G., and Casal, T. G.: Subglacial Geology and Geomorphology of the Pensacola-Pole Basin, East Antarctica, Geochem. Geophy. Geosy., 20, 2786–2807, https://doi.org/10.1029/2018GC008126, 2019.
Pollard, D. and DeConto, R. M.: Modelling West Antarctic ice sheet growth and collapse through the past five million years, Nature, 458, 329–332, https://doi.org/10.1038/nature07809, 2009.
Popov, S.: Fifty-five years of Russian radio-echo sounding investigations in Antarctica, Ann. Glaciol., 61, 14–24, https://doi.org/10.1017/aog.2020.4, 2020.
Pritchard, H. D.: Bedgap: where next for Antarctic subglacial mapping?, Antarct. Science, 26, 742–757, https://doi.org/10.1017/S095410201400025X, 2014.
Rignot, E., Mouginot, J., Scheuchl, B., van den Broeke, M., van Wessem, M. J., and Morlighem, M.: Four decades of Antarctic Ice Sheet mass balance from 1979–2017, P. Natl. Acad. Sci. USA, 116, 1095–1103, https://doi.org/10.1073/pnas.1812883116, 2019.
Robin, G. D. Q., Swithinbank, C. W. M., and Smith, B. M. E.: Radio echo exploration of the Antarctic ice sheet, International Association of Scientific Hydrology Publication, 86, 97–115, 1970.
Scambos, T. A., Bell, R. E., Alley, R. B., Anandakrishnan, S., Bromwich, D. H., Brunt, K., Christianson, K., Creyts, T., Das, S. B., DeConto, R., Dutrieux, P., Fricker, H. A., Holland, D., MacGregor, J., Medley, B., Nicolas, J. P., Pollard, D., Siegfried, M. R., Smith, A. M., Steig, E. J., Trusel, L. D., Vaughan, D. G., and Yager, P. L.: How much, how fast?: A science review and outlook for research on the instability of Antarctica's Thwaites Glacier in the 21st century, Global Planet. Change, 153, 16–34, https://doi.org/10.1016/j.gloplacha.2017.04.008, 2017.
Schroeder, D. M., Dowdeswell, J. A., Siegert, M. J., Bingham, R. G., Chu, W., MacKie, E. J., Siegfried, M. R., Vega, K. I., Emmons, J. R., and Winstein, K.: Multidecadal observations of the Antarctic ice sheet from restored analog radar records, P. Natl. Acad. Sci. USA, 116, 18867–18873, https://doi.org/10.1073/pnas.1821646116, 2019.
Schroeder, D. M., Bingham, R. G., Blankenship, D. D., Christianson, K., Eisen, O., Flowers, G. E., Karlsson, N. B., Koutnik, M. R., Paden, J. D., and Siegert, M. J.: Five decades of radioglaciology, Ann. Glaciol., 61, 1–13, https://doi.org/10.1017/aog.2020.11, 2020.
Schroeder, D. M., Broome, A. L., Conger, A., Lynch, A., Mackie, E. J., and Tarzona, A.: Radiometric analysis of digitized Z-scope records in archival radar sounding film, J. Glaciol., 68, 733–740, https://doi.org/10.1017/jog.2021.130, 2021.
Seroussi, H., Nowicki, S., Payne, A. J., Goelzer, H., Lipscomb, W. H., Abe-Ouchi, A., Agosta, C., Albrecht, T., Asay-Davis, X., Barthel, A., Calov, R., Cullather, R., Dumas, C., Galton-Fenzi, B. K., Gladstone, R., Golledge, N. R., Gregory, J. M., Greve, R., Hattermann, T., Hoffman, M. J., Humbert, A., Huybrechts, P., Jourdain, N. C., Kleiner, T., Larour, E., Leguy, G. R., Lowry, D. P., Little, C. M., Morlighem, M., Pattyn, F., Pelle, T., Price, S. F., Quiquet, A., Reese, R., Schlegel, N.-J., Shepherd, A., Simon, E., Smith, R. S., Straneo, F., Sun, S., Trusel, L. D., Van Breedam, J., van de Wal, R. S. W., Winkelmann, R., Zhao, C., Zhang, T., and Zwinger, T.: ISMIP6 Antarctica: a multi-model ensemble of the Antarctic ice sheet evolution over the 21st century, The Cryosphere, 14, 3033–3070, https://doi.org/10.5194/tc-14-3033-2020, 2020.
Shepherd, A., Ivins, E. R., A, G., Barletta, V. R., Bentley, M. J., Bettadpur, S., Briggs, K. H., Bromwich, D. H., Forsberg, R., Galin, N., Horwath, M., Jacobs, S., Joughin, I., King, M. A., Lenaerts, J. T. M., Li, J., Ligtenberg, S. R. M., Luckman, A., Luthcke, S. B., McMillan, M., Meister, R., Milne, G., Mouginot, J., Muir, A., Nicolas, J. P., Paden, J., Payne, A. J., Pritchard, H., Rignot, E., Rott, H., Sørensen, L. S., Scambos, T. A., Scheuchl, B., Schrama, E. J. O., Smith, B., Sundal, A. V., van Angelen, J. H., van de Berg, W. J., van den Broeke, M. R., Vaughan, D. G., Velicogna, I., Wahr, J., Whitehouse, P. L., Wingham, D. J., Yi, D., Young, D., and Zwally, H. J.: A Reconciled Estimate of Ice-Sheet Mass Balance, Science, 338, 1183–1189, https://doi.org/10.1126/science.1228102, 2012.
Sun, B., Siegert, M. J., Mudd, S. M., Sugden, D., Fujita, S., Xiangbin, C., Yunyun, J., Xueyuan, T., and Yuansheng, L.: The Gamburtsev mountains and the origin and early evolution of the Antarctic Ice Sheet, Nature, 459, 690–693, https://doi.org/10.1038/nature08024, 2009.
The IMBIE team: Mass balance of the Antarctic Ice Sheet from 1992 to 2017, Nature, 558, 219–222, https://doi.org/10.1038/s41586-018-0179-y, 2018.
Turchetti, S., Dean, K., Naylor, S., and Siegert, M.: Accidents and Opportunities: A History of the Radio Echo Sounding (RES) of Antarctica, 1958–1979, British Journal of the History of Science, 41, 417–444, https://doi.org/10.1017/S0007087408000903, 2008.
UK Government: Tabular data standard, https://www.gov.uk/government/publications/recommended-open-standards-for-government/tabular-data-standard (last access: 1 March 2023), 2020.
UK Polar Data Centre: Geophysics book, https://antarctica.github.io/PDC_GeophysicsBook, last access: 1 March 2023a.
UK Polar Data Centre: Geophysics book, UK Polar Data Centre, https://antarctica.github.io/PDC_GeophysicsBook/BEDMAP/Downloading_the_Bedmap_data.html, last access: 1 March 2023b.
Vaughan, D. G., Corr, H. F., Ferraccioli, F., Frearson, N., O'Hare, A., Mach, D., Holt, J. W., Blankenship, D. D., Morse, D. L., and Young, D. A.: New boundary conditions for the West Antarctic ice sheet: Subglacial topography beneath Pine Island Glacier, Geophys. Res. Lett., 33, L09501, https://doi.org/10.1029/2005GL025588, 2006.
Wilkinson, M. D., Dumontier, M., Aalbersberg, Ij. J., Appleton, G., Axton, M., Baak, A., Blomberg, N., Boiten, J.-W., da Silva Santos, L. B., Bourne, P. E., Bouwman, J., Brookes, A. J., Clark, T., Crosas, M., Dillo, I., Dumon, O., Edmunds, S., Evelo, C. T., Finkers, R., Gonzalez-Beltran, A., Gray, A. J. G., Groth, P., Goble, C., Grethe, J. S., Heringa, J., 't Hoen, P. A. C., Hooft, R., Kuhn, T., Kok, R., Kok, J., Lusher, S. J., Martone, M. E., Mons, A., Packer, A. L., Persson, B., Rocca-Serra, P., Roos, M., van Schaik, R., Sansone, S.-A., Schultes, E., Sengstag, T., Slater, T., Strawn, G., Swertz, M. A., Thompson, M., van der Lei, J., van Mulligen, E., Velterop, J., Waagmeester, A., Wittenburg, P., Wolstencroft, K., Zhao, J., and Mons, B.: The FAIR Guiding Principles for scientific data management and stewardship, Sci. Data, 3, 160018, https://doi.org/10.1038/sdata.2016.18, 2016.
- Abstract
- Introduction
- Background: evolution of the Bedmap products
- Source data, standardization and pre-processing
- Publishing the Bedmap source data
- Data availability
- Code availability
- Conclusion
- Author contributions
- Competing interests
- Disclaimer
- Acknowledgements
- Financial support
- Review statement
- References
- Supplement