the Creative Commons Attribution 4.0 License.
the Creative Commons Attribution 4.0 License.
 | 22 Dec 2020
Validation of GRASP algorithm product from POLDER/PARASOL data and assessment of multi-angular polarimetry potential for aerosol monitoring
Cheng Chen
David Fuertes
Pavel Litvinov
Tatyana Lapyonok
Anton Lopatin
Fabrice Ducos
Yevgeny Derimian
Maurice Herman
Didier Tanré
Lorraine A. Remer
Alexei Lyapustin
Andrew M. Sayer
Robert C. Levy
N. Christina Hsu
Jacques Descloitres
Lei Li
Benjamin Torres
Yana Karol
Milagros Herrera
Marcos Herreras
Michael Aspetsberger
Moritz Wanzenboeck
Lukas Bindreiter
Daniel Marth
Andreas Hangler
Christian Federspiel
Proven by multiple theoretical and practical studies, multi-angular spectral polarimetry is ideal for comprehensive retrieval of properties of aerosols. Furthermore, a large number of advanced space polarimeters have been launched recently or planned to be deployed in the coming few years (Dubovik et al., 2019). Nevertheless, at present, practical utilization of aerosol products from polarimetry is rather limited, due to the relatively small number of polarimetric compared to photometric observations, as well as challenges in making full use of the extensive information content available in these complex observations. Indeed, while in recent years several new algorithms have been developed to provide enhanced aerosol retrievals from satellite polarimetry, the practical value of available aerosol products from polarimeters yet remains to be proven. In this regard, this paper presents the analysis of aerosol products obtained by the Generalized Retrieval of Atmosphere and Surface Properties (GRASP) algorithm from POLDER/PARASOL observations. After about a decade of development, GRASP has been adapted for operational processing of polarimetric satellite observations and several aerosol products from POLDER/PARASOL observations have been released. These updated PARASOL/GRASP products are publicly available (e.g., http://www.icare.univ-lille.fr, last access: 16 October 2018, http://www.grasp-open.com/products/, last access: 28 March 2020); the dataset used in the current study is registered under https://doi.org/10.5281/zenodo.3887265 (Chen et al., 2020).
The objective of this study is to comprehensively evaluate the GRASP aerosol products obtained from POLDER/PARASOL observations. First, the validation of the entire 2005–2013 archive was conducted by comparing to ground-based Aerosol Robotic Network (AERONET) data. The subjects of the validation are spectral aerosol optical depth (AOD), aerosol absorption optical depth (AAOD) and single-scattering albedo (SSA) at six wavelengths, as well as Ångström exponent (AE), fine-mode AOD (AODF) and coarse-mode AOD (AODC) interpolated to the reference wavelength 550 nm. Second, an inter-comparison of PARASOL/GRASP products with the PARASOL/Operational, MODIS Dark Target (DT), Deep Blue (DB) and Multi-Angle Implementation of Atmospheric Correction (MAIAC) aerosol products for the year 2008 was performed. Over land both satellite data validations and inter-comparisons were conducted separately for different surface types, discriminated by bins of normalized difference vegetation index (NDVI): < 0.2, 0.2 ≤ and < 0.4, 0.4 ≤ and < 0.6, and ≥ 0.6. Three PARASOL/GRASP products were analyzed: GRASP/HP (“High Precision”), Optimized and Models. These different products are consistent but were obtained using different assumptions in aerosol modeling with different accuracies of atmospheric radiative transfer (RT) calculations. Specifically, when using GRASP/HP or Optimized there is direct retrieval of the aerosol size distribution and spectral complex index of refraction. When using GRASP/Models, the aerosol is approximated by a mixture of several prescribed aerosol components, each with their own fixed size distribution and optical properties, and only the concentrations of those components are retrieved. GRASP/HP employs the most accurate RT calculations, while GRASP/Optimized and GRASP/Models are optimized to achieve the best trade-off between accuracy and speed. In all these three options, the underlying surface reflectance is retrieved simultaneously with the aerosol properties, and the radiative transfer calculations are performed “online” during the retrieval.
All validation results obtained for the full archive of PARASOL/GRASP products show solid quality of retrieved aerosol characteristics. The GRASP/Models retrievals, however, provided the most solid AOD products, e.g., AOD (550 nm) is unbiased and has the highest correlation (R ∼ 0.92) and the highest fraction of retrievals (∼ 55.3 %) satisfying the accuracy requirements of the Global Climate Observing System (GCOS) when compared to AERONET observations. GRASP/HP and GRASP/Optimized AOD products show a non-negligible positive bias (∼ 0.07) when AOD is low (< 0.2). On the other hand, the detailed aerosol microphysical characteristics (AE, AODF, AODC, SSA, etc.) provided by GRASP/HP and GRASP/Optimized correlate generally better with AERONET than do the results of GRASP/Models. Overall, GRASP/HP processing demonstrates the high quality of microphysical characteristics retrieval versus AERONET. Evidently, the GRASP/Models approach is more adapted for retrieval of total AOD, while the detailed aerosol microphysical properties are limited when a mixture of aerosol models with fixed optical properties are used.
The results of a comparative analysis of PARASOL/GRASP and MODIS products showed that, based on validation against AERONET, the PARASOL/GRASP AOD (550 nm) product is of similar and sometimes of higher quality compared to the MODIS products. All AOD retrievals are more accurate and in good agreement over ocean. Over land, especially over bright surfaces, the retrieval quality degrades and the differences in total AOD products increase. The detailed aerosol characteristics, such as AE, AODF and AODC from PARASOL/GRASP, are generally more reliable, especially over land. The global inter-comparisons of PARASOL/GRASP versus MODIS showed rather robust agreement, though some patterns and tendencies were observed. Over ocean, PARASOL/Models and MODIS/DT AOD agree well with the correlation coefficient of 0.92. Over land, the correlation between PARASOL/Models and the different MODIS products is lower, ranging from 0.76 to 0.85. There is no significant global offset; though over bright surfaces MODIS products tend to show higher values compared to PARASOL/Models when AOD is low and smaller values for moderate and high AODs. Seasonal AOD means suggest that PARASOL/GRASP products show more biomass burning aerosol loading in central Africa and dust over the Taklamakan Desert, but less AOD in the northern Sahara. It is noticeable also that the correlation for the data over AERONET sites are somewhat higher, suggesting that the retrieval assumptions generally work better over AERONET sites than over the rest of the globe. One of the potential reasons may be that MODIS retrievals, in general, rely more on AERONET climatology than GRASP retrievals.
Overall, the analysis shows that the quality of AOD retrieval from multi-angular polarimetric observations like POLDER is at least comparable to that of single-viewing MODIS-like imagers. At the same time, the multi-angular polarimetric observations provide more information on other aerosol properties (e.g., spectral AODF, AODC, AE), as well as additional parameters such as AAOD and SSA.
- Article
(28814 KB) - Full-text XML
- BibTeX
- EndNote


Over the past few decades, satellite remote sensing has provided essential advances in understanding the global distribution of atmospheric aerosols (Kaufman et al., 2002; Remer et al., 2008) and constraining aerosol climate effects (Bellouin et al., 2005; Myhre, 2009; Yu et al., 2006). Nevertheless, aerosol effects remain the largest contributor to forcing uncertainty according to the Intergovernmental Panel on Climate Change (IPCC) assessments (Boucher et al., 2013); the aerosol effective radiative forcing has been recently assessed to be between −2.0 and −0.4 W/m2 with a 90 % likelihood (Bellouin et al., 2020). Over the past few decades, satellite remote sensing techniques have developed rapidly and extensively, and various (primarily photometric) instruments have been developed and deployed to monitor atmospheric aerosols from space (Bréon et al., 2011; Dubovik et al., 2019; King et al., 1999; Kokhanovsky et al., 2015; Li et al., 2009; Tanré et al., 2011). While the design and capabilities of the photometric observations are constantly evolving, the greatest improvement has been in the form of multi-angular multi-spectral polarimetry (MAP) measurements (Hansen et al., 1995; Hasekamp and Landgraf, 2007; Knobelspiesse et al., 2012; Mishchenko and Travis, 1997; Mishchenko et al., 2004; Waquet et al., 2009; Tanré et al., 2011). MAP measurements have enough inherent information content to greatly improve our understanding about aerosol properties. Several space-borne polarimeters have already been deployed and more advanced versions will be deployed soon (Dubovik et al., 2019). In addition, there are many airborne versions of orbital polarimeters that have operated during field campaigns, which can be used to verify and improve the retrieval concepts (e.g., Knobelspiesse et al., 2020). Although the overall volume of polarimetric observations remains small compared to radiance-only photometric observations, the potential for rapid advancement is large.
Several factors contribute to the current limited visibility of MAP observations and algorithms including (i) limited number of polarimetric observations in comparison to photometric ones, (ii) general complexity of polarimetric observations and (iii) consequent challenges in developing capable retrieval algorithms. As a result, at present, there is a lack of extensive aerosol products from satellite MAPs that attract the aerosol science community. This tendency is especially evident by the contrast with the increase in constantly improved aerosol products from mono- and bi-viewing photometric imagers. For example, the archive of most popular Moderate Resolution Imaging Spectroradiometer (MODIS) observations has been processed using many different algorithms, and NASA distributes three complementary MODIS aerosol products: Dark Target (DT) by Remer et al. (2005, 2020) and Levy et al. (2013), Deep Blue by Hsu et al. (2004, 2006, 2013), and Multi-Angle Implementation of Atmospheric Correction (MAIAC) by Lyapustin et al. (2018). Similarly, significant effort has been directed to improve aerosol products from European ENVISAT satellite platform observations in the frame of Climate Change Initiative (CCI) projects of the European Space Agency (e.g., see de Leeuw et al., 2015; Holzer-Popp et al., 2013; Popp et al., 2016). As a result, the product archives of MEdium Resolution Imaging Spectrometer (MERIS) and especially Advanced Along-Track Scanning Radiometer (AATSR) missions are constantly updated and improved.
To date, only one space-borne MAP has a long and wide enough coverage to advance aerosol science. The Polarization and Directionality of the Earth's Reflectances (POLDER) instrument was designed and developed by the French space agency Centre National d'Études Spatiales (CNES) to measure the spectral directional polarized solar radiation reflected by the Earth–atmosphere system (Deschamps et al., 1994). POLDER-1 and 2 flew on board the Japanese Advanced Earth Observing Satellites (ADEOS) platforms ADEOS-I and II from November 1996 till June 1997 and from April 2003 till October 2003, respectively. Unfortunately, due to the failures of the platforms' solar panels, POLDER-1 and 2 have rather a limited time series of observations. POLDER-3 was launched in December 2004 on the PARASOL (Polarization & Anisotropy of Reflectances for Atmospheric Sciences coupled with Observations from a Lidar) platform developed by CNES. POLDER-3/PARASOL (hereafter PARASOL) was operational from March 2005 till October 2013 with nearly 5 years within the A-Train constellation, which is making nearly contiguous observations of many facets of the Earth system through a series of low-orbiting satellites (e.g., MODIS/AQUA, CALIOP/CALIPSO, OMI/AURA) (Parkinson, 2003; Schoeberl et al., 2006; Tanré et al., 2011; Winker et al., 2010). The PARASOL imager has three gaseous absorption channels (763, 765 and 910 nm), in addition to six channels (443, 490, 565, 670, 865 and 1020 nm) measuring the total radiance and three channels (490, 670 and 865 nm) measuring the polarization. The number of viewing angles is similar for all spectral channels varying from 14 to 16 depending on the location of the pixel on the charge-coupled device (CCD). PARASOL provided global coverage about every 2 d with a nadir spatial resolution ∼ 6 km (Tanré et al., 2011).
Several POLDER-1, POLDER-2 and PARASOL aerosol products were developed by the science team at LOA (Laboratoire d'Optique Atmosphérique, Lille, France). Hereafter, we refer to these aerosol products as POLDER/Operational or Operational. The initial POLDER/Operational aerosol retrieval over ocean by Deuzé et al. (1999) provided total aerosol optical depth (AOD) from the measured total and polarized radiances at 670 and 865 nm with expected accuracy of ±0.05 ± 0.05 AOD (Goloub et al., 1999). The updated algorithm by Herman et al. (2005) provided AOD of fine and coarse modes and, when geometrical conditions are optimal (scattering angle ranging between 90–160∘), the spherical–non-spherical separation of coarse-mode particles (Herman et al., 2005). Over land, the algorithm by Deuzé et al. (2001) retrieves only fine-mode (“accumulation”) AOD (AODF) using only polarized light at two wavelengths (670 and 865 nm) to capitalize on the small and fairly neutral polarized reflectance typical of land surfaces (Deuzé et al., 2001; Herman et al., 1997). These algorithms were designed to utilize the benefits of MAP information within the framework of a conventional MODIS-like look-up-table (LUT) approach (Tanré et al., 1997; Kaufman et al., 1997) and did not intend to substantially extend the set of retrieved parameters. Moreover, over land the POLDER/Operational retrieval provided only AODF, more sensitive to fine mode, while MODIS algorithms derive the total AOD.
The Generalized Retrieval of Atmosphere and Surface Properties (GRASP) algorithm considered here was developed to further exploit the aerosol information content of POLDER spectral multi-angular polarization measurements (Dubovik et al., 2011, 2014). The algorithm allows for a large number of unknown parameters and retrieves a set of parameters affecting measurements at all wavelengths, all angles and all states of polarization using the multi-term least-square method (Dubovik, 2004). As will be later described in detail in Sect. 2.1, GRASP does not utilize pre-calculated LUTs but instead searches in a continuous space for the solutions and optimizes the statistical properties of the obtained retrieval. The GRASP algorithm derives an extended set of aerosol parameters from POLDER data, including spectral AOD, spectral aerosol absorption optical depth (AAOD), spectral AODF, spectral coarse-mode AOD (AODC), particle size distribution, single-scattering albedo (SSA), complex refractive index, fraction of spherical particles, etc. (see Table 1 and discussion in the next section). The full archives of POLDER-1, POLDER-2 and PARASOL were processed with GRASP, and the resulting datasets are available for the public at the official GRASP algorithm website (http://www.grasp-open.com, last access: 28 March 2020) and the AERIS/ICARE Data and Services Center (http://www.icare.univ-lille.fr, last access: 16 October 2018).
Table 1List of aerosol parameters in PARASOL/GRASP products.
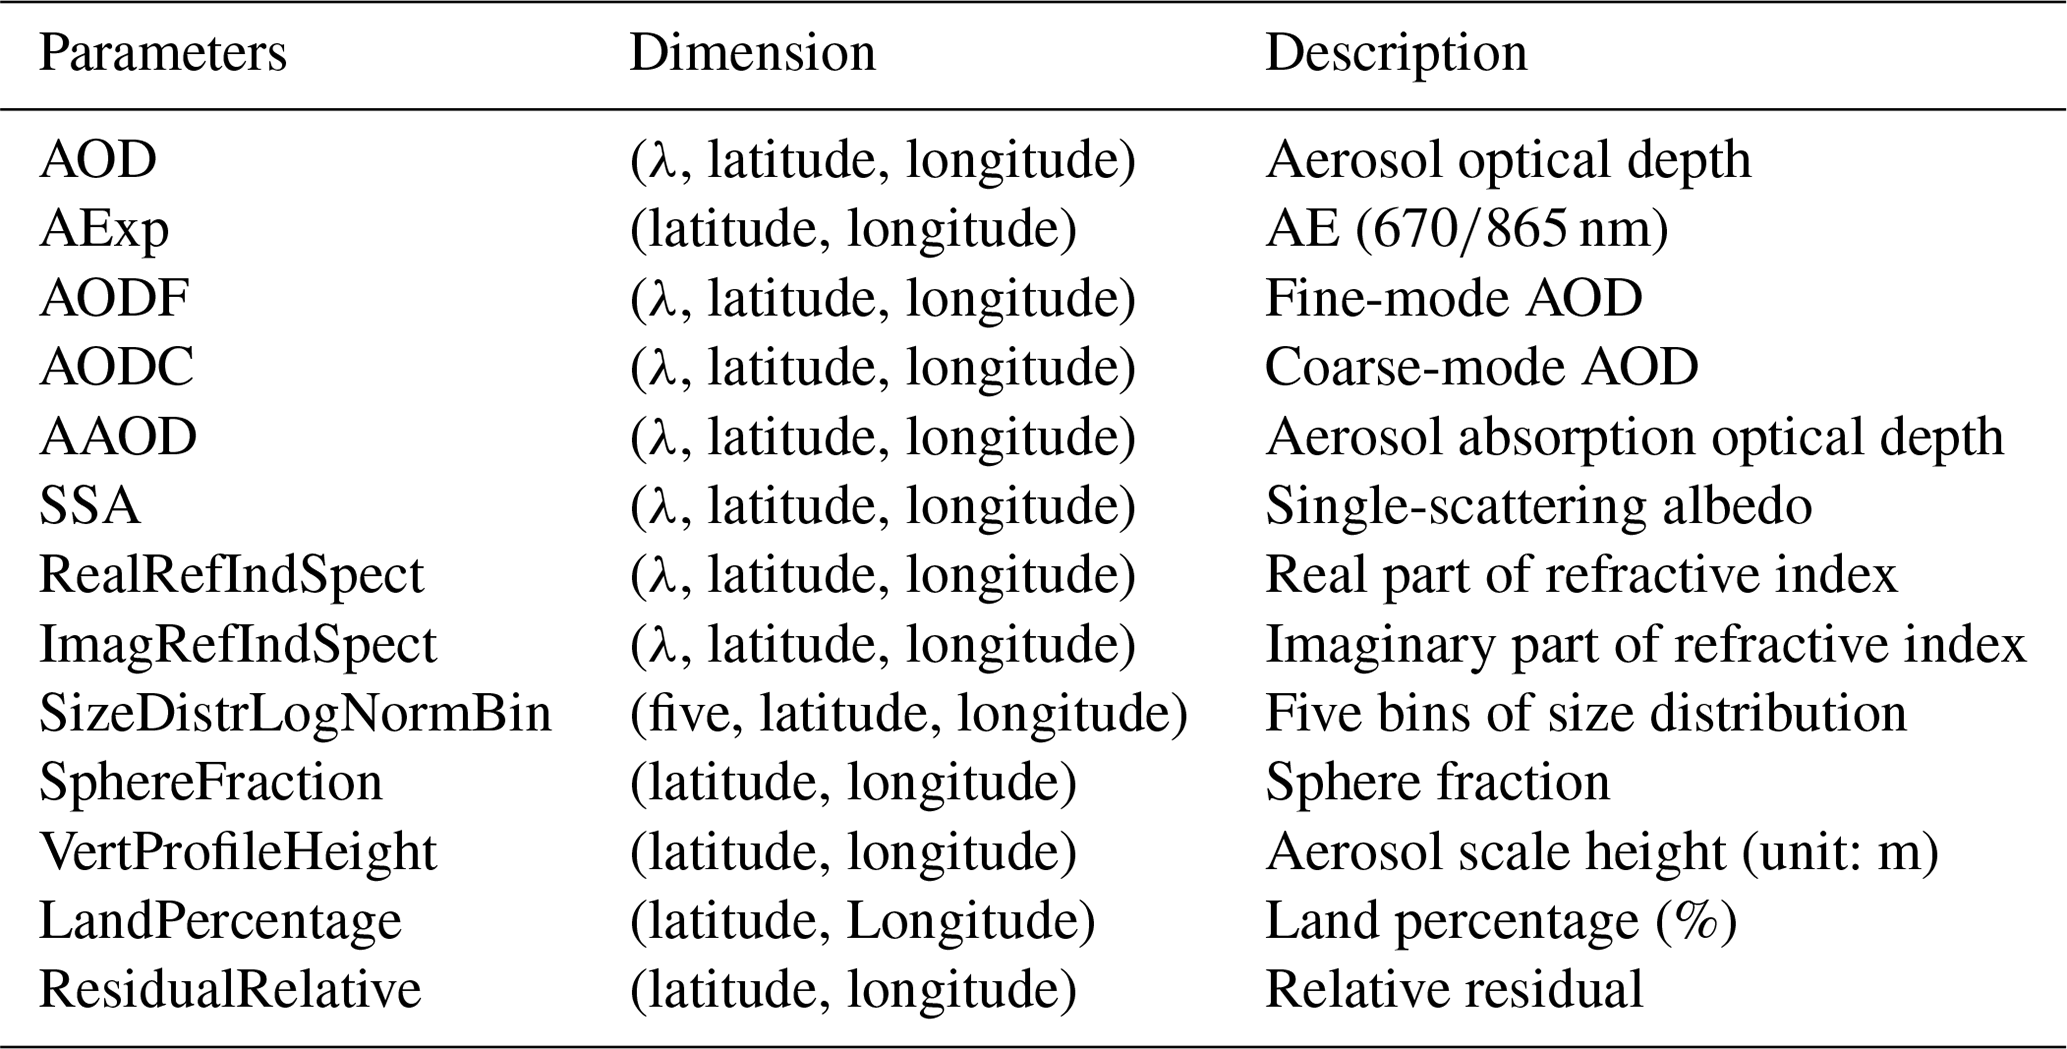
and 1020 nm.
This paper presents and discusses new publicly available aerosol products generated by the recently developed GRASP algorithm (Dubovik et al., 2011, 2014) applied to PARASOL observations, which represent the longest-to-date satellite MAP record (Tanré et al., 2011; Dubovik et al., 2019). Hereinafter we perform quantitative analysis of PARASOL/GRASP aerosol products (the longest POLDER dataset) through validation with AERONET reference data, as well as by comparisons with the operational products and the widely used MODIS DT, DB and MAIAC aerosol products. The analysis pursues two objectives. The first is to understand the accuracy and value of each PARASOL/GRASP aerosol product. The second objective is to clarify the specifics, advantages and shortcomings of MAP aerosol products compared to those from radiance-only photometric mono-viewing imagers. Thus, the analysis provides useful information for the aerosol community to meet the future challenge of accurate aerosol monitoring in the coming era of polarimetric missions. Over the next few years, we expect deployment of a number of new and existing satellite and airborne MAPs including 3MI (Multi-View Multi-Channel Multi-Polarization Imaging), DPC (Directional Polarimetric Camera), Aerosol-UA (Ukraine), PACE (Plankton, Aerosol, Cloud, ocean Ecosystem), AirHARP (Airborne Hyper-Angular Rainbow Polarimeter), AirMSPI (Airborne Multi-angle SpectroPolarimeter Imager), SPEXone (Spectro-Polarimetric Experiment), RSP (Research Scanning Polarimeter), etc. (Dubovik et al., 2019; Fougnie et al., 2018; Fu et al., 2020; Gao et al., 2020; Hasekamp et al., 2019a; Knobelspiesse et al., 2020; Li et al., 2018; Milinevsky et al., 2019; Puthukkudy et al., 2020; Remer et al., 2019). Several studies have shown the potential of advanced MAP aerosol products; for example, PARASOL/GRASP results have been adopted to estimate global aerosol emissions (Chen et al., 2018, 2019), PARASOL–SRON products have been used for data assimilation (Tsikerdekis et al., 2020), estimation of aerosol direct radiative effect (Lacagnina et al., 2015, 2017) and the radiative forcing due to aerosol–cloud interactions (Hasekamp et al., 2019b). By providing a comprehensive analysis of PARASOL/GRASP products, we intend to prove that the aerosol community can utilize the new-era MAP measurements.
The analysis compares several satellite data products. From POLDER, we have both the products of the Operational algorithm and the GRASP retrieval. From MODIS, we utilize products generated by three different algorithms (DT, DB and MAIAC). For all satellite products, validation is based on AERONET observations and retrievals.
2.1 POLDER/GRASP aerosol products
GRASP is a new-generation algorithm developed for deriving extensive aerosol properties from all remote sensing instruments. The overall concept of the algorithm is described by Dubovik et al. (2014), while specific technical aspects are detailed in Dubovik et al. (2011). GRASP is based on highly advanced statistically optimized fitting implemented as multi-term least-square minimization (Dubovik, 2004) which had earlier been successfully implemented for aerosol retrievals from ground-based AERONET radiometers (Dubovik and King, 2000; Dubovik et al., 2000, 2002a, b, 2006). GRASP inherits many methodological aspects in numerical inversion and aerosol modeling from the AERONET retrieval developments. In fact, all retrieval set-ups including modeling of aerosol microphysical and optical properties, surface reflectance, numerical inversion, utilization of multiple a priori constraints, etc., can be realized using GRASP. At the same time, the GRASP concept and algorithm are highly flexible and versatile. GRASP includes several additional original features and enables the implementation of advanced retrieval scenarios. A unique aspect of GRASP is that it can perform radiative transfer (RT) computations fully accounting for multiple interactions of the scattered solar light in the atmosphere online without the use of traditional LUTs. Several other algorithms of the new generation that have been or are being developed for interpretation of MAP observation use the online RT calculations and implement retrieval as a search in the continuous space of solution (e.g., Hasekamp et al., 2011; Xu et al., 2017, 2019; Fu and Hasekamp, 2018; Gao et al., 2018; Stamnes et al., 2018; Di Noia et al., 2019). Nonetheless, at present GRASP was the only algorithm that has been used to generate aerosol products for the full archive of POLDER observations (Dubovik et al., 2019).
The GRASP retrieval can utilize whatever information content is available. If there is sufficient information content of the observations, GRASP will find the aerosol solutions. In the case of any currently operational observations, GRASP can make optimal assumptions to constrain the solution. For example, GRASP can retrieve both aerosol and underlying surface properties simultaneously from multispectral satellite observations using additional a priori constraints on the spectral variability of the land bidirectional reflection distribution function (BRDF). Or (probably the most essential methodological novelty) it can operate by relying on the multi-pixel concept wherein the statistically optimized retrieval is performed simultaneously for a large group of pixels (Dubovik et al., 2011). This feature brings additional possibilities for improving the accuracy of satellite retrievals by using known constraints on the inter-pixel variability of retrieved aerosol and surface reflectance parameters. As a result, using this methodology GRASP provides reliable retrievals of detailed aerosol properties that traditionally have been difficult to obtain from satellites, for example, spectral AOD and AAOD over land including very bright deserts. The GRASP algorithm source code and detailed documentation are available from https://www.grasp-open.com (last access: 28 March 2020).
It should be noted that GRASP is a flexible inversion algorithm that can be applied to a wide variety of satellite, ground-based and laboratory observations. It has already been applied to ground-based AERONET photometers and lidars (Benavent-Oltra et al., 2017, 2019; Hu et al., 2019; Lopatin et al., 2013; Titos et al., 2019; Tsekeri et al., 2017), sky cameras (Román et al., 2017), polar-nephelometer data (Espinosa et al., 2017, 2019; Schuster et al., 2019), and surface measurements of AOD (Torres et al., 2017). In addition, GRASP is being used for several satellite instruments; aerosol products were generated for POLDER observations (discussed here) and for MERIS/Envisat, and there are ongoing developments for producing GRASP aerosol products from Sentinel-3 and Sentinel-5P observations and operational aerosol retrievals for future Sentinel-4 and 3MI/MetOp missions. GRASP is constantly being updated to produce many user-oriented products such as estimates of covariance matrices (Herrera et al., 2020), direct radiative forcing (Derimian et al., 2016) and so on.
For POLDER, GRASP utilizes radiance and polarization observations from all available spectral channels, including minor gaseous absorption for some of them, i.e., for total radiance five channels for POLDER-1 and 2 and six for PARASOL and for polarized radiances (three spectral channels for all instruments). The retrieval uses a unique global set of constraints (no location-specific assumptions) and a single initial guess globally. GRASP performs radiative transfer computations fully accounting for multiple interactions of the scattered solar light in the atmosphere online without using a traditional LUT. Since these RT computations are complex and time consuming, significant effort has been put into optimization and acceleration of the code for operational processing of voluminous datasets. At present, the speed of GRASP retrieval is appropriate for processing the full archive of POLDER observations at native resolution (POLDER-1 and 2 at ∼ 7 km and PARASOL at ∼ 6 km) using rather moderate computing resources, e.g., 3–4 s/pixel for GRASP/HP, 0.3–0.5 s/pixel for GRASP/Optimized and 0.1–0.2 s/pixel for GRASP/Models, in a single-core processor (the description of GRASP/HP, GRASP/Optimized and GRASP/Models will be detailed further in this section).
Since GRASP has been designed for use with different observations, it allows a variety of different possibilities on modeling aerosol scattering and surface reflectance and generally on implementing atmospheric radiative transfer calculations. As a result, different configurations of the atmospheric forward model can be used even for interpretation of the same data (as is the case here with POLDER). Currently, the full POLDER/PARASOL data archive is processed by GRASP using the three following retrieval configurations:
-
PARASOL/GRASP “Optimized” (in the sense that radiative transfer calculations were optimized to find the best trade-off between speed of processing and accuracy of results);
-
PARASOL/GRASP “High-precision” (radiative transfer calculations with high precision were used);
-
PARASOL/GRASP “Models” (the simplest, fastest processing; aerosol is assumed to be an external mixture of several aerosol models).
The Optimized and High-precision configurations are different only by the online precision of the RT calculations, while they are conceptually the same: aerosol size distribution, spectral values of complex index of refraction, fraction of spherical particles and the aerosol layer height (ALH) are retrieved simultaneously with the surface BRDF and bidirectional polarization distribution function (BPDF) parameters. The retrievals were performed using one aerosol component model with five bins of the size distribution and spectrally dependent complex refractive index. The aerosol vertical distribution was modeled using an exponential profile and scale height was retrieved. The details of implementation are discussed in Dubovik et al. (2011). The Models approach uses different assumptions for modeling aerosol properties (surface treatment is the same as above): aerosol is assumed to be an external mixture of several aerosol components, and only their respective concentrations are retrieved together with ALH and spectral BRDF/BPDF parameters. The size distribution, complex refractive index and non-sphericity parameter for each aerosol component are derived from the results of AERONET aerosol climatology for the main distinct aerosol types (Dubovik et al., 2002b) and improved in a series of sensitivity tests with satellite data. For retrievals over land, GRASP retrieves the parameters of the Ross-Li BRDF (Li and Strahler, 1992; Ross, 1981) and BPDF (Maignan et al., 2009) models under the assumption that the retrieved parameters are spectrally smooth (the strength of smoothness is different for each parameter) (Litvinov et al., 2011a, b). For retrievals over ocean, the wind speed and a spectrally dependent Lambertian albedo are included in the state vector. It should be noted that the Models approach firstly was intended to be used for mono-viewing satellite observations such as those from MERIS/Envisat. However, once the approach was tested with PARASOL data, the obtained results were quite appealing, especially in conditions of low aerosol loading, motivating the generation of the PARASOL/GRASP Models archive that is included in the consideration here.
The three archives (Optimized, HP and Models) are released publicly and can be found at the AERIS/ICARE Data and Services Center (http://www.icare.univ-lille.fr, last access: 16 October 2018) and on the GRASP-OPEN website (https://www.grasp-open.com/products/, last access: 28 March 2020) in slightly different formats. AERIS/ICARE is the official distributor of POLDER Level-1 and 2 data and allows the user to dive into the data using a web tool, which plots the results online. AERIS/ICARE provides detailed visualization of the data, while the GRASP-OPEN site is faster in releasing new products but with no visualization. The original PARASOL/GRASP retrievals are stored at Level-1, Level-2 and Level-3 products and are publicly available in the form of daily, monthly, seasonal, yearly and climatological datasets. The Level-2 data contain full-resolution data filtered following established quality criteria. Level-3 data are aggregated into a 0.1 and 1∘ grid box using the sinusoidal projection and gdalwarp regridding technique (https://gdal.org/programs/gdalwarp.html, last access: 25 March 2020) from the arithmetic mean of Level-2 data. As discussed in Sayer and Knobelspiesse (2019), the arithmetic vs. geometric differences are likely significantly smaller for Level-3 0.1∘ data used in this study. The list of retrieved aerosol parameters as well as derived aerosol characteristics can be found in Table 1. In this study, we adopt the current latest version of Optimized, HP (v1.2) and Models (v2.1) products.
In addition to the PARASOL/GRASP products, all observations of POLDER-1 and 2 were also processed (using the GRASP/Models approach only). These data records are much shorter than PARASOL and therefore not included in the following analysis. However, based on limited comparisons (not presented here), the quality of the POLDER-1 and 2/GRASP retrievals is expected to be similar to that of PARASOL/GRASP retrievals. Also, recently a new “GRASP/Component” approach has been developed (Li et al., 2019, 2020a, b). This approach retrieved the size-resolved fractions of aerosol components representing the different composition species, like black carbon, brown carbon, fine- and coarse-mode non-absorbing soluble and insoluble, coarse-mode absorbing, and aerosol water. The retrieved fractions drive the aerosol spectral index of refraction in modeling atmospheric radiances. This provides a fourth retrieval archive; however, the results have not yet been fully analyzed and are not released in a user-friendly format, so the GRASP/Component dataset will not be considered in this study.
PARASOL/GRASP aerosol products have already appeared in many studies, i.e., validation (Tan et al., 2019; Wei et al., 2019, 2020), data assimilation (Chen et al., 2018, 2019), AOD product merging (Li et al., 2020; Sogacheva et al., 2020). Despite these preliminary applications of the products, no systematic evaluation of the global PARASOL/GRASP aerosol products has been published. Moreover, most early studies are based on the GRASP/Optimized products, which were released first. The evaluation of PARASOL/GRASP surface properties, as well as aerosol microphysical parameters (size distribution, complex refractive indices, fraction of spherical particles) and aerosol layer height, will be the subject of separate studies.
2.2 MODIS Dark Target, Deep Blue and MAIAC aerosol products
The MODIS sensors on board TERRA since 2000 (overpass ∼ 10:30 local) and AQUA since 2002 (overpass ∼ 13:30 local like PARASOL during the first 5 years) provide near-global coverage twice per day. In this study, we will employ products from MODIS Aqua only, which is on the same A-Train afternoon constellation orbit as PARASOL. MODIS has a wider swath of 2330 km compared to the ∼ 1600 km of PARASOL, 36 spectral channels ranging from 410 to 15 000 nm and higher spatial resolution for cloud mask. There are three mature aerosol products produced operationally and distributed by NASA: Dark Target, Deep Blue and MAIAC.
2.2.1 MODIS Dark Target
The Dark Target (DT) algorithm over land is based on an empirical surface reflectance relationship between blue and red channels with the shortwave infrared (2113 nm) radiance. The AOD is retrieved by matching LUT values to observations at 466 nm and then varying the weighting between two fixed aerosol models until the residual between LUT and observations is minimized at 645 nm. The main product is AOD at 553 nm with AOD reported at 466, 645 and 2113 nm, consistent with the selected weighted aerosol model (Kaufman et al., 1997; Levy et al., 2007a, b). Over ocean, the simplicity of the dark ocean surface permits the retrieval of AOD and aerosol particle size (Tanré et al., 1997). In this situation the algorithm chooses one fine mode out of four and one coarse mode out of five, along with the relative weight between the fine and coarse modes by minimizing the summed difference between LUT and observations in six wavelengths (550, 660, 870, 1240, 1610 and 2130 nm) (Tanré et al., 1997; Remer et al., 2005, 2020; Levy et al., 2013). The MODIS DT aerosol products are periodically updated to improve overall performance (Levy et al., 2003, 2007a, b, 2013; Remer et al., 2005; Gupta et al., 2016). The widely recognized limitation of the DT algorithm is the complex spectral structure of bright land surfaces (e.g., desert, bare soil, snow) that violates the assumptions of the empirical relationships between wavelengths and increases uncertainty in the aerosol retrievals to unacceptable levels. Therefore, DT does not provide coverage over these cases.
2.2.2 MODIS Deep Blue
The Deep Blue (DB) algorithm retrieves over both bright (except snow) and vegetated land surfaces. It is able to retrieve over brighter surfaces than DT because it makes use of the much darker surface reflectance in the deep blue (412 nm) channel (Hsu et al., 2004, 2006, 2013). Depending on the processing path, determined by observed reflectance and vegetation indices, the algorithm will invoke empirical spectral relationships of surface reflectance similar to DT (vegetation), rely on a pre-calculated database of surface reflectance (arid/deserts) or apply a hybrid method (urban surfaces). The MODIS DB aerosol products have also gone through several version updates (Hsu et al., 2013; Sayer et al., 2015). Within the MODIS official products, the DB algorithm is applied for only land aerosol retrieval. Over vegetated surfaces DT tends to provide more retrievals in the tropics and DB more retrievals at mid-latitudes, due to different pixel selection and cloud-screening criteria (Sayer et al., 2014).
2.2.3 MODIS MAIAC
The Multi Angle Implementation of Atmospheric Correction (MAIAC) algorithm has been developed and applied to MODIS (Lyapustin et al., 2011a, b, 2012, 2018) and is running operationally in the NASA system. The MAIAC algorithm uses the minimum reflectance method to dynamically characterize spectral ratios of the surface reflectance (which are prescribed in the DT) and separate aerosol and surface contributions to the measurements. The accumulation of up to 16 d of the last observations in the operational memory allows MAIAC to derive spectral surface BRDF. The MAIAC aerosol product is available at a higher spatial resolution of 1 km, in comparison to DT and DB that provide aerosol products at 3 and 10 km. As a more recent addition to the MODIS family of aerosol products than DT and DB, MAIAC has shown itself to produce an AOD product as accurate or better than the older algorithms over all types of land surfaces (Jethva et al., 2019) and thus offers a complementary/alternative product to those from the original DT and DB algorithms.
All three MODIS algorithms (DT, DB and MAIAC) are developed based on LUT approaches with a fixed certain number of aerosol models. Over ocean, DT assumes nine aerosol models (four fine models plus five coarse models); any retrieval corresponds to one of total 20 combinations of one fine mode and one coarse mode (Levy et al., 2003; Remer et al., 2005; Tanré et al., 1997). Over land, the DT algorithm adopts aerosol models from AERONET retrievals, clustering down to three possible spherical fine-mode-dominant models (non-absorbing, moderately absorbing and absorbing) and one spheroid coarse-mode-dominant model (Levy et al., 2007a). In addition, the fine- and coarse-mode dominant aerosol models over land are defined as a function of season and location (Levy et al., 2013). The DB algorithm makes use of prescribed dust and smoke/sulfate aerosol models in the LUT (Hsu et al., 2013). For example, over vegetated surfaces, Ångström exponent (AE) is limited to some extent (0.0 ≤ AE ≤ 1.8), and fixed at 1.5 for low AOD conditions. Over bright arid/desert surfaces the AE is limited to a maximum of 1.0 (Hsu et al., 2013; Sayer et al., 2013). A geographic distribution of aerosol models is also adopted in the MAIAC algorithm, where the aerosol model parameters are regional and may be parameterized as a function of AOD (dynamic models) for regions with high humidity variations. The detailed description of the MAIAC regional aerosol models can be found in Lyapustin et al. (2018). Hence, the MODIS aerosol products do not have the ability to retrieve aerosol particle properties with known uncertainties, with the exceptions of size parameter (over ocean in DT), SSA for dust (in DB) and AE (with known caveats).
In this study, MODIS Collection 6 aerosol products (MYD04_L2) from the DT and DB algorithms were acquired from the AERIS/ICARE Data and Services Center (http://www.icare.univ-lille.fr, last access: 30 August 2019), where the unchanged NASA MODIS data are redistributed with enhanced visualization. Note that the latest versions of DB and DT are Collection 6.1, although the differences between the two versions are small on a large scale (Sayer et al., 2019) and do not significantly affect the conclusions presented here. The latest MAIAC Collection 6 aerosol data (MAC19A2) are obtained from NASA LAADS (Level-1 and Atmosphere Archive and Distribution System) DAAC (Distributed Active Archive Center) (https://ladsweb.modaps.eosdis.nasa.gov, last access: 8 January 2020).
2.3 AERONET dataset
The Aerosol Robotic Network (AERONET) is a global distributed network of well-calibrated sun–sky photometers (Holben et al., 1998). By measuring direct sun radiance, AERONET provides high temporal (every 3 or 15 min in daytime depending on the operation mode of the instruments) multi-wavelength AOD products with high reliable accuracy (∼ ±0.01 to ±0.02) (Eck et al., 1999). Strict protocols for the calibration and maintenance assure homogeneity among all its instruments. Due to its high data quality, the AERONET AOD products are widely used as “ground truth” to evaluate satellite remote sensing aerosol products (Bréon et al., 2011; Chu et al., 2002; Kahn et al., 2005; Liu et al., 2004; Remer et al., 2005, 2002; Sayer et al., 2013).
In addition to direct sun observations, AERONET radiometers conduct routine measurements of the sky-scanning diffuse radiation. These observations are used to derive aerosol microphysical properties, e.g., single-scattering albedo, complex refractive index, size distribution and sphericity via Dubovik and King (2000). The accuracy of the AERONET inversion products has been analyzed in many studies (Dubovik et al., 2000; Sinyuk et al., 2020), and resulting recommendations were adopted for providing aerosol products of the highest quality (e.g., increase in quality of retrieval products with aerosol loading and range of observed scattering angles). The microphysical properties provided by AERONET contribute to aerosol and climatic applications. For example, the AERONET-derived aerosol particle property climatology (Dubovik et al., 2002b) is used in some form in nearly all satellite retrieval algorithms (including MODIS; see Levy et al., 2007b; Lyapustin et al., 2018) and feed the climate models used to characterize aerosol climate effects (Kinne et al., 2003; Sato et al., 2003).
In this study, the up-to-date AERONET Version 3 Level 2.0 dataset (http://www.aeronet.gsfc.nasa.gov, last access: 3 September 2019) (Giles et al., 2019) with standard cloud screening and quality control was used (Smirnov et al., 2000). We make use of all AERONET sites with data during the POLDER/PARASOL archive (2005–2013). The AERONET direct-sun AOD, Ångström exponent, fine- and coarse-mode AOD from the spectral deconvolution algorithm (SDA) (O'Neill et al., 2003), AAOD, and SSA product are chosen as references for satellite products comparison and evaluation.
2.4 Data quality assurance and matchup methodology
One of the main issues in satellite data validation is how to match the temporally varying AERONET point measurements with the spatially varying satellite remote sensing aerosol products at overpass time (Ichoku et al., 2002). This issue is compounded when multiple satellite products are involved that vary from ∼ 1 to ∼ 100 km pixel spatial resolution. There are some insightful studies (Kinne et al., 2013; Schutgens et al., 2017) that quantify the AERONET sites' spatial representativeness at scales from ∼ 50 to ∼ 300 km, which can be used for evaluation of chemical transport model simulations. However, the spatial resolutions (∼ 50 to ∼ 300 km) considered in those studies are seemingly too coarse for validation of satellite products of 1 km for MAIAC, 10 km for DB and DT, and ∼ 6 km data from PARASOL/GRASP.
This study considers aerosol products at 10 km spatial resolution, which is the native resolution of MODIS DB and DT products and seems to be the best compromise for comparing PARASOL/GRASP, MODIS DT, DB and MAIAC results. Also, 10 km is utilized by the aerosol community and other datasets (e.g., ESA CCI products mentioned earlier). This was also a reason for the generation of PARASOL/GRASP Level-3 products. Thus, we adopted PARASOL/GRASP Level-3 daily 0.1∘ gridded aerosol products, MODIS/AQUA Level-2 daily DT and DB 10 km products, and the 1 km MODIS MAIAC aggregated to 0.1∘ (MAIAC_0.1) and 0.01∘ (MAIAC_0.01) resolution for the inter-comparisons. MAIAC_0.01 essentially represents the single 1 km pixel retrieval. The PARASOL/Operational L2 daily aerosol product is directly used for validation, which is at 18.5 km × 18.5 km spatial resolution.
The strategies to select PARASOL/GRASP retrieval products with the highest quality are presented in Table 2. The land pixel is defined only if 100 % of the 0.1∘ by 0.1∘ grid box has been identified as land, so an ocean pixel must contain 0 % land. Also, to guarantee proper coast elimination, the first pixel bordering ocean and land is removed (see Fig. 1). We selected the more reliable retrievals using “residual relative” (mean root square of relative error in fitting the measurements by the algorithm) for PARASOL/GRASP products. We adopted the same threshold for GRASP/Optimized and GRASP/HP (0.05 over land and 0.1 over ocean). These thresholds are suggested for general users. For the GRASP/Models product we did not use any filter because a stricter quality assurance filter has been applied in GRASP/Models product generation from L1 to L2 and L3 than for other GRASP datasets. In principle, the post-processing of all PARASOL/GRASP products was done in similar ways. At the same time, the L3 products were prepared and released not at the same time. For example, the L3 GRASP/HP and Optimized archives were generated and released much earlier than GRASP/Models. Therefore, the post-processing and quality screening approaches used for different data archives are not exactly the same. Unfortunately, most of the differences were identified after the release of the products, their extensive use and the full-scale validation. In these regards, the harmonization of all the archives is likely to be done in the future, but it will lead to the release of new products.
Table 2Strategies used to select quality-assured PARASOL and MODIS aerosol products.
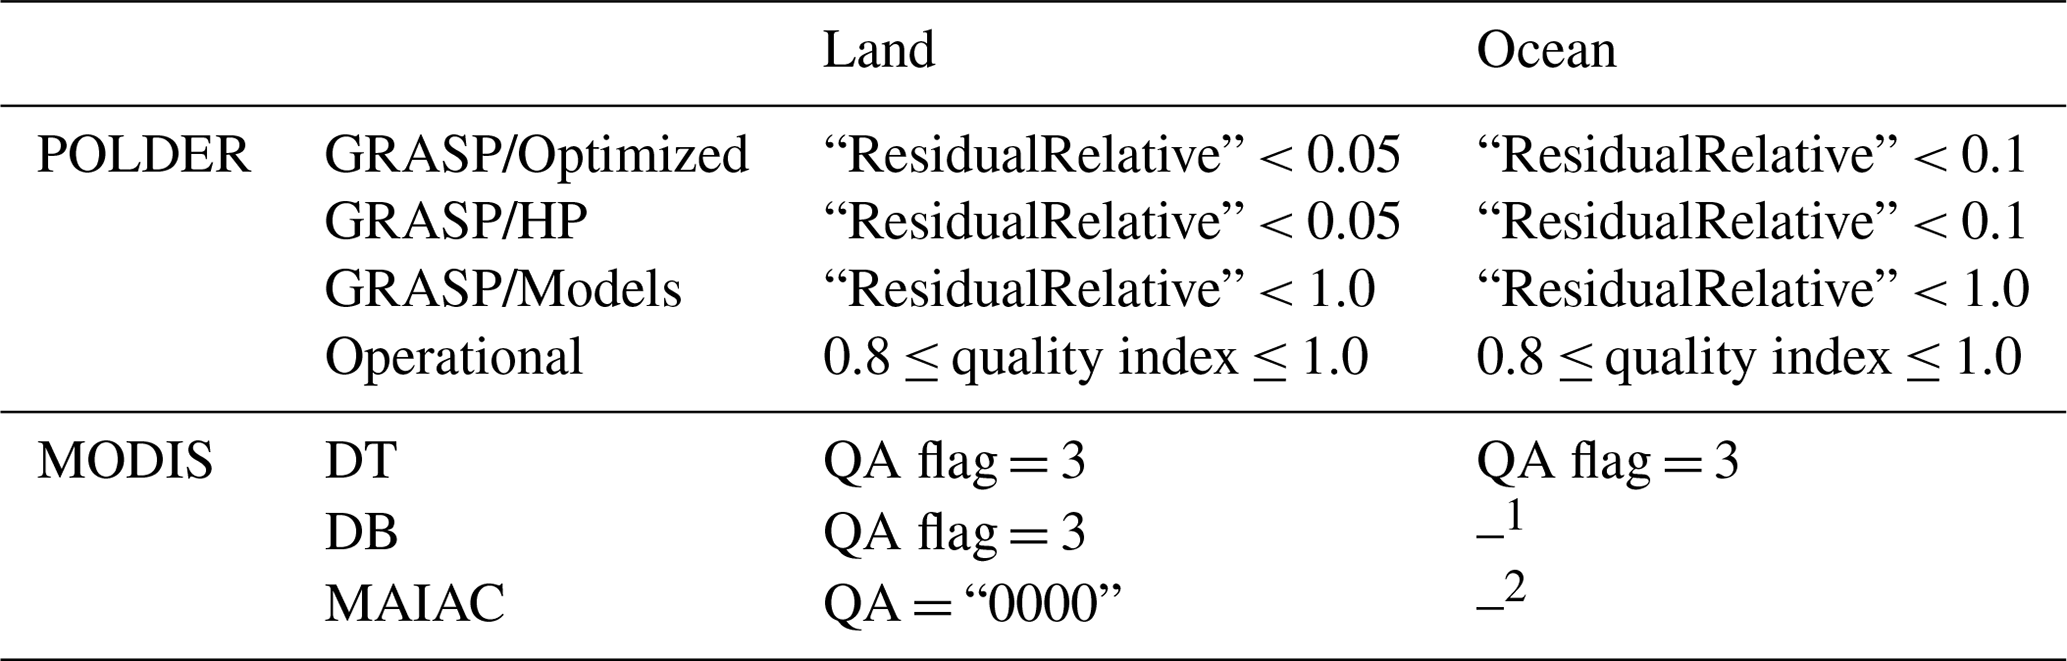
1 DB aerosol product is not available over ocean. 2 MAIAC aerosol product is presently only available for tiles containing land, so the ocean retrievals are not considered in this study.

In this study we tried to avoid additional filtering of PARASOL/GRASP L3 products, since most users utilize the products with no screening or with a very straightforward filtering. For MODIS DT, DB and MAIAC products, we select the data only with the highest quality assurance (QA) flag. The highest “quality index” was selected for PARASOL/Operational products (Bréon et al., 2011). Any pixel with a fitting residual higher than the threshold for PARASOL or QA lower than the highest flag for MODIS will be set to “no data”.
For validation with AERONET over land, we averaged all land satellite retrievals in a 3×3 window for the gridded satellite data centered over the AERONET station. For ocean sites, in order to select pure ocean pixels and keep a reasonably high number of validation points, we decided to use a 9×9 window over the AERONET site, using only pure ocean pixels. Any ocean pixels adjacent to land or land–ocean mixed pixels were omitted as represented in Fig. 1. The minimal number of accepted satellite data pixels within the window is 1 over land and 41 over ocean; otherwise, the data were excluded from comparison. The PARASOL/Operational product is treated a bit differently over ocean due to its relatively coarse resolution (∼ 18.5 km), with a similar land-like 3×3 window centered over the AERONET station.
The AERONET direct-sun AOD, AE, AODF and AODC data were averaged within ±30 min of the MODIS/AQUA and PARASOL overpass time, while AERONET SSA and AAOD (which have a lower sampling frequency) are averaged within ±180 min. In addition, AERONET station elevations greater than 3600 m above mean sea level and satellite 3×3 or 9×9 datasets with AOD standard deviation greater than 0.05 between window pixels were excluded.
2.5 Considered metrics for comparison statistics
For quantifying the validation results, we used standard statistical parameters, including Pearson's linear correlation coefficient (R), root-mean-square error (RMSE), slope and offset of linear regression and bias.
Here N is the number of matched data points i, Osatellite represents the observations from satellite and OAERONET represents the referenced observations from AERONET; and are the mean value for satellite and AERONET observations.
For MODIS validation, a commonly used metric is the fraction agreeing within and expected error (EE) envelope such as ±0.05 ± 0.15 AOD (Remer et al., 2005) or ±0.05 ± 0.1 AOD (Lyapustin et al., 2018). In this study, we adopted stricter requirements proposed by the Global Climate Observing System (GCOS) (the greater of 0.03 or 10 %), which have been adopted in the Aerosol_cci study (Popp et al., 2016) as well as the latest DB validation (Sayer et al., 2019). Following the Aerosol_cci study by Popp et al. (2016), the uncertainty of 0.01 for AERONET AOD has been taken into account and GCOS is defined as
Hence, the GCOS fraction (%) is the percentage of satellite-retrieved AOD satisfying the GCOS requirement.
In order to characterize the quality of the retrieved aerosol parameters from PARASOL, the set of main aerosol parameters including AOD, AE, AODF, AODC, SSA and AAOD was evaluated for the entire PARASOL ∼ 9-year (2005–2013) data archive. This list includes all main aerosol parameters expected to be retrieved from MAP instruments in general (Dubovik et al., 2019). In addition, the validation results of AOD, AE, AODF and AODC were compared with the results of validation of these (where available) from the standard PARASOL/Operational and MODIS products for the year 2008.
PARASOL/GRASP retrievals are available and validated at six wavelengths (443, 490, 565, 670, 865 and 1020 nm). The MODIS retrievals and even PARASOL/Operational have different spectral coverage, and, therefore, the comparisons of the GRASP product focused on the aerosol properties at the midvisible range (550 nm) that is commonly used in the satellite data comparisons and analysis (e.g., Sayer et al., 2018; Sogacheva et al., 2020). Therefore, for PARASOL/GRASP and PARASOL/Operational data the aerosol products were generated at 550 nm by interpolations in log-log space from the closest channels available from the products. Similarly, AERONET aerosol products were also interpolated to 550 nm since the ground-based radiometers do not have a 550 nm channel.
3.1 Global validation of PARASOL/GRASP aerosol products
3.1.1 Aerosol optical depth
Figure 2 shows scatter plots of co-located PARASOL/GRASP AOD against AERONET AOD at 550 nm for the entire POLDER/PARASOL archive: Fig. 2a for GRASP/Optimized, Fig. 2b for GRASP/HP and Fig. 2c for GRASP/Models. Validation metrics for total spectral AOD (443, 490, 550, 565, 670, 865 and 1020 nm), as well as AOD separated for land and ocean, are presented in Table 3. As can be seen from Fig. 2 and Table 3, all retrievals present good agreement with AERONET spectrally. Overall, based on these metrics the quality of the comparison with AERONET is best for GRASP/Models. For example, for AOD (550 nm) GRASP/Models shows better performance than GRASP/Optimized and GRASP/HP: R=0.923 compared to 0.877 and 0.899 and RMSE =0.119 for GRASP/Models compared to 0.160 and 0.161 for GRASP/Optimized and GRASP/HP, respectively, at 550 nm (see in Fig. 2). GRASP/Optimized and GRASP/HP show a positive overall bias of 0.06–0.07 for all AOD conditions, which remains for low-AOD conditions (AOD< 0.2) and even increases to 0.08 (GRASP/Optimized). In comparison, GRASP/Models has a small overall bias (of 0.01 for AOD at 550 nm) that slightly increases to 0.03 for high-AOD conditions (AOD > 0.7). Because of the bias in GRASP/HP and GRASP/Optimized AOD, GCOS fraction for them is much lower than for GRASP/Models AOD: e.g., 55.3 % (AOD at 550 nm) for land + ocean vs. 28.2 % and 34.4 %, respectively. Over ocean, all three archives show good correlation with coefficients R > 0.93 at 550 nm. Nevertheless, GRASP/Models over ocean has the highest R=0.950 and offers the best performance for the other statistical metrics. As described in Sect. 2.4, the different post-processing scheme resulted in the difference for matched points between GRASP/Optimized, GRASP/HP and GRASP/Models. It can be noticed that applying a much stricter filter may improve the overall correlation against AERONET AOD for GRASP/HP and GRASP/Optimized products but leads to significant loss of points and, most importantly, does not improve the BIAS, which is considered to be a main issue for them.
Table 3Global statistics of PARASOL/GRASP spectral AOD vs. AERONET AOD over land and ocean. The best performing of three approaches by each metric is labeled in bold.
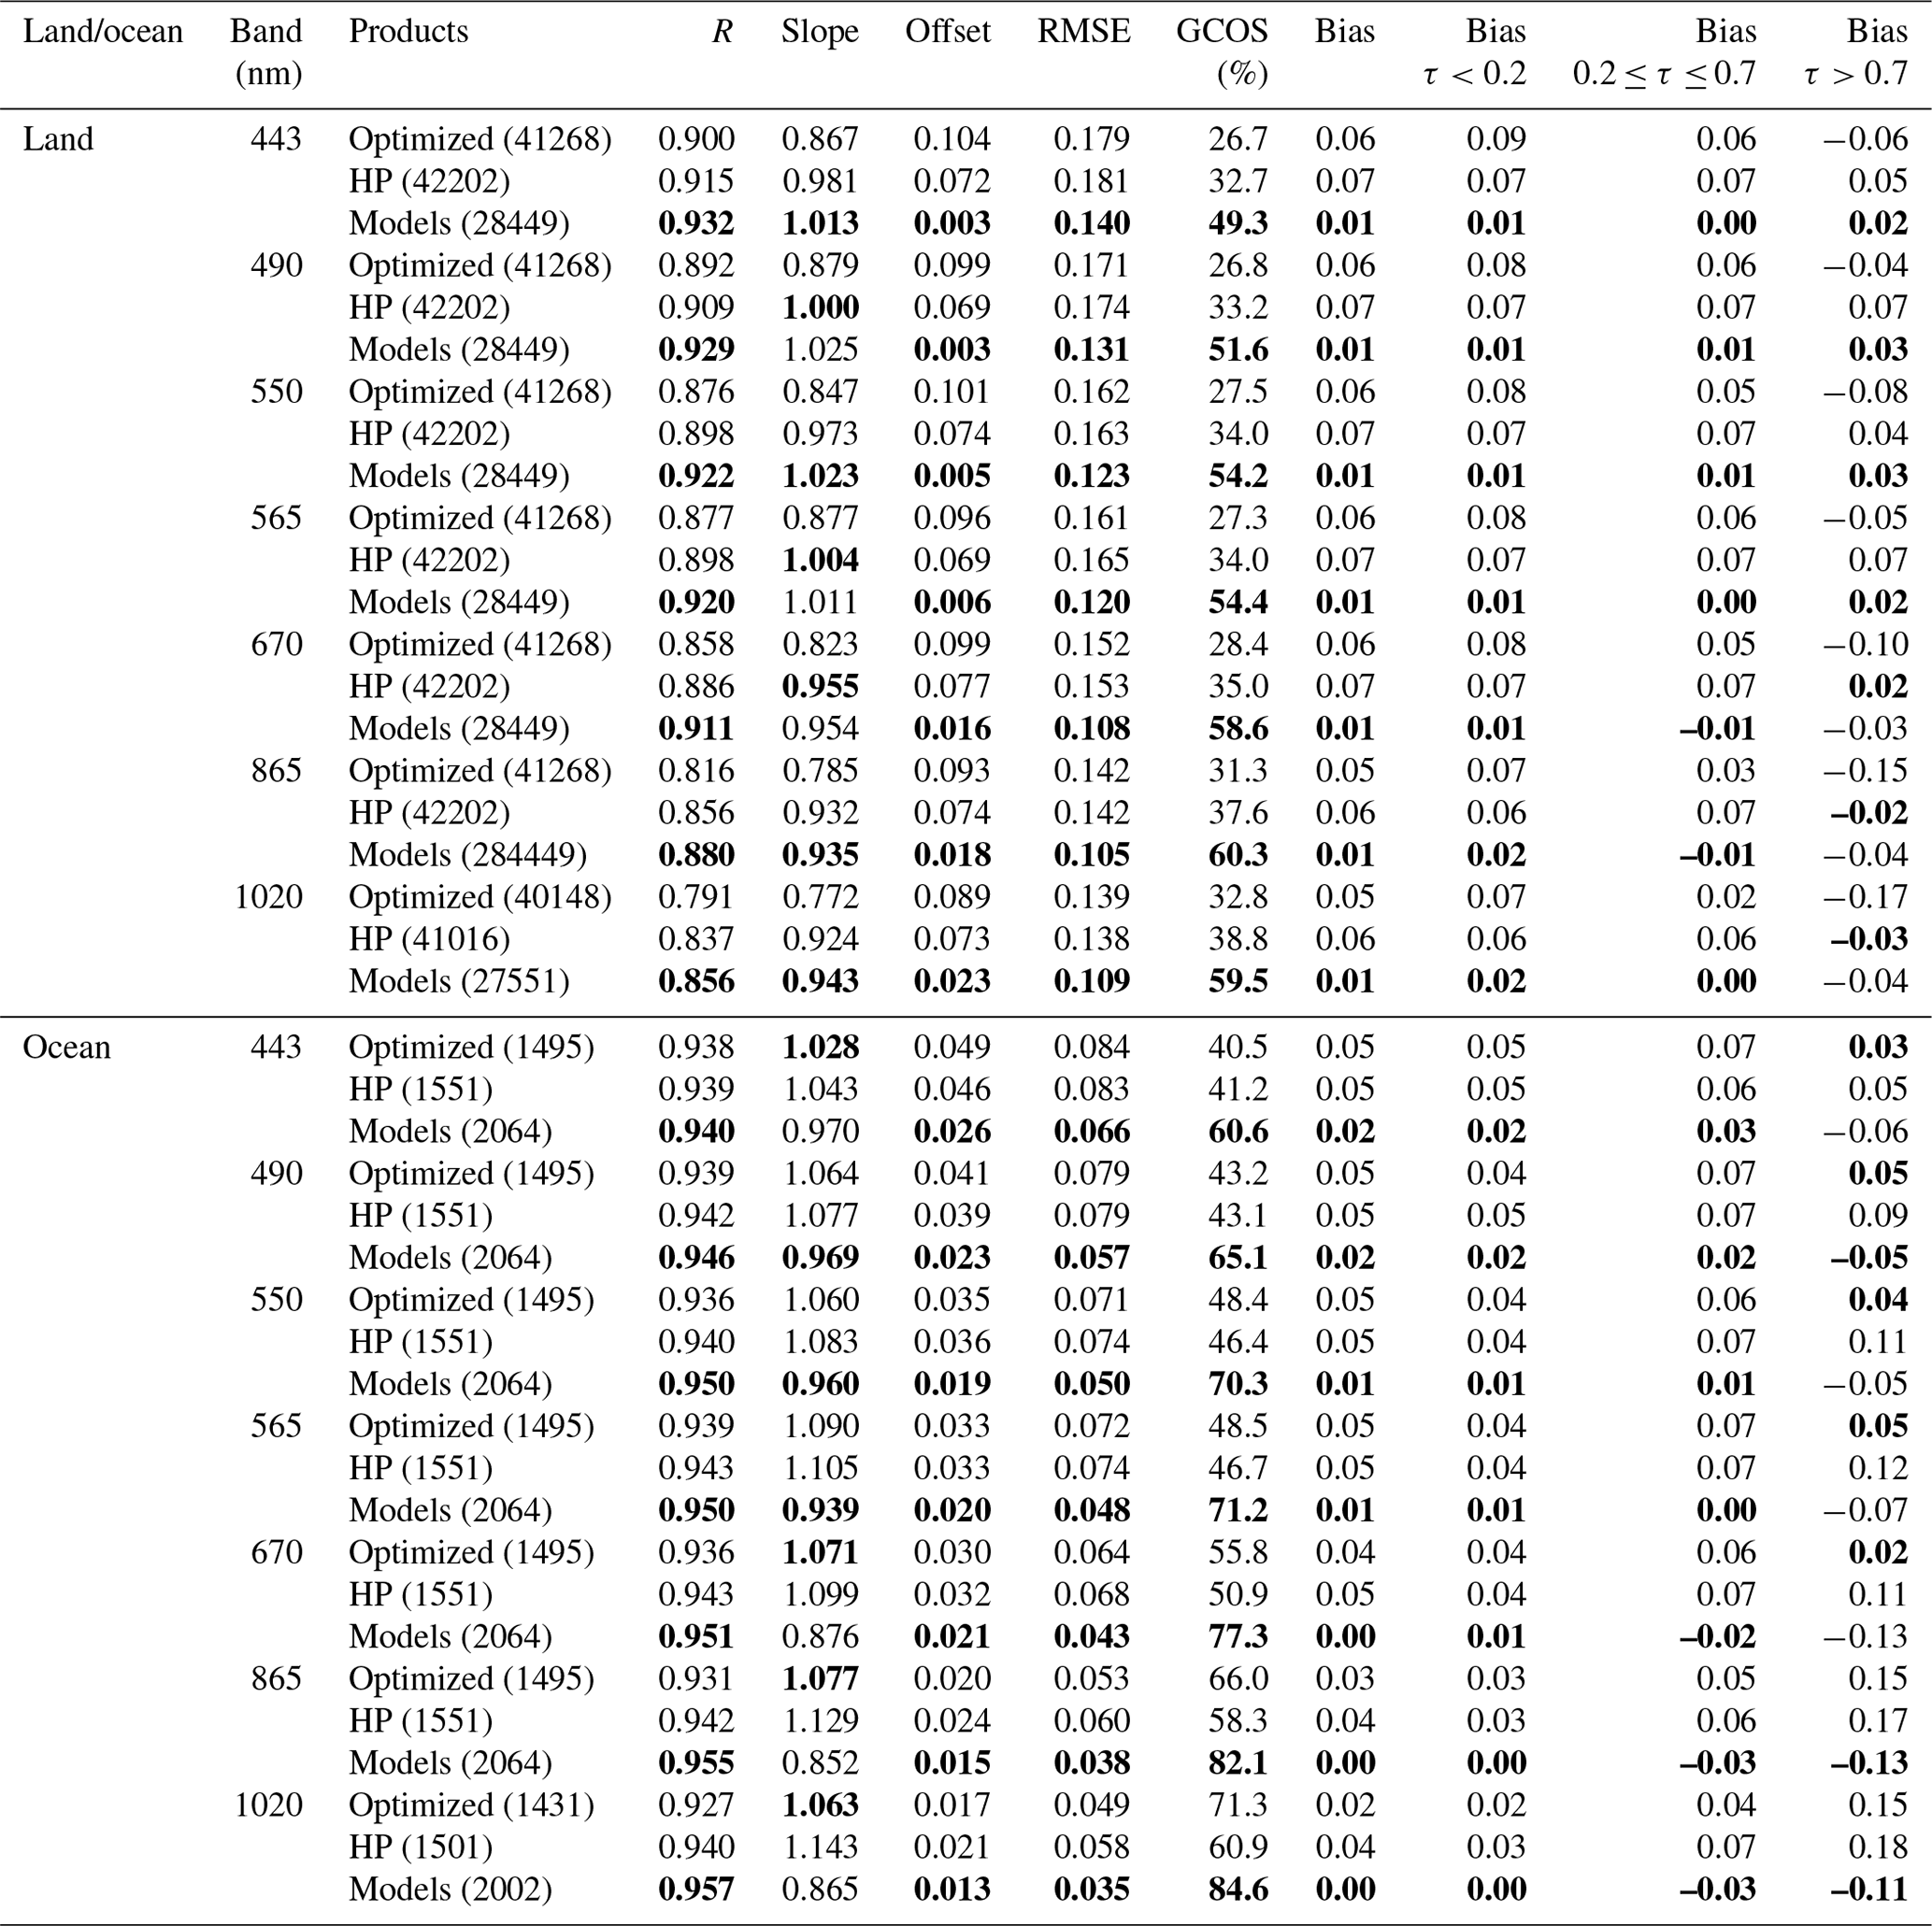
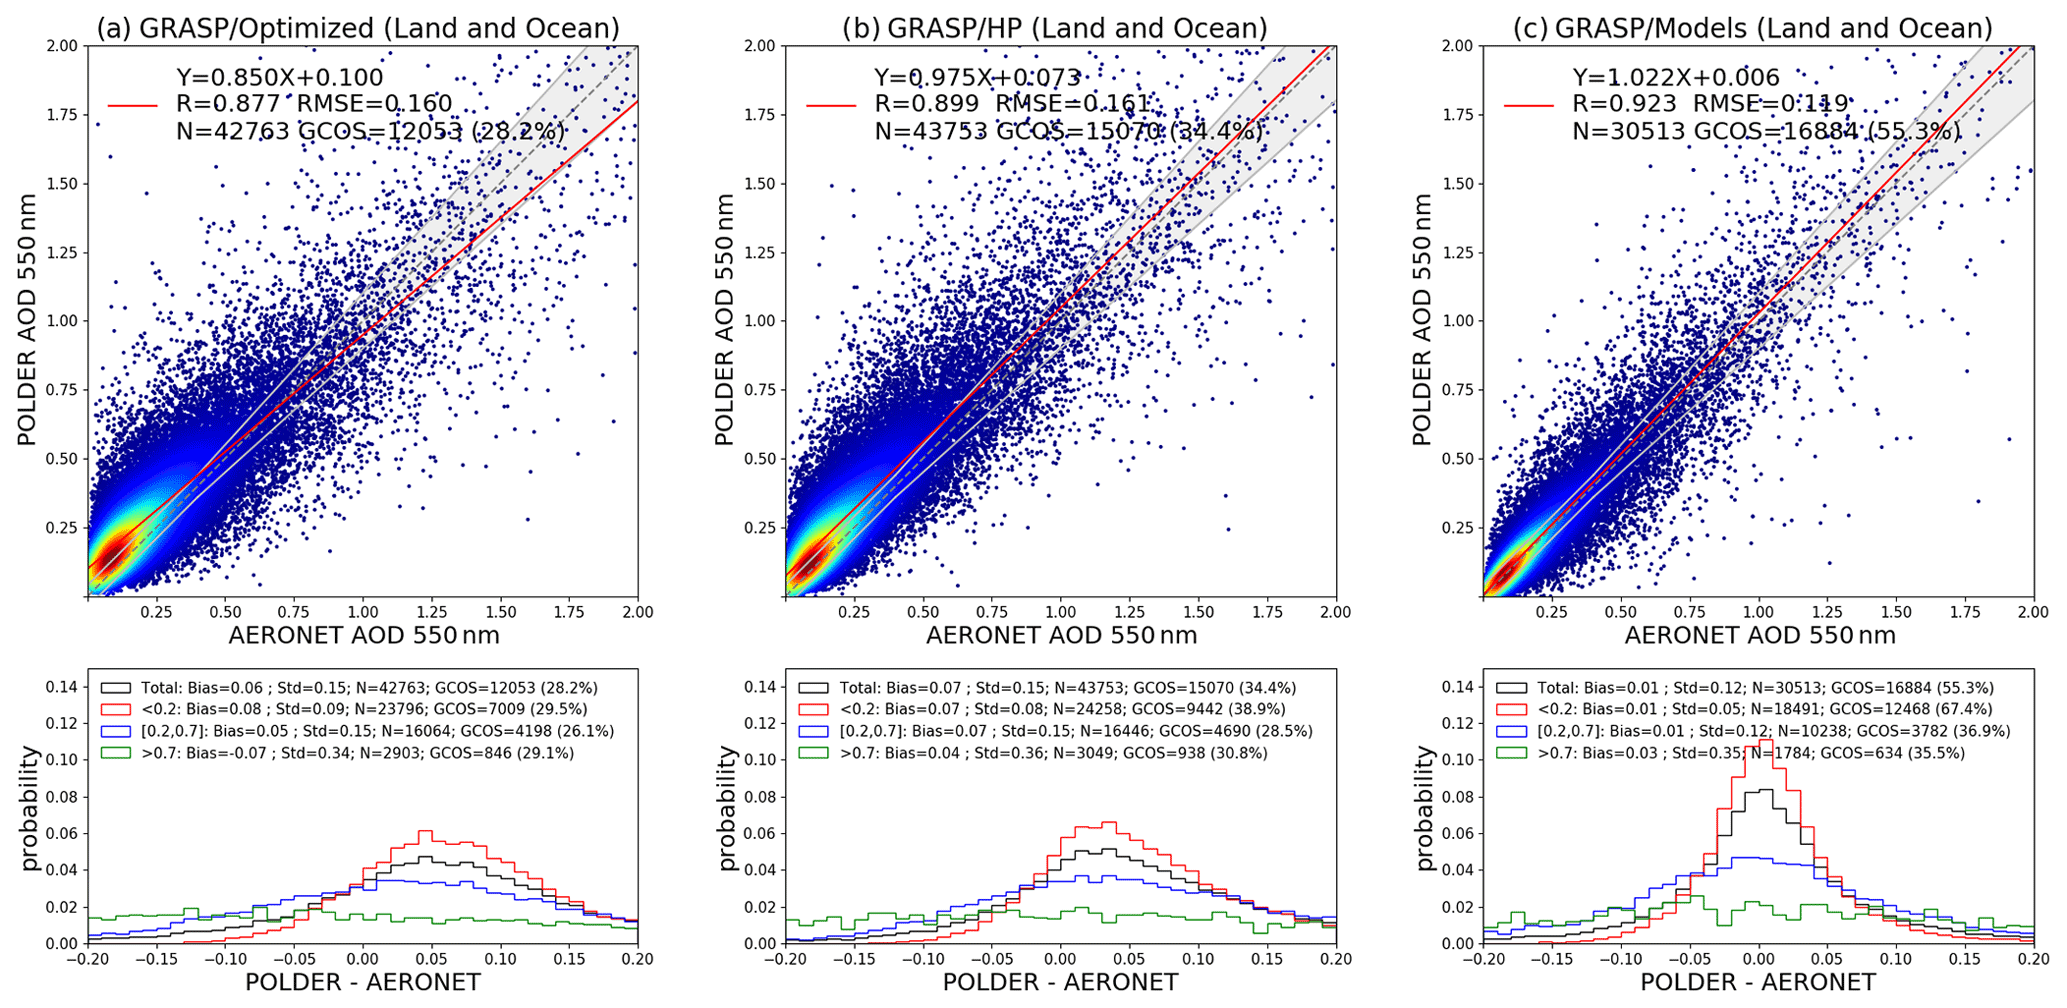
Figure 2Evaluation of three archives of PARASOL/GRASP AOD at 550 nm against AERONET: (a) GRASP/Optimized, (b) GRASP/HP, (c) GRASP/Models. The gray dashed line and the red solid line are the 1:1 reference line and the linear regression line. The gray envelope indicates GCOS requirement: max (0.04 or 0.1 AOD). The probability density functions of differences (POLDER-AERONET) are present in the lower panel. The black, red, blue and green solid lines indicate all AOD conditions: any AOD, AOD < 0.2, 0.2 ≤ AOD ≤ 0.7 and AOD > 0.7, respectively.
It is very important to note the robust performance of PARASOL/GRASP AOD retrieval in all spectral channels. For example, the GRASP/Models product shows only minor spectrally independent bias of 0.01 over land, and over ocean the bias is about 0.02 at 440 nm and decreases to zero at longer wavelengths, and the GCOS fraction for all wavelengths is at least ∼ 50 % over land and ∼ 60 % over ocean.
3.1.2 Ångström exponent
AE was determined from AOD at two different wavelengths (. The accuracy of AE decreases for low AOD because even a small spectral bias of the AOD affects AE strongly (e.g., Wagner and Silva, 2008). Therefore, the threshold of PARASOL AOD (550 nm) > 0.2 was used in AE validation. For calculating the PARASOL AE (440∕870), the AOD retrieved at 443 and 865 nm is interpolated to nominal 440 and 870 nm wavelengths. Figure 3 shows the scatter plots of PARASOL/GRASP AE against AERONET AE (440∕870) for the whole archive (Fig. 3a: for GRASP/Optimized, Fig. 3b: for GRASP/HP and Fig. 3c: for GRASP/Models). GRASP/HP has a higher correlation R (0.845) than GRASP/Optimized (0.800) and GRASP/Models (0.692). In addition, GRASP/HP shows a lower RMSE (0.334) than GRASP/Optimized (0.356) and GRASP/Models (0.415). The statistics of separated land and ocean AE validation are presented in Table 4. Over ocean, the correlation coefficients are significantly higher (R > 0.93) than over land for all three datasets. Overall, the AE correlation statistical metrics are the best for GRASP/HP over both land and ocean. The GRASP/Models product has the smallest BIAS over land, which is counterpoised by overestimation of low and underestimation of high AE values due to assumed size distributions in the aerosol model-based approach. Both GRASP/Optimized and GRASP/HP capture AE well when large particles are dominant (AE < 1.0), while the products tend to slightly underestimate AE when small particles are dominant (AE > 1.0).
Table 4Global statistics of PARASOL/GRASP AE vs. AERONET AE (440∕870) over land and ocean. The best performing of three approaches by each metric is labeled in bold.
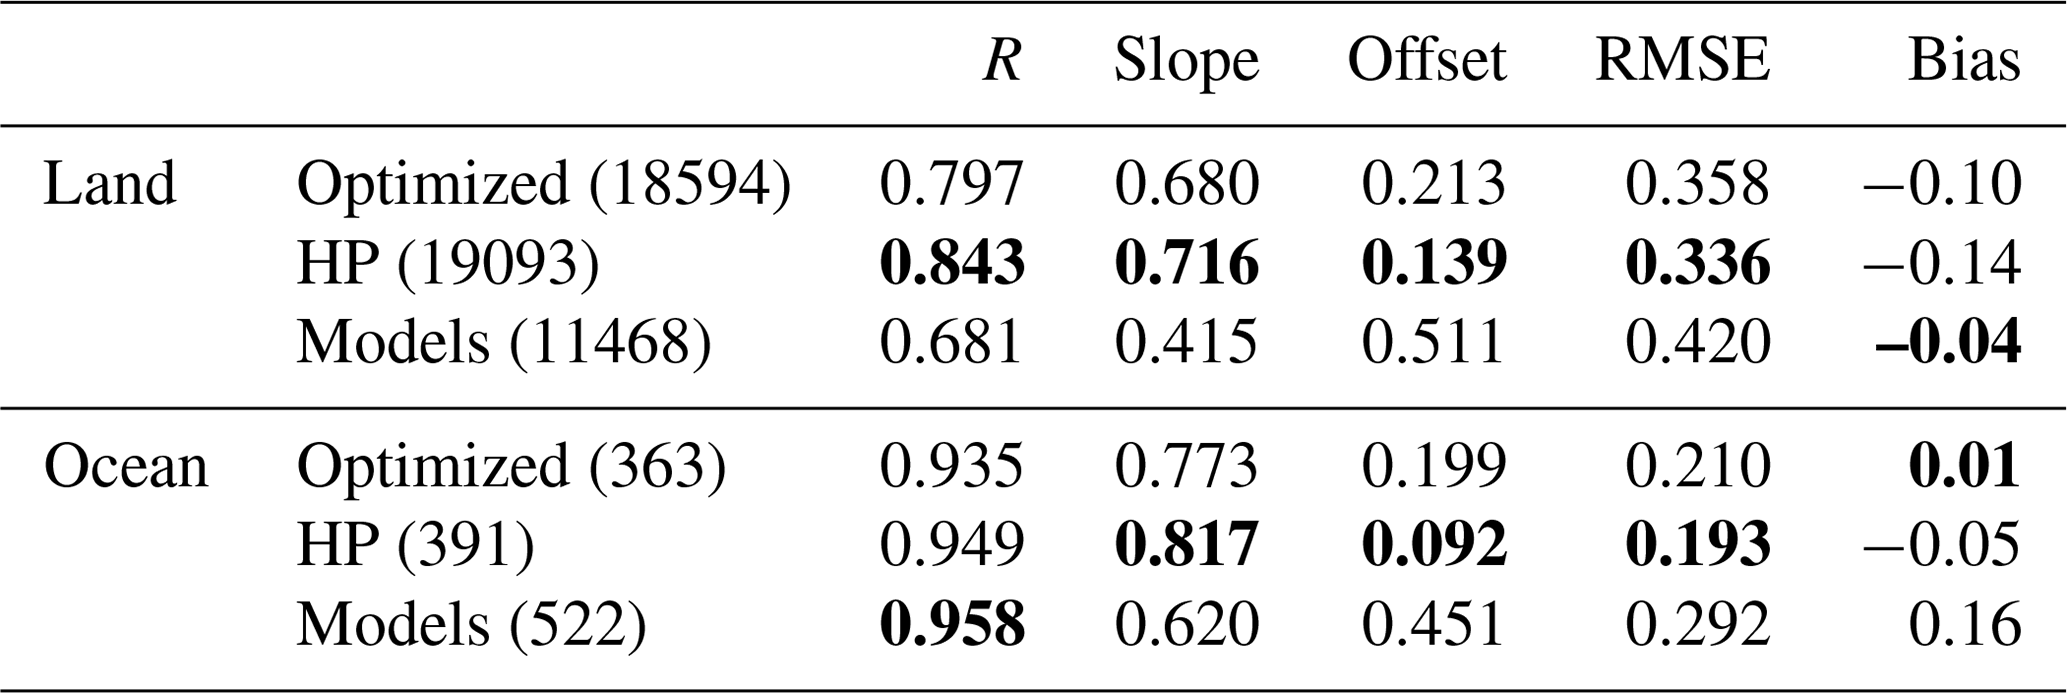
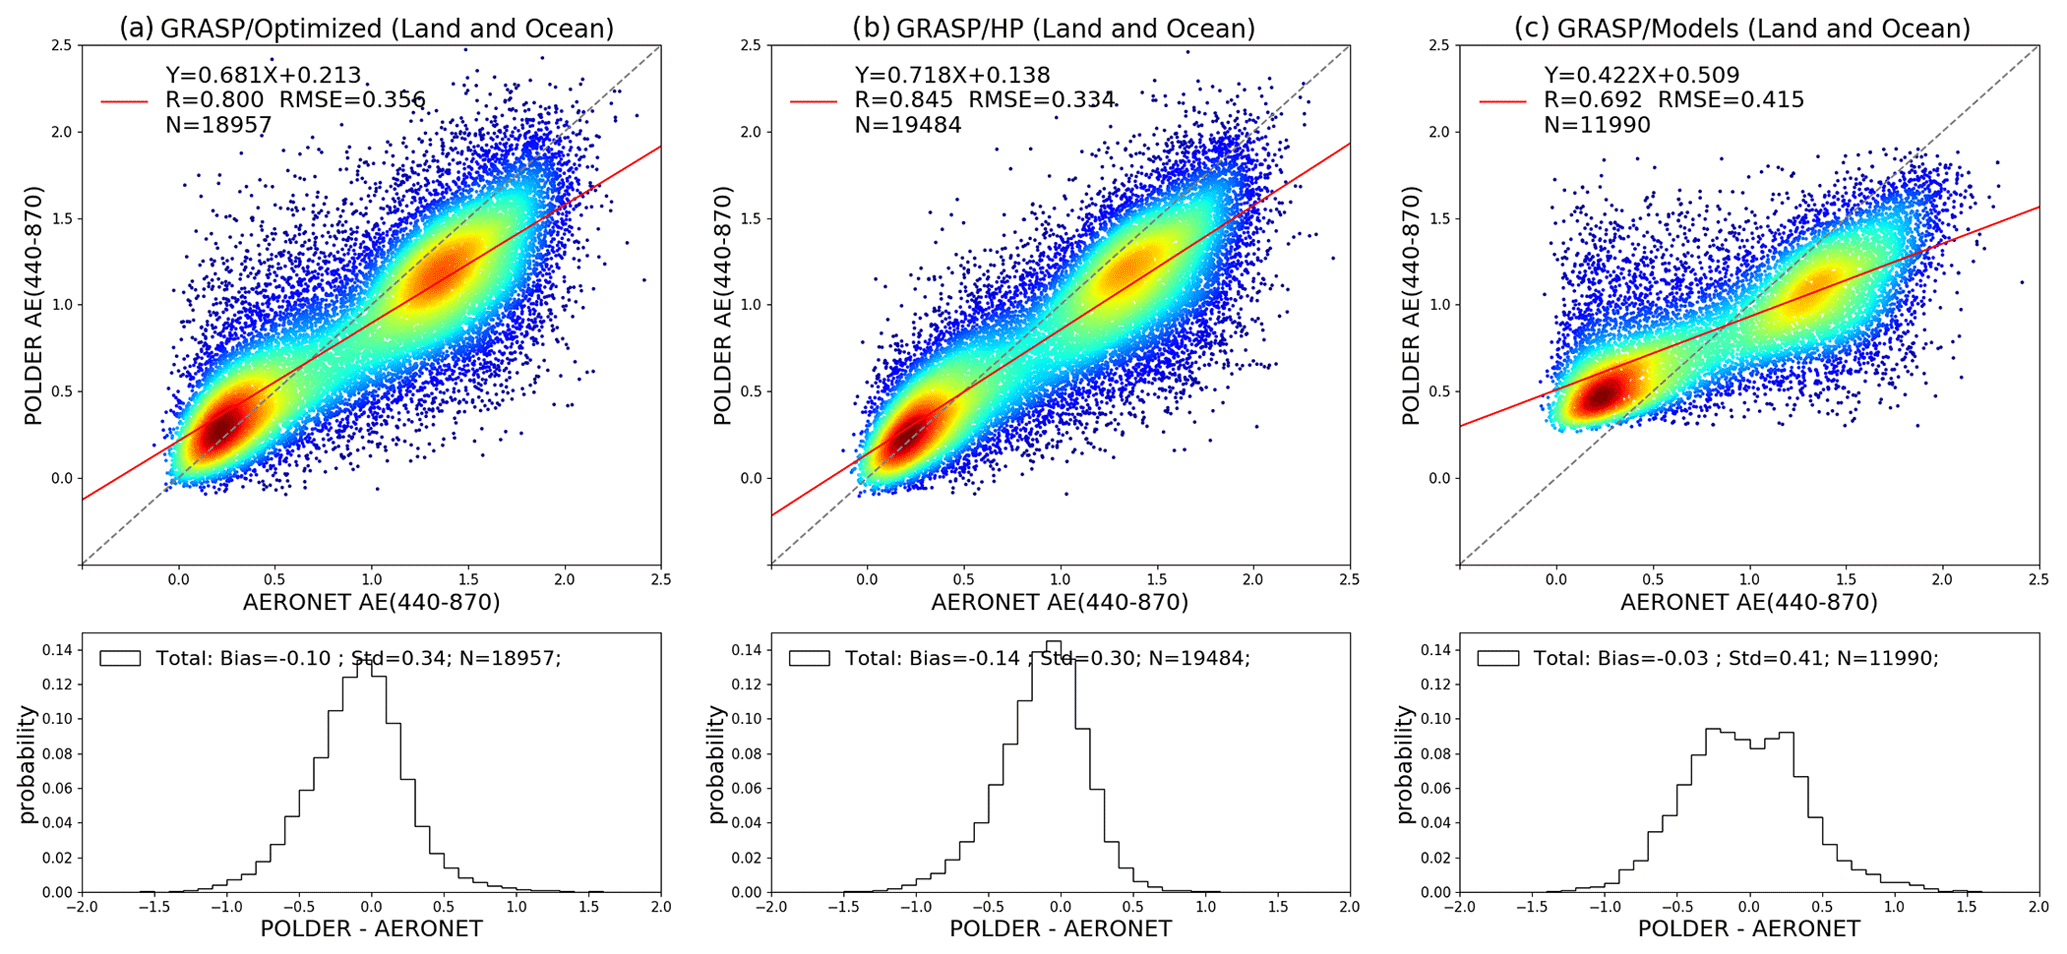
Figure 3Evaluation of all archive PARASOL/GRASP AEs (440∕870) against AERONET: (a) GRASP/Optimized, (b) GRASP/HP, (c) GRASP/Models. The gray dashed line and the red solid line are the 1:1 reference line and the linear regression line. The probability density functions of differences (POLDER–AERONET) are present in the lower panels.
3.1.3 Fine- and coarse-mode aerosol optical depth
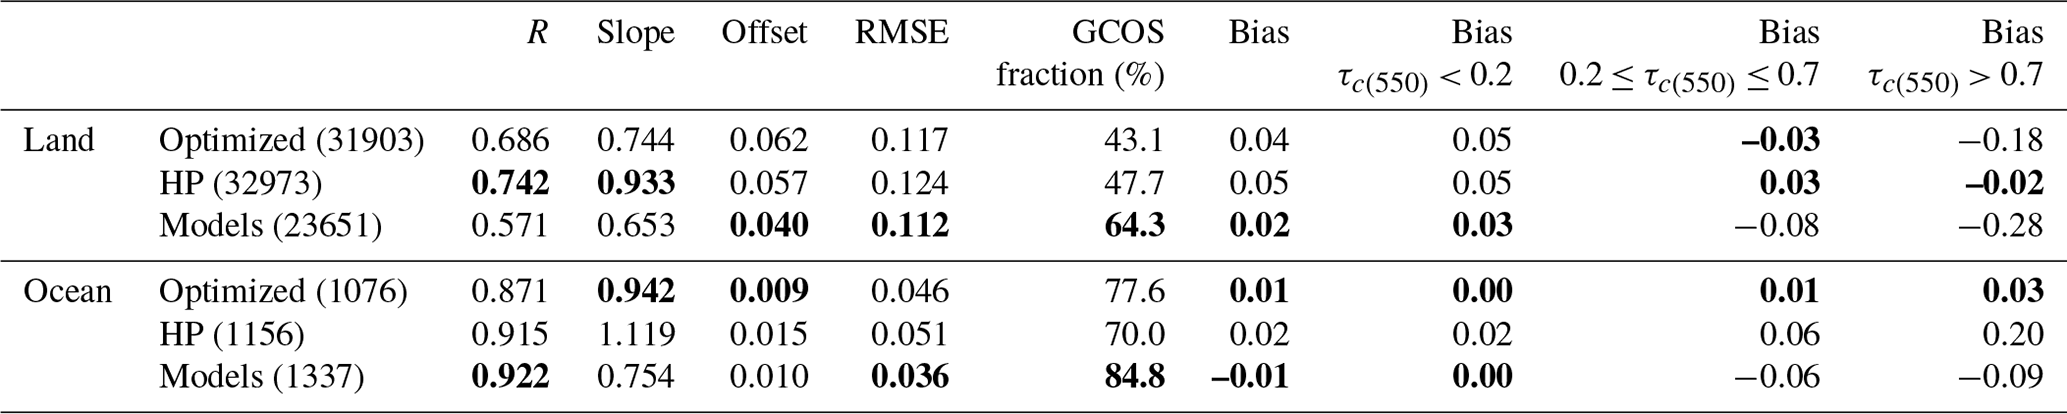
Figure 4 shows the validation of PARASOL/GRASP AODF against SDA AODF provided by AERONET. AERONET SDA products (O'Neill et al., 2003) reported only at 500 nm; therefore here they were interpolated to AODF at 550 nm based on AE using a quadratic fit in log-log space (Eck et al., 1999). Over land + ocean, GRASP/HP AODF shows the best validation statistics with correlation R = 0.925; bias = 0.01 and slope = 0.892 compared to R = 0.922; bias = 0.02 and slope = 0.840 for GRASP/Optimized; and R = 0.867, bias = −0.02, and slope = 0.662 for GRASP/Models. The GRASP/Models AODF product has a slightly smaller RMSE (0.092) than GRASP/HP (0.097) and GRASP/Optimized (0.099). Even though the GCOS requirement is initially defined for total AOD, here we also applied the GCOS fraction to the AODF validation based on max (±0.04, ±0.1 AODF). The GCOS fraction for all AODF products is at least ∼ 55 % over land + ocean. The GCOS fraction is highest for GRASP/Models (65.2 %), which is dominant for low-aerosol-loading cases (AODF < 0.2). For moderate and high aerosol loadings (AODF > = 0.2), GRASP/Optimized and GRASP/HP show better performance than GRASP/Models, in terms of GCOS fraction and biases. The linear regression slope for GRASP/Models is weakest at 0.662 compared to 0.892 and 0.840 for GRASP/HP and GRASP/Optimized, respectively. These facts suggest a possible underestimation of fine-mode aerosol in high-AOD conditions for GRASP/Models. Caution is required in the interpretation of the regression slope as these data may not meet the assumptions behind the technique; however, the results are useful in a comparative sense. The statistics for separated land and ocean are presented in Table 5. As can be seen, overall, PARASOL/GRASP AODF products show very good agreement with AERONET SDA products. GRASP/HP AODF demonstrates the best performance in terms of the highest correlation and smallest bias.
Table 5Global statistics of PARASOL/GRASP AODF vs. AERONET SDA AODF at 550 nm over land and ocean. The best performing of three approaches by each metric is labeled in bold.

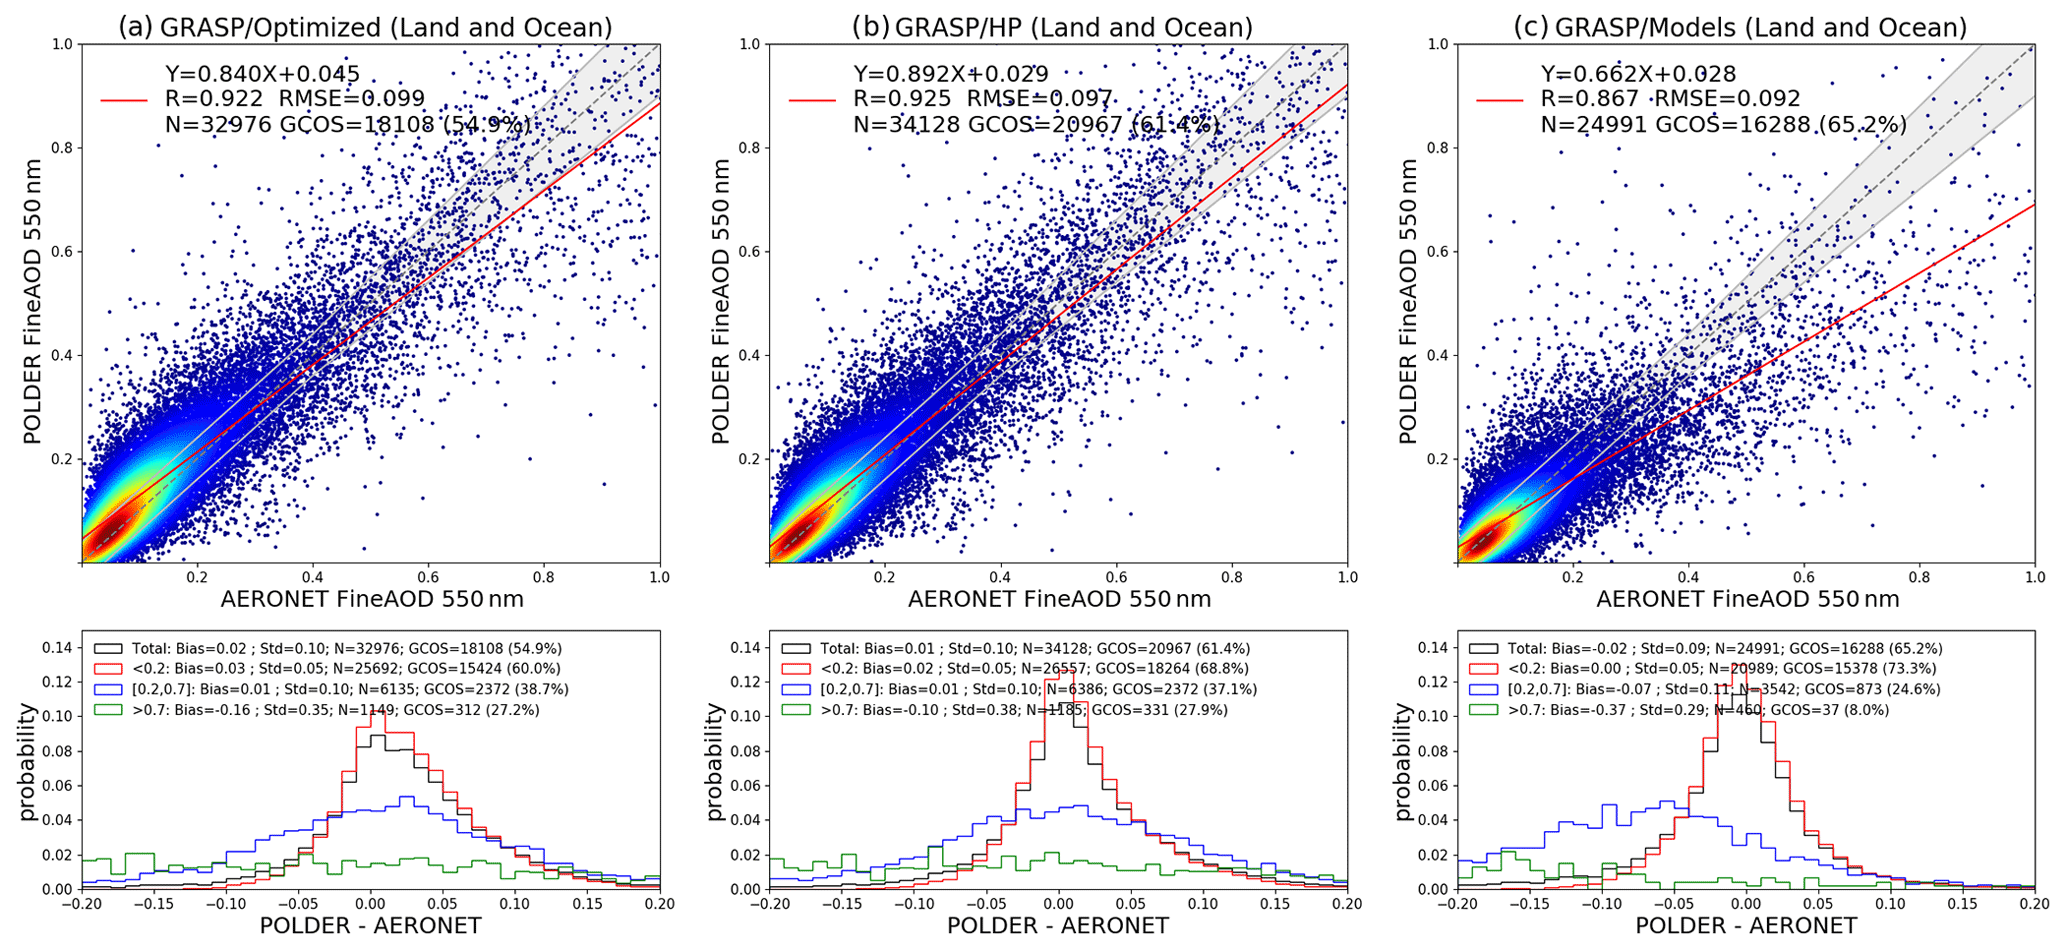
Figure 4Evaluation of all archive PARASOL/GRASP AODF at 550 nm with AERONET SDA AODF: (a) GRASP/Optimized, (b) GRASP/HP, (c) GRASP/Models. The gray dashed line and the red solid line are the 1:1 reference line and the linear regression line. The gray envelope indicates the GCOS requirement applied for AODF: max (0.04 or 0.1 AODF). The probability density functions of differences (POLDER–AERONET) are present in the lower panel. The black, red, blue and green solid lines indicate all AODF conditions: any AODF, AODF < 0.2, 0.2 ≤ AODF ≤ 0.7 and AODF > 0.7, respectively.
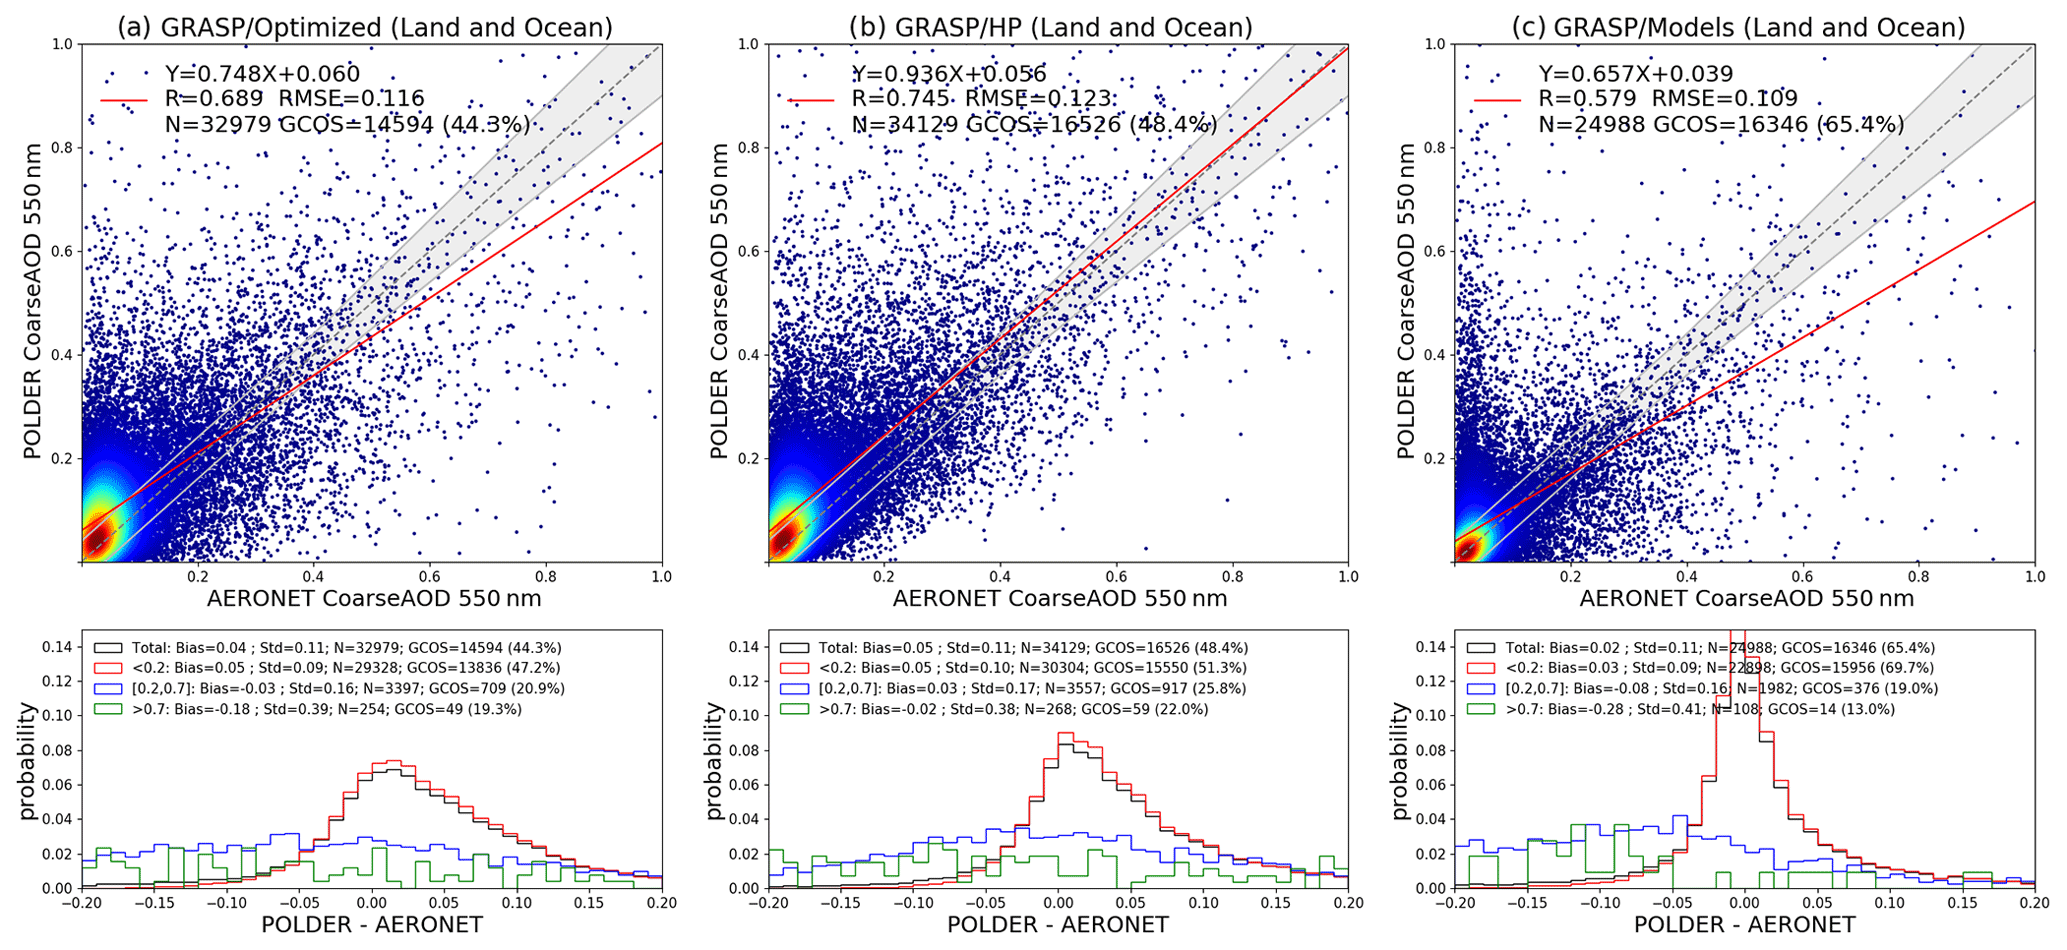
The coarse-mode AOD (AODC) is traditionally a difficult parameter to derive from satellite observations, especially over bright land surfaces, since nadir-looking satellite measurements are not very sensitive to large particles. The validation of all archived PARASOL/GRASP AODC with AERONET SDA AODC is presented in Fig. 5. Generally, the global (land + ocean) statistical metrics for AODC are less convincing than those for AODF but still reasonable: GRASP/HP has higher correlation R (0.745) and slope (0.936) than GRASP/Optimized (R = 0.689, slope = 0.748) and GRASP/Models (R = 0.579, slope = 0.657). GRASP/Models retrievals show a smaller bias (0.02) and RMSE (0.109) than GRASP/Optimized (bias = 0.04, RMSE = 0.116) and GRASP/HP (bias = 0.05, RMSE = 0.123). The GCOS fraction of AODC max (±0.04, ±0.1AODC) for GRASP/Models (65.4 %) is higher than GRASP/Optimized (44.3 %) and GRASP/HP (48.4 %). In line with AODF, GRASP/Models has better performance for low-aerosol-loading cases, which account for ∼ 90 % of the number of points. The statistics of separated land and ocean AODC validation, presented in Table 6, show a much higher correlation of retrieved AODC with AERONET over ocean. It is also interesting to note that the validation statistics for AODF seems to be superior to that for AODC over land, and the situation is reversed. This can be explained by the fact that the fine-mode aerosols have higher abundance over land while coarse-mode aerosol is dominant over ocean; i.e., dynamic ranges are different. Also, at longer wavelengths where the contribution of coarse particles to radiation is significant, the land surface is very bright while the ocean surface is practically dark. Over land AODC in GRASP/HP and GRASP/Optimized products exhibits rather high bias of 0.05 and 0.03 correspondingly, which probably dominates the bias for the total AOD in both. For the GRASP/Models product, biases in AODF and AODC over land have comparable magnitudes and different signs and therefore compensate for each other in the total AOD.
Table 6Global statistics of PARASOL/GRASP AODC vs. AERONET SDA AODC at 550 nm over land and ocean. The best performing of three approaches by each metric is labeled in bold.
3.1.4 Single-scattering albedo
Figure 6 shows the validation of PARASOL/GRASP SSA (670 nm) with AERONET L2 inversion products. The SSA products in the AERONET L2 database provide the values only for moderate- and high-AOD cases (AOD at 440 nm ≥ 0.4) to assure the highest quality of the inversion products (Dubovik et al., 2000, 2002b). Following the same strategy, PARASOL/GRASP L2 and L3 products of SSA for low-AOD cases are also filtered out (land: AOD 443 nm < 0.3; ocean: AOD 443 nm < 0.02). The threshold for filtering SSA over ocean is very low because using higher values would eliminate a significant fraction of the retrievals. This low-AOD filtering is done over L2 products, and then L3 SSA is generated from filtered L2 products. The validation shows convincing correlation of all SSA PARASOL/GRASP products with those from AERONET, although due to a rather small dynamic range (mostly 0.7–1.0) of SSA, the correlation coefficients for SSA (670 nm) in Fig. 6 are notably lower than for other parameters. The highest correlation is for GRASP/HP with R = 0.536 and RMSE (0.056) compared with GRASP/Optimized (R = 0.511; RMSE = 0.065) and GRASP/Models (R = 0.324; RMSE = 0.057), while GRASP/Models has the smallest bias (−0.02) compared to GRASP/HP (bias = −0.03) and GRASP/Optimized (bias = −0.04).

Figure 6Evaluation of all archive PARASOL/GRASP SSA values at 670 nm with AERONET SSA at 675 nm: (a) GRASP/Optimized, (b) GRASP/HP, (c) GRASP/Models. The gray dashed line and the red solid line are the 1:1 reference line and the linear regression line.
Table 7 shows the statistics of PARASOL/GRASP spectral SSA (443, 670, 865 and 1020 nm) against AERONET SSA at four wavelengths (440, 675, 870 and 1020 nm). The statistics are given for combined land and ocean, because of the limited number of validation points over ocean. The SSA correlation coefficients for GRASP/Optimized and GRASP/HP L3 products increase from 440 nm (∼ 0.25) to 1020 nm (∼ 0.60), which is likely due to the increased dynamic range of SSA at longer wavelengths (e.g., see Dubovik et al. (2002b); SSA at 1020 can change from very low values for biomass burning aerosol to nearly unity for desert dust). Consequently, the RMSE also increases from 440 to 1020 nm.
Table 7Global statistics of PARASOL/GRASP spectral SSA vs. AERONET SSA stratified by PARASOL AOD (565 nm) levels. The best performing at each wavelength of three approaches by each metric is labeled in bold.
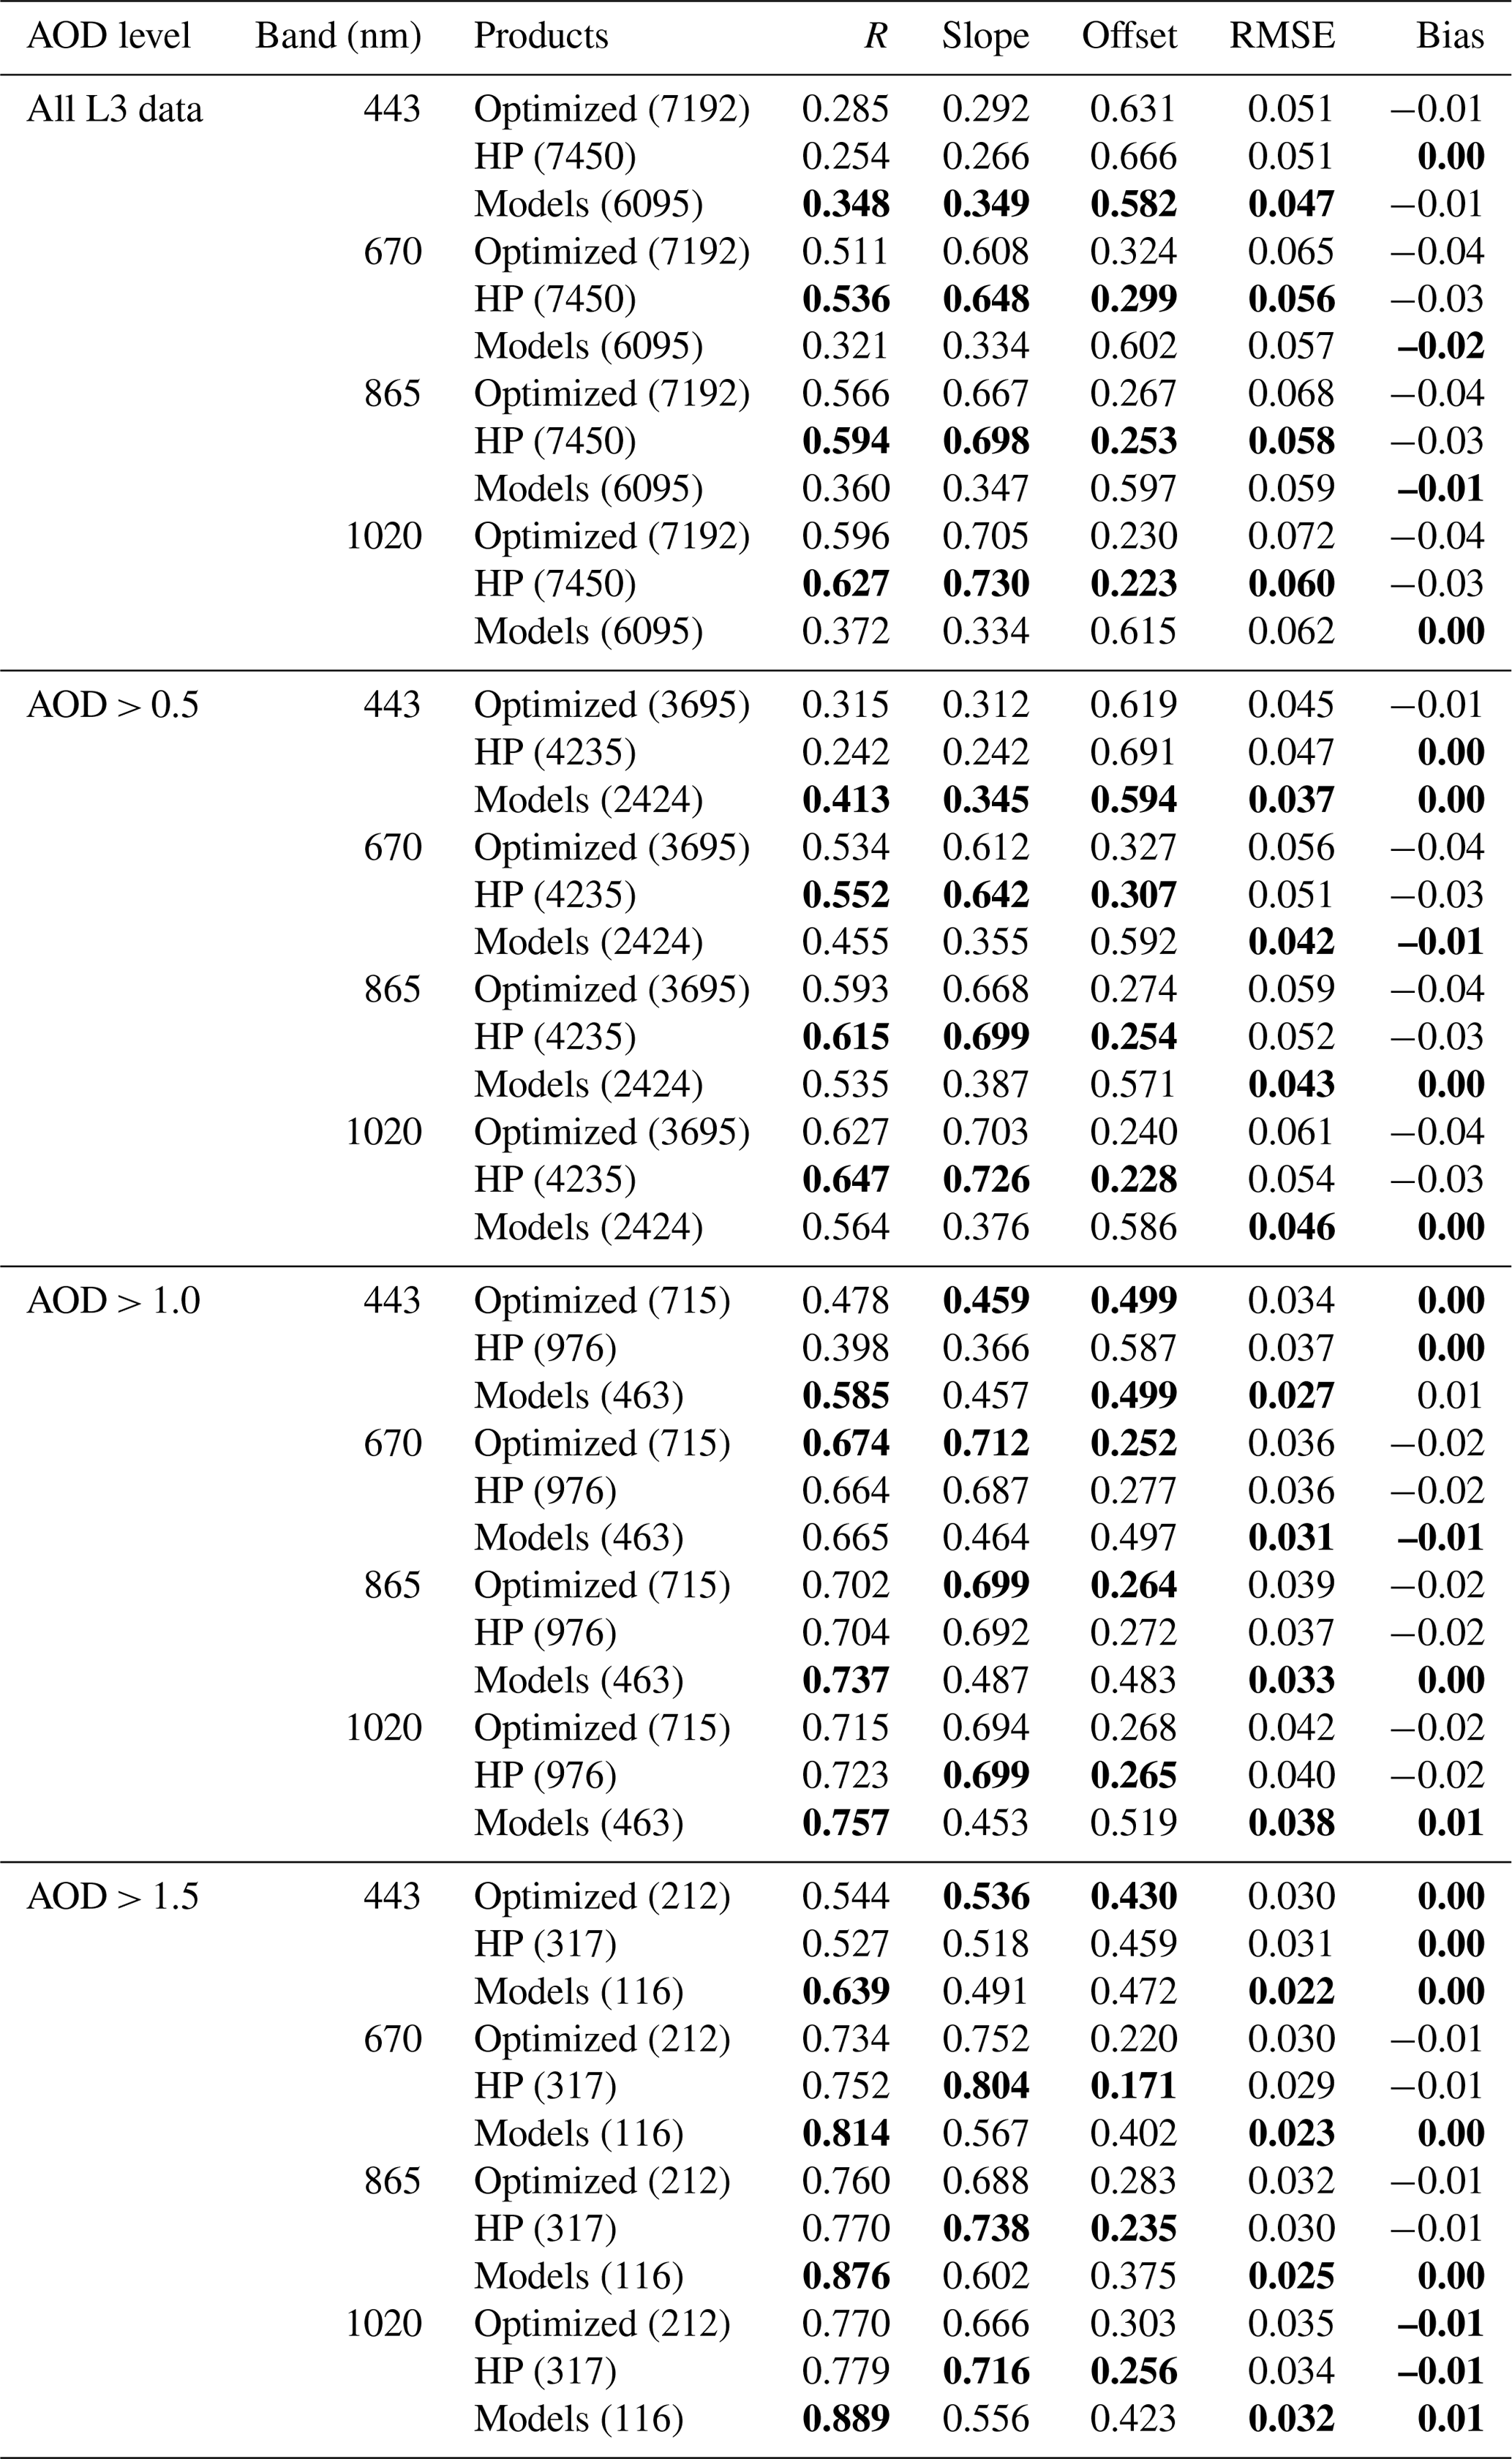
In addition, Table 7 reports the statistics of SSA validation at different PARASOL AOD levels. The results clearly illustrate the improvement of retrieved SSA with the increase in aerosol abundance, in agreement with the results of AERONET sensitivity studies by Dubovik et al. (2000). For example, the correlation coefficient for GRASP/Models SSA at 670 nm with AERONET significantly improves from 0.321 for all PARASOL/GRASP L3 products to 0.814 for PARASOL AOD greater than 1.5. Meanwhile, the RMSE decreases from 0.056 to 0.029.
3.1.5 Aerosol absorption optical depth
Aerosol absorption optical depth (AAOD) is related to SSA and total AOD as
In the current PARASOL/GRASP L3 dataset, the AAOD value of each grid box (0.1∘ or 1∘) is calculated based on Eq. (5) using average AOD(λ) and SSA(λ) of the grid box. Note that the PARASOL/GRASP L3 SSA(λ) values are aggregated based on moderate- and high-AOD cases (land: AOD 443 nm ≥ 0.3; ocean: AOD 443 nm ≥ 0.02), and again the very low threshold for filtering SSA over ocean was chosen in order to retain a sufficient number of SSA and AAOD retrievals. Choosing even slightly higher values would eliminate the majority of retrievals over ocean. Thus, the direct use of L3 climatology of AAOD may lead to overestimation of the global aerosol absorption, because the low-AOD cases are filtered. Similarly, the AERONET L2 database provides AAOD products only for moderate- and high-AOD cases (AOD at 440 nm ≥ 0.4) to assure their highest quality (Dubovik et al., 2000).
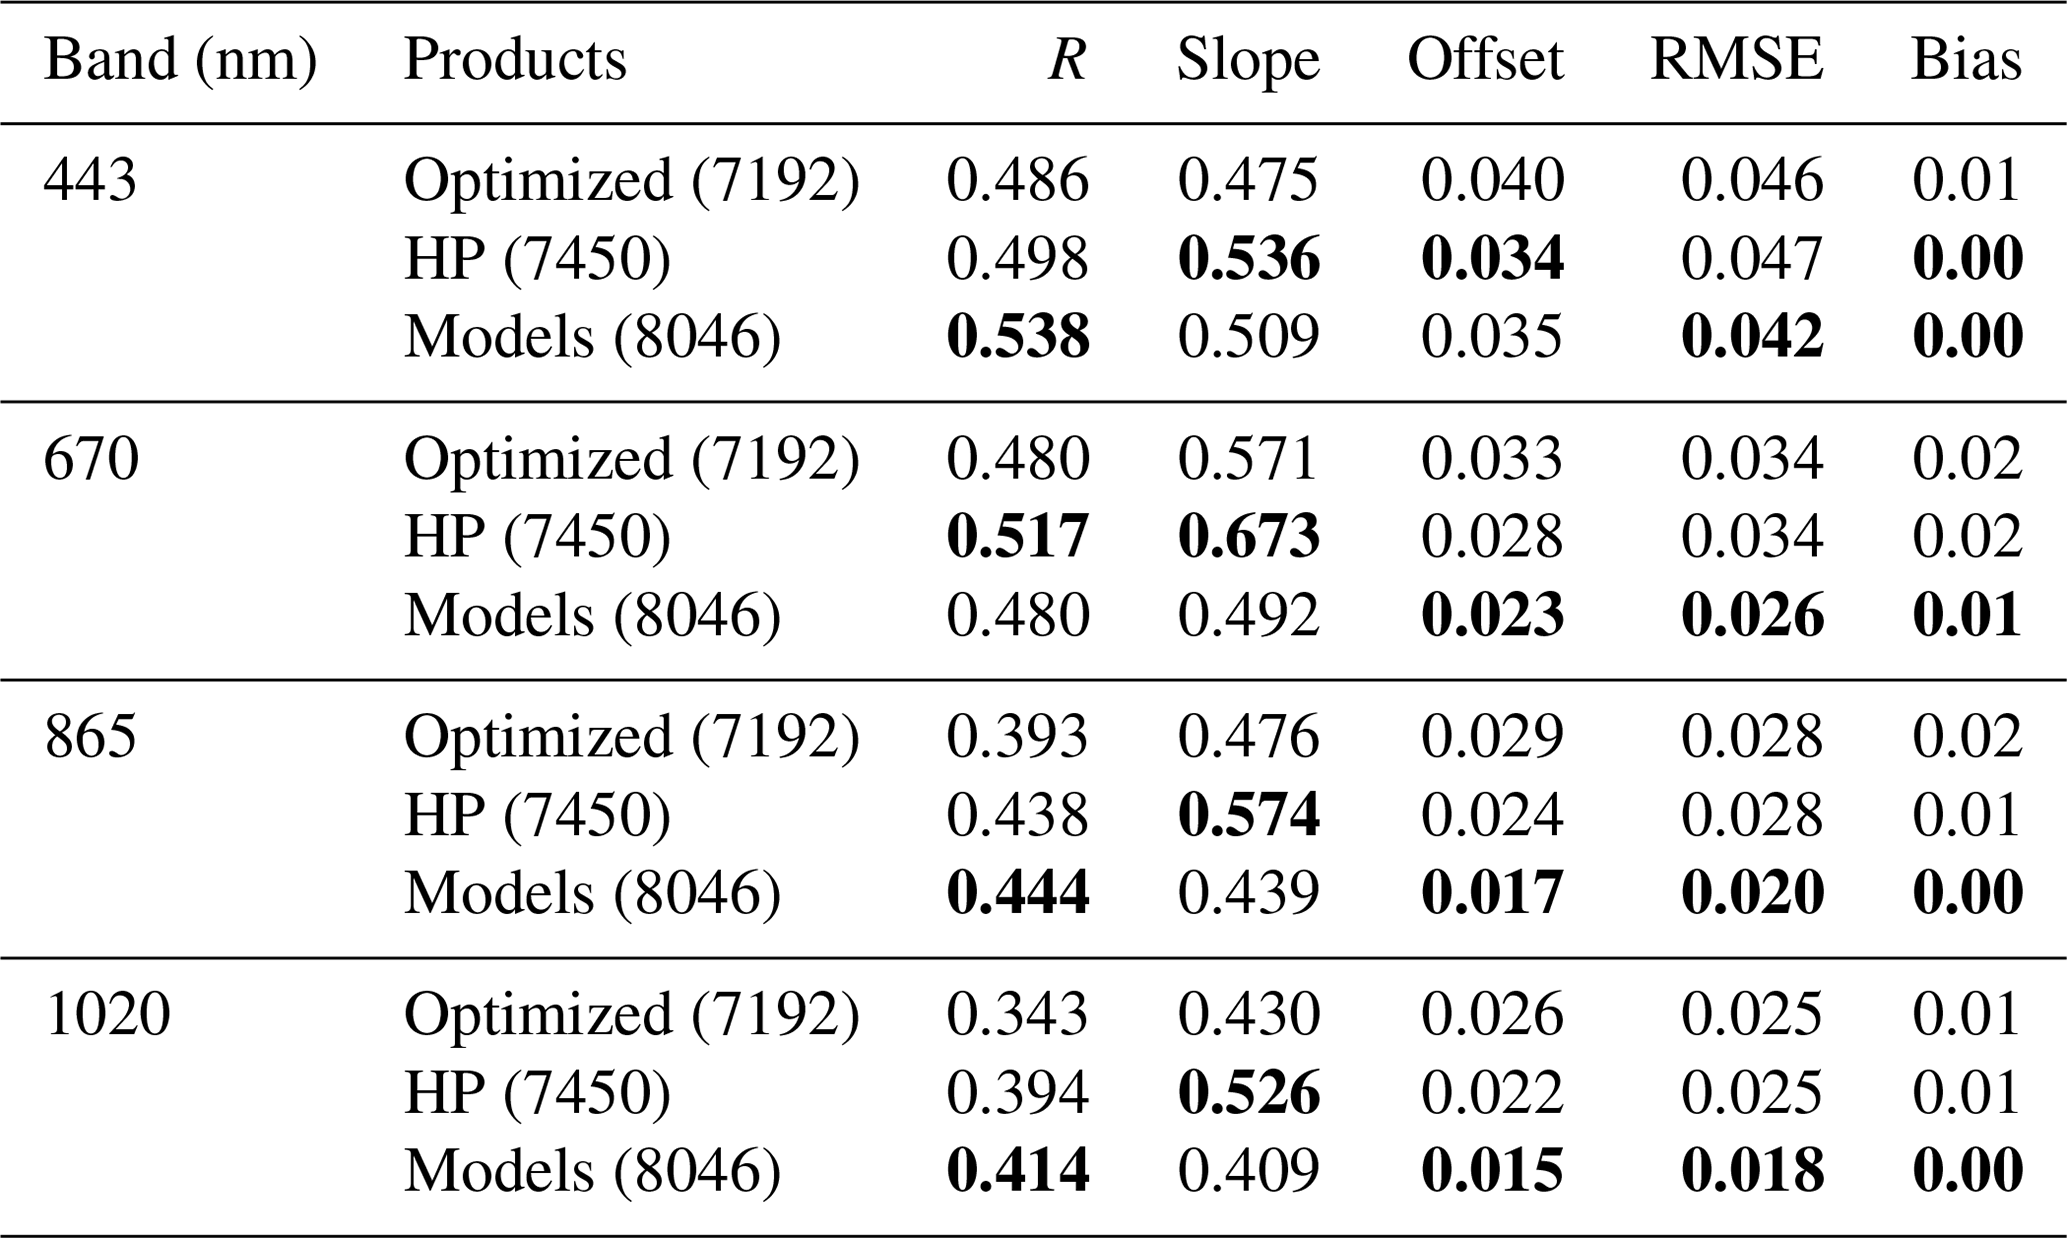
The statistics of PARASOL/GRASP spectral AAOD (443, 670, 865 and 1020 nm) validation versus AERONET AAOD (440, 675, 870 and 1020 nm) are shown in Table 8. The correlation coefficients of AAOD are relatively low (0.4–0.55), which is certainly due to the low absolute value of AAOD, and most cases are less than 30 % of total AOD. GRASP/HP and GRASP/Models AAOD products show the RMSE equal to 0.042–0.018 from 443 to 1020 nm for Models and 0.047–0.025 for HP. The bias is lowest for GRASP/Models AAOD: 0.00 at 440, 870 and 1020 nm and 0.01 at 670. Thus, PARASOL/GRASP AAOD provides rather useful information about global AAOD values; even the uncertainties are rather significant given the generally low magnitudes of AAOD. In contrast with SSA, the attempts to analyze the AAOD accuracy for different AOD levels did not show any consistent improvement in accuracy with increase in abundance.
Table 8Global statistics of PARASOL/GRASP spectral AAOD vs. AERONET AAOD. The best performing at each wavelength of three approaches by each metric is labeled in bold.
3.2 Comparison of results obtained from validation of PARASOL and MODIS aerosol products against AERONET
In order to place the PARASOL/GRASP validation results into perspective, here we compare the PARASOL/GRASP ability to retrieve AOD, AE, AODF and AODC with other satellites. Specifically, these products from MODIS, PARASOL/Operational and PARASOL/GRASP products are validated using the same approach for all of 2008 and validation results were compared. MODIS aerosol products have been extensively evaluated globally by the MODIS team in multiple studies (Gupta et al., 2018; Levy et al., 2010, 2013, 2018; Lyapustin et al., 2018; Sayer et al., 2013, 2014, 2019), and PARASOL/Operational aerosol products have been evaluated in Bréon et al. (2011); the present analyses is performed for reader convenience and consistency of methodology across products. We confirmed that the statistic metrics that we found for MODIS and PARASOL/Operational aerosol product validation in 2008 is similar to these studies. This section is therefore focusing on a comprehensive evaluation of the consistencies and differences between PARASOL and MODIS aerosol products using examples from 1 year. The year 2008 was chosen because it presents generally good statistics of observations, and all types of aerosol are clearly present. The validation figures for the satellite products over land and ocean are presented separately, because over land there are three MODIS products (DT, DB and MAIAC), while only the DT product is provided over ocean. MAIAC products cover some land-containing ocean tiles; however due to limited coverage of these retrievals, we do not consider MAIAC ocean products here. PARASOL/Operational AODF products are provided over land and ocean and total AOD products only over ocean.
Figure 7 shows validation results for AOD at 550 nm for three PARASOL/GRASP products over land with collocated AERONET measurements. Figure 8 shows the validation results for MODIS DT, DB and MAIAC AOD products over land. The products called MAIAC_0.1 and MAIAC_0.01 correspond to the MODIS MAIAC original product aggregated to 0.1∘ and 0.01∘ grid boxes, respectively. In general MODIS products have more matched points than PARASOL products due to MODIS' wider swath and higher spatial resolution of measurements allowing better cloud detection. From low to high values the sequence of obtained global correlation coefficients is 0.870 (DB), 0.874 (MAIAC_0.01), 0.875 (GRASP/Optimized), 0.895 (MAIAC_0.1), 0.898 (DT), 0.908 (GRASP/HP) and 0.924 (GRASP/Models). The GCOS fraction sequence is 28.8 % (GRASP/Optimized), 32.4 % (GRASP/HP), 46.1 % (DT), 48.1 % (MAIAC_0.01), 48.8 % (DB), 52.8 % (MAIAC_0.1) and 53.2 % (GRASP/Models). The high to low RMSE sequence is 0.157 (GRASP/HP), 0.150 (GRASP/Optimized), 0.126 (DB), 0.121 (GRASP/Models), 0.120 (DT) and 0.112 (MAIAC_0.1). The large to small total bias sequence is 0.06 (GRASP/HP), 0.04 (GRASP/Optimized), −0.03 (MAIAC_0.01 and MAIAC_0.1), 0.02 (DT), −0.01 (DB) and 0.00 (GRASP/Models). The low to high sequence of regression slope values is 0.780 (GRASP/Optimized), 0.793 (MAIAC_0.1), 0.794 (MAIAC_0.1), 0.841 (DB), 0.938 (GRASP/HP), 0.988 (DT) and 0.989 (GRASP/Models). The results illustrate that the overall accuracy of these AOD products is generally comparable on a global scale. Note, however, that different products may have different regional strengths and weaknesses (e.g., Sayer et al., 2014), motivating the mapped analysis later. The GRASP/Models AOD yields overall the largest number of the best statistical indicators over land: with the highest correlation (R = 0.924), the highest GCOS fraction (53.2 %), correlation slope (0.989) and the smallest total bias (bias = 0.00). The detailed statistics of PARASOL and MODIS AOD products against referenced collocated AERONET AOD at 550 nm over land and ocean are presented in Table 9.
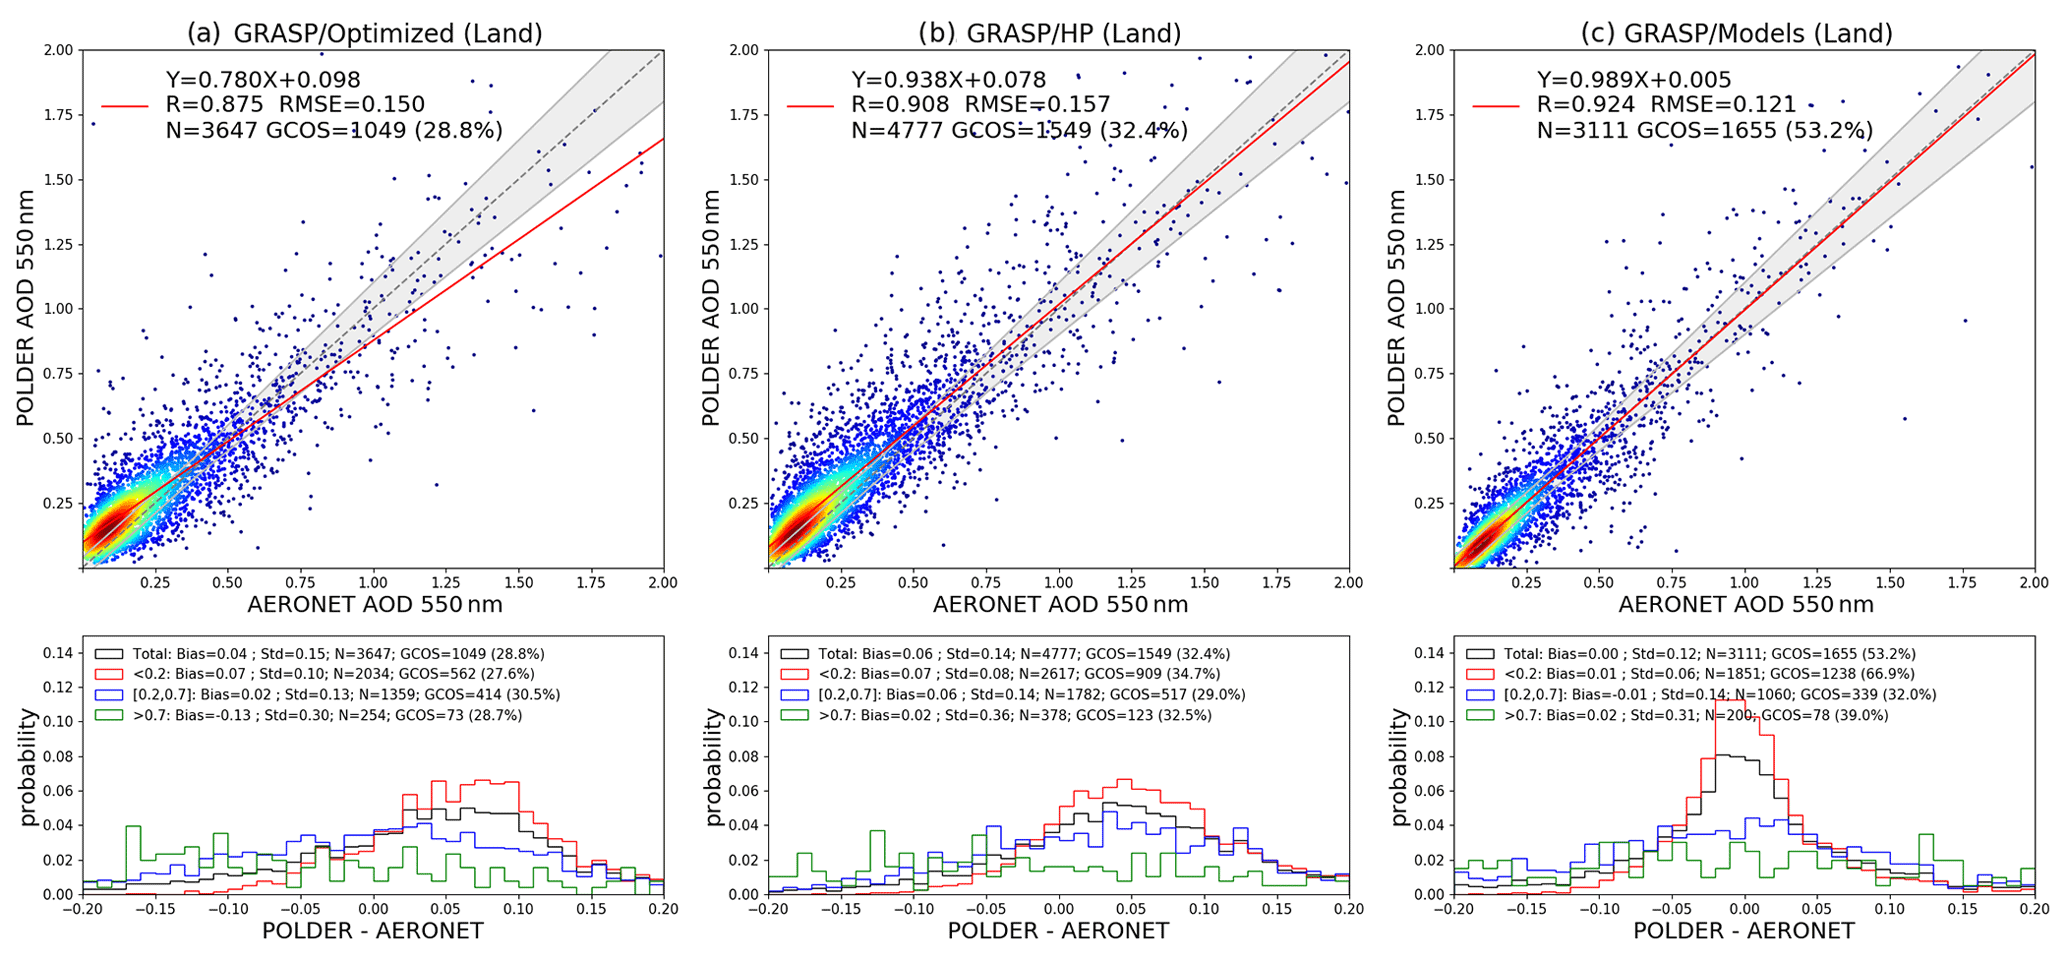
Figure 7Validation of PARASOL/GRASP AOD at 550 nm over land in 2008: (a) GRASP/Optimized, (b) GRASP/HP, (c) GRASP/Models. The gray dashed line and the red solid line are the 1:1 reference line and the linear regression line. The gray envelope indicates GCOS requirement: max (0.04 or 0.1 AOD). The probability density functions of differences (POLDER–AERONET) are present in the lower panels. The black, red, blue and green solid lines indicate all AOD conditions: any AOD, AOD < 0.2, 0.2 ≤ AOD ≤ 0.7 and AOD > 0.7, respectively.

Figure 8Validation of MODIS AOD at 550 nm over land in 2008: (a) DT, (b) DB, (c) MAIAC_0.1, (d) MAIAC_0.01. The gray dashed line and the red solid line are the 1:1 reference line and the linear regression line. The gray envelope indicates GCOS requirement: max (0.04 or 0.1 AOD). The probability density functions of differences (MODIS–AERONET) are present in the lower panels. The black, red, blue and green solid lines indicate all AOD conditions: any AOD, AOD < 0.2, 0.2 ≤ AOD ≤ 0.7 and AOD > 0.7, respectively.
Table 9Statistics of PARASOL and MODIS AOD products against collocated AERONET AOD at 550 nm over land and ocean.
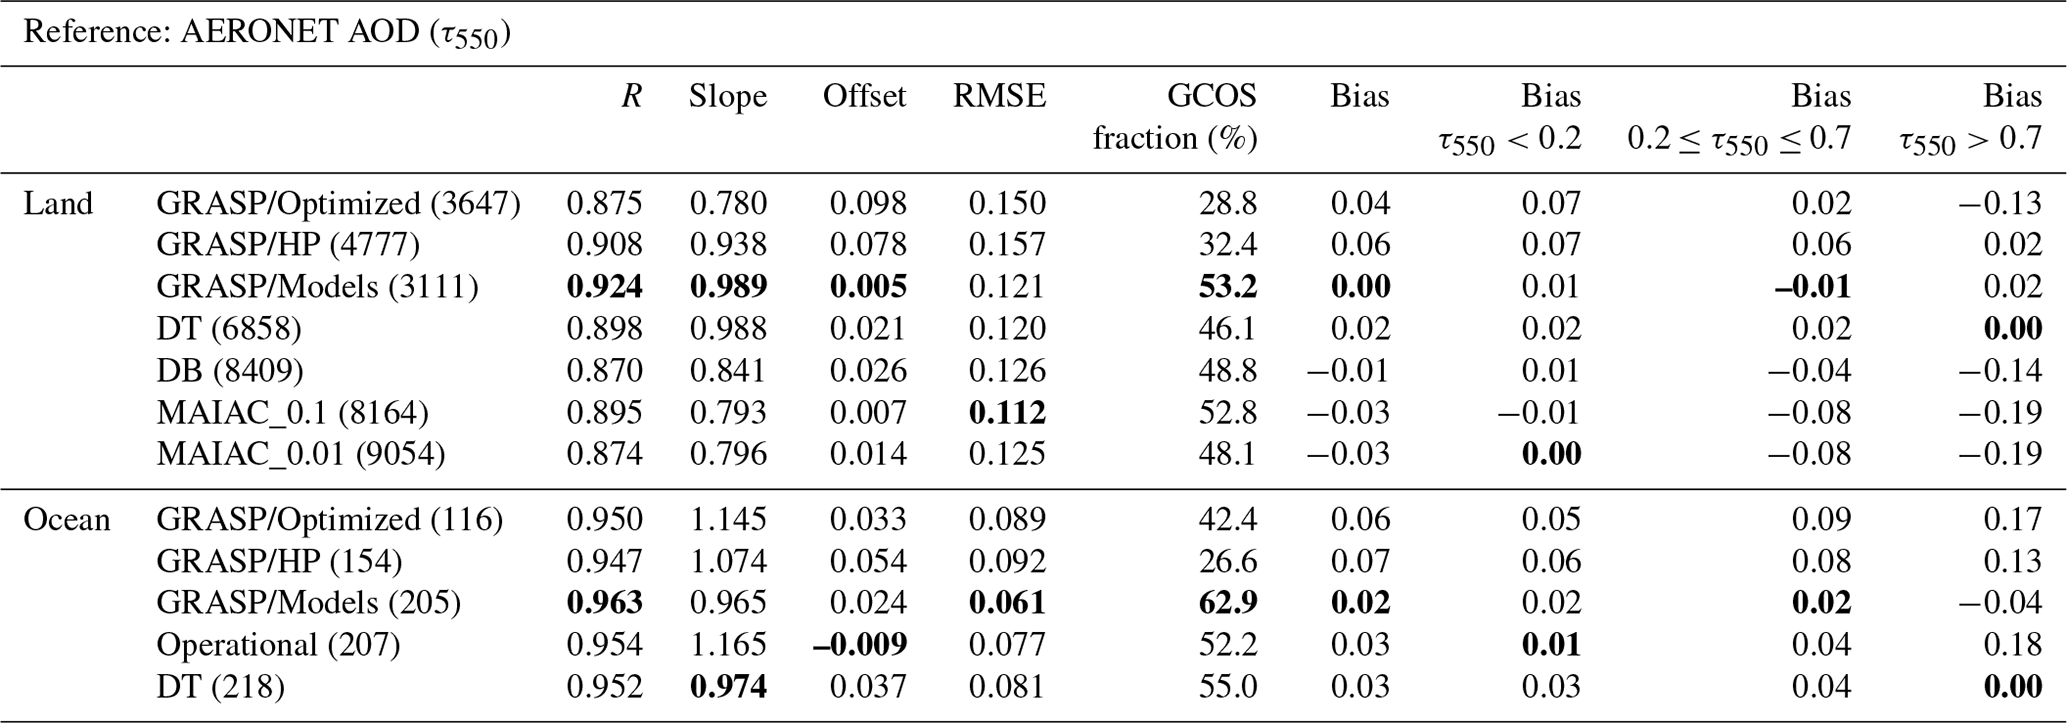
Figure 9 presents validation of PARASOL/GRASP (Optimized, HP and Models), PARASOL/Operational and MODIS/DT AOD products versus collocated AERONET measurements over ocean in 2008. The detailed statistic metrics are presented in Table 9. The matching methodology is the same as described in Sect. 2.4. The total matched points in 2008 range from minimum GRASP/Optimized 116 to maximum MODIS/DT 218. In general, all AOD products show high correlation over ocean, of which GRASP/Models has the highest R (0.963), following by Operational (0.954), DT (0.952), GRASP/Optimized (0.950) and GRASP/HP (0.947). The high to low sequence of RMSE is 0.092 (GRASP/HP), 0.089 (GRASP/Optimized), 0.081 (DT), 0.077 (Operational) and 0.061 (GRASP/Models). The slopes are quite similar: 1.165 (Operational), 1.145 (GRASP/Optimized), 1.074 (GRASP/HP), 0.965 (GRASP/Models) and 0.974 (DT). Overall, GRASP/Models shows slightly better bias (0.02) and GCOS fraction (62.9 %), following by DT (bias = 0.03, GCOS fraction = 55.0 %), Operational (bias = 0.03, GCOS fraction = 52.2 %), GRASP/Optimized (bias = 0.06, GCOS fraction = 42.2 %) and GRASP/HP (bias = 0.07, GCOS fraction = 26.6 %). Altogether, GRASP/Models, PARASOL/Operational and DT AOD yield quite similar performance over ocean with better statistics than GRASP/Optimized and GRASP/HP AODs that correlate well with AERONET measurements but present a significant positive bias (0.06–0.07).
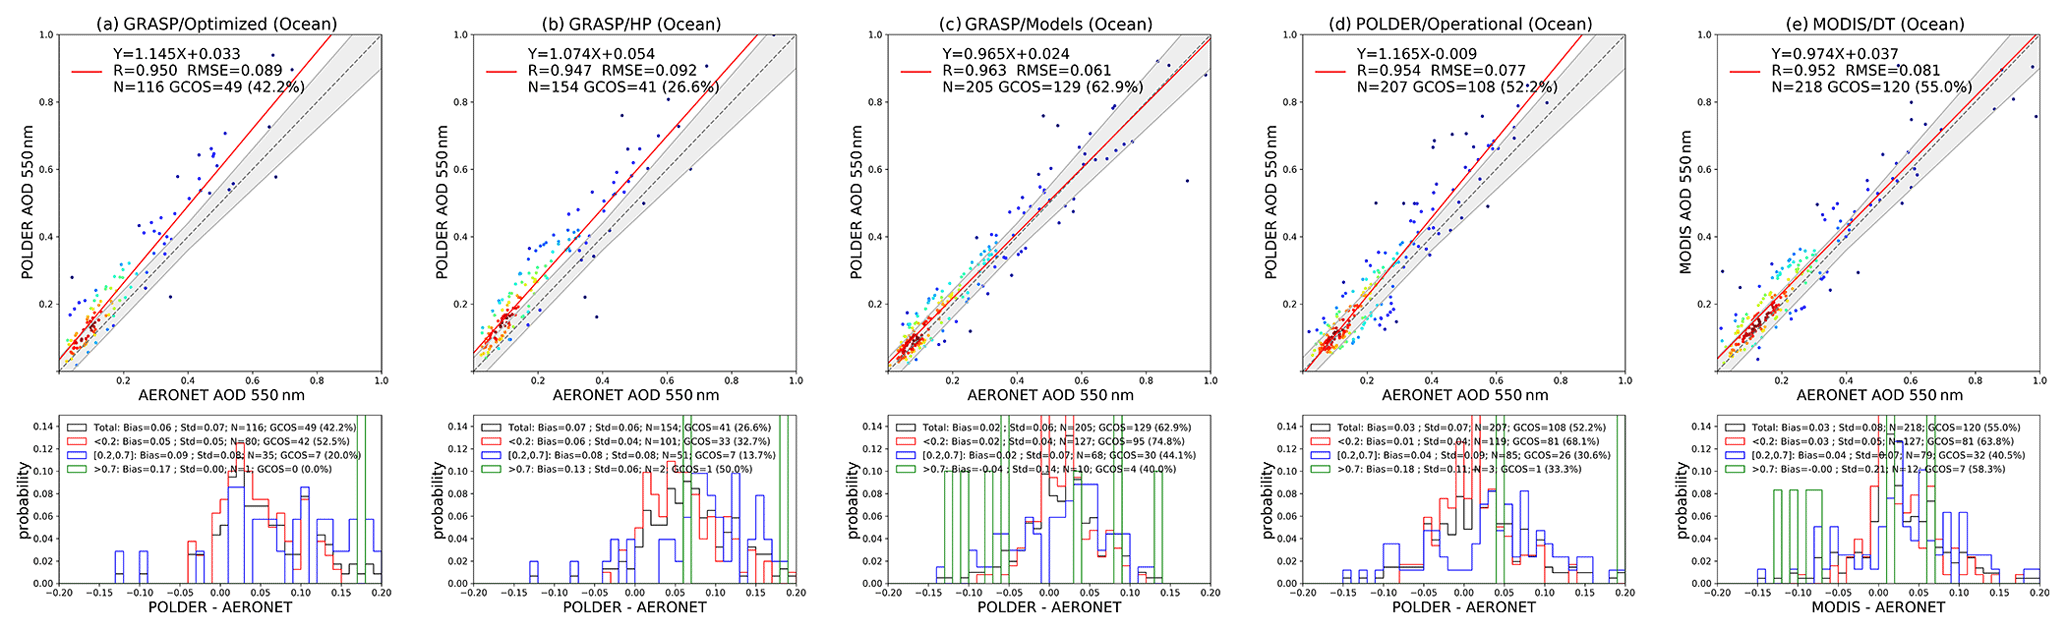
Figure 9Validation of PARASOL/GRASP, PARASOL/Operational and MODIS/DT AOD at 550 nm over ocean in 2008. (a) GRASP/Optimized; (b) GRASP/HP; (c) GRASP/Models; (d) Operational; (e) DT. The gray dashed line and the red solid line are the 1:1 reference line and the linear regression line. The gray envelope indicates GCOS requirement: max (0.04 or 0.1 AOD). The probability density functions of differences (satellite–AERONET) are present in the lower panel. The black, red, blue and green solid lines indicate all AOD conditions: any AOD, AOD < 0.2, 0.2 ≤ AOD ≤ 0.7 and AOD > 0.7, respectively.
In order to obtain more information about the quality of the retrieval products over different land surfaces, the statistics of satellite validation against AERONET were also analyzed separately for different land covers. Table 10 shows the statistic metrics for land surfaces with different normalized difference vegetation index (NDVI) values. The statistics are presented for several categories: bare soil/desert surfaces (NDVI < 0.2), mixture of bare soil and vegetated surfaces (0.2 ≤ NDVI < 0.4) and surfaces covered different types of vegetation (0.4 ≤ NDVI < 0.6 and NDVI ≥ 0.6). The global NDVI dataset is adopted from GRASP/Models L3 annual mean products for the year 2008 (Fig. 10). The statistic metrics in Table 10 show that, in general, all products show better performance over surface type with 0.2 ≤ NDVI < 0.6 than bright, bare surfaces (NDVI < 0.2) and somewhat better than for dense vegetation surface (NDVI ≥ 0.6). Overall the AOD product of GRASP/Models seems to show the best correlation with AERONET, with the highest R over three of four surface classes. Over bright surfaces (NDVI < 0.2), GRASP/HP has the highest R (0.915), but also rather high bias of 0.06. The GRASP/Models AOD also has zero bias for three surface classes except the dense vegetation surface (NDVI ≥ 0.6), where GRASP/Models AOD has total bias of 0.03, higher than that in any MODIS AODs.
Table 10Statistics of PARASOL and MODIS AOD products against collocated AERONET AOD at 550 nm classified by NDVI. In each individual NDVI level, the best performing metric is indicated in bold. The number of matched pairs is included in brackets.
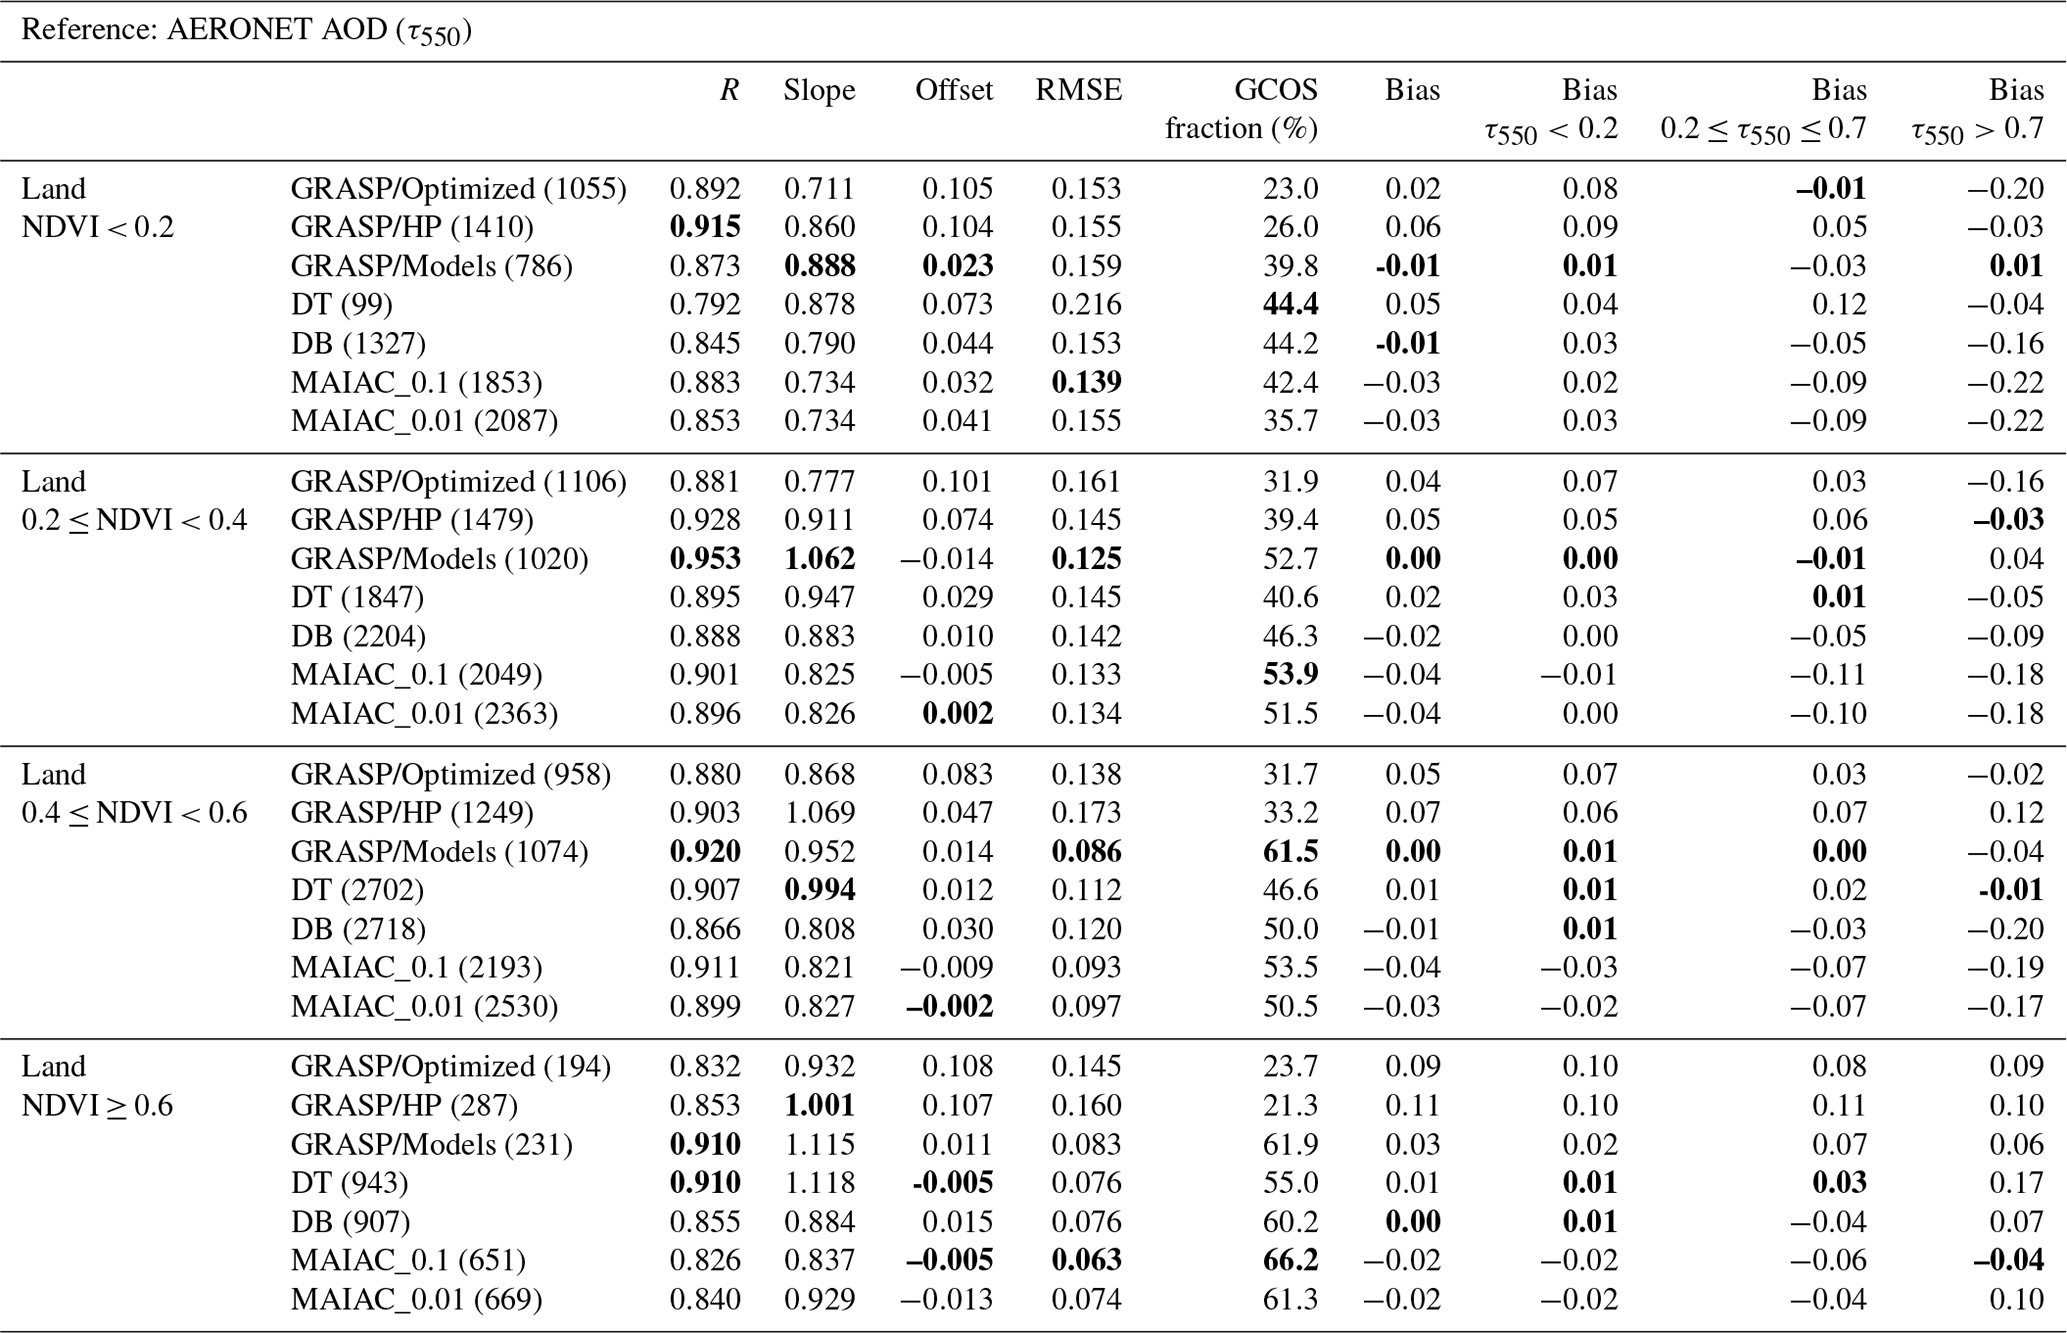
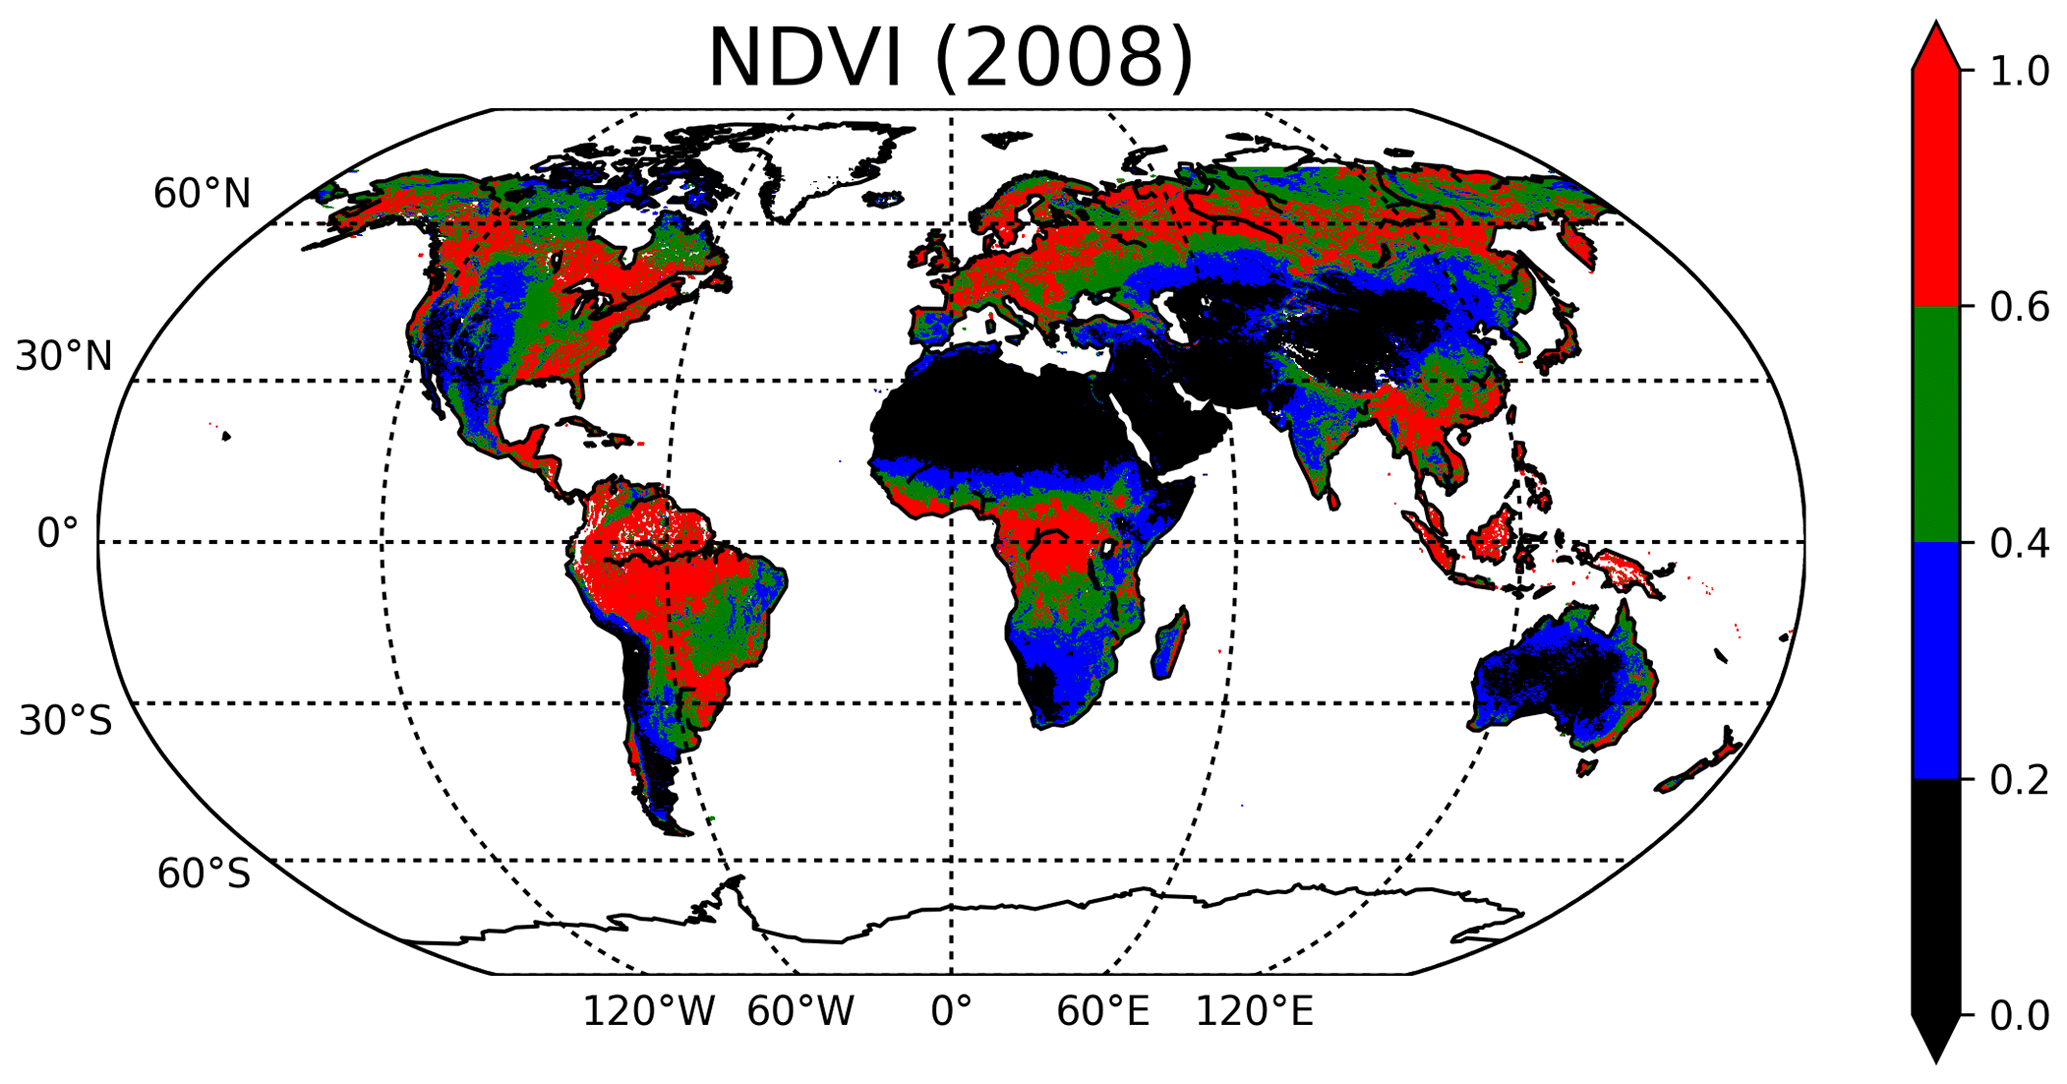
Figure 10Spatial distribution of annual mean NDVI for 2008 from GRASP/Models L3 products.

Figure 11Validation of PARASOL/GRASP (a GRASP/Optimized, b GRASP/HP and c GRASP/Models) and MODIS (d DT and e DB) AE over land in 2008. The gray dashed line and the red solid line are the 1:1 reference line and the linear regression line. The probability density functions of differences (satellite–AERONET) are present in the lower panels.
Figure 11 shows the validation of AEs for PARASOL/GRASP and MODIS DT and DB products over land versus collocated AERONET measurements. The MODIS AE for DT and DB products were calculated based on 470 and 660 nm that are reported in both products; an equivalent for AERONET was calculated using AOD interpolated to 470 and 660 nm. PARASOL/GRASP products contain AOD at 440 and 870 nm; therefore AE (440∕870) was directly used for validation of PARASOL/GRASP results. MAIAC AE was not included because MAIAC reports AOD at two rather close wavelengths (470 and 550 nm), and calculation of AE using these such close channels could produce substantial uncertainties in AE. The threshold of satellite AOD (550 nm) > 0.2 was used in validation of AE over land and ocean. In general, PARASOL/GRASP (Optimized, HP and Models) AE agrees notably better with AERONET than MODIS (DT and DB), which is likely caused by the lower information content in regards to aerosol size in mono-viewing MODIS observations. In addition, both DT and DB algorithms rely on climatology for the aerosol model selection; i.e., AE is rather predetermined than retrieved to some extent. For example, although AOD over land is reported by DT at 470 and 660 nm, the spectral dependence of the DT land retrieval is mostly imposed by assumed aerosol models. The DT team makes a specific point of not reporting AE over land for that reason, and at best the spectral dependence might allow a binary inference of either fine-mode or coarse-mode-dominated particles but not a quantitative measure of the true spectral dependence. The DT over ocean algorithm has greater flexibility in its mixing of models and does return a quantitative AE. The weaker performance of the GRASP/Models approach compared to GRASP/HP and GRASP/Optimized is caused by the limitation of maximum and minimum AE values allowed by the mixture of aerosol components used, even though the GRASP/Models approach allows mixing of different components freely with no location-specific constraints. As a result, GRASP/Models tends to overestimate AE for large particles (low AE values) and underestimate AE for small particles (high AE values). Hence, GRASP/Models AE products are less appealing than those from GRASP/Optimized and GRASP/HP in terms of evaluation metrics. GRASP/HP tends to provide the most reliable AE products over land.
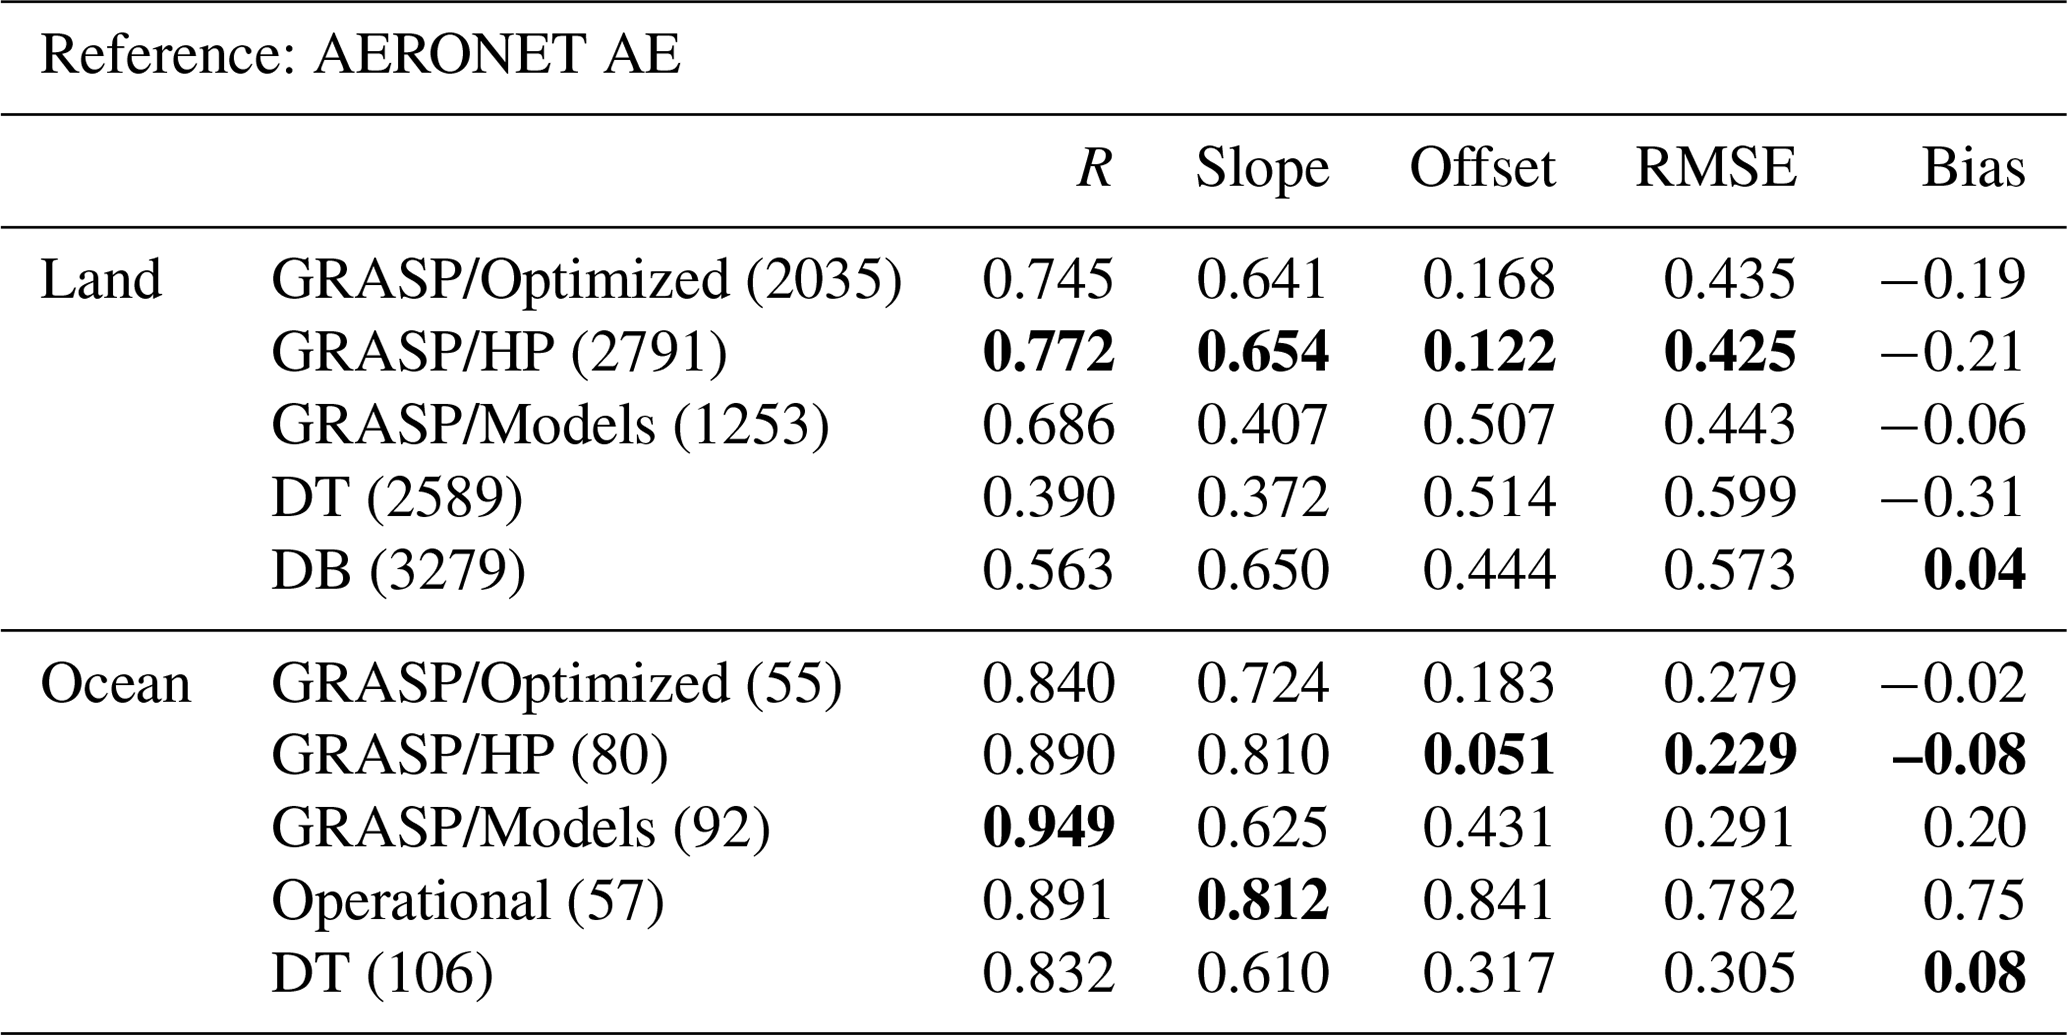
Figure 12 presents the validation of AE over ocean from PARASOL/GRASP, PARASOL/Operational and MODIS/DT products against AERONET measurements. PARASOL/Operational AE was calculated based on 670 and 870 nm that are reported in the product, and AE (670∕870) of AERONET was calculated using AOD interpolated to 670 and 870 nm. Although there are not many available points, the satellite-derived AE values over ocean are much better than those over land. GRASP/Models shows R (0.949) higher than Operational (0.891), GRASP/HP (0.890), GRASP/Optimized (0.840) and DT (0.832). GRASP/Models and MODIS DT AEs show an overestimation for large particles. Operational AE tends to overestimate for both large and small particles. At the same time, GRASP/HP AE correlation has the slope closer to 1:1 line with AERONET AE than other products, with the best linear fitting slope (0.810) and intercept (0.051). The statistic metrics of AE validation over land and ocean are listed in Table 11.
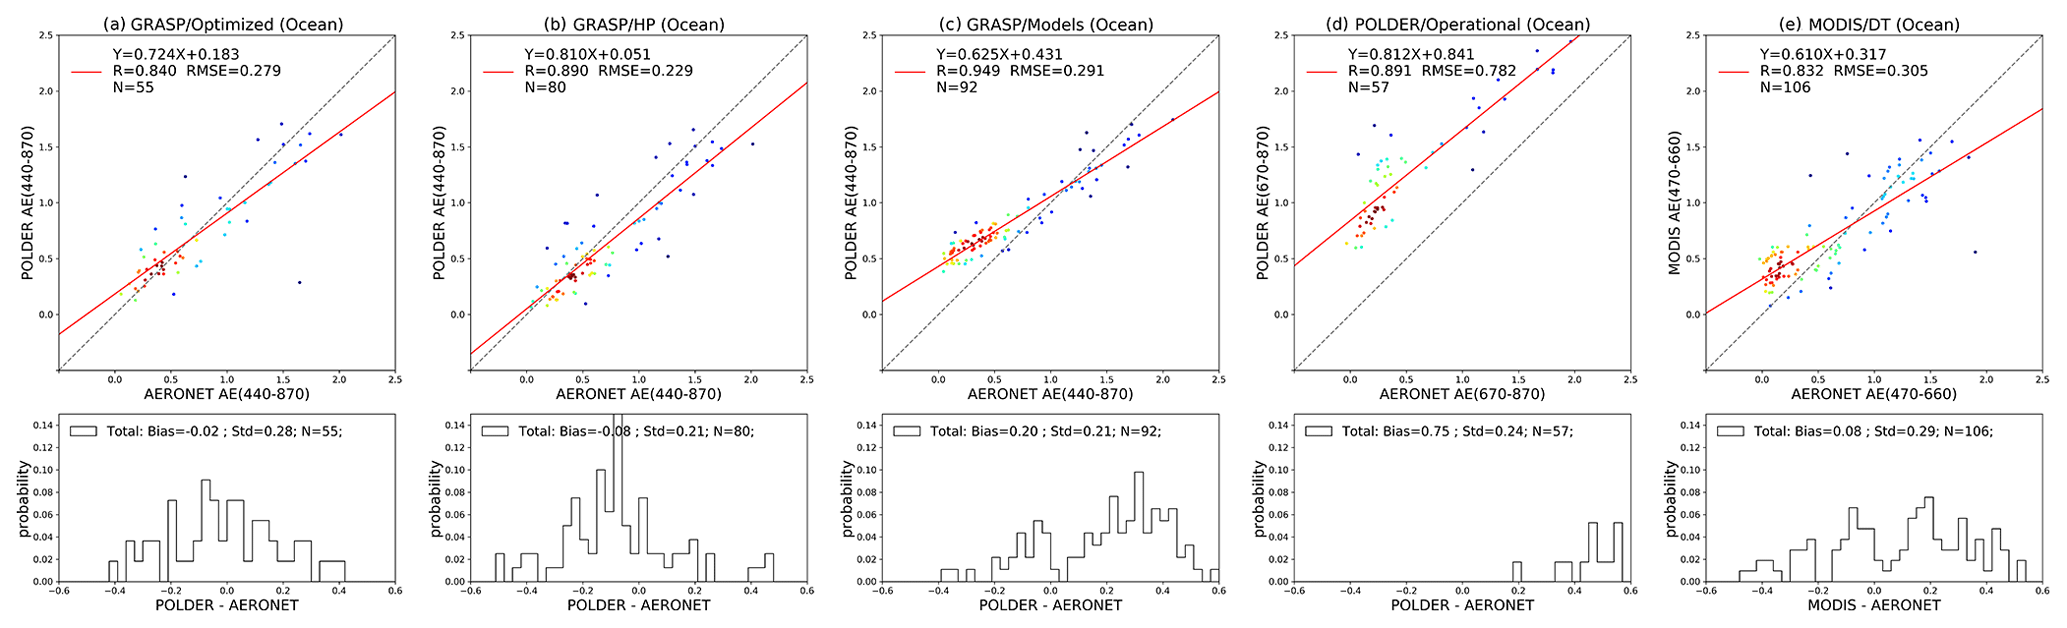
Figure 12Validation of PARASOL/GRASP (a GRASP/Optimized, b GRASP/HP and c GRASP/Models), (d) PARASOL/Operational and (e) MODIS/DT AE over ocean in 2008. The gray dashed line and the red solid line are the 1:1 reference line and the linear regression line. The probability density functions of differences (satellite–AERONET) are present in the lower panels.
Table 11Statistics of PARASOL and MODIS AE products against collocated AERONET AE over land and ocean, with a threshold of satellite AOD (550 nm) > 0.2.
AODF is often used to estimate anthropogenic aerosol climate effects (Bellouin et al., 2005) and surface air quality (e.g., PM2.5) (Zhang and Li, 2015). MODIS started to report the fine-mode weighting parameter (η) in the products from the second-generation DT operational algorithm (Levy et al., 2007b), though η is weighted for reflectance not for AOD. Consequently η over land is a diagnostic that has little physical meaning and the resulting AODF and AODC do not have physical meaning and generally are not recommended to be used. Therefore, it is not considered in the analysis. However, over ocean, based on single-scattering approximation, η is also weighted for AOD (Remer et al., 2005). Therefore, MODIS fine- and coarse-mode AODs at 550 nm over ocean are derived according to the equations below:
Figure 13 shows the validation of AODF at 550 nm for PARASOL/GRASP and PARASOL/Operational AODF products over land against AERONET AODF products from the SDA algorithm. It is noticeable that the AODF products over land are only available from PARASOL MAP measurements. The results in Fig. 13 indicate the PARASOL/GRASP and PARASOL/Operational AODF products are in good agreement with AERONET SDA products, for example, R > 0.86. The GCOS fraction of AODF for PARASOL/GRASP and PARASOL/Operational products is at least 50 %. GRASP/HP AODF shows the best correlation among all four AODF products over land, with rather similar performance for GRASP/Optimized AODF.
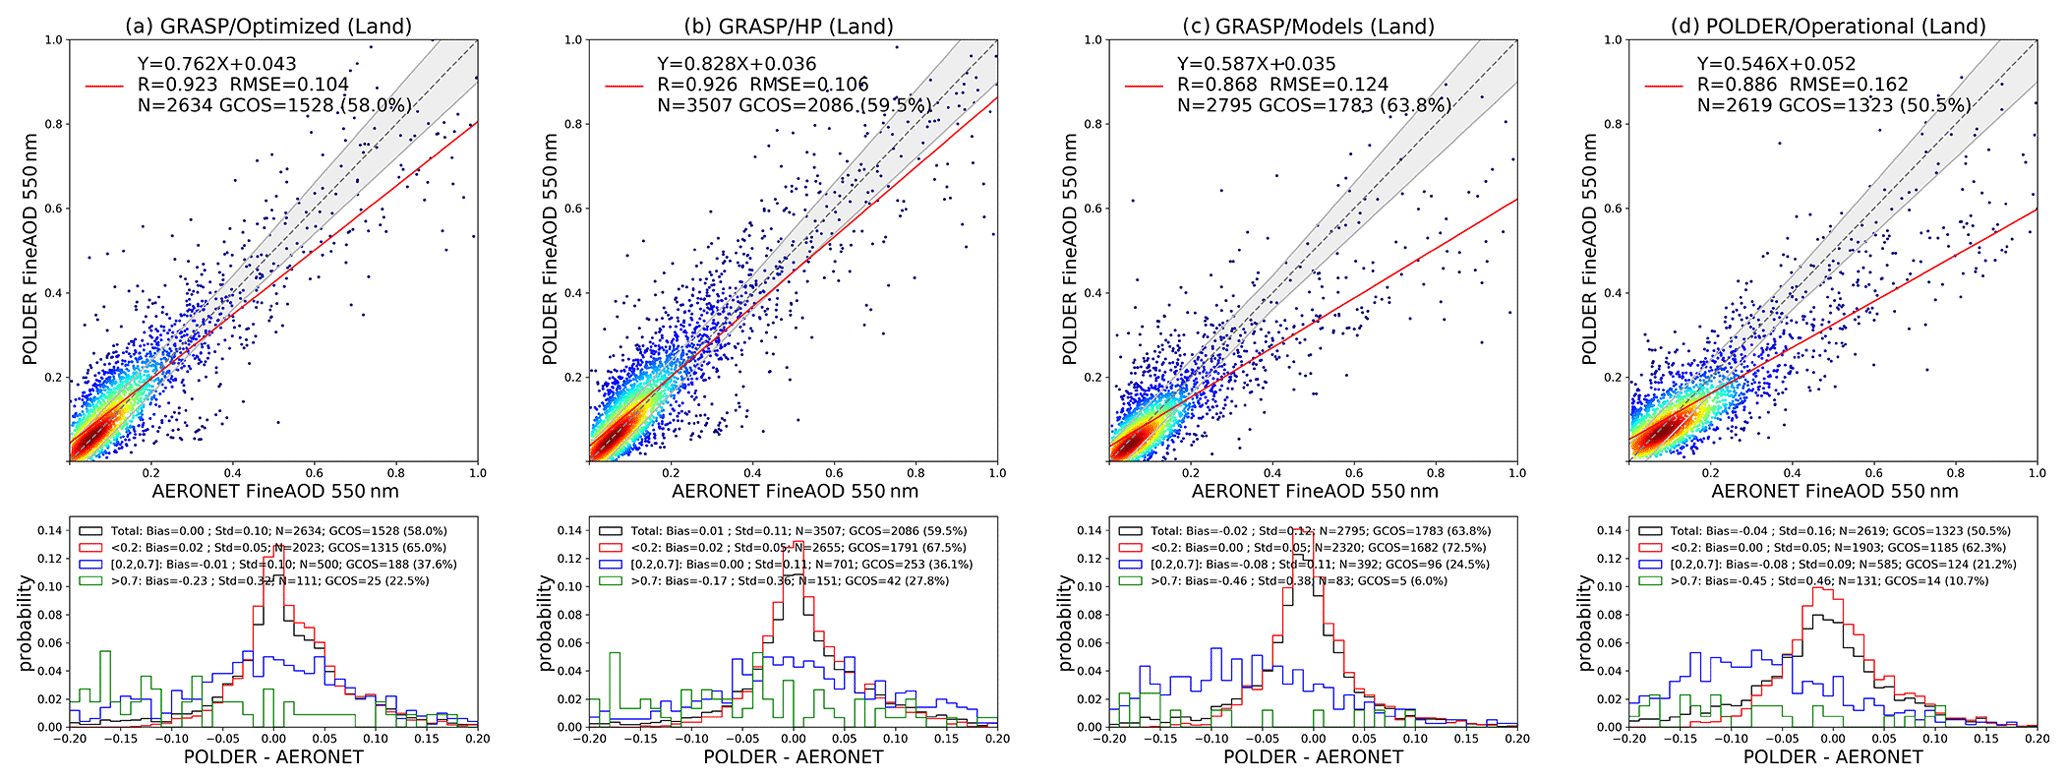
Figure 13Validation of PARASOL/GRASP (a GRASP/Optimized, b GRASP/HP and c GRASP/Models) and (d) PARASOL/Operational fine-mode AOD at 550 nm over land in 2008. The gray envelope indicates GCOS requirement applied for AODF: max (0.04 or 0.1 AODF). The probability density functions of differences (POLDER–AERONET) are present in the lower panels. The black, red, blue and green solid lines indicate all AODF conditions: any AODF, AODF < 0.2, 0.2 ≤ AODF ≤ 0.7 and AODF > 0.7, respectively.
The AODF validation over ocean is shown in Fig. 14, and statistical metrics over land and ocean are presented in Table 12. GRASP/Optimized and GRASP/HP AODF show generally consistent performance over ocean and over land, with correlation R around 0.9, while the bias for GRASP/Optimized and GRASP/HP AODF is higher over ocean than over land. At the same time, GRASP/Models AODF shows significant improvement over ocean; for example, the fitting line is much closer to 1:1 (dotted line), and the RMSE decreased dramatically. PARASOL/Operational AODF shows a slight decrease in R from land (R = 0.886) to ocean (R = 0.780), also reported in Bréon et al. (2011), while the fitting line, RMSE and bias show improvement from land to ocean. This is likely due to higher information content about aerosols in satellite observations over dark ocean surfaces compared to brighter land surfaces.
Table 12Statistics of PARASOL and MODIS AODF products against collocated AERONET AODF over land and ocean.
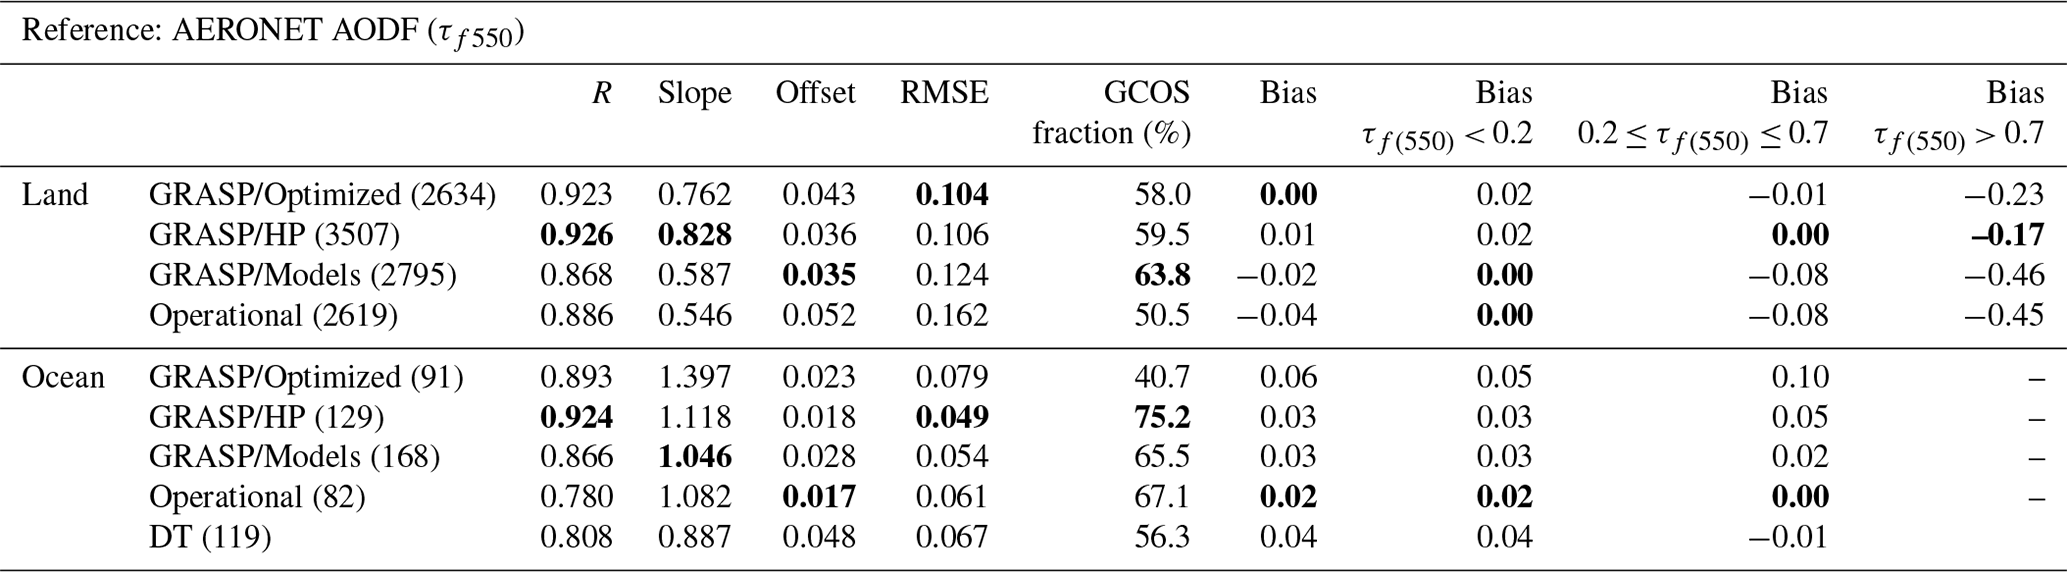
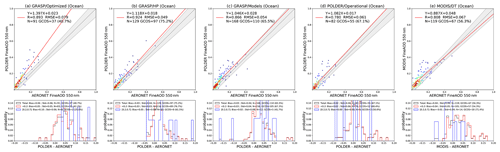
Figure 14Validation of PARASOL/GRASP (a GRASP/Optimized, b GRASP/HP and c GRASP/Models), (d) PARASOL/Operational and (e) MODIS/DT fine-mode AOD at 550 nm over ocean in 2008. The gray envelope indicates GCOS requirement applied for AODF: max (0.04 or 0.1 AODF). The probability density functions of differences (satellite–AERONET) are present in the lower panels. The black, red, blue and green solid lines indicate all AODF conditions: any AODF, AODF < 0.2, 0.2 ≤ AODF ≤ 0.7 and AODF > 0.7, respectively.
The validation of AODC over land and ocean is shown in Figs. 15 and 16, respectively. Even though AODC products over land are only provided for PARASOL/GRASP, for completeness we present this over land for the year 2008 in Fig. 15. Similarly to the results from the total PARASOL/GRASP archive, AODC over ocean is more accurate than over land. The overall best results of AODC are provided by GRASP/HP with the highest R (0.771) and the best linear fitting (slope is reaching 1 and intercept is close to 0) over land. Yet, the bias of GRASP/HP AODC is 0.05, which is higher than GRASP/Models (0.01) and GRASP/Optimized (0.03), which result in a higher GCOS fraction for GRASP/Models AODC (63.7 %) than GRASP/HP (45.8 %) and GRASP/Optimized (45.6 %). At the same time, as mentioned above, over dark ocean the sensitivity of the observed signal to aerosol is stronger, allowing for retrieval of particle size information that is more challenging over land. The GRASP/Models AODC shows the best R (0.966) and RMSE (0.040) while MODIS/DT AODC has the smallest bias (0.00) against AERONET over ocean, followed by Operational (0.01), GRASP/Models (−0.01), GRASP/Optimized (0.03) and GRASP/HP (0.05). Although AODC is not included in the PARASOL/Operational product list, over ocean we subtract AODF from total AOD to obtain Operational AODC, which shows a rather good agreement with AERONET (R = 0.936, slope = 0.971, RMSE = 0.045, bias = 0.01). However, over land, only AODF is provided in the PARASOL/Operational product.
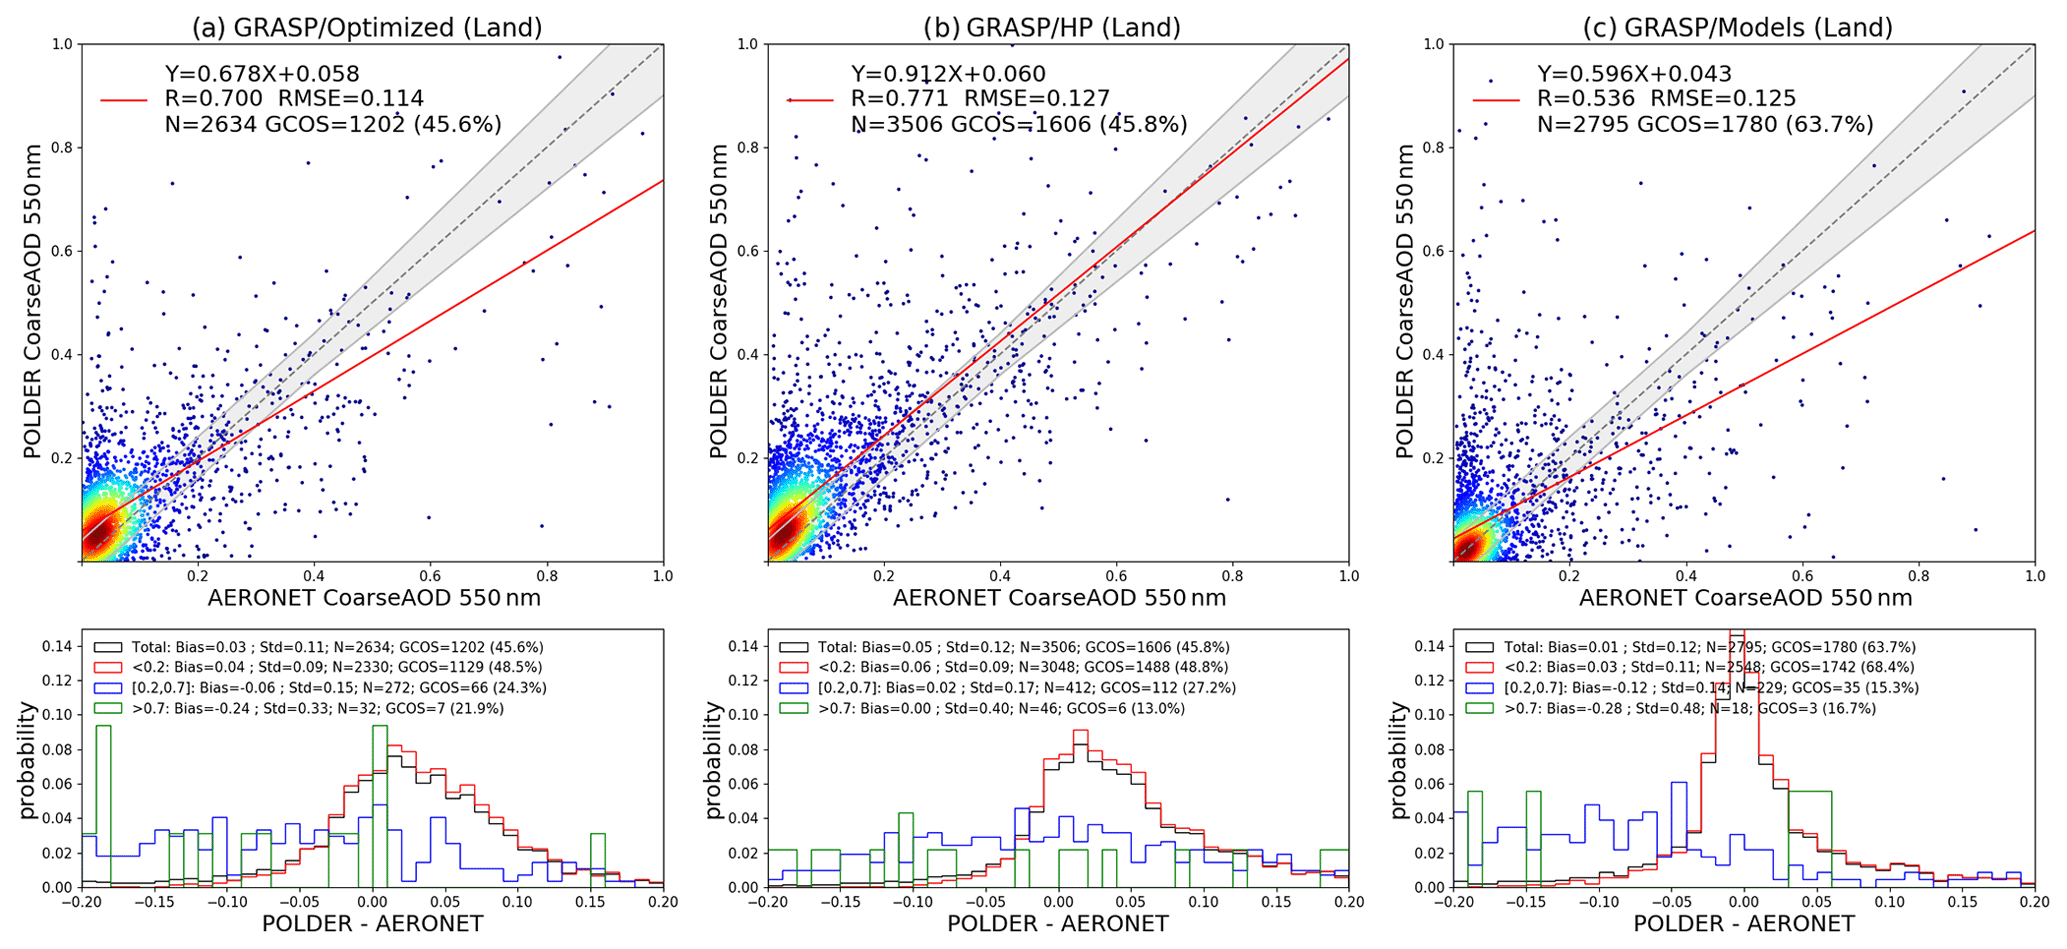
Figure 15Validation of PARASOL/GRASP (a GRASP/Optimized, b GRASP/HP and c GRASP/Models) coarse-mode AOD at 550 nm over land in 2008. The gray envelope indicates GCOS requirement applied for AODC: max (0.04 or 0.1 AODC). The probability density functions of differences (POLDER–AERONET) are present in the lower panel. The black, red, blue and green solid lines indicate all AODC conditions: any AODC, AODC < 0.2, 0.2 ≤ AODC ≤ 0.7 and AODC > 0.7, respectively.
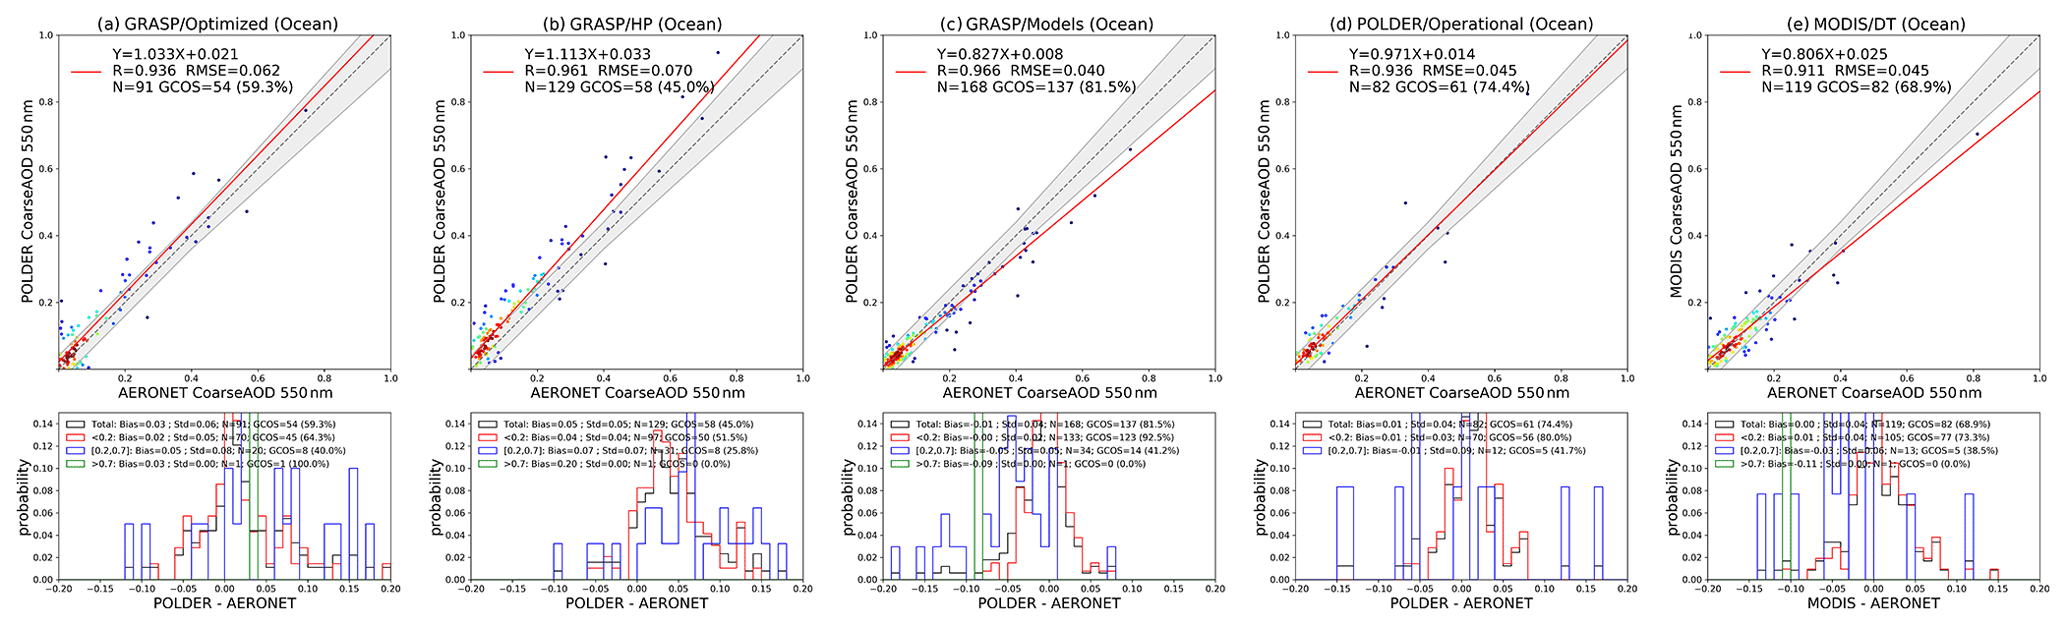
Figure 16Validation of PARASOL/GRASP (a GRASP/Optimized, b GRASP/HP and c GRASP/Models), (d) PARASOL/Operational and (e) MODIS/DT coarse-mode AOD at 550 nm over ocean in 2008. The gray envelope indicates GCOS requirement applied for AODC: max (0.04 or 0.1 AODC). The probability density functions of differences (POLDER–AERONET) are present in the lower panels. The black, red, blue and green solid lines indicate all AODC conditions: any AODC, AODC < 0.2, 0.2 ≤ AODC ≤ 0.7 and AODC > 0.7, respectively.
The statistics in comparison of each single product vary due to the differences in product coverage: coverage of MODIS Aqua is wider than PARASOL; at the same time, the products have different limitations and availability:
-
MODIS/DT has limited products over bright land surfaces, and AODF and AODC are only available over ocean;
-
MODIS/DB and MAIAC AOD products are only over land and do not include AODF and AODC;
-
PARASOL/Operational over land provides only AODF;
-
quality screening is different (even between PARASOL/GRASP products).
Therefore, the approaches chosen in this paper for considering all above factors could have some effects on the results and their interpretation. At the same time, the correlations with AERONET obtained in these studies for known products including MODIS DT, DB and MAIAC and PARASOL/Operational in general agree with the results of previously mentioned studies.
3.3 Evaluation of PARASOL and MODIS validation results over different AERONET sites
In this section, we compare the validation metrics of PARASOL/GRASP and MODIS aerosol products over spatially distributed AERONET sites. PARASOL/Operational AOD products are provided over ocean only and hence are not included in this section. The AOD validation was conducted over all AERONET sites that had available data in 2008. At the same time and to increase statistical robustness only sites with at least 10 matchup points were included in the analysis. However, the different products can also have a different number of matchup points over different AERONET sites due to various factors (as discussed previously). Therefore, to evaluate the validation performance of different products, the percentage (%) of the cases when the product of each algorithm showed the best statistic metrics, observed among all the products (e.g., the highest R and GCOS fraction and the lowest RMSE and bias), was used as an indicator for the performance evaluation.
Figure 17 shows the percentage score for each algorithm at AERONET sites for statistical metrics R, RMSE, bias and GCOS fraction, respectively. The detailed statistics for the performance of each AOD product are shown in Fig. 18 (only the first ranking statistics over each site are present in the maps.). All PARASOL/GRASP products have fewer sites with at least 10 matchup points than MODIS AOD products. There are 102, 124 and 95 sites having sufficient matchup points for GRASP/Optimized, GRASP/HP and GRASP/Models, respectively, lower than DT (153), DB (172), MAIAC_0.1 (169) and MAIAC_0.01 (172) by 20 %–45 %. Regarding the correlation coefficient R, GRASP/Models, DT and MAIAC_0.1 are the three algorithms showing higher scores for 37.9 %, 28.1 % and 24.9 % sites where respective products were provided. As shown in Fig. 18a, these three algorithms show good performance worldwide, e.g., North America, Europe and East Asia. There are no MODIS AOD products showing the best R over Australia (only four sites are available there). The three GRASP algorithms show high percentage for products over dust and biomass burning regions, e.g., South America, southern Africa and central Africa, central Australia. At the same time, the GRASP/Optimized and GRASP/HP AOD products performed less well over North America.
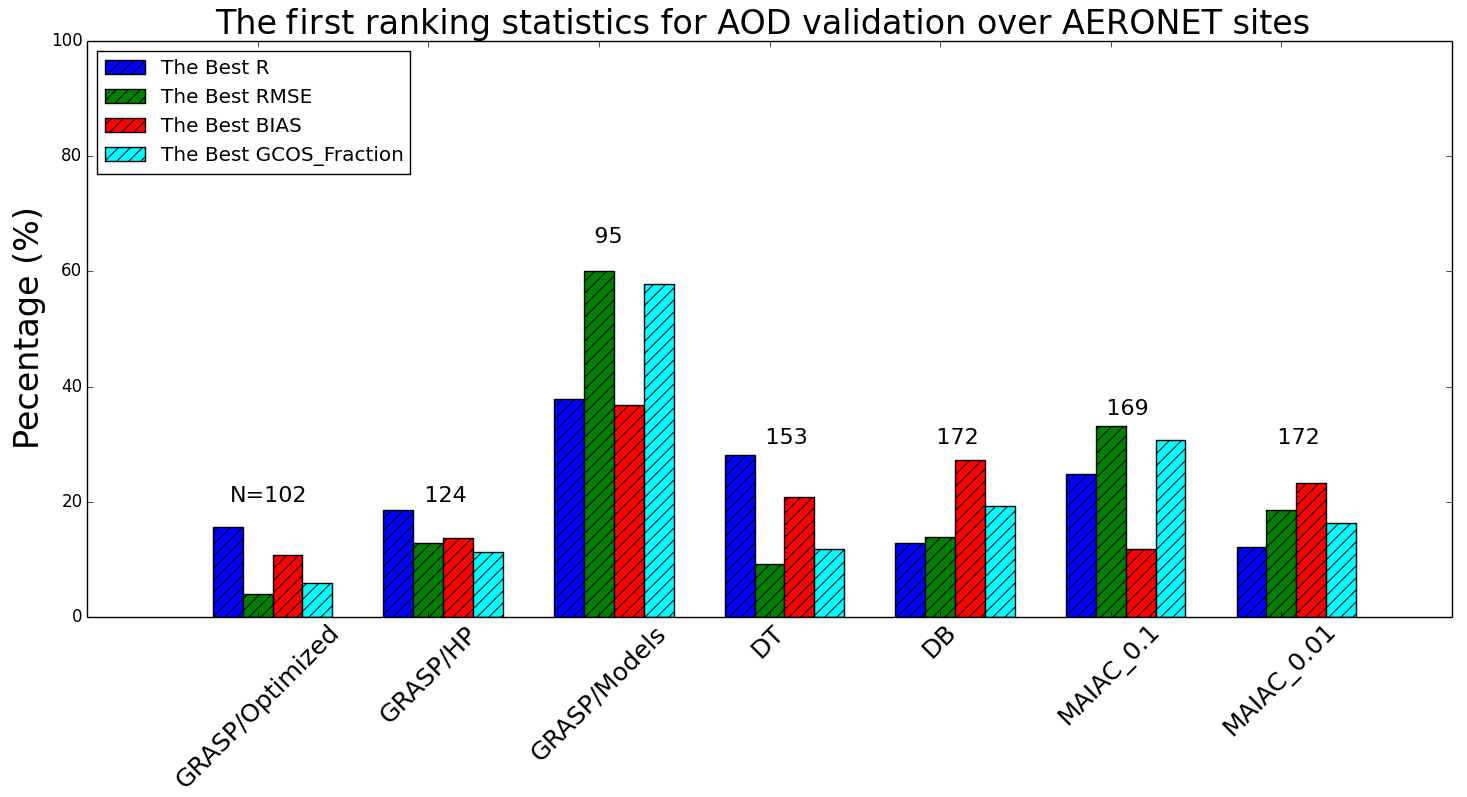
Figure 17Percentage of the AERONET sites where each product shows the best statistical metric (R, RMSE, bias and GCOS fraction) between seven PARASOL/GRASP and MODIS AOD products. The number on top of each product is the number of sites where this product has sufficient matchup points for the comparison.
In terms of the percentage of sites with the best RMSE, GRASP/Models and MAIAC_0.1 are the top two algorithms showing the best RMSE results over 60.0 % and 33.1 % of AERONET sites with available GRASP/Models and MAIAC_0.1 retrievals. Thus, overall, all these results indicate that GRASP/Models presents a strong ability to provide AOD that agrees well with AERONET measurements. Both GRASP/Models and MAIAC_0.1 show the best RMSE over Europe and North America (Fig. 18b), which also have the highest density of AERONET sites. GRASP/Models shows the best bias over 36.8 % sites, followed by DB (27.3 %) and MAIAC_0.01 (23.3 %). For the best GCOS fraction, GRASP/Models leads with 57.9 % over its total 95 sites. Then, MAIAC_0.1 has the highest GCOS fraction for 30.8 % over a total of 169 sites. In Fig. 18d, the best GRASP/Models sites are globally distributed. Over the eastern United States, DB and MAIAC_0.1 products tend to have more sites with the best GCOS fraction.
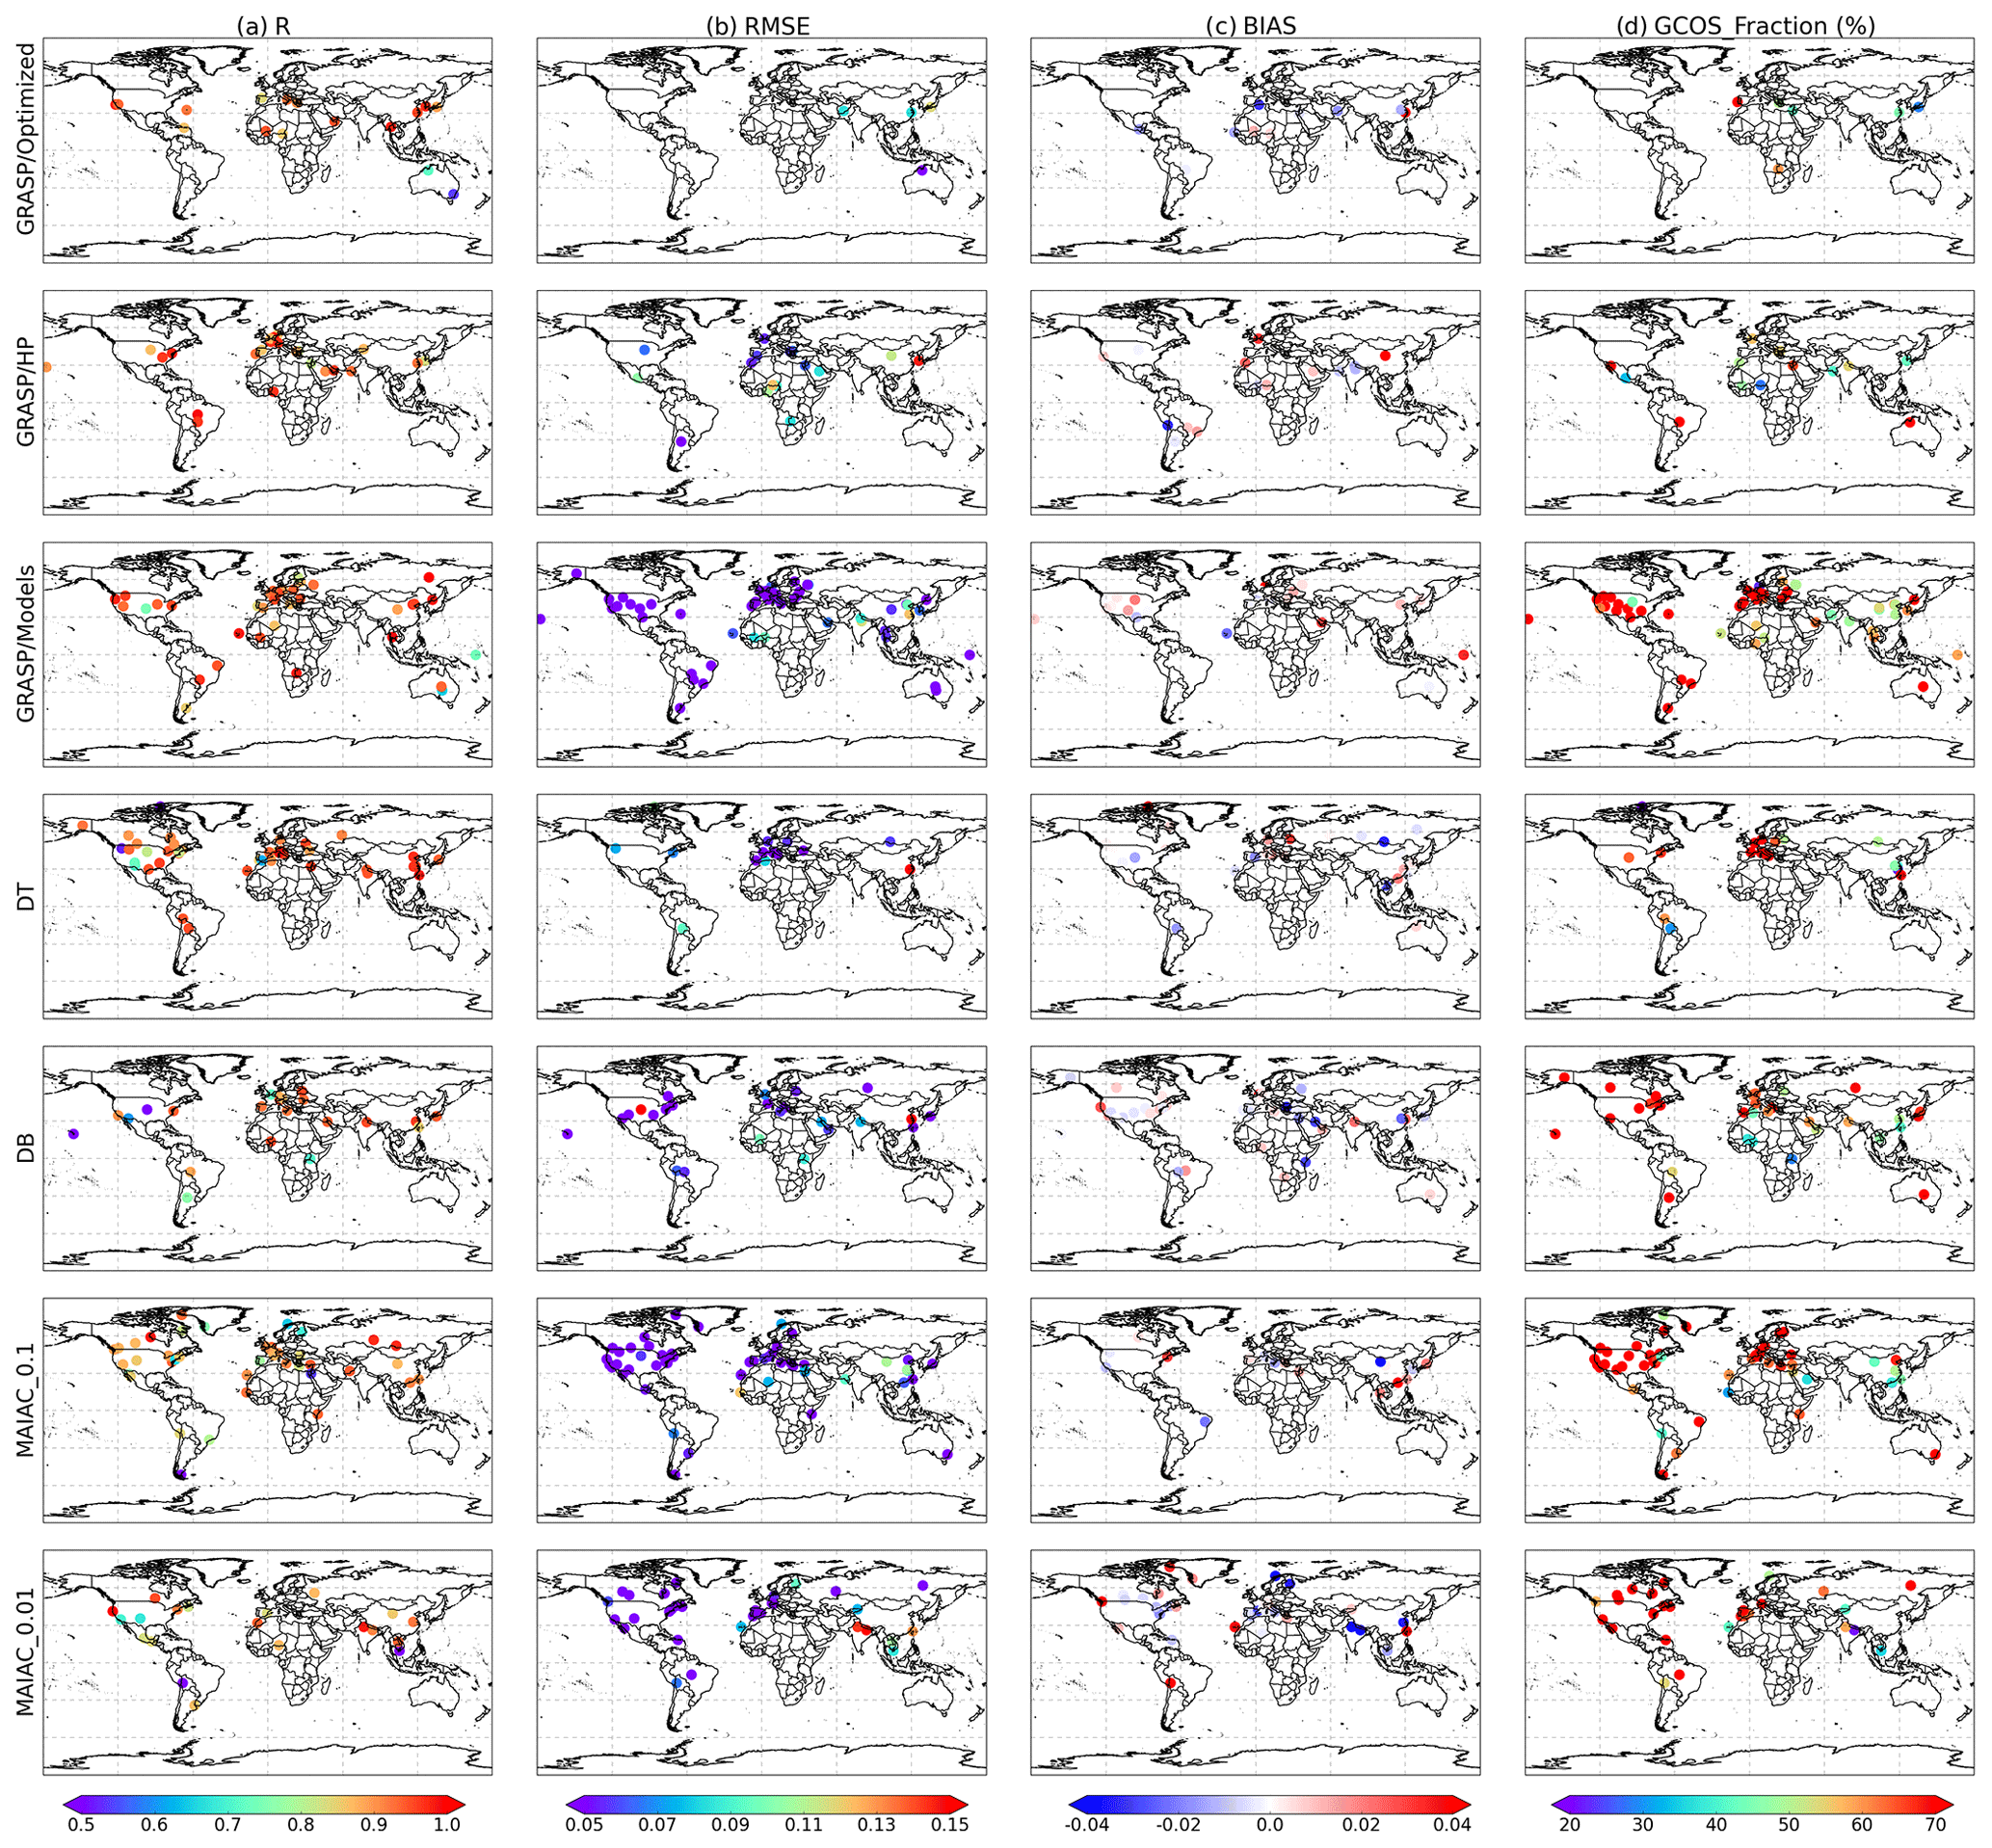
Figure 18Maps showing statistical metrics (a) R, (b) RMSE, (c) bias, (d) GCOS fraction (%) for the best performing AOD products (first ranking statistics among seven PARASOL/GRASP and MODIS products) over each AERONET site. Note that only the first ranking statistics over each site are present in the maps.
Using a similar concept as the AOD analysis above, the PARASOL/GRASP and MODIS (DT and DB) AE validations over AERONET sites were compared. Only cases with satellite AOD (550 nm) > 0.2 were included in the analysis; due to the reduced data volume from this threshold, the requirement on minimum matchups was reduced to 5. Figure 19 shows the detailed statistics for the performance of each AE product. Figure 20 shows the best performing algorithm at each site according to R and RMSE, respectively. In general, GRASP/HP and GRASP/Optimized AE products outperform the other AE products in the site level validation. The best sites are globally distributed (see Fig. 20). There are 44.1 %, 38.6 % and 34.7 % sites showing the best R for GRASP/Optimized, GRASP/HP and GRASP/Models, somewhat higher than DT (12.0 %) and DB (8.2 %). GRASP/HP AE has the best RMSE over 43.0 % AERONET sites, higher than GRASP/Optimized (34.3 %), DB (28.6 %), GRASP/Models (24.5 %) and DT (17.0 %).
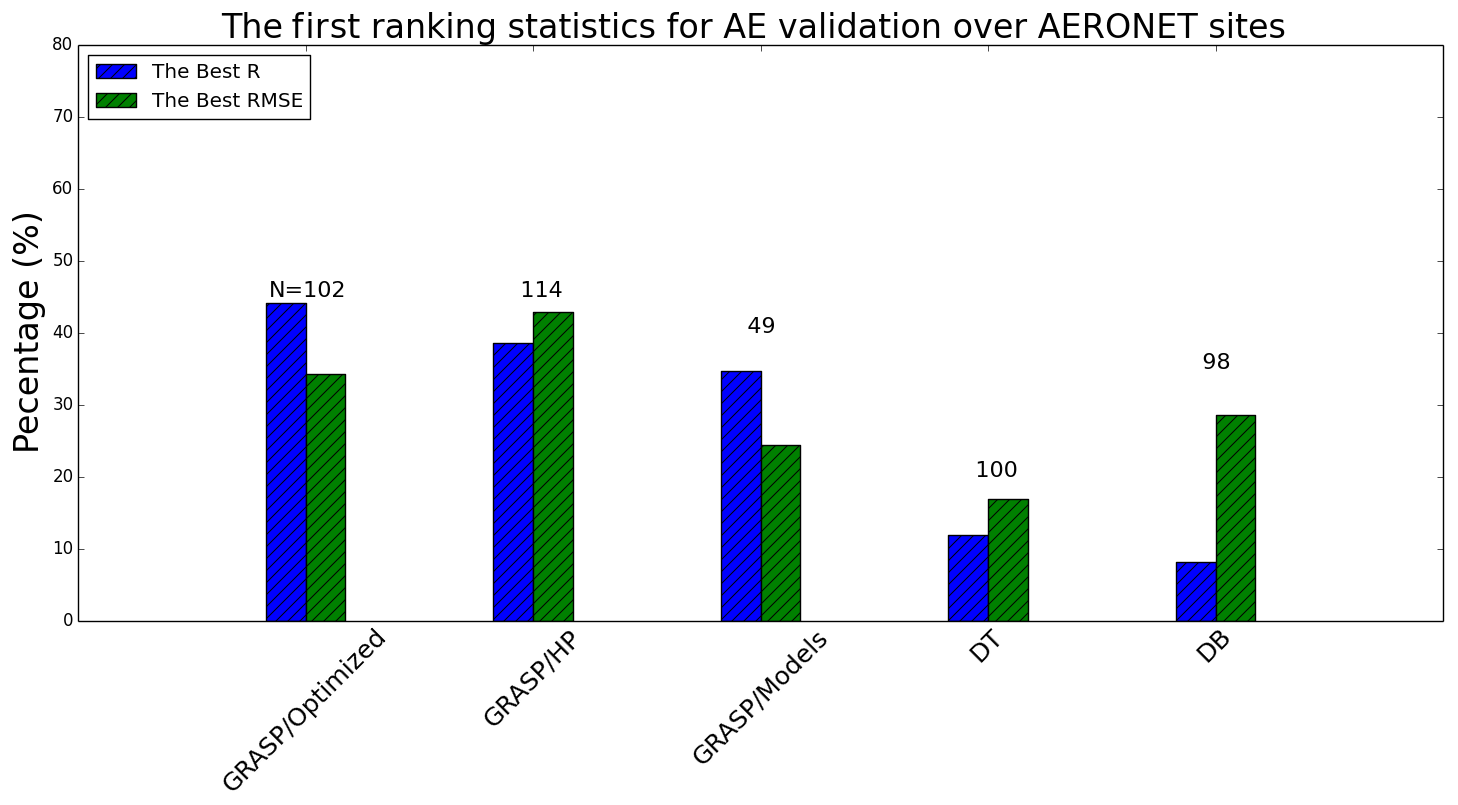
Figure 19Percentage of the AERONET sites where each product shows the best statistical metric (R and RMSE) between five PARASOL/GRASP and MODIS AE products. The number on top of each product is the number of sites where this product has sufficient matchup points for the comparison.
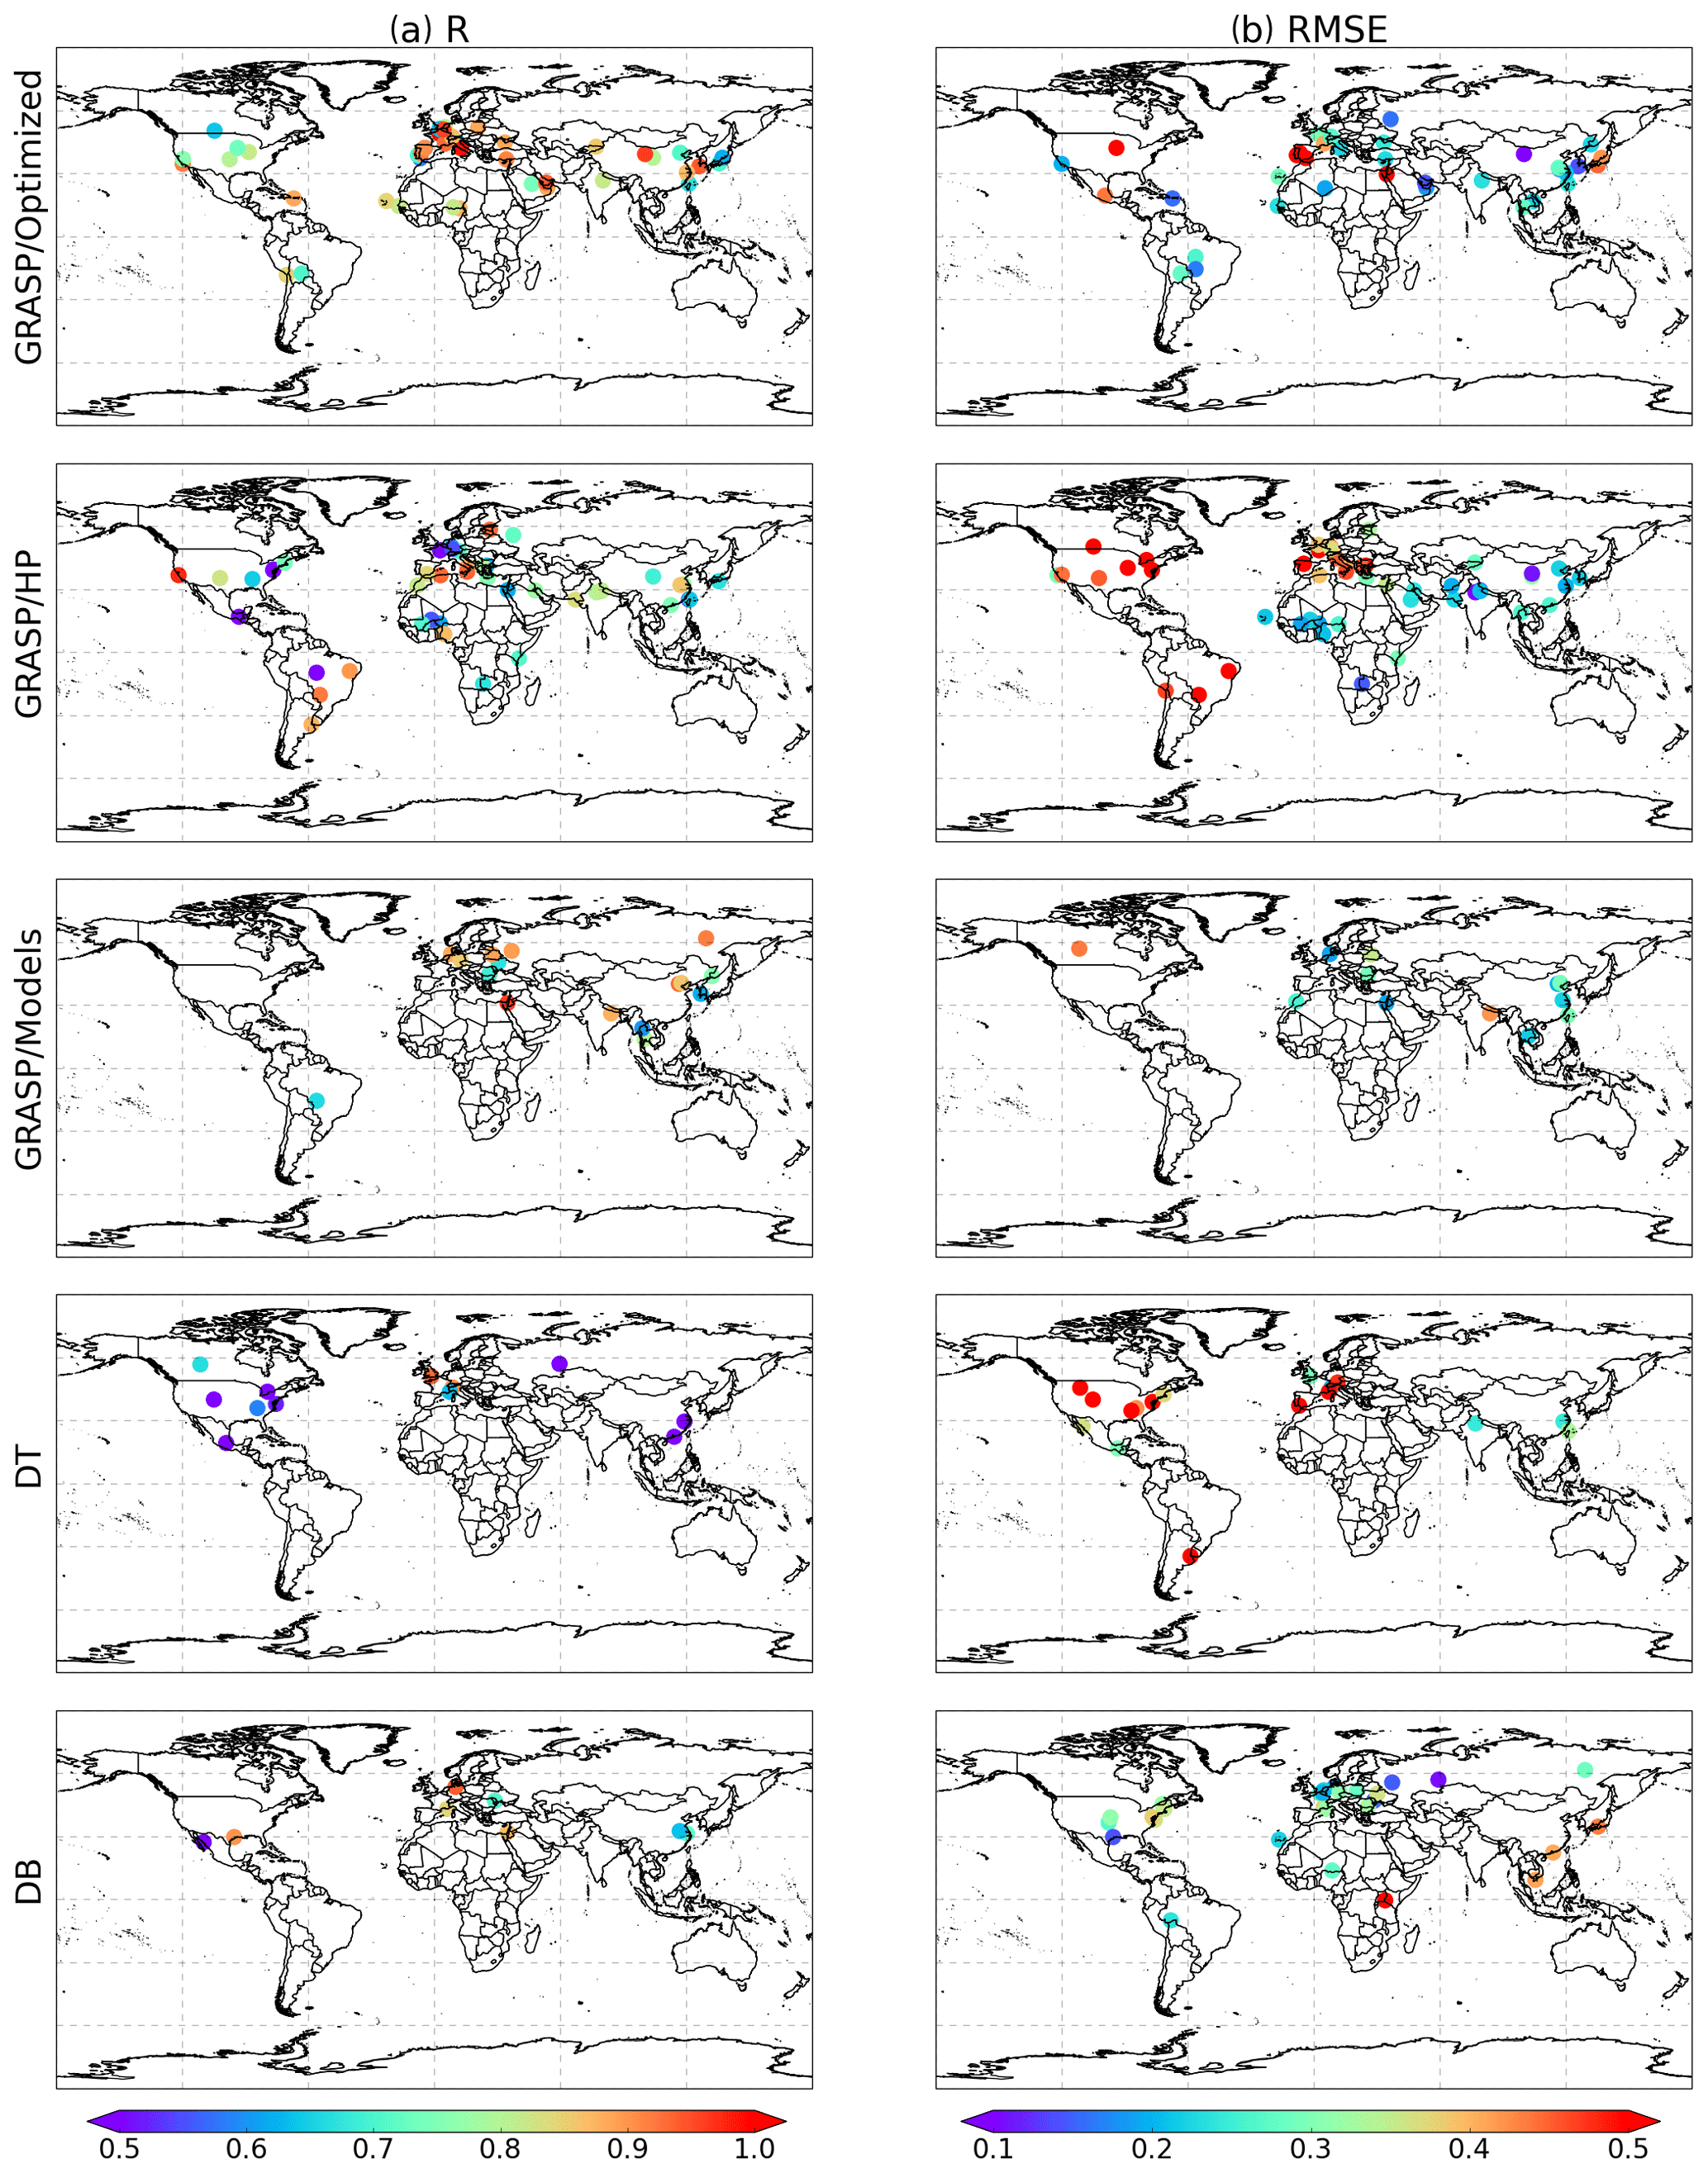
Figure 20Maps showing statistical metrics (a) R and (b) RMSE for the best performing AE products (first ranking statistics among five PARASOL/GRASP and MODIS products) over each AERONET site. Note that only the first ranking statistics over each site are present in the maps.
This section presents the inter-comparison of different satellite products for the year 2008 data on a global scale, i.e., not only over AERONET sites. Specifically, we want to know whether the consistency of the satellite products remains the same in the areas where no AERONET observations are available. In the first part, we compare PARASOL/GRASP and PARASOL/Operational at a spatial resolution of 0.2∘ × 0.2∘, which represents a compromise between PARASOL/Operational (18.5 km) and PARASOL/GRASP Level-3 (0.1∘) resolutions. In the second part of this section, the global inter-comparison is done between PARASOL/GRASP and MODIS aerosol products at a spatial resolution of 0.1∘ × 0.1∘, close to the DT and DB product native resolution of 10 km, and we use MAIAC_0.1 data that are of similar resolution. Only GRASP/HP and GRASP/Models products for PARASOL/GRASP are used in the consideration of this section since GRASP/Optimized shows rather similar results to GRASP/HP. Since the focus of this section is global pixel-to-pixel comparison of satellite aerosol products, we use all available data of the highest quality for each dataset (Table 2).
4.1 Comparisons between PARASOL/GRASP and PARASOL/Operational aerosol products
To begin, we investigate two independent aerosol products derived from PARASOL measurements, PARASOL/GRASP and PARASOL/Operational, globally for 2008. As mentioned above, PARASOL/Operational provides only AODF over land, while over ocean AOD, AE and AODF are available. We subtract AODF from total AOD to obtain Operational AODC over ocean.
Table 13Statistics of PARASOL and MODIS AODC products against collocated AERONET AODC over land and ocean.
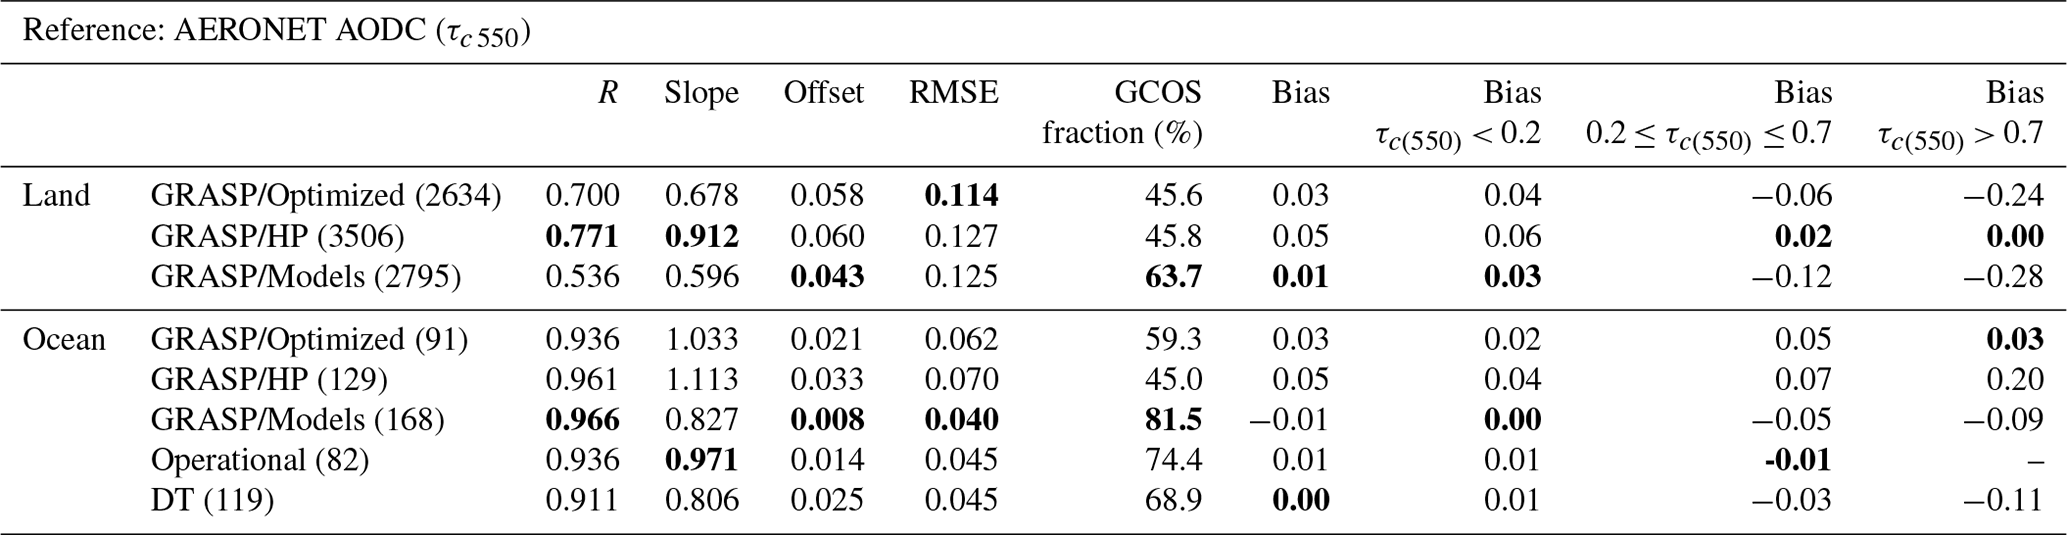
Table 14Pixel-to-pixel (0.2∘ × 0.2∘) statistical metrics between PARASOL/Operational and PARASOL/GRASP aerosol products; the statistics for only AERONET pixels are presented in brackets.
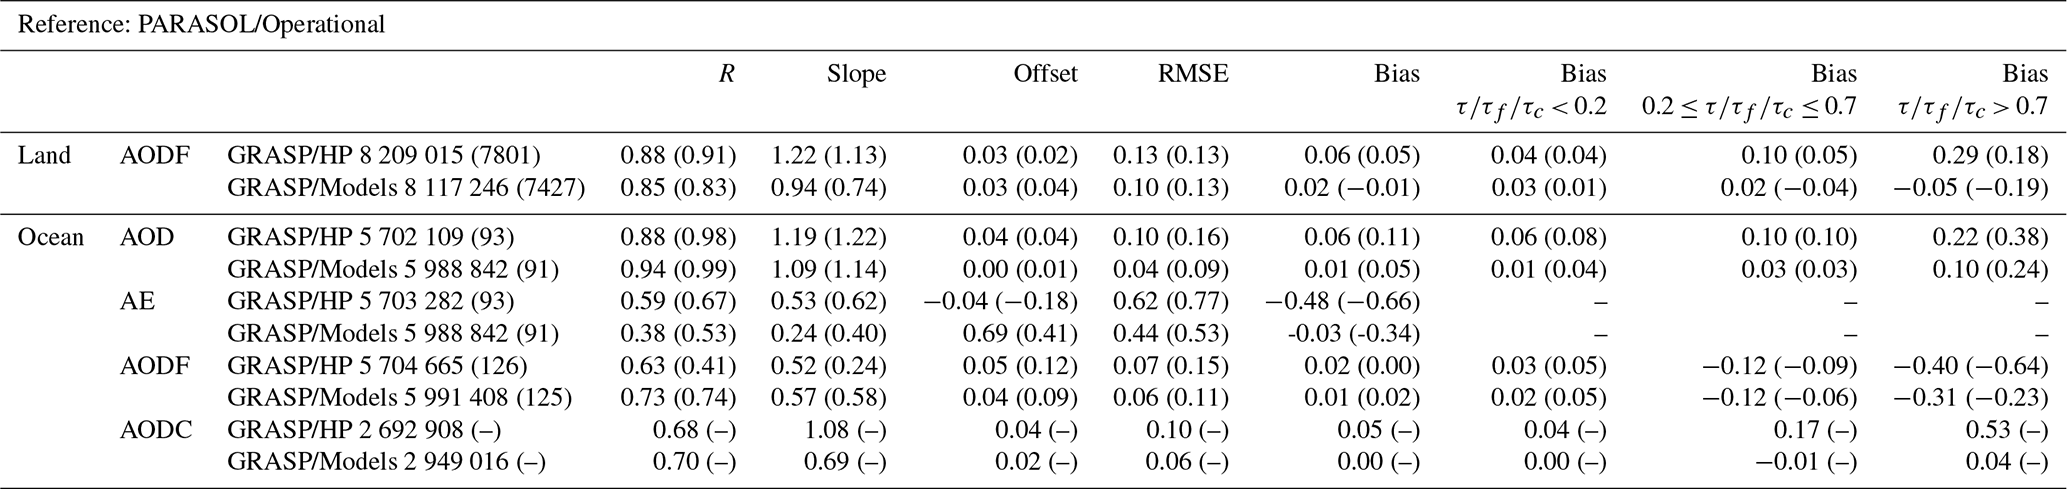
Table 14 presents the pixel-to-pixel statistic metrics (R, slope, intercept, RMSE and bias) between Operational and GRASP aerosol products (note here the bias should be interpreted as an offset rather than true bias as the “truth” is unknown; we retain the name of the metric for consistency with the earlier analysis). We took Operational products as a reference as these were the original PARASOL aerosol products released by AERIS/ICARE; hence, the bias is defined as GRASP – Operational. All the statistics for AOD, AODF and AODC are given for the midvisible wavelength (550 nm), while AE is calculated based on 670 and 870 nm. The statistical metrics are reported both for global comparisons and over AERONET pixels only (the numbers in the brackets). It can be seen from Table 14 the global comparison between PARASOL/GRASP and PARASOL/Operational is rather consistent for AOD over ocean and AODF over land, for which, the global pixel-to-pixel correlations between GRASP/HP, GRASP/Models and Operational products are generally higher than 0.85 based on more than 5 million pairs. However, the agreement of AODF over ocean decreases to 0.63–0.73 for R. The slight decrease in correlation against AERONET from land to ocean for Operational AODF products is also recorded in Table 12 and a previous study by Bréon et al. (2011). The AODC over ocean for the Operational product is derived from AOD and AODF; hence, the number of matched pairs is lower than for AODF. The overall agreement has a correlation coefficient of ∼ 0.7. GRASP/HP AODC is ∼ 0.05 higher than Operational, but the difference between GRASP/Models and Operational is ∼ 0.0, which is in line with the validation against AERONET in Table 13. The pixel-to-pixel agreement for PARASOL/GRASP and PARASOL/Operational AE is less convincing (R < 0.6) than any other parameters, even though they are all well correlated with AERONET (R > 0.8) over ocean. One possible reason is that the AE here is calculated at different wavelengths (670 and 870 nm) than for the comparisons with AERONET (470∕660 nm and 440∕870 nm). Besides, the decrease in AE agreement for global correlation (R) compared to that over AERONET pixels is more notable than other parameters. This may explain why the AE products resulting from LUT-based algorithms are more determined by climatological assumptions about the aerosol models than retrieved.
4.2 AOD comparisons between PARASOL/GRASP and MODIS products
In order to further clarify the level of consistency of satellite products (PARASOL/GRASP and MODIS), the global correlations of different satellite products were extensively analyzed for the year 2008 at a spatial resolution of 0.1∘ × 0.1∘. Figure 21 shows the seasonal pattern of AOD (550 nm) from PARASOL (GRASP/HP and GRASP/Models) and MODIS (DT, DB and MAIAC) products. Any grid box with fewer than three measurements for a season was omitted. Figure 22 shows the differences of mean AOD (550 nm) by season between PARASOL and MODIS aerosol products using GRASP/Models as the reference. A positive value indicates that the MODIS product had a higher mean value. Since the analysis in Sect. 3 suggested that the AOD products over land and ocean from the GRASP/Models processing have the lowest biases, this was used as a reference product in Fig. 22. Since GRASP/HP AOD shows non-negligible bias (land: +0.06; ocean: +0.07) from AERONET validation (see Table 9), in order to show the intrinsic, the bias was subtracted from the GRASP/HP AOD products before obtaining the seasonal differences shown in Fig. 22.
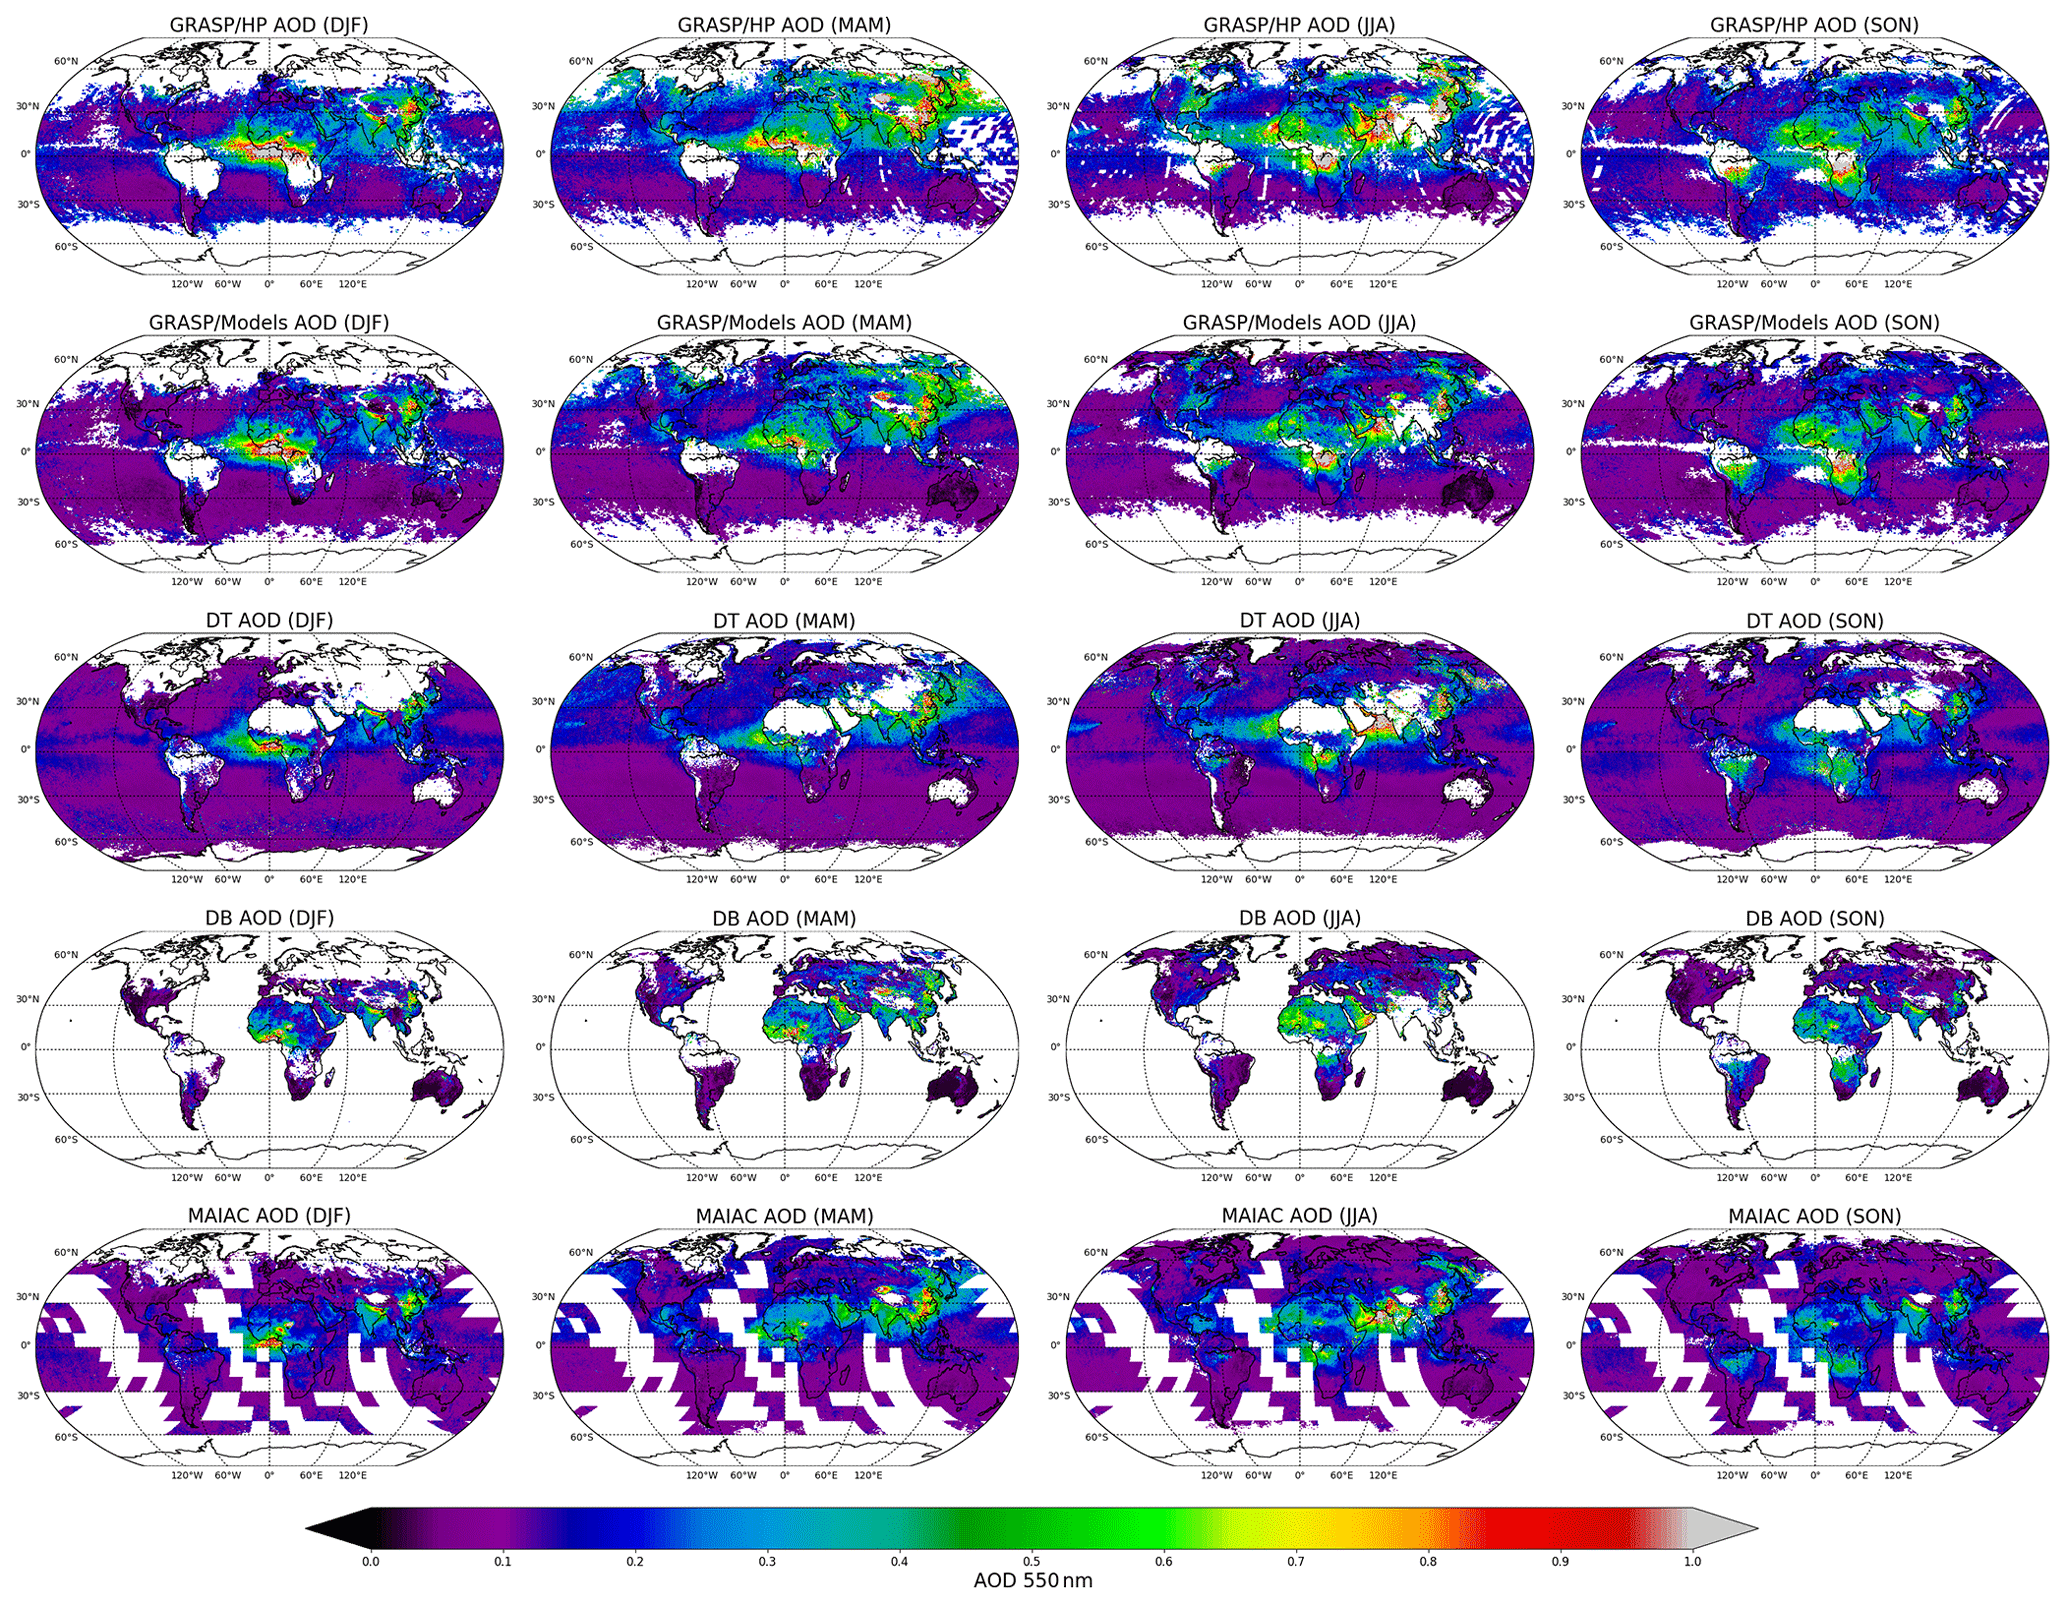
Figure 21Spatial distribution of 0.1∘ × 0.1∘ seasonal AOD (550 nm) from PARASOL (GRASP/HP and GRASP/Models) and MODIS (DT, DB and MAIAC) products. DJF: December–January–February; MAM: March–April–May; JJA: June–July–August; SON: September–October–November.
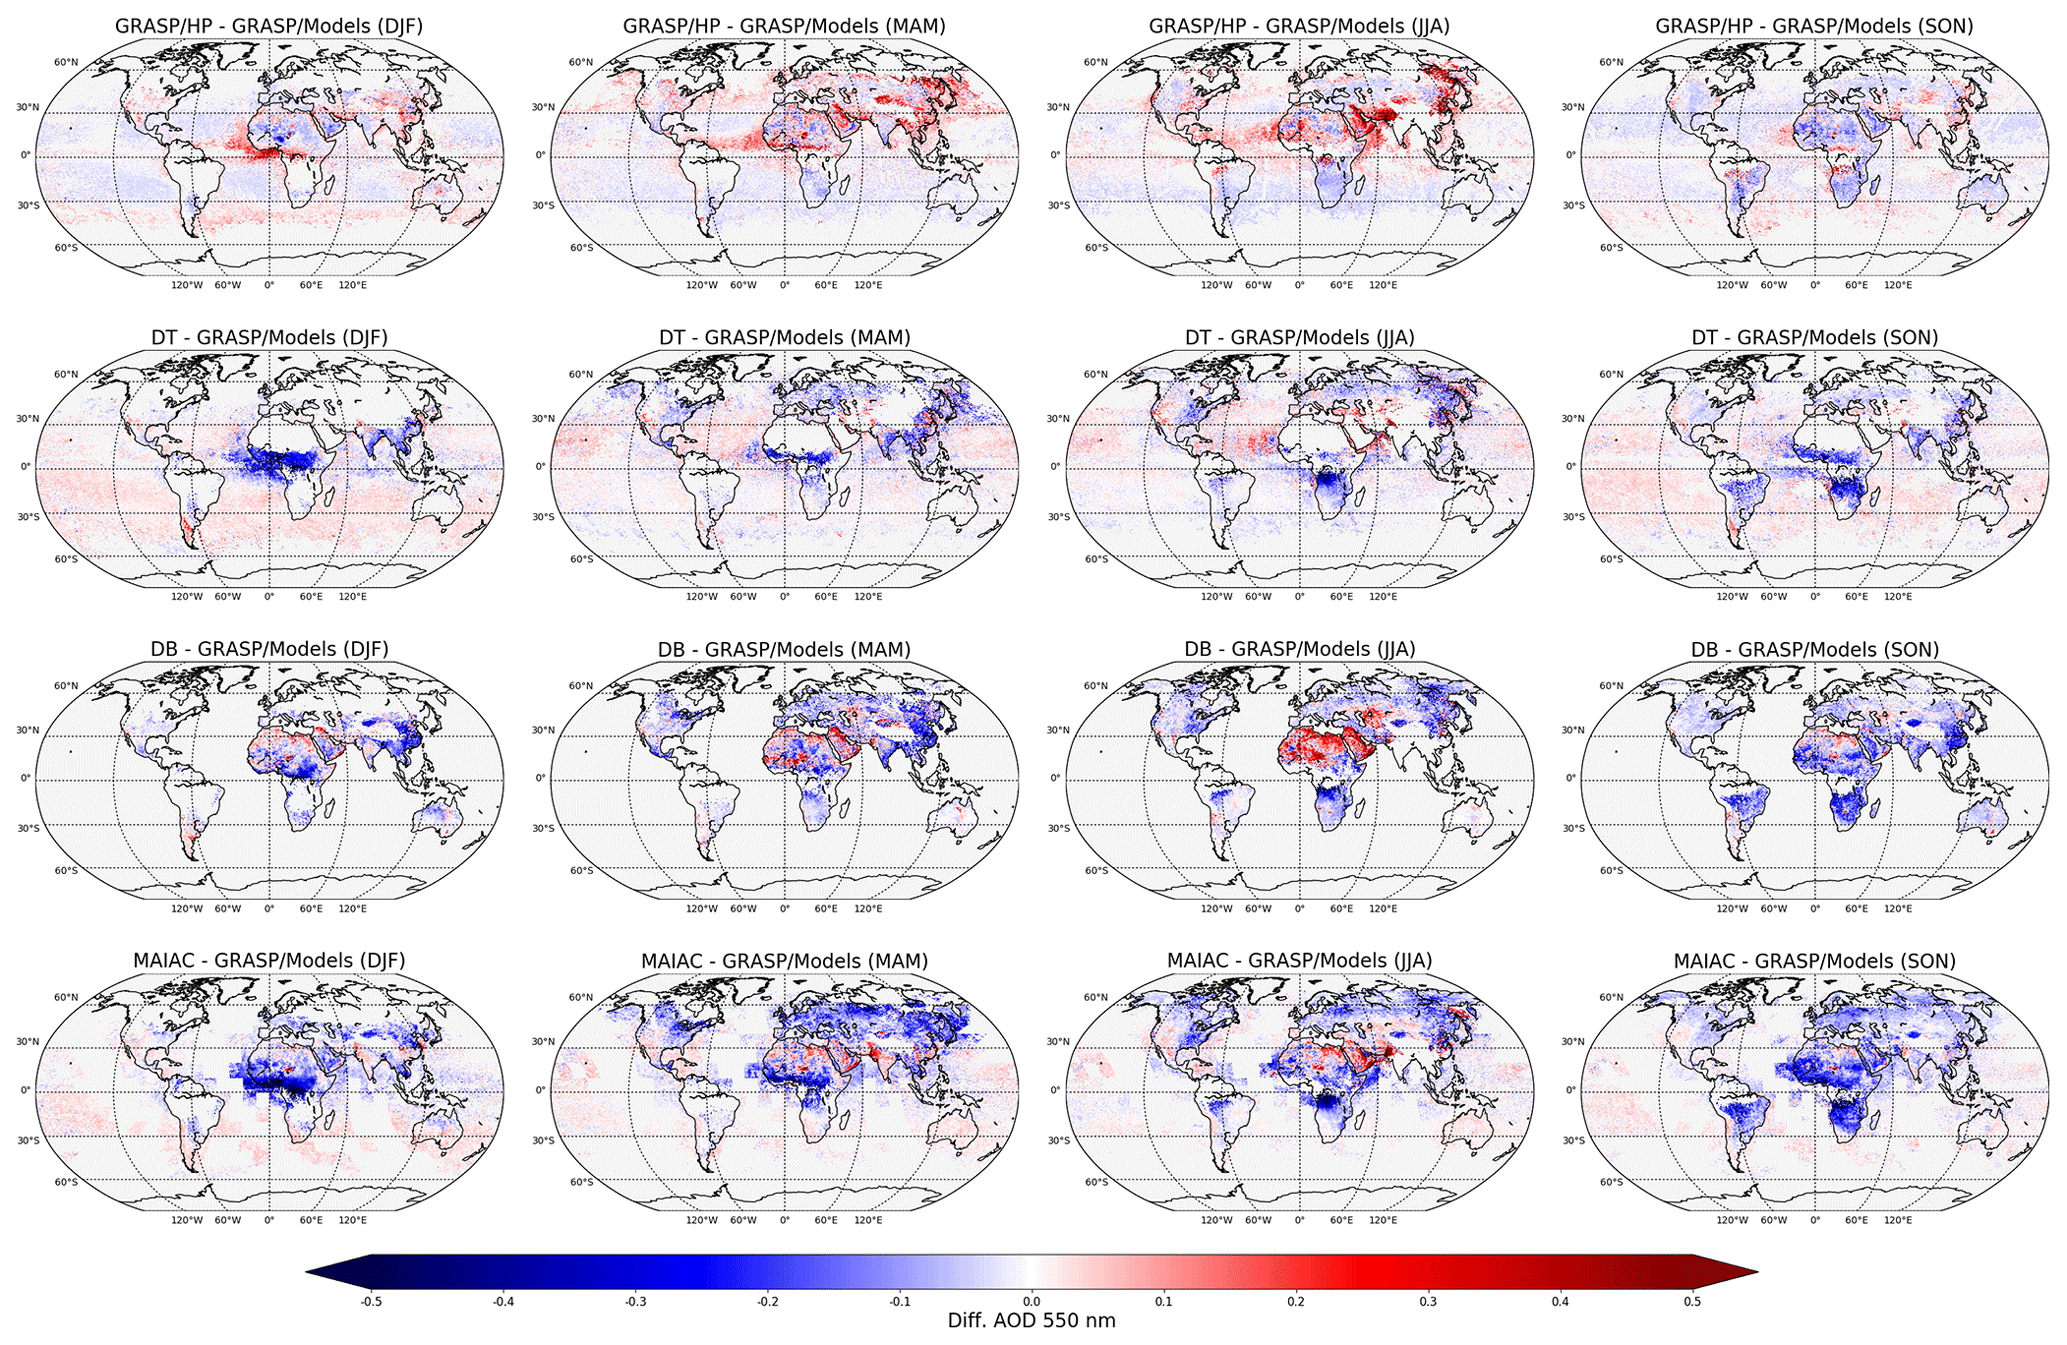
Figure 22Spatial distribution of 0.1∘ × 0.1∘ seasonal AOD (550 nm) differences between PARASOL and MODIS aerosol products, referenced to GRASP/Models.
In addition, the global correlations between different satellite products and GRASP/Models data at 550 nm were calculated for the complete year of 2008. Also, in order to evaluate the consistency of different MODIS products over land, the inter-comparisons were done against the MAIAC AOD (Land) product chosen as a reference, as MAIAC provides the most universal coverage over land. Table 15 presents the pixel-to-pixel statistic metrics (R, slope, intercept, RMSE and bias) between AOD products compared to the reference of GRASP/Models (Land and Ocean) and MAIAC AOD (Land) products. The statistical metrics are reported both for global comparisons and over AERONET pixels only (numbers in brackets).
Table 15Pixel-to-pixel (0.1∘ × 0.1∘) statistical metrics between AOD (550 nm) products based on references of GRASP/Models (land and ocean) and MAIAC AOD (land); the statistics for only AERONET pixels are presented in brackets.
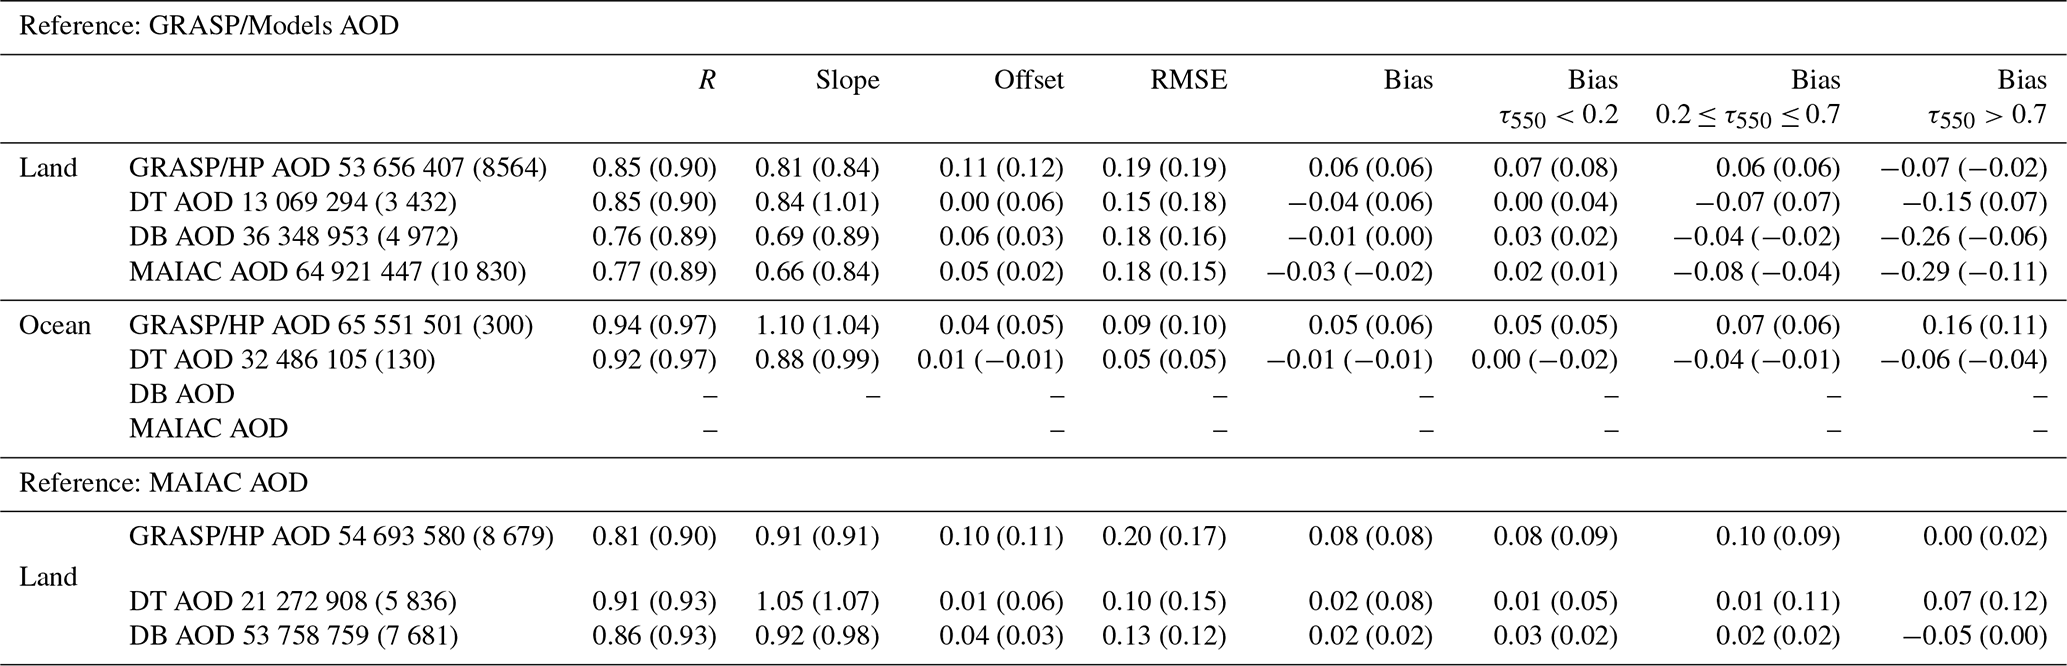
Each of these global correlations was based on several dozens of millions of pairs and less noisy compared to the AERONET correlations (based on only a few thousand points). In spite of this significant difference in volume, the outcome of the global satellite comparisons is rather consistent with the results of validation against AERONET. For example, all AOD products are in close agreement over ocean, with the correlation coefficients above 0.9 and slope lines close to 1:1 (Table 15). Specifically, the three aerosol products (GRASP/HP, GRASP/Models and DT) over ocean agree with R > 0.92 for any two products. Also, in line with the validation over AERONET sites, GRASP/HP AOD (550 nm) consistently has a positive offset ∼ 0.05–0.16 from low- to high-AOD conditions with respect to GRASP/Models. DT and GRASP/Models AOD values show good agreement over ocean, R = 0.92 for all points and R = 0.97 for AERONET pixels; in addition, the bias (DT–GRASP/Models) equals −0.01 for all points and 0.00 for low AOD (< 0.2), while the negative bias of −0.06 appears when AOD is greater than 0.7. Statistics over ocean rely on ∼ 65 million pairs between GRASP/HP and GRASP/Models and ∼ 32 million pairs between DT and GRASP/Models.
However, over land surfaces the situation is quite different, and MODIS/MAIAC and DB AOD products show evidently better agreement with GRASP/Models over AERONET pixels than the rest of globe. The correlations over AERONET pixels for both MAIAC versus GRASP/Models and DB versus GRASP/Models are of ∼ 0.89, which is generally in line with the correlation coefficient values with AERONET shown in Table 9. In a contrast, the corresponding correlation coefficients decrease to 0.76 and 0.77 for global statistics. The other statistical parameters (e.g., slope, offset, RMSE and bias) showed the same trend, indicating a better agreement over AERONET pixels. For comparisons of GRASP/HP and DT versus GRASP/Models AOD, such tendency is not evident. Even though the correlation coefficient drops from 0.90 over AERONET to 0.85 globally, the rest of statistical indicators do not show significant changes, whether over an AERONET site or elsewhere. It is interesting to note that MODIS products show better agreement (especially in correlations) with other MODIS products over AERONET stations and globally than between PARASOL and MODIS products over AERONET stations and globally (Table 15). This phenomenon can be explained by several factors. First, the inputs from the two satellites differ significantly. The multi-angle polarization information from PARASOL offers algorithms many more degrees of freedom from which to constrain environmental factors and invert aerosol parameters than does a single-view radiometer like MODIS. Second, because of this extra information the PARASOL/GRASP retrievals do not have location-specific assumptions about aerosol and conduct their retrievals in exactly the same manner globally. In contrast, all three MODIS retrievals use some regional assumptions over land about aerosol types, surface properties, etc. Even though each algorithm's assumptions are different, the need for a priori constraints could draw the MODIS products closer together. Therefore, the similarities in global performance of three algorithms can probably be explained by somewhat similar a priori assumptions about aerosol types used in MODIS algorithms. Third, as can be seen from Table 15 and Fig. 21, GRASP/Models, GRASP/HP and MAIAC have wider coverage over land than DB and DT, because of the lack of retrievals over bright surfaces for DT and reduced number of retrievals over dark vegetation for DB (although some of this was improved in DB Collection 6.1; Sayer et al., 2019). Specifically, for the year 2008, there are more than 64 million pairs of MAIAC–GRASP/Models AOD over land, which is much higher than the number of pairs obtained with other two AOD products. Thus, the collocation statistics for MAIAC/GRASP, DT/GRASP and DB/GRASP as well as MAIAC/DT and MAIAC/DB were based on different datasets. Fourth, the different representation of various natural conditions in the global statistics and statistics over AERONET can be non-identical and, therefore, the average performance indications can differ. For example, there is only a certain fraction of AERONET sites in desert areas while land cover with bright surface may have a notably higher or lower fraction in global statistics. Correspondingly, if the product agreement is non-identical over different land surfaces, then the statistics with different representations of various surfaces can differ.
In order to explore the last factor, the statistics of the comparisons were sorted by land surface type. Tables 16 and 17 show pixel-to-pixel statistic metrics with reference AOD from GRASP/Models and MAIAC, respectively, over different land coverage using four classes of land surface by NDVI (as before, NDVI < 0.2, 0.2 ≤ NDVI < 0.4, 0.4 ≤ NDVI < 0.6 and NDVI ≥ 0.6).
Table 16Pixel-to-pixel (0.1∘ × 0.1∘) statistical metrics between AOD products based on reference of GRASP/Models over land pixels with four classes of surface (NDVI < 0.2, 0.2 ≤ NDVI < 0.4, 0.4 ≤ NDVI < 0.6 and NDVI ≥ 0.6); the statistics for only AERONET pixels are presented in brackets.
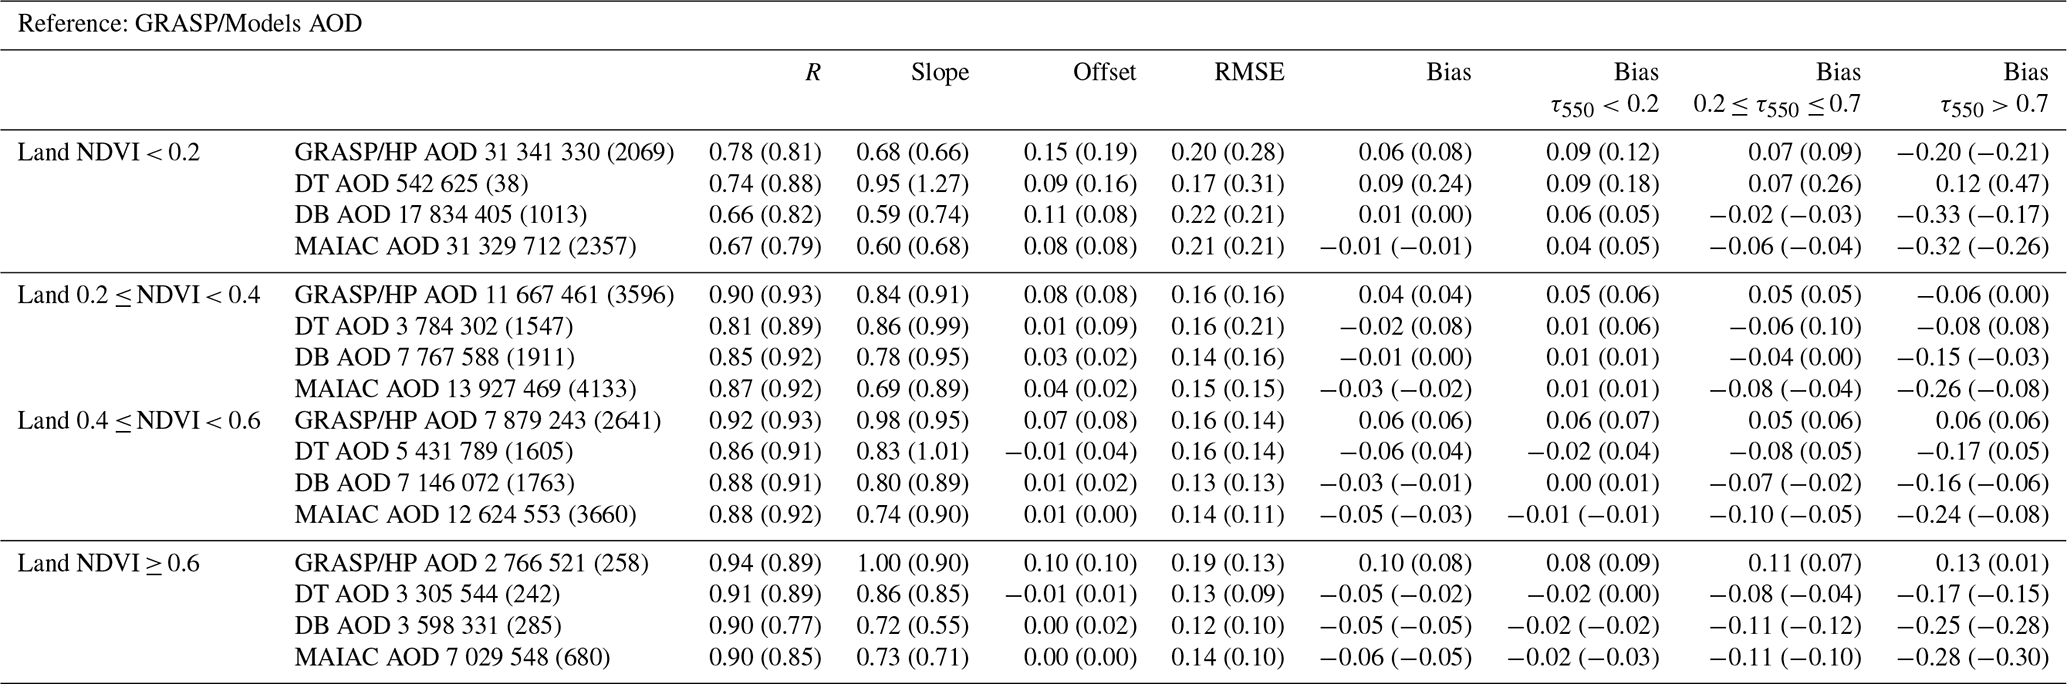
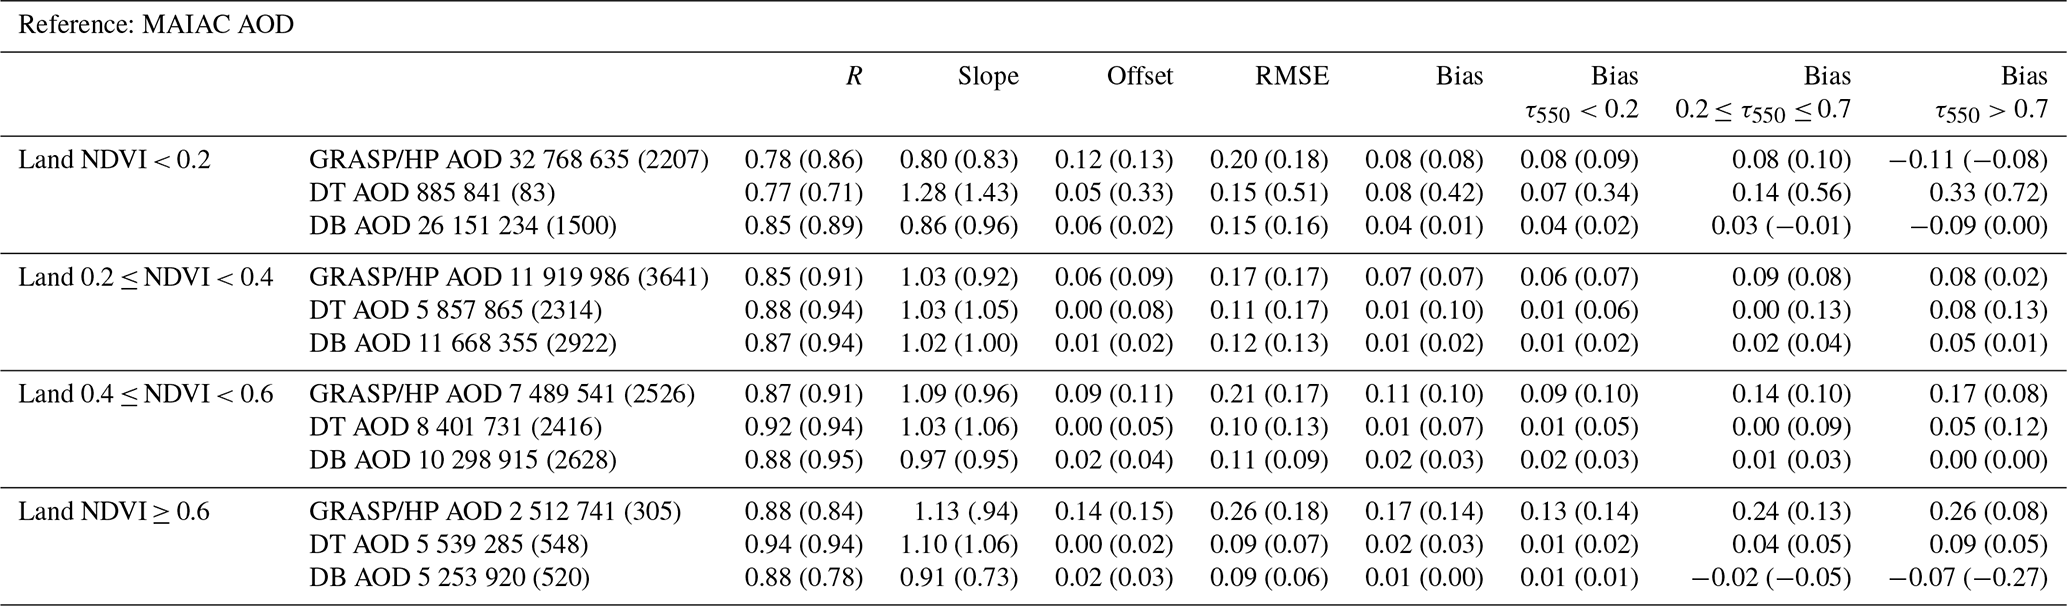
Table 18Pixel-to-pixel statistical metrics between AE products based on references of GRASP/HP; the statistics for only AERONET pixels are presented in brackets.
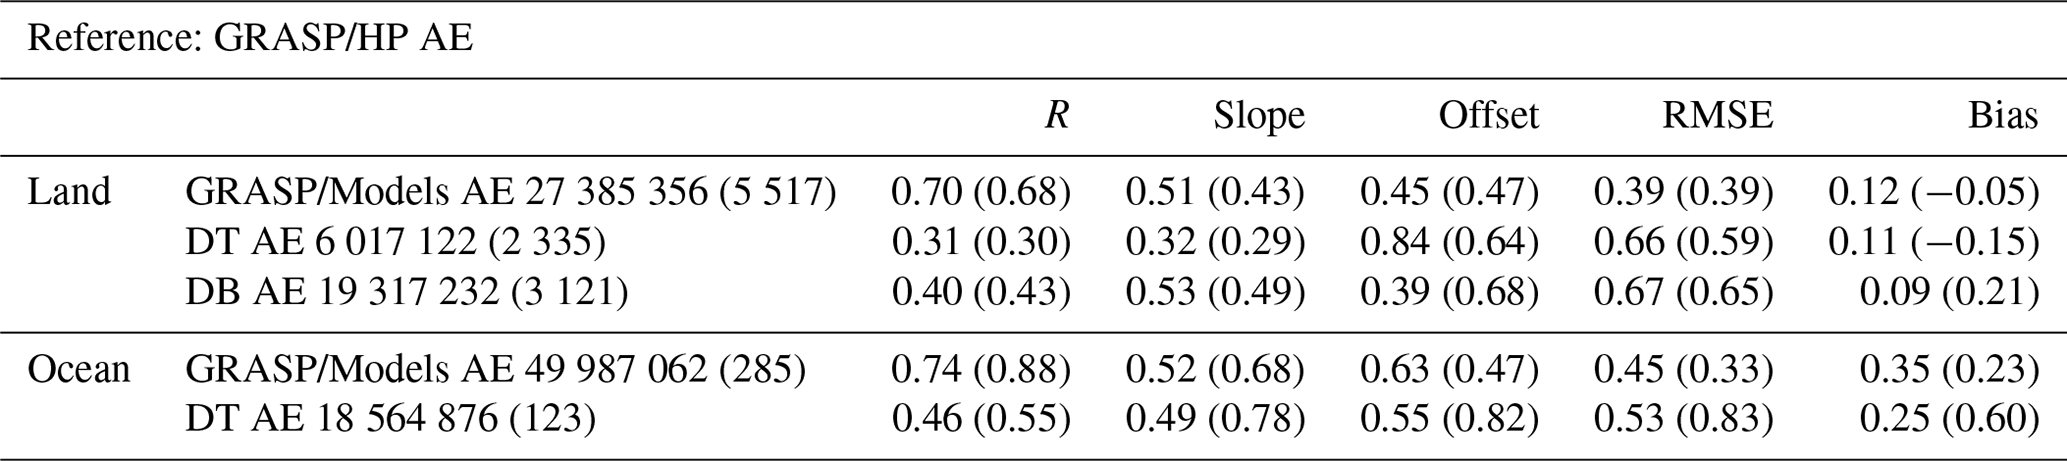
Tables 16 and 17 show that over very bright land surfaces (NDVI < 0.2), the global correlations between MODIS (especially DB and MAIAC) with PARASOL/Models products were significantly lower than over other surfaces and showed the most notable drop (> 0.1) in global correlations compared to the correlation over AERONET sites. Such a large drop was not seen between different PARASOL products or between different MODIS products. Therefore, these differences are likely related to the fact that MODIS retrievals rely on regional climatological aerosol assumptions or surface assumptions derived from atmospheric correction at (unevenly distributed) AERONET sites while in PARASOL/GRASP retrievals no location-specific assumptions are used. Another issue that may be related is that MODIS has much higher spatial resolution for cloud detection than PARASOL. The possible sub-pixel cloud contamination for PARASOL may affect the global inter-comparison statistics, since the validation against AERONET brings an additional cloud clearing filter from AERONET. As a result, PARASOL/GRASP retrievals are expected to be rather consistent globally, while MODIS retrievals are more closely tied to AERONET statistics and may perform less well in the areas with a lack of AERONET sites. At the same time, the fraction of pairs over bright surfaces in inter-satellite product comparisons is higher than in AERONET statistics since there are only a limited number of AERONET sites in desert areas. This latter statement does not necessarily apply to MODIS DT because it often does not retrieve over deserts; however, although the sample size is very small, Table 16 shows that it actually matches GRASP/Models less well at AERONET sites than globally for NDVI < 0.2.
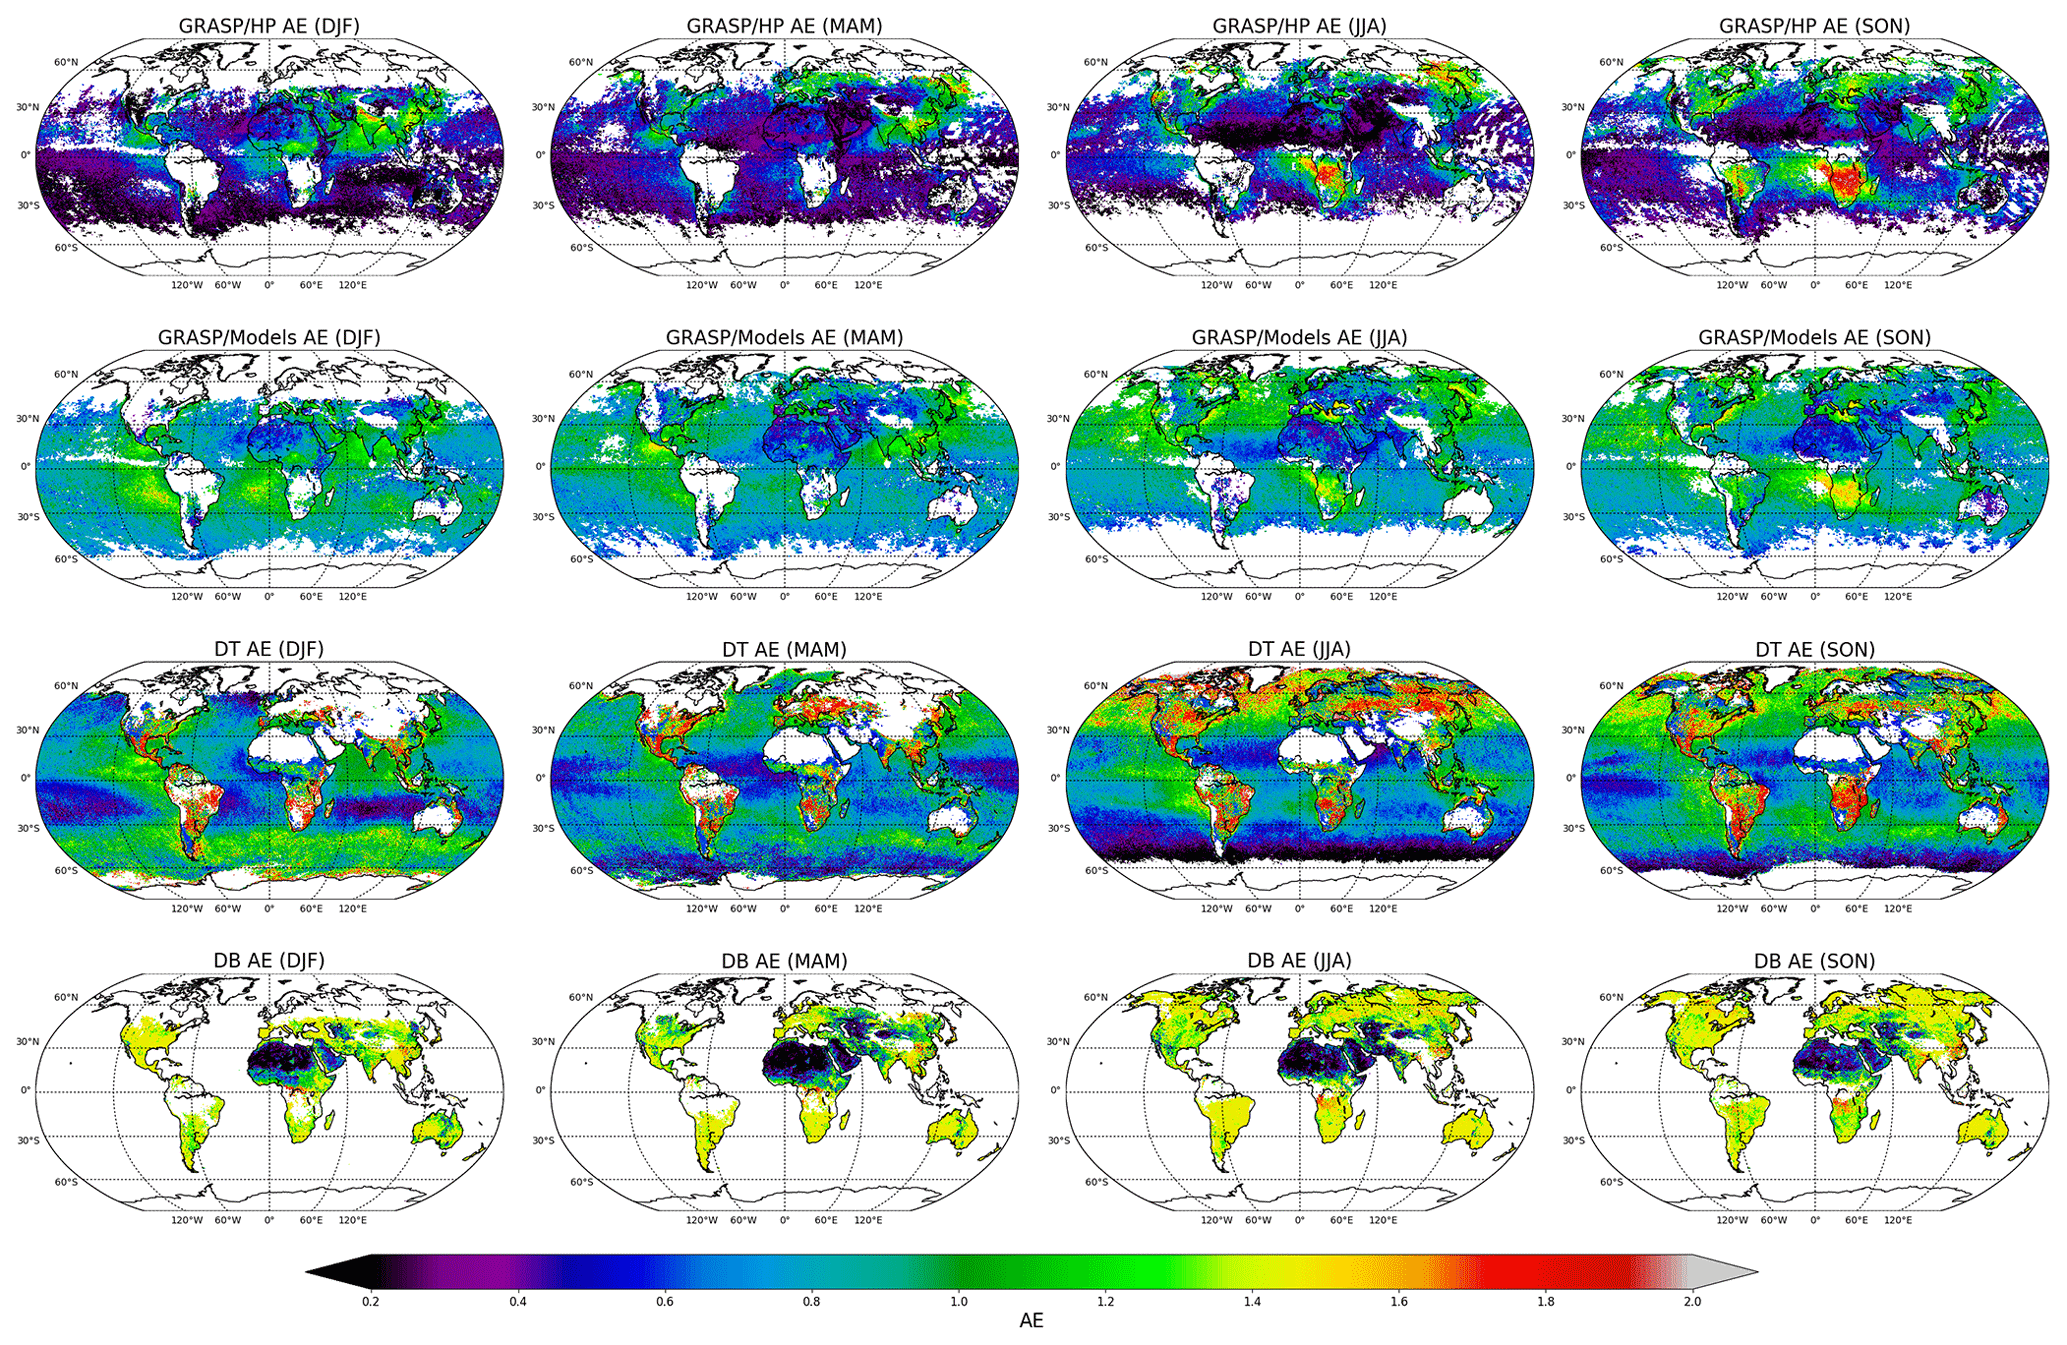
Figure 23Spatial distribution of 0.1∘ × 0.1∘ seasonal AE from PARASOL (GRASP/HP and GRASP/Models) and MODIS (DT and DB) products.
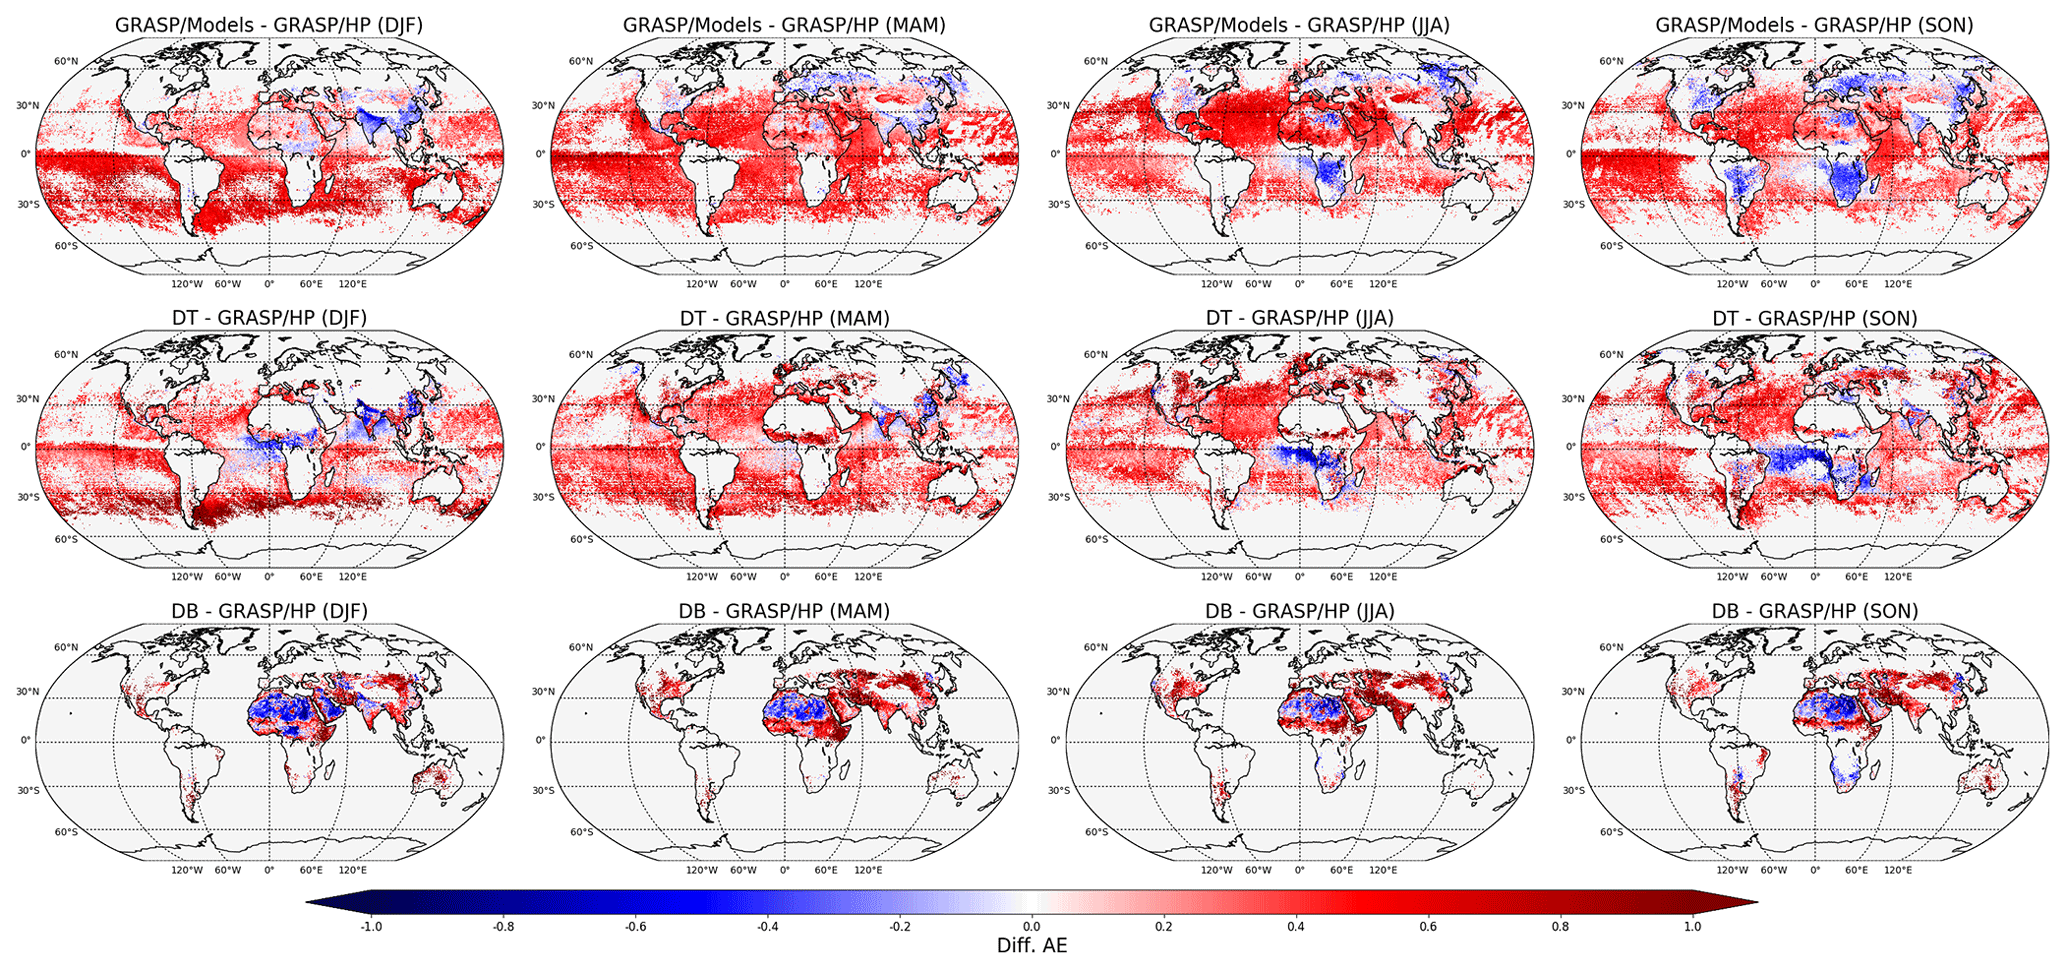
Figure 24Spatial distribution of seasonal AE differences between PARASOL and MODIS aerosol products, referenced to GRASP/HP.
Interestingly, the maps in Fig. 22 of seasonal AOD difference indicate lower AOD (550 nm) for PARASOL/Models over bright surfaces compared to MODIS products, while the global comparisons of PARASOL/Models and MODIS DB and MAIAC products did not show significant bias in AOD (550 nm). At the same time, the global comparisons (Table 16) between PARASOL/Models, MODIS DB and MAIAC show a significant bias for different ranges of AODs. MODIS DB and MAIAC had a positive bias of ∼ 0.06–0.04 for the situation with lower aerosol loadings (AOD 550 nm < 0.2) and a notable negative bias (0.02–0.06) for moderate AOD (0.2 < AOD 550 nm < 0.7) and an especially large bias for high aerosol loadings (AOD 550 nm > 0.7) that reached ∼ 0.3. A very similar tendency can be seen from the statistics of validation against AERONET in Table 10: both PARASOL/Models and MODIS/DB have very small bias of −0.01, while the distribution of bias is quite different for the situations with different loadings: 0.01 and 0.03 for low AODs, −0.03 and −0.05 for moderate AODs, and 0.01 and −0.16 for high AODs. This suggests that the observed positive differences when MODIS/DB and MAIAC show higher AOD over bright surfaces occur mainly during low-AOD conditions. This conclusion is supported by the fact that seasonal means from all products do not show high AOD over the northern Sahara between 20 and 30∘ N latitude. Also, both DB and MAIAIC show significant underestimation of AOD over the Taklamakan desert where seasonal mean AOD retrieved by PARASOL is high, which agrees with the negative offset between MODIS DB, MAIAC and PARASOL/Models products over bright and bare soil land surfaces (NDVI < 0.4).
The negative bias between MODIS and PARASOL products is clearly seen on the maps of seasonal AOD from different products for African biomass burning events. The results of correlation analysis over green vegetation (NDVI ≥ 0.6) in Table 16 also show a significant negative bias in all MODIS products compared to PARASOL/Models over green vegetation that increases for medium and high aerosol loading. The validation against AERONET in Table 10 shows the highest bias of 0.06 to 0.07 for PARASOL/Models is over green vegetation (NDVI ≥ 0.6) when 0.2 < AOD < 0.7, while the MODIS products tend to be less biased (DT bias = 0.03) or negatively biased (MAIAC bias = −0.04 to −0.06 and DB bias = −0.04) for this surface type and AOD range. This pattern continues for DB and MAIAC through all the vegetated surfaces with NDVI > 0.2. MODIS DB and MAIAC continue to be more negatively biased against AERONET for moderate to high aerosol loading than PARASOL/Models is. Thus, the results suggest that observed differences for African biomass burning events can be explained by two potential reasons: a combination of overestimations of AOD by PARASOL/GRASP retrievals and underestimation of AOD by MODIS products for cases of moderate to high aerosol loading. However, the DT retrievals also show this negative bias against PARASOL/GRASP in the African biomass burning (Fig. 22) but do not follow the same trends against MODIS as DB and MAIAC. Other factors, such as differences in cloud screening, data amount, aggregation and quality-screening approaches must also contribute to these differences and need to be investigated in future analysis.
Table 19Pixel-to-pixel statistical metrics between AE products based on references of GRASP/HP over land pixels with four classes of surface (NDVI < 0.2, 0.2 ≤ NDVI < 0.4, 0.4 ≤ NDVI < 0.6 and NDVI ≥ 0.6).

4.3 AE comparisons between PARASOL/GRASP and MODIS products
The seasonal pattern of AE from PARASOL (GRASP/HP and GRASP/Models) and MODIS (DT and DB) products is presented in Fig. 23, as well as AE differences by season between PARASOL and MODIS aerosol products in Fig. 24. Table 18 shows the global pixel-to-pixel statistic metrics between AE products based on references of GRASP/HP; in the brackets, the values corresponding to validation results over AERONET pixels only are shown. As before, the statistic metrics split into four classes of land surface by NDVI are presented in Table 19. The GRASP/HP AE products are chosen to be a reference taking into account the highest obtained correlation in the validation with AERONET in the Sect. 3. Again, note that although AOD over land is reported by DT at 470 and 660 nm, the spectral dependence of the DT land retrieval is mostly imposed by assumed aerosol models, and thus DT AE over land is at most a binary indication of fine and coarse particles and not a quantitative parameter. We expect no correlation with GRASP/HP over land. AE over land from DB is similarly prescribed, not retrieved, when AOD < 0.2 (Hsu et al., 2013). On the other hand, the DT AE over ocean is a true quantitative measure.
The differences between PARASOL/GRASP and MODIS DT and DB AE products are pronounced in all comparisons. From Fig. 23, the seasonal variations for DB and DT are minor, which likely implies utilization of similar climatological information in the DB and DT algorithms. Even though the differences for GRASP/Models and GRASP/HP shown in Fig. 24 are not small (mainly due to the limited dynamic range of aerosol components used in the GRASP/Models approach), the overall pixel-to-pixel correlation between GRASP/Models and GRASP/HP is the highest between any two products (0.70 over land, 0.74 over ocean), and the RMSEs are 0.39 over land and 0.45 over ocean. The correlations for AE over land between MODIS DT and DB AE versus GRASP/HP are lower than 0.5 and RMSEs are higher than 0.59 for all land surface types (Table 19), which is not surprising for the aforementioned reasons. Over ocean, all available products (GRASP/HP, GRASP/Models and DT) show good agreement with AERONET measurements, with R > 0.8 (Fig. 11 and Table 11); however, the pixel-to-pixel correlation between DT and GRASP/HP for ocean pixels globally decreases to 0.46, with RMSE = 0.53. The cause of the drop for global statistics is presently unknown. It could be due to assumptions in the DT retrieval but could also be linked to differences in calibration between POLDER and MODIS, as AE is particularly sensitive to nuanced spectral changes in calibration in the lower-AOD conditions often seen over ocean.
4.4 AODF and AODC comparisons between PARASOL/GRASP and MODIS products
This section compares AODF and AODC at 550 nm from PARASOL/GRASP (GRASP/HP and GRASP/Models) and MODIS DT algorithms. As discussed earlier, the quantitative fine-mode fraction (η) provided by the DT algorithm can be used to derive AODF and AODC only over ocean. Therefore, the comparison of AODF and AODC over land is between GRASP/HP and GRASP/Models. The seasonal distribution of AODF and AODC is shown in Figs. 25 and 27, respectively. The seasonal differences between GRASP/Models, DT and GRASP/HP are shown in Fig. 26 (AODF) and Fig. 28 (AODC). GRASP/Models AODF is higher than GRASP/HP over dust source and downwind regions, while it is lower than GRASP/HP over biomass burning and urban areas, which is consistent with the validation versus AERONET measurements in Figs. 13–16.
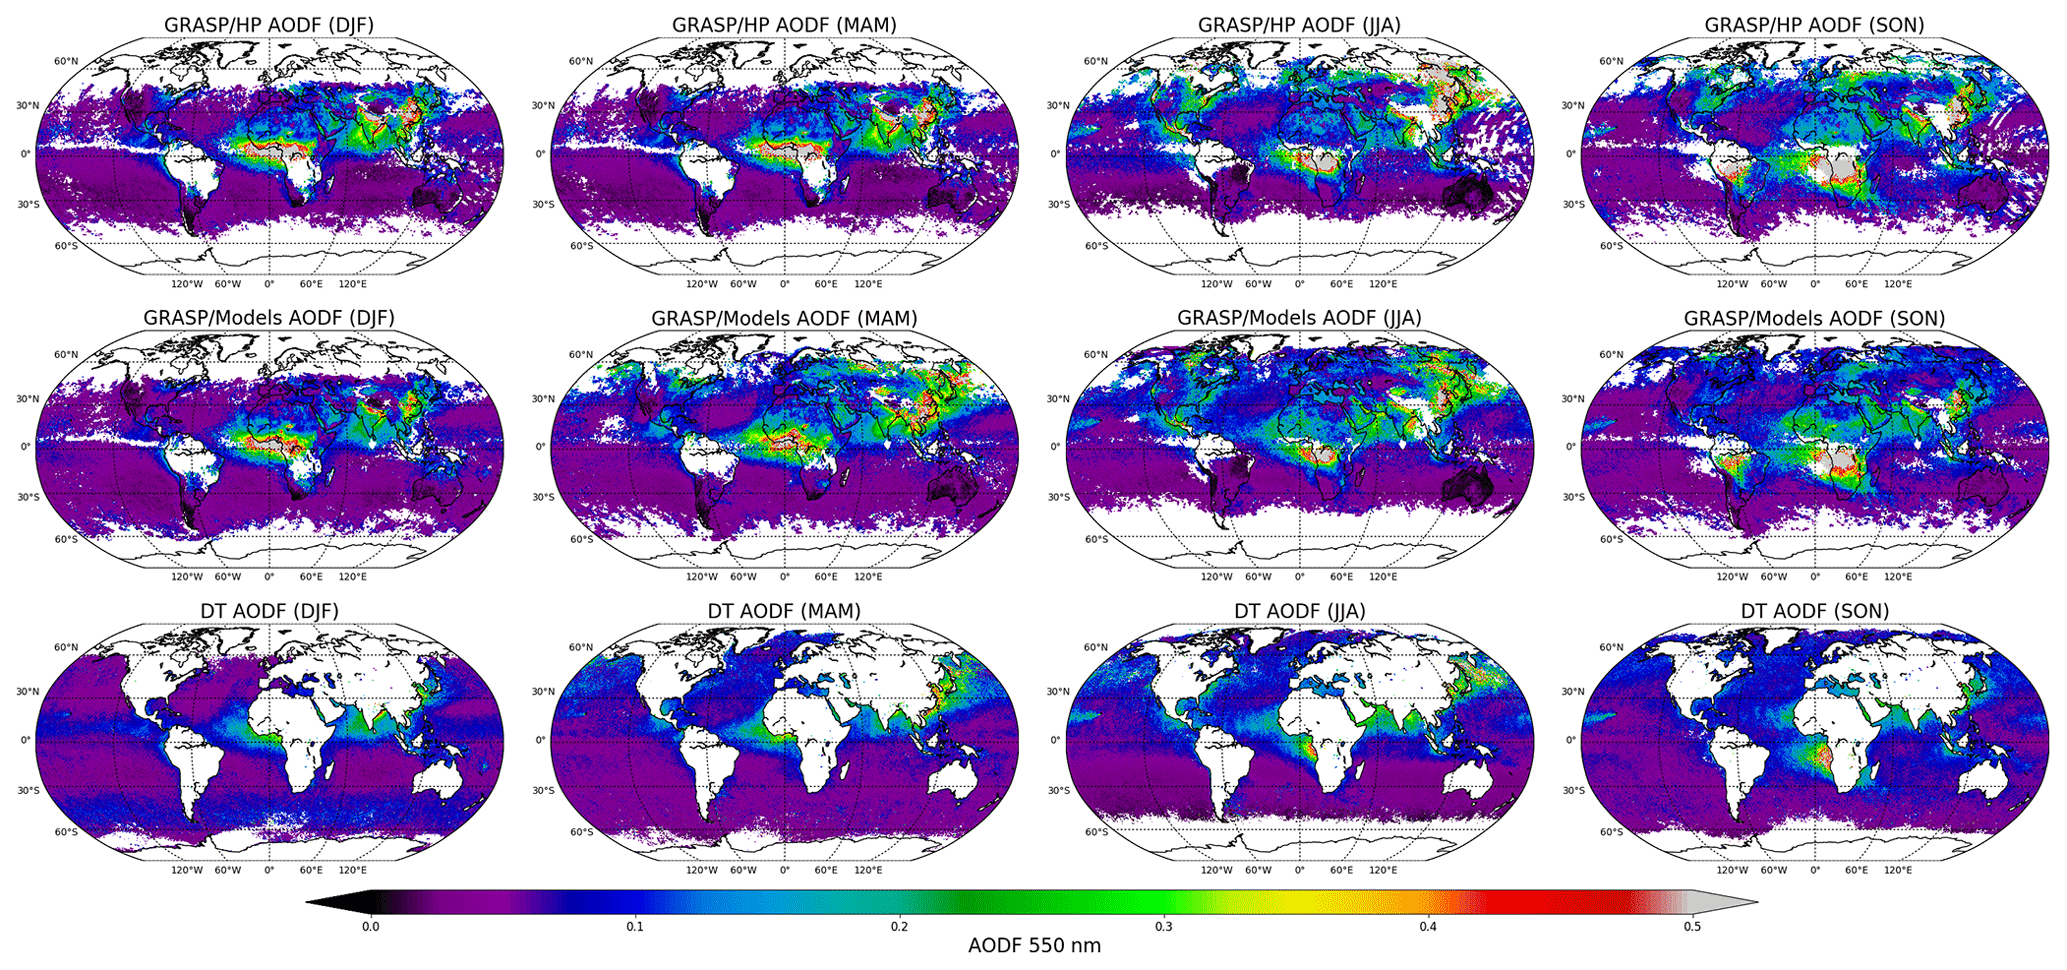
Figure 25Spatial distribution of 0.1∘ × 0.1∘ seasonal AODF (550 nm) from PARASOL (GRASP/HP and GRASP/Models) and MODIS (DT) products.
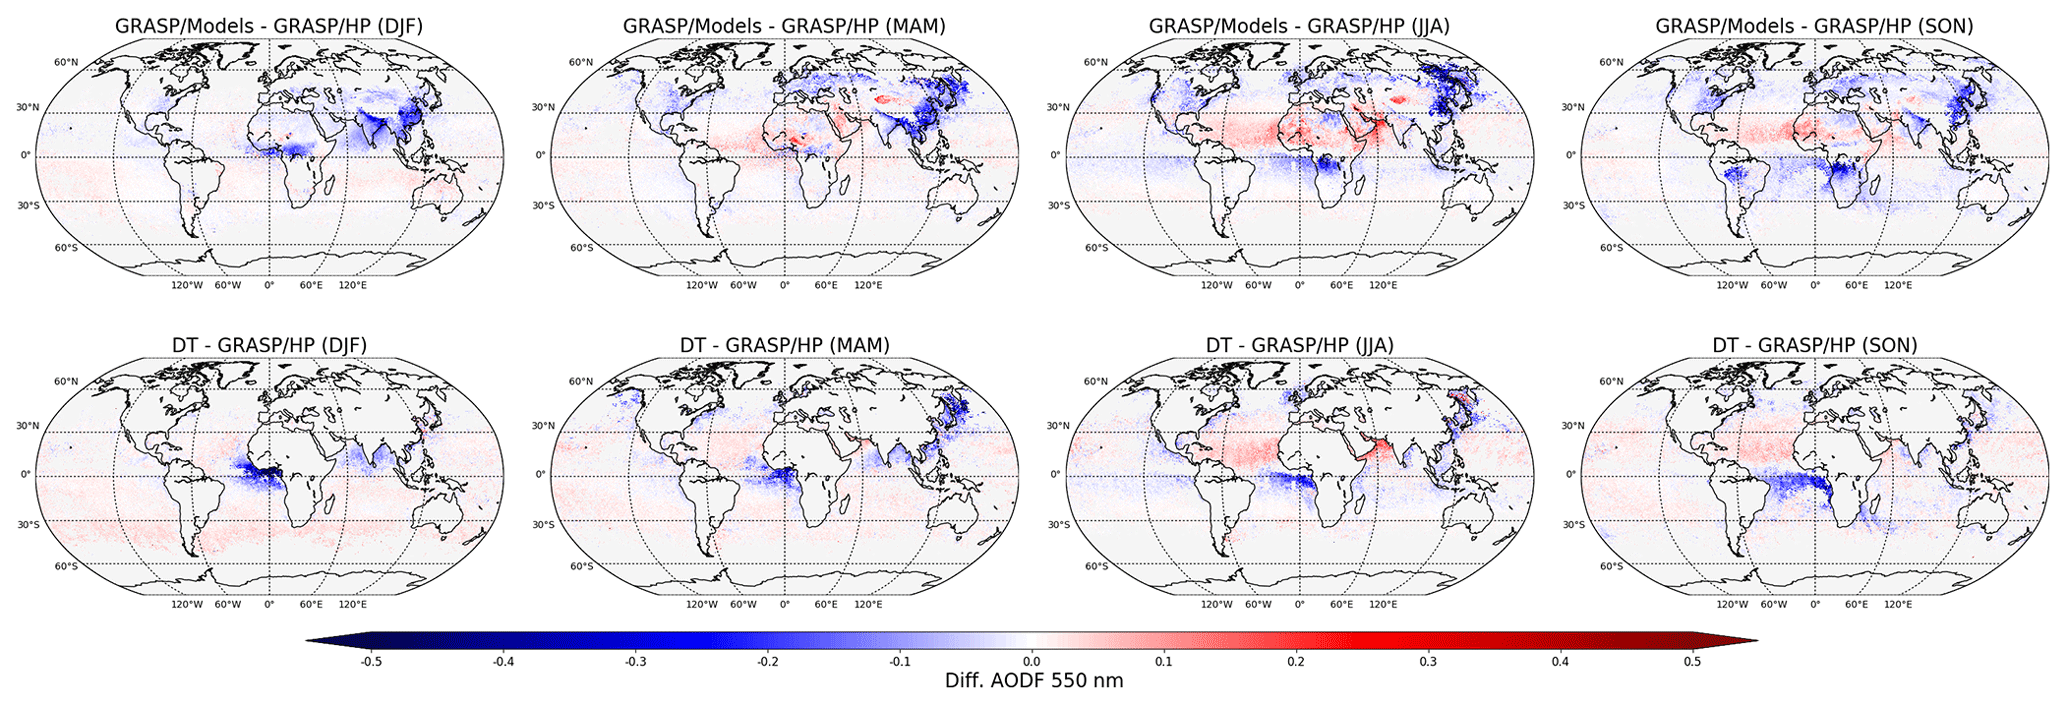
Figure 26Spatial distribution of seasonal AODF (550 nm) differences between PARASOL and MODIS aerosol products, referenced to GRASP/HP.
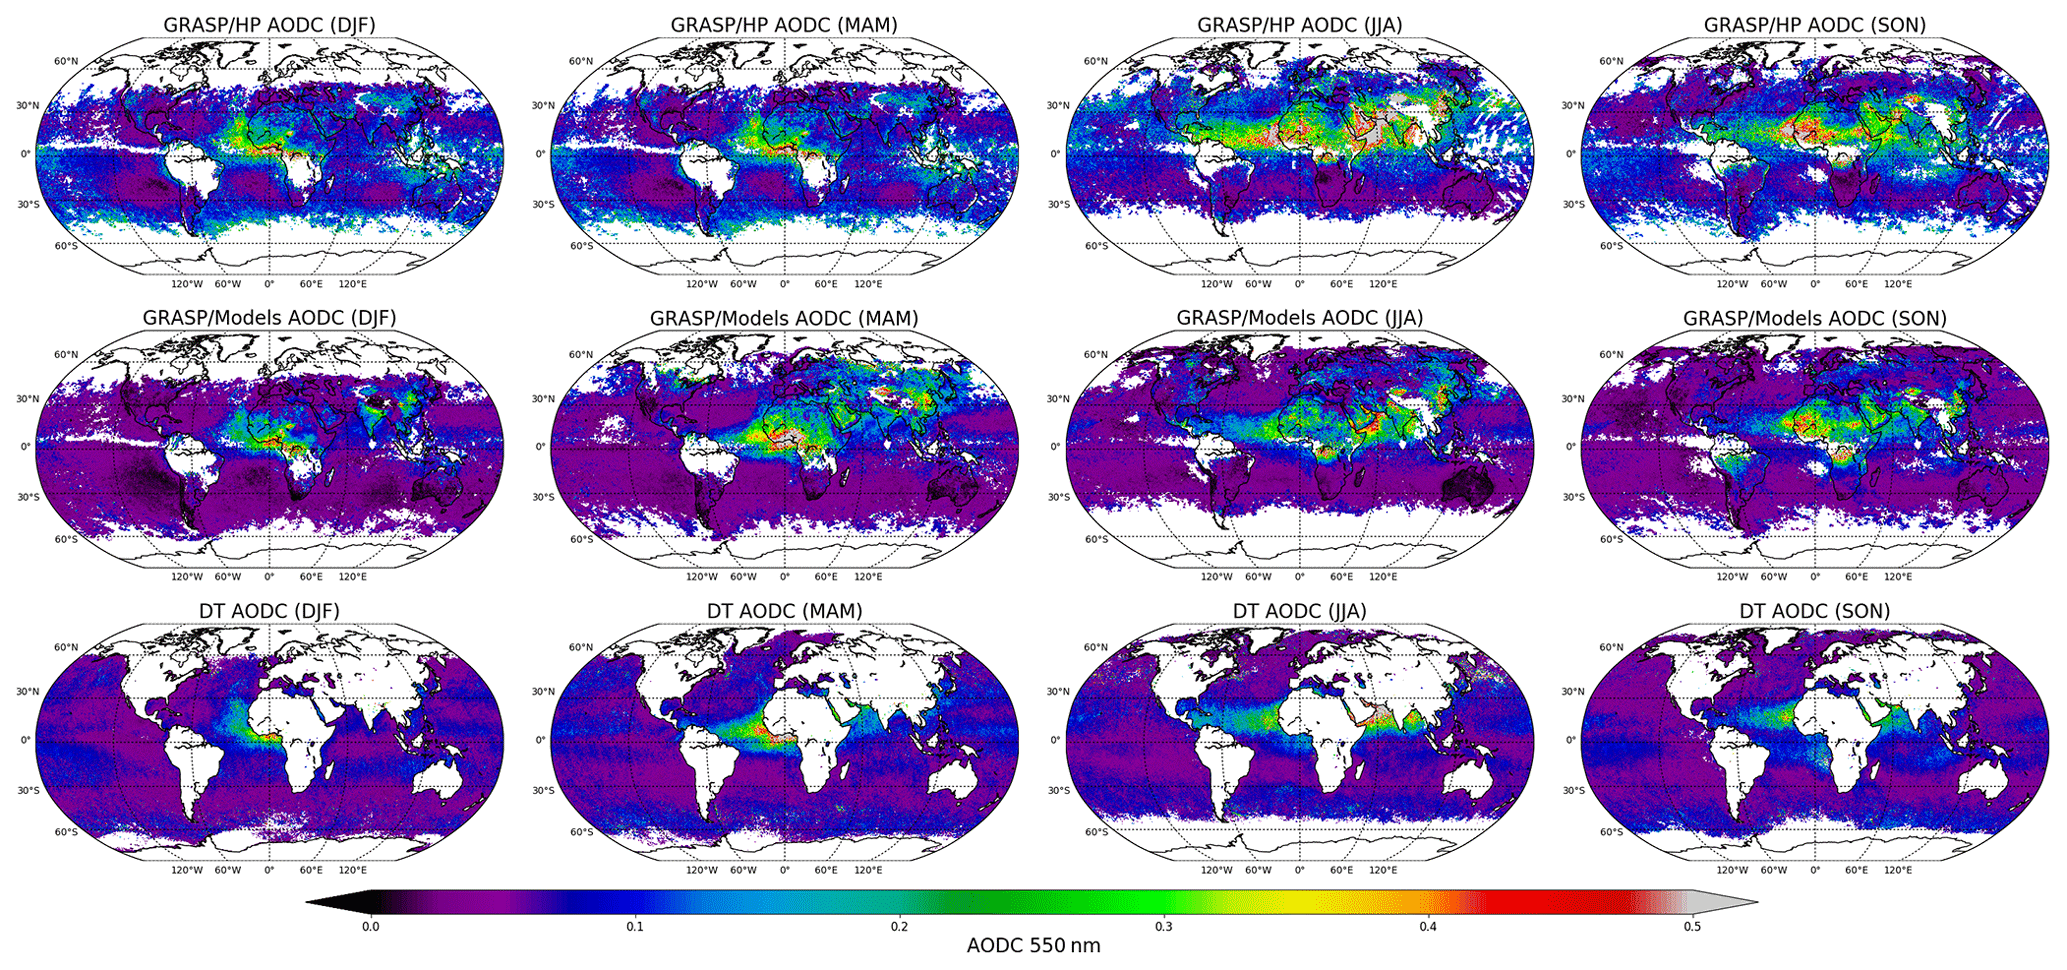
Figure 27The same as Fig. 25, but for AODC (550 nm).
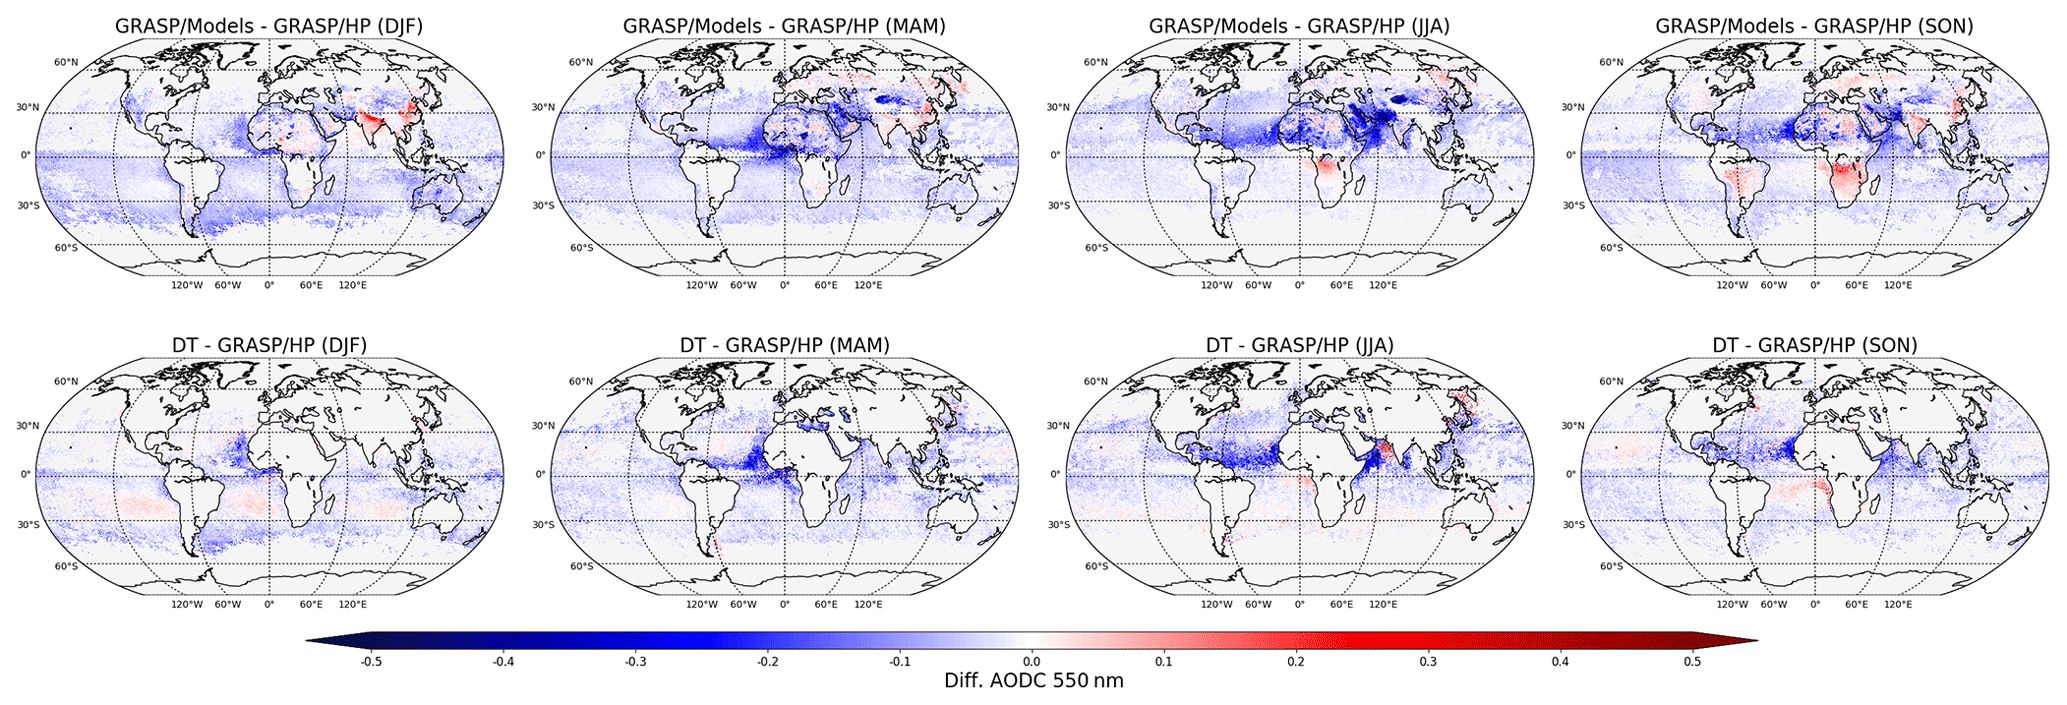
Figure 28The same as Fig. 26, but for AODC (550 nm).
Globally, GRASP/Models and GRASP/HP AODF show a consistent agreement over land (R = 0.87, bias = −0.01) and ocean (R = 0.89, bias = 0.00), as presented in Table 20. MODIS/DT AODF and AODC over ocean have good agreement with GRASP/HP with R 0.86 and 0.84, respectively. GRASP/Models AODC shows a better agreement with GRASP/HP over ocean than over land, while differences are less pronounced, R of 0.89 and 0.71, respectively. As was mentioned above, this tendency can be explained by a stronger sensitivity of the observed signal to aerosol over dark ocean surface. Another interesting tendency is that correlations for AODF over land are generally higher than for AODC, while over ocean the situation is inversed and the correlations are higher for AODC, especially over AERONET. This can probably be explained by the two facts that dominating oceanic aerosol has a pronounced coarse mode and that at the longer wavelengths, where the contribution of coarse mode is the strongest, the ocean is practically dark. The land reflectance is, however, higher than ocean at long wavelengths, even for relatively dark vegetated surfaces. The statistics of pixel-to-pixel comparison (GRASP/HP and GRASP/Models) over different land surface types, as discriminated by different NDVI categories, are also reported in Table 22 (AODF) and Table 23 (AODC).
Table 20Pixel-to-pixel statistical metrics between GRASP/HP AODF with other AODF products; the statistics for only AERONET pixels are presented in brackets.
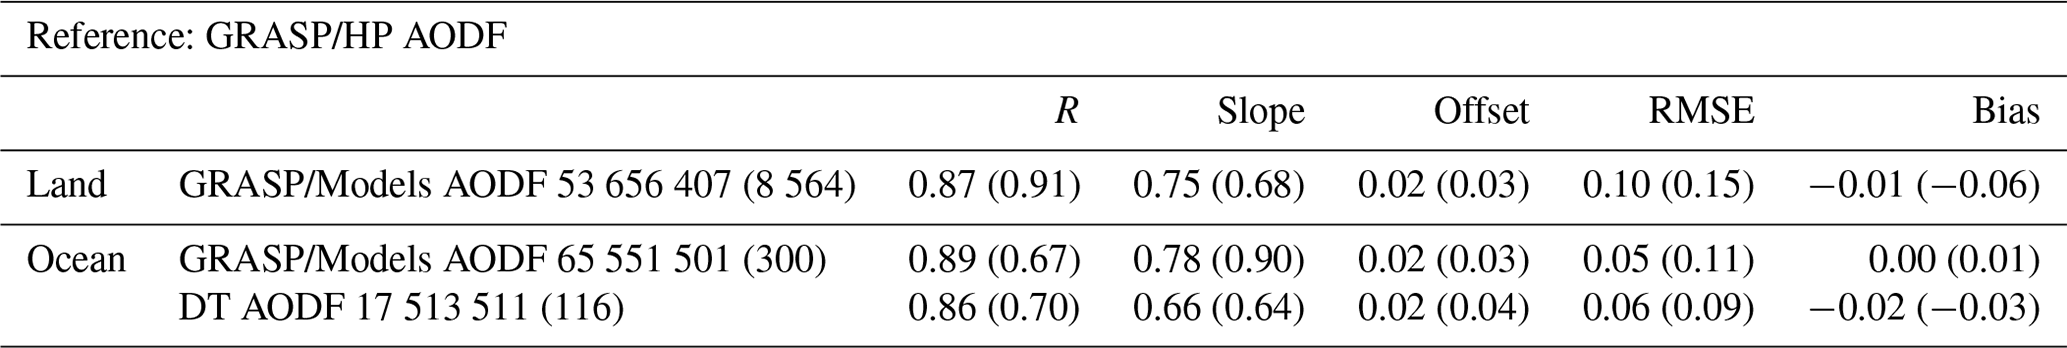
In conclusion, the differences in more detailed aerosol characteristics including AE, AODF and AODC (Tables 18–23) derived from PARASOL and MODIS are pronounced over both land and ocean. This is in contrast to the results for the total AOD from PARASOL and MODIS, which are close over ocean and in reasonable agreement over land. This conclusion can likely be generalized by the fact that retrieval accuracy of detailed aerosol properties is expected to be significantly higher from MAP products than from mono-viewing photometric imagery.
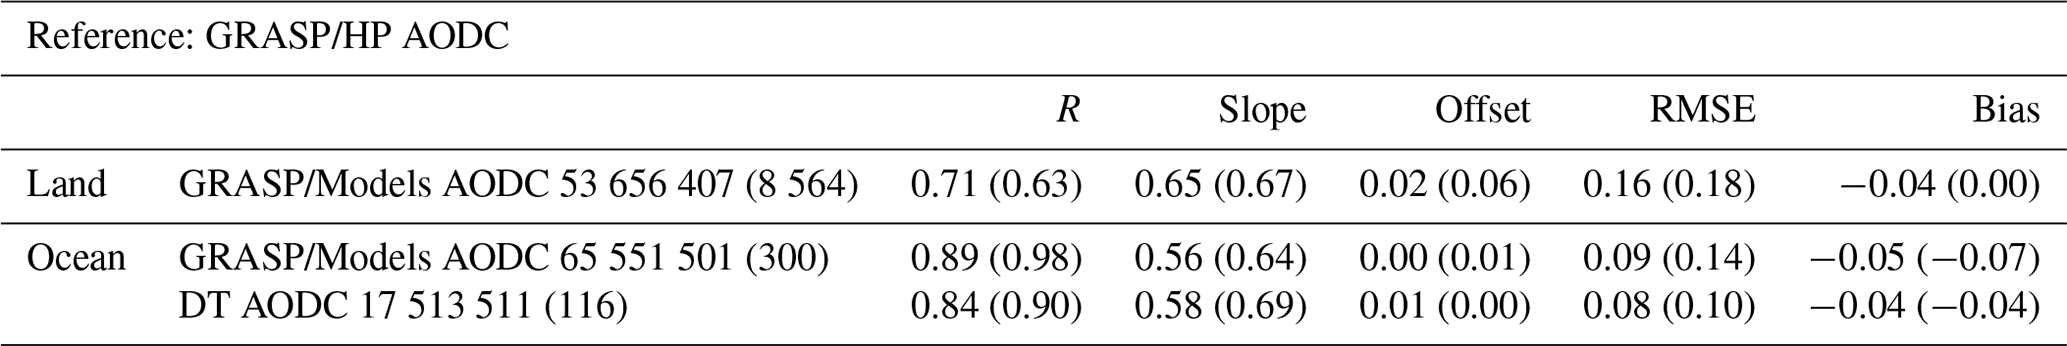
Table 22Pixel-to-pixel statistical metrics between AODF products based on references of GRASP/HP over land pixels with four classes of surface (NDVI < 0.2, 0.2 ≤ NDVI < 0.4, 0.4 ≤ NDVI < 0.6 and NDVI ≥ 0.6); the statistics for only AERONET pixels are presented in brackets.
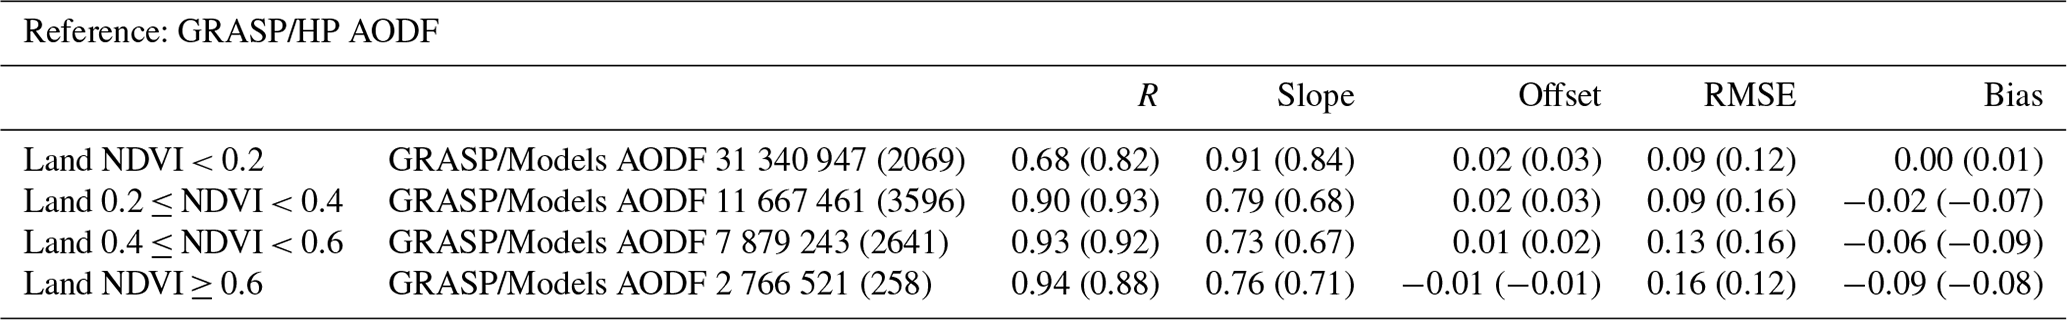
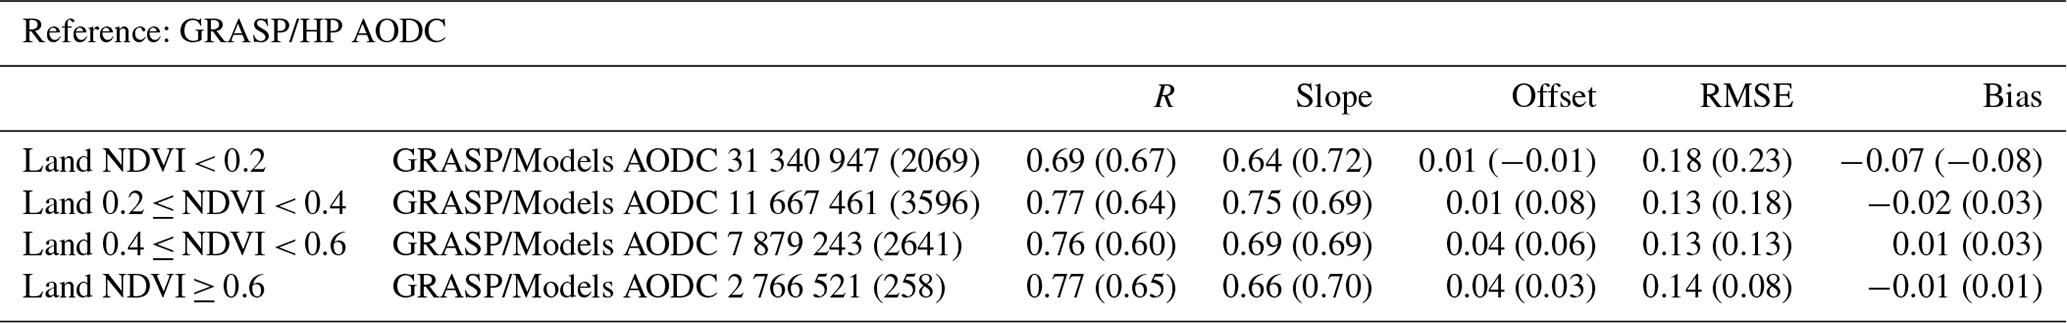
The PARASOL/GRASP Optimized, HP and Models products are publicly available on the official GRASP algorithm website (https://www.grasp-open.com/products, last access: 28 March 2020) and at the AERIS/ICARE Data and Services Center (http://www.icare.univ-lille.fr, last access: 16 October 2018). The dataset used in the current study is registered under http://doi.org/10.5281/zenodo.3887265 (Chen et al., 2020).
The new PARASOL/GRASP products were extensively evaluated using validations against AERONET and comparisons with the original POLDER algorithm (PARASOL/Operational) and MODIS Collection 6 aerosol products. The study was focused on the main aerosol parameters AOD, AE, AODF, AODC, SSA and AAOD included in all PARASOL/GRASP products. Level-3 data quality-filtered and aggregated to 0.1∘ spatial resolution were used. The validation of PARASOL/GRASP spectral products (443–1020 nm) was done for the full PARASOL archive (2005–2013) against all available AERONET products. In addition to the direct validation of the full archive of PARASOL satellite products, the PARASOL/GRASP products were intensively inter-compared with the widely used MODIS Aqua aerosol products from the DT, DB and MAIAC (land only) algorithms and PARASOL/Operational aerosol products for 1 full year, 2008, at 0.1∘ (∼ 10 km) resolution. A global comparison with AERONET for the year 2008 was performed for all products and the results inter-compared. The percentage of the cases when the product of each algorithm showed the best statistical metrics among all the products was used as an indicator for the performance evaluation. In addition, in order to further clarify the level of consistency of the satellite products, the comparisons of seasonal means as well as the global correlations of different satellite products at 0.1∘ or 0.2∘ were comprehensively analyzed for the year 2008. In terms of data volume and geographic extent, the global comparison analyses are more representative of the global aerosol system than the subset based on colocations with AERONET.
The results show that the PARASOL/GRASP retrieval provided reliable aerosol products and important advancement over the reference MODIS aerosol products.
Total AOD.
The PARASOL spectral products including AOD for six wavelengths in the range 443 to 1020 nm agree well with AERONET AOD measurements, e.g., for PARASOL/Models AOD correlation coefficients R are ≥ 0.86 over land and ≥ 0.94 over ocean with bias not exceeding 0.01 over land and 0.02 over ocean for all wavelengths. PARASOL/Optimized and PARASOL/HP also show good agreement with AERONET for spectral AOD; however they have non-negligible bias ∼ 0.05–0.07 spectrally.
-
The AOD (550 nm) products from PARASOL/GRASP (especially GRASP/Models) correlate with AERONET generally similarly or better than the correlations of MODIS AOD (550 nm) results over both ocean and land.
-
Over ocean all PARASOL (including Operational) and MODIS DT algorithms provide comparable and well-correlated retrieval results.
-
Over land PARASOL/GRASP provides full land coverage products that correlate generally better with AERONET; MAIAC shows the highest percentage falling with the GCOS criteria and lowest RMSE among MODIS products, but greater overall bias than either DT or DB.
-
-
The correlation between different PARASOL/GRASP products obtained only over AERONET sites and globally is rather consistent, while the correlations between PARASOL and MODIS products for global analysis over land notably degrade compared for those obtained only over AERONET sites, especially for MAIAC and DB. This finding suggests possible dependence of MODIS retrievals on AERONET regional assumptions of aerosol types or AERONET-assisted atmospheric correction to determine surface reflectance, while GRASP retrievals do not use any location-specific aerosol or surface assumptions.
AE.
-
The PARASOL products agree with AERONET generally similarly to the MODIS DT product over ocean and significantly better over land.
-
All PARASOL/GRASP products (Optimized, HP and Models) provide AE values globally over land and ocean that agree between themselves consistently over AERONET sites and globally.
AODF and AODC.
-
All PARASOL/GRASP products (Optimized, HP and Models) provide spectral AODF and AODC values globally over ocean and all land covers including bright surfaces, and the different products agree between themselves consistently over AERONET sites and globally.
-
The PARASOL/GRASP uniquely provides AODF and AODC with global coverage; PARASOL/Operational provides only AODF over land, while MODIS AODF and AODC products are only available over ocean.
-
The PARASOL/GRASP AODF and AODC products agree with AERONET as well as MODIS (and PARASOL/Operational) and somewhat better over ocean.
Aerosol absorption.
-
All PARASOL/GRASP products (Optimized, HP and Models) provide SSA and AAOD spectral values that are generally not accessible from MODIS and other satellite products.
-
The validation of PARASOL/GRASP shows robust correlation of the retrieved SSA and AAOD spectral values with AERONET (440–1020 nm); correlations increase for retrievals corresponding to the events with higher AOD. For AAOD retrievals overall the bias does not exceed 0.01, suggesting that PARASOL products can be used for making global estimations of AAOD at such a level of uncertainty.
Analysis presented in this paper suggests that the data from PARASOL, and therefore from multi-angle polarimeters (MAP) in general, allow not only solid retrievals of conventional aerosol products (e.g., AOD at 550 nm) but also detailed aerosol properties such as AOD for the whole spectrum of observations (e.g., for PARASOL from 443 to 1020 nm) and aerosol SSA and AAOD that are practically not accessible from mono- and bi-viewing photometric satellite observations, as well as improved AE, AODF and AODC at a global scale. It is also important to emphasize that PARASOL/GRASP retrievals are based on rigorous optimized inversion that searches for statistically optimized fitting in a continuous space of solution without using widely used look-up tables. As a result, it provides a globally consistent product using exactly the same aerosol modeling approach over land and ocean, a unique set of a priori constraints and an initial guess, while retrieving surface reflectance properties simultaneously with aerosol. It is expected that similar types of approaches will become more common and evolve further in the coming era of multiple MAP instruments, e.g., 3MI, DPC, Aerosol-UA, SPEXone and HARP2 (see more in Dubovik et al., 2019). The multi-dimensional aerosol information derived from MAPs is expected to improve quality and utility of atmospheric aerosol characterization from space.
One key finding of this work is that the best retrieval of total AOD is provided by the GRASP/Models approach, which restrains the retrieval to a priori aerosol model components, vastly reducing the number of free parameters for retrieval. The more complex GRASP/HP retrieval with many more retrieval parameters seemed to offer more accurate detailed aerosol parameters such as AE, AODF, AODC and SSA. Future efforts on improving the GRASP retrieval will be aimed at achieving accurate retrievals within one approach. However, this situation also reveals the challenge of a developing unique approach that can provide a retrieval of all parameters with the highest accuracy from MAP observations. Indeed, multi-angular polarimetric observations have sensitivity to different aerosol properties, and therefore the MAP algorithms tend to be designed for the retrieval of a large number of parameters, while in the situations with low aerosol presence the information may be not sufficient to retrieve all parameters reliably. Nonetheless, the presented results demonstrate an overall clear advantage of MAP aerosol retrievals compared with photometric mono-viewing products and support high expectations from future MAP missions with improved instrumental and algorithmic developments.
The GRASP aerosol product evaluation exercise has been implemented and investigated by the GRASP team (OD, DF, PL, TL AL, CC). CC and OD carried out this study and analysis. The results were widely discussed with the POLDER/Operational and MODIS (DT, DB and MAIAC) aerosol team, who are co-authors of this paper. CC and OD wrote the manuscript with contributions from all authors. FD, JD, MA, LB, DM, AH and CF carried through the POLDER data processing based on the GRASP-OPEN software.
The authors declare that they have no conflict of interest.
The authors would like to acknowledge the use of POLDER data, POLDER/PARASOL Level-1 data originally provided by CNES and AERIS/ICARE Data and Services Center (http://www.icare.univ-lille.fr/, last access: 16 October 2018). The PARASOL/GRASP results are generated by Laboratoire d'Optique Atmosphérique and Cloudflight Austria GmbH with the GRASP-OPEN software (https://www.grasp-open.com, last access: 28 March 2020). We would like to thank the AERONET team and all PIs of AERONET stations for maintaining the instruments and making the data available for the community. The authors are also grateful to the MODIS aerosol team, especially the DT, DB and MAIAC groups, for providing the data used in this study. We would like to acknowledge the CaPPA (Chemical and Physical Properties of the Atmosphere) project funded by ANR (ANR-ll-LABX-0005-01), AERIS/ICARE Data and Services Center and GRASP-SAS for data.
This research has been supported by the Agence Nationale de la Recherche (grant no. ANR-ll-LABX-0005-01).
This paper was edited by Alexander Kokhanovsky and reviewed by Gregory L. Schuster, Kirk Knobelspiesse, and Otto Hasekamp.
Bellouin, N., Boucher, O., Haywood, J., and Reddy, M. S.: Global estimate of aerosol direct radiative forcing from satellite measurements, Nature, 438, 1138–1141, https://doi.org/10.1038/nature04348, 2005.
Bellouin, N., Quaas, J., Gryspeerdt, E., Kinne, S., Stier, P., Watson-Parris, D., Boucher, O., Carslaw, K. S., Christensen, M., Daniau, A. L., Dufresne, J. L., Feingold, G., Fiedler, S., Forster, P., Gettelman, A., Haywood, J. M., Lohmann, U., Malavelle, F., Mauritsen, T., McCoy, D. T., Myhre, G., Mülmenstädt, J., Neubauer, D., Possner, A., Rugenstein, M., Sato, Y., Schulz, M., Schwartz, S. E., Sourdeval, O., Storelvmo, T., Toll, V., Winker, D., and Stevens, B.: Bounding Global Aerosol Radiative Forcing of Climate Change, Rev. Geophys., 58, 1–45, https://doi.org/10.1029/2019RG000660, 2020.
Benavent-Oltra, J. A., Román, R., Granados-Muñoz, M. J., Pérez-Ramírez, D., Ortiz-Amezcua, P., Denjean, C., Lopatin, A., Lyamani, H., Torres, B., Guerrero-Rascado, J. L., Fuertes, D., Dubovik, O., Chaikovsky, A., Olmo, F. J., Mallet, M., and Alados-Arboledas, L.: Comparative assessment of GRASP algorithm for a dust event over Granada (Spain) during ChArMEx-ADRIMED 2013 campaign, Atmos. Meas. Tech., 10, 4439–4457, https://doi.org/10.5194/amt-10-4439-2017, 2017.
Benavent-Oltra, J. A., Román, R., Casquero-Vera, J. A., Pérez-Ramírez, D., Lyamani, H., Ortiz-Amezcua, P., Bedoya-Velásquez, A. E., de Arruda Moreira, G., Barreto, Á., Lopatin, A., Fuertes, D., Herrera, M., Torres, B., Dubovik, O., Guerrero-Rascado, J. L., Goloub, P., Olmo-Reyes, F. J., and Alados-Arboledas, L.: Different strategies to retrieve aerosol properties at night-time with the GRASP algorithm, Atmos. Chem. Phys., 19, 14149–14171, https://doi.org/10.5194/acp-19-14149-2019, 2019.
Boucher, O., Randall, D., Artaxo, P., Bretherton, C., Feingold, G., Forster, P., Kerminen, V., Kondo, Y., Liao, H., Lohmann, U., Rasch, P., Satheesh, S., Sherwood, S., Stevens, B., Zhang, X., Qin, D., Plattner, G., Tignor, M., Allen, S., Boschung, J., Nauels, A., Xia, Y., Bex, V., and Midgley, P.: Clouds and Aerosols, in: Climate Change 2013: The Physical Science Basis. Contribution of Working Group I to the Fifth Assessment Report of the Intergovernmental Panel on Climate Change, edited by: Stocker, T. F., Qin, D., Plattner, G.-K., Tignor, M., Allen, S. K., Boschung, J., Nauels, A., and Xia, Y., Cambridge University Press, Cambridge, United Kindom and New York, NY, USA, 2013.
Bréon, F.-M., Vermeulen, A., and Descloitres, J.: An evaluation of satellite aerosol products against sunphotometer measurements, Remote Sens. Environ., 115, 3102–3111, https://doi.org/10.1016/J.RSE.2011.06.017, 2011.
Chen, C., Dubovik, O., Henze, D. K., Lapyonak, T., Chin, M., Ducos, F., Litvinov, P., Huang, X., and Li, L.: Retrieval of desert dust and carbonaceous aerosol emissions over Africa from POLDER/PARASOL products generated by the GRASP algorithm, Atmos. Chem. Phys., 18, 12551–12580, https://doi.org/10.5194/acp-18-12551-2018, 2018.
Chen, C., Dubovik, O., Henze, D. K., Chin, M., Lapyonok, T., Schuster, G. L., Ducos, F., Fuertes, D., Litvinov, P., Li, L., Lopatin, A., Hu, Q., and Torres, B.: Constraining global aerosol emissions using POLDER/PARASOL satellite remote sensing observations, Atmos. Chem. Phys., 19, 14585–14606, https://doi.org/10.5194/acp-19-14585-2019, 2019.
Chen, C., Dubovik, O., Fuertes, D., Litvinov, P., Lapyonok, T., Lopatin, A., Ducos, F., Derimian, Y., Herman, M., Tanré, D., Remer, L. A., Lyapustin, A., Sayer, A. M., Levy, R. C., Hsu, N. C., Descloitres, J., Li, L., Torres, B., Karol, Y., Herrera, M., Herreras, M., Aspetsberger, M., Wanzenboeck, M., Bindreiter, L., Marth, D., Hangler, A., and Federspiel, C.: Dataset used for PARASOL/GRASP aerosol products validation with AERONET and comparison with MODIS, Zenodo, https://doi.org/10.5281/ZENODO.3887265, 2020.
Chu, D. A., Kaufman, Y. J., Ichoku, C., Remer, L. A., Tanré, D., and Holben, B. N.: Validation of MODIS aerosol optical depth retrieval over land, Geophys. Res. Lett., 29, MOD2-1–MOD2-4, https://doi.org/10.1029/2001GL013205, 2002.
de Leeuw, G., Holzer-Popp, T., Bevan, S., Davies, W. H., Descloitres, J., Grainger, R. G., Griesfeller, J., Heckel, A., Kinne, S., Klüser, L., Kolmonen, P., Litvinov, P., Martynenko, D., North, P., Ovigneur, B., Pascal, N., Poulsen, C., Ramon, D., Schulz, M., Siddans, R., Sogacheva, L., Tanré, D., Thomas, G. E., Virtanen, T. H., von Hoyningen Huene, W., Vountas, M., and Pinnock, S.: Evaluation of seven European aerosol optical depth retrieval algorithms for climate analysis, Remote Sens. Environ., 162, 295–315, https://doi.org/10.1016/j.rse.2013.04.023, 2015.
Derimian, Y., Dubovik, O., Huang, X., Lapyonok, T., Litvinov, P., Kostinski, A. B., Dubuisson, P., and Ducos, F.: Comprehensive tool for calculation of radiative fluxes: illustration of shortwave aerosol radiative effect sensitivities to the details in aerosol and underlying surface characteristics, Atmos. Chem. Phys., 16, 5763–5780, https://doi.org/10.5194/acp-16-5763-2016, 2016.
Deschamps, P.-Y., Breon, F.-M., Leroy, M., Podaire, A., Bricaud, A., Buriez, J.-C., and Seze, G.: The POLDER mission: instrument characteristics and scientific objectives, IEEE T. Geosci. Remote S., 32, 598–615, https://doi.org/10.1109/36.297978, 1994.
Deuzé, J. L., Herman, M., Goloub, P., Tanré, D., and Marchand, A.: Characterization of aerosols over ocean from POLDER/ADEOS-1, Geophys. Res. Lett., 26, 1421–1424, https://doi.org/10.1029/1999GL900168, 1999.
Deuzé, J. L., Bréon, F. M., Devaux, C., Goloub, P., Herman, M., Lafrance, B., Maignan, F., Marchand, A., Nadal, F., Perry, G., and Tanré, D.: Remote sensing of aerosols over land surfaces from POLDER-ADEOS-1 polarized measurements, J. Geophys. Res.-Atmos., 106, 4913–4926, https://doi.org/10.1029/2000JD900364, 2001.
Di Noia, A., Hasekamp, O. P., van Diedenhoven, B., and Zhang, Z.: Retrieval of liquid water cloud properties from POLDER-3 measurements using a neural network ensemble approach, Atmos. Meas. Tech., 12, 1697–1716, https://doi.org/10.5194/amt-12-1697-2019, 2019.
Dubovik, O.: Optimization of Numerical Inversion in Photopolarimetric Remote Sensing, in Photopolarimetry in Remote Sensing, Kluwer Academic Publishers, Dordrecht, 65–106, 2004.
Dubovik, O. and King, M. D.: A flexible inversion algorithm for retrieval of aerosol optical properties from Sun and sky radiance measurements, J. Geophys. Res.-Atmos., 105, 20673–20696, https://doi.org/10.1029/2000JD900282, 2000.
Dubovik, O., Smirnov, A., Holben, B. N., King, M. D., Kaufman, Y. J., Eck, T. F., and Slutsker, I.: Accuracy assessments of aerosol optical properties retrieved from Aerosol Robotic Network (AERONET) Sun and sky radiance measurements, J. Geophys. Res.-Atmos., 105, 9791–9806, https://doi.org/10.1029/2000JD900040, 2000.
Dubovik, O., Holben, B. N., Lapyonok, T., Sinyuk, A., Mishchenko, M. I., Yang, P., and Slutsker, I.: Non-spherical aerosol retrieval method employing light scattering by spheroids, Geophys. Res. Lett., 29, 54-1–54-4, https://doi.org/10.1029/2001GL014506, 2002a.
Dubovik, O., Holben, B., Eck, T. F., Smirnov, A., Kaufman, Y. J., King, M. D., Tanré, D., and Slutsker, I.: Variability of Absorption and Optical Properties of Key Aerosol Types Observed in Worldwide Locations, J. Atmos. Sci., 59, 590–608, https://doi.org/10.1175/1520-0469(2002)059<0590:VOAAOP>2.0.CO;2, 2002b.
Dubovik, O., Sinyuk, A., Lapyonok, T., Holben, B. N., Mishchenko, M., Yang, P., Eck, T. F., Volten, H., Muñoz, O., Veihelmann, B., van der Zande, W. J., Leon, J.-F., Sorokin, M., and Slutsker, I.: Application of spheroid models to account for aerosol particle nonsphericity in remote sensing of desert dust, J. Geophys. Res., 111, D11208, https://doi.org/10.1029/2005JD006619, 2006.
Dubovik, O., Herman, M., Holdak, A., Lapyonok, T., Tanré, D., Deuzé, J. L., Ducos, F., Sinyuk, A., and Lopatin, A.: Statistically optimized inversion algorithm for enhanced retrieval of aerosol properties from spectral multi-angle polarimetric satellite observations, Atmos. Meas. Tech., 4, 975–1018, https://doi.org/10.5194/amt-4-975-2011, 2011.
Dubovik, O., Lapyonok, T., Litvinov, P., Herman, M., Fuertes, D., Ducos, F., Torres, B., Derimian, Y., Huang, X., Lopatin, A., Chaikovsky, A., Aspetsberger, M., and Federspiel, C.: GRASP: a versatile algorithm for characterizing the atmosphere, SPIE Newsroom, https://doi.org/10.1117/2.1201408.005558, 2014.
Dubovik, O., Li, Z., Mishchenko, M. I., Tanré, D., Karol, Y., Bojkov, B., Cairns, B., Diner, D. J., Espinosa, W. R., Goloub, P., Gu, X., Hasekamp, O., Hong, J., Hou, W., Knobelspiesse, K. D., Landgraf, J., Li, L., Litvinov, P., Liu, Y., Lopatin, A., Marbach, T., Maring, H., Martins, V., Meijer, Y., Milinevsky, G., Mukai, S., Parol, F., Qiao, Y., Remer, L., Rietjens, J., Sano, I., Stammes, P., Stamnes, S., Sun, X., Tabary, P., Travis, L. D., Waquet, F., Xu, F., Yan, C., and Yin, D.: Polarimetric remote sensing of atmospheric aerosols: Instruments, methodologies, results, and perspectives, J. Quant. Spectrosc. Ra., 224, 474–511, https://doi.org/10.1016/J.JQSRT.2018.11.024, 2019.
Eck, T. F., Holben, B. N., Reid, J. S., Dubovik, O., Smirnov, A., O'Neill, N. T., Slutsker, I., and Kinne, S.: Wavelength dependence of the optical depth of biomass burning, urban, and desert dust aerosols, J. Geophys. Res.-Atmos., 104, 31333–31349, https://doi.org/10.1029/1999JD900923, 1999.
Espinosa, W. R., Remer, L. A., Dubovik, O., Ziemba, L., Beyersdorf, A., Orozco, D., Schuster, G., Lapyonok, T., Fuertes, D., and Martins, J. V.: Retrievals of aerosol optical and microphysical properties from Imaging Polar Nephelometer scattering measurements, Atmos. Meas. Tech., 10, 811–824, https://doi.org/10.5194/amt-10-811-2017, 2017.
Espinosa, W. R., Martins, J. V., Remer, L. A., Dubovik, O., Lapyonok, T., Fuertes, D., Puthukkudy, A., Orozco, D., Ziemba, L., Thornhill, K. L., and Levy, R.: Retrievals of Aerosol Size Distribution, Spherical Fraction, and Complex Refractive Index From Airborne In Situ Angular Light Scattering and Absorption Measurements, J. Geophys. Res.-Atmos., 124, 7997–8024, https://doi.org/10.1029/2018JD030009, 2019.
Fougnie, B., Marbach, T., Lacan, A., Lang, R., Schlüssel, P., Poli, G., Munro, R., and Couto, A. B.: The multi-viewing multi-channel multi-polarisation imager – Overview of the 3MI polarimetric mission for aerosol and cloud characterization, J. Quant. Spectrosc. Ra., 219, 23–32, https://doi.org/10.1016/j.jqsrt.2018.07.008, 2018.
Fu, G. and Hasekamp, O.: Retrieval of aerosol microphysical and optical properties over land using a multimode approach, Atmos. Meas. Tech., 11, 6627–6650, https://doi.org/10.5194/amt-11-6627-2018, 2018.
Fu, G., Hasekamp, O., Rietjens, J., Smit, M., Di Noia, A., Cairns, B., Wasilewski, A., Diner, D., Seidel, F., Xu, F., Knobelspiesse, K., Gao, M., da Silva, A., Burton, S., Hostetler, C., Hair, J., and Ferrare, R.: Aerosol retrievals from different polarimeters during the ACEPOL campaign using a common retrieval algorithm, Atmos. Meas. Tech., 13, 553–573, https://doi.org/10.5194/amt-13-553-2020, 2020.
Gao, M., Zhai, P.-W., Franz, B., Hu, Y., Knobelspiesse, K., Werdell, P. J., Ibrahim, A., Xu, F., and Cairns, B.: Retrieval of aerosol properties and water-leaving reflectance from multi-angular polarimetric measurements over coastal waters, Opt. Express, 26, 2973–2984, https://doi.org/10.1364/OE.26.008968, 2018.
Gao, M., Zhai, P.-W., Franz, B. A., Knobelspiesse, K., Ibrahim, A., Cairns, B., Craig, S. E., Fu, G., Hasekamp, O., Hu, Y., and Werdell, P. J.: Inversion of multiangular polarimetric measurements from the ACEPOL campaign: an application of improving aerosol property and hyperspectral ocean color retrievals, Atmos. Meas. Tech., 13, 3939–3956, https://doi.org/10.5194/amt-13-3939-2020, 2020.
Giles, D. M., Sinyuk, A., Sorokin, M. G., Schafer, J. S., Smirnov, A., Slutsker, I., Eck, T. F., Holben, B. N., Lewis, J. R., Campbell, J. R., Welton, E. J., Korkin, S. V., and Lyapustin, A. I.: Advancements in the Aerosol Robotic Network (AERONET) Version 3 database – automated near-real-time quality control algorithm with improved cloud screening for Sun photometer aerosol optical depth (AOD) measurements, Atmos. Meas. Tech., 12, 169–209, https://doi.org/10.5194/amt-12-169-2019, 2019.
Goloub, P., Tanré, D., Deuzé, J. L., Herman, M., Marchand, A., and Breon, F.-M.: Validation of the first algorithm applied for deriving the aerosol properties over the ocean using the POLDER/ADEOS measurements, IEEE T. Geosci. Remote S., 37, 1586–1596, https://doi.org/10.1109/36.763270, 1999.
Gupta, P., Levy, R. C., Mattoo, S., Remer, L. A., and Munchak, L. A.: A surface reflectance scheme for retrieving aerosol optical depth over urban surfaces in MODIS Dark Target retrieval algorithm, Atmos. Meas. Tech., 9, 3293–3308, https://doi.org/10.5194/amt-9-3293-2016, 2016.
Gupta, P., Remer, L. A., Levy, R. C., and Mattoo, S.: Validation of MODIS 3 km land aerosol optical depth from NASA's EOS Terra and Aqua missions, Atmos. Meas. Tech., 11, 3145–3159, https://doi.org/10.5194/amt-11-3145-2018, 2018.
Hansen, J., Rossow, W., Carlson, B., Lacis, A., Travis, L., Del Genio, A., Fung, I., Cairns, B., Mishchenko, M., and Sato, M.: Low-cost long-term monitoring of global climate forcings and feedbacks, Climatic Change, 31, 247–271, https://doi.org/10.1007/BF01095149, 1995.
Hasekamp, O. P. and Landgraf, J.: Retrieval of aerosol properties over land surfaces: Capabilities of multiple-viewing-angle intensity and polarization measurements, Appl. Optics, 46, 3332–3343, https://doi.org/10.1364/AO.46.003332, 2007.
Hasekamp, O. P., Litvinov, P., and Butz, A.: Aerosol properties over the ocean from PARASOL multiangle photopolarimetric measurements, J. Geophys. Res., 116, D14204, https://doi.org/10.1029/2010JD015469, 2011.
Hasekamp, O. P., Fu, G., Rusli, S. P., Wu, L., Di Noia, A., aan de Brugh, J., Landgraf, J., Martijn Smit, J., Rietjens, J., and van Amerongen, A.: Aerosol measurements by SPEXone on the NASA PACE mission: expected retrieval capabilities, J. Quant. Spectrosc. Ra., 227, 170–184, https://doi.org/10.1016/j.jqsrt.2019.02.006, 2019a.
Hasekamp, O. P., Gryspeerdt, E., and Quaas, J.: Analysis of polarimetric satellite measurements suggests stronger cooling due to aerosol-cloud interactions, Nat. Commun., 10, 1–7, https://doi.org/10.1038/s41467-019-13372-2, 2019b.
Herman, M., Deuzé, J. L., Devaux, C., Goloub, P., Bréon, F. M., and Tanré, D.: Remote sensing of aerosols over land surfaces including polarization measurements and application to POLDER measurements, J. Geophys. Res.-Atmos., 102, 17039–17049, https://doi.org/10.1029/96JD02109, 1997.
Herman, M., Deuzé, J. L., Marchand, A., Roger, B., and Lallart, P.: Aerosol remote sensing from POLDER/ADEOS over the ocean: Improved retrieval using a nonspherical particle model, J. Geophys. Res., 110, D10S02, https://doi.org/10.1029/2004JD004798, 2005.
Herrera, M., Dubovik, O., Torres, B., Lapyonok, T., Litvinov, P., Chen, C., Lopatin, A., Fuertes, D., Bali, J. L., and Restore, P.: Rigorous estimates of the retrieval errors in diverse remote sensing applications provided by GRASP algorithm, AGU Fall Meeting, A211-0020, 1–17 December 2020.
Holben, B. N., Eck, T. F., Slutsker, I., Tanré, D., Buis, J. P., Setzer, A., Vermote, E., Reagan, J. A., Kaufman, Y. J., Nakajima, T., Lavenu, F., Jankowiak, I., and Smirnov, A.: AERONET—A Federated Instrument Network and Data Archive for Aerosol Characterization, Remote Sens. Environ., 66, 1–16, https://doi.org/10.1016/S0034-4257(98)00031-5, 1998.
Holzer-Popp, T., de Leeuw, G., Griesfeller, J., Martynenko, D., Klüser, L., Bevan, S., Davies, W., Ducos, F., Deuzé, J. L., Graigner, R. G., Heckel, A., von Hoyningen-Hüne, W., Kolmonen, P., Litvinov, P., North, P., Poulsen, C. A., Ramon, D., Siddans, R., Sogacheva, L., Tanre, D., Thomas, G. E., Vountas, M., Descloitres, J., Griesfeller, J., Kinne, S., Schulz, M., and Pinnock, S.: Aerosol retrieval experiments in the ESA Aerosol_cci project, Atmos. Meas. Tech., 6, 1919–1957, https://doi.org/10.5194/amt-6-1919-2013, 2013.
Hsu, N. C., Tsay, S.-C., King, M. D., and Herman, J. R.: Aerosol Properties Over Bright-Reflecting Source Regions, IEEE T. Geosci. Remote Sens., 42, 557–569, https://doi.org/10.1109/TGRS.2004.824067, 2004.
Hsu, N. C., Tsay, S.-C., King, M. D., and Herman, J. R.: Deep Blue Retrievals of Asian Aerosol Properties During ACE-Asia, IEEE T. Geosci. Remote S., 44, 3180–3195, https://doi.org/10.1109/TGRS.2006.879540, 2006.
Hsu, N. C., Jeong, M.-J., Bettenhausen, C., Sayer, A. M., Hansell, R., Seftor, C. S., Huang, J., and Tsay, S.-C.: Enhanced Deep Blue aerosol retrieval algorithm: The second generation, J. Geophys. Res.-Atmos., 118, 9296–9315, https://doi.org/10.1002/jgrd.50712, 2013.
Hu, Q., Goloub, P., Veselovskii, I., Bravo-Aranda, J.-A., Popovici, I. E., Podvin, T., Haeffelin, M., Lopatin, A., Dubovik, O., Pietras, C., Huang, X., Torres, B., and Chen, C.: Long-range-transported Canadian smoke plumes in the lower stratosphere over northern France, Atmos. Chem. Phys., 19, 1173–1193, https://doi.org/10.5194/acp-19-1173-2019, 2019.
Ichoku, C., Chu, D. A., Mattoo, S., Kaufman, Y. J., Remer, L. A., Tanré, D., Slutsker, I., and Holben, B. N.: A spatio-temporal approach for global validation and analysis of MODIS aerosol products, Geophys. Res. Lett., 29, 8006, https://doi.org/10.1029/2001GL013206, 2002.
Jethva, H., Torres, O., and Yoshida, Y.: Accuracy assessment of MODIS land aerosol optical thickness algorithms using AERONET measurements over North America, Atmos. Meas. Tech., 12, 4291–4307, https://doi.org/10.5194/amt-12-4291-2019, 2019.
Kahn, R. A., Gaitley, B. J., Martonchik, J. V., Diner, D. J., Crean, K. A., and Holben, B.: Multiangle Imaging Spectroradiometer (MISR) global aerosol optical depth validation based on 2 years of coincident Aerosol Robotic Network (AERONET) observations, J. Geophys. Res., 110, D10S04, https://doi.org/10.1029/2004JD004706, 2005.
Kaufman, Y. J., Tanré, D., Remer, L. A., Vermote, E. F., Chu, A., and Holben, B. N.: Operational remote sensing of tropospheric aerosol over land from EOS moderate resolution imaging spectroradiometer, J. Geophys. Res.-Atmos., 102, 17051–17067, https://doi.org/10.1029/96jd03988, 1997.
Kaufman, Y. J., Tanré, D., and Boucher, O.: A satellite view of aerosols in the climate system, Nature, 419, 215–223, https://doi.org/10.1038/nature01091, 2002.
King, M. D., Kaufman, Y. J., Tanré, D., and Nakajima, T.: Remote Sensing of Tropospheric Aerosols from Space: Past, Present, and Future, B. Am. Meteorol. Soc., 80, 2229–2259, https://doi.org/10.1175/1520-0477(1999)080<2229:RSOTAF>2.0.CO;2, 1999.
Kinne, S., Lohmann, U., Feichter, J., Schulz, M., Timmreck, C., Ghan, S., Easter, R., Chin, M., Ginoux, P., Takemura, T., Tegen, I., Koch, D., Herzog, M., Penner, J., Pitari, G., Holben, B., Eck, T., Smirnov, A., Dubovik, O., Slutsker, I., Tanré, D., Torres, O., Mishchenko, M., Geogdzhayev, I., Chu, D. A., and Kaufman, Y.: Monthly averages of aerosol properties: A global comparison among models, satellite data, and AERONET ground data, J. Geophys. Res., 108, 4634, https://doi.org/10.1029/2001JD001253, 2003.
Kinne, S., O'Donnel, D., Stier, P., Kloster, S., Zhang, K., Schmidt, H., Rast, S., Giorgetta, M., Eck, T. F., and Stevens, B.: MAC-v1: A new global aerosol climatology for climate studies, J. Adv. Model. Earth Sy., 5, 704–740, https://doi.org/10.1002/jame.20035, 2013.
Knobelspiesse, K., Cairns, B., Mishchenko, M., Chowdhary, J., Tsigaridis, K., van Diedenhoven, B., Martin, W., Ottaviani, M., and Alexandrov, M.: Analysis of fine-mode aerosol retrieval capabilities by different passive remote sensing instrument designs, Opt. Express, 20, 21457, https://doi.org/10.1364/oe.20.021457, 2012.
Knobelspiesse, K., Barbosa, H. M. J., Bradley, C., Bruegge, C., Cairns, B., Chen, G., Chowdhary, J., Cook, A., Di Noia, A., van Diedenhoven, B., Diner, D. J., Ferrare, R., Fu, G., Gao, M., Garay, M., Hair, J., Harper, D., van Harten, G., Hasekamp, O., Helmlinger, M., Hostetler, C., Kalashnikova, O., Kupchock, A., Longo De Freitas, K., Maring, H., Martins, J. V., McBride, B., McGill, M., Norlin, K., Puthukkudy, A., Rheingans, B., Rietjens, J., Seidel, F. C., da Silva, A., Smit, M., Stamnes, S., Tan, Q., Val, S., Wasilewski, A., Xu, F., Xu, X., and Yorks, J.: The Aerosol Characterization from Polarimeter and Lidar (ACEPOL) airborne field campaign, Earth Syst. Sci. Data, 12, 2183–2208, https://doi.org/10.5194/essd-12-2183-2020, 2020.
Kokhanovsky, A. A., Davis, A. B., Cairns, B., Dubovik, O., Hasekamp, O. P., Sano, I., Mukai, S., Rozanov, V. V., Litvinov, P., Lapyonok, T., Kolomiets, I. S., Oberemok, Y. A., Savenkov, S., Martin, W., Wasilewski, A., Di Noia, A., Stap, F. A., Rietjens, J., Xu, F., Natraj, V., Duan, M., Cheng, T., and Munro, R.: Space-based remote sensing of atmospheric aerosols: The multi-angle spectro-polarimetric frontier, Earth-Sci. Rev., 145, 85–116, https://doi.org/10.1016/j.earscirev.2015.01.012, 2015.
Lacagnina, C., Hasekamp, O. P., Bian, H., Curci, G., Myhre, G., van Noije, T., Schulz, M., Skeie, R. B., Takemura, T., and Zhang, K.: Aerosol single-scattering albedo over the global oceans: Comparing PARASOL retrievals with AERONET, OMI, and AeroCom models estimates, J. Geophys. Res., 120, 9814–9836, https://doi.org/10.1002/2015JD023501, 2015.
Lacagnina, C., Hasekamp, O. P., and Torres, O.: Direct radiative effect of aerosols based on PARASOL and OMI satellite observations, J. Geophys. Res., 122, 2366–2388, https://doi.org/10.1002/2016JD025706, 2017.
Levy, R. C., Remer, L. A., Tanré, D., Kaufman, Y. J., Ichoku, C., Holben, B. N., Livingston, J. M., Russell, P. B., and Maring, H.: Evaluation of the moderate-resolution imaging spectroradiometer (MODIS) retrievals of dust aerosol over the ocean during PRIDE, J. Geophys. Res.-Atmos., 108, 8594, https://doi.org/10.1029/2002jd002460, 2003.
Levy, R. C., Remer, L. A., and Dubovik, O.: Global aerosol optical properties and application to Moderate Resolution Imaging Spectroradiometer aerosol retrieval over land, J. Geophys. Res.-Atmos., 112, https://doi.org/10.1029/2006JD007815, 2007a.
Levy, R. C., Remer, L. A., Mattoo, S., Vermote, E. F., and Kaufman, Y. J.: Second-generation operational algorithm: Retrieval of aerosol properties over land from inversion of Moderate Resolution Imaging Spectroradiometer spectral reflectance, J. Geophys. Res.-Atmos., 112, https://doi.org/10.1029/2006JD007811, 2007b.
Levy, R. C., Remer, L. A., Kleidman, R. G., Mattoo, S., Ichoku, C., Kahn, R., and Eck, T. F.: Global evaluation of the Collection 5 MODIS dark-target aerosol products over land, Atmos. Chem. Phys., 10, 10399–10420, https://doi.org/10.5194/acp-10-10399-2010, 2010.
Levy, R. C., Mattoo, S., Munchak, L. A., Remer, L. A., Sayer, A. M., Patadia, F., and Hsu, N. C.: The Collection 6 MODIS aerosol products over land and ocean, Atmos. Meas. Tech., 6, 2989–3034, https://doi.org/10.5194/amt-6-2989-2013, 2013.
Levy, R. C., Mattoo, S., Sawyer, V., Shi, Y., Colarco, P. R., Lyapustin, A. I., Wang, Y., and Remer, L. A.: Exploring systematic offsets between aerosol products from the two MODIS sensors, Atmos. Meas. Tech., 11, 4073–4092, https://doi.org/10.5194/amt-11-4073-2018, 2018.
Li, J., Kahn, R. A., Wei, J., Carlson, B. E., Lacis, A. A., Li, Z., Li, X., Dubovik, O., and Nakajima, T.: Synergy of Satellite and Ground-Based Aerosol Optical Depth Measurements Using an Ensemble Kalman Filter Approach, J. Geophys. Res.-Atmos., 125, e2019JD031884, https://doi.org/10.1029/2019JD031884, 2020.
Li, L., Dubovik, O., Derimian, Y., Schuster, G. L., Lapyonok, T., Litvinov, P., Ducos, F., Fuertes, D., Chen, C., Li, Z., Lopatin, A., Torres, B., and Che, H.: Retrieval of aerosol components directly from satellite and ground-based measurements, Atmos. Chem. Phys., 19, 13409–13443, https://doi.org/10.5194/acp-19-13409-2019, 2019.
Li, L., Che, H., Derimian, Y., Dubovik, O., Schuster, G. L., Chen, C., Li, Q., Wang, Y., Guo, B., Zhang, X., Key, S., Weather, S., Lac, C., and Academy, C.: Remote Sensing of Environment Retrievals of fine mode light-absorbing carbonaceous aerosols from POLDER/PARASOL observations over East and South Asia, Remote Sens. Environ., 247, 111913, https://doi.org/10.1016/j.rse.2020.111913, 2020a.
Li, L., Che, H., Derimian, Y., Dubovik, O., and Luan, Q.: Climatology of fine and coarse mode aerosol optical thickness over East and South Asia derived from POLDER / PARASOL satellite, J. Geophys. Res.-Atmos., 125, e2020JD032665, https://doi.org/10.1029/2020JD032665, 2020b.
Li, X. and Strahler, A. H.: Geometric-Optical Bidirectional Reflectance Modeling of the Discrete Crown Vegetation Canopy: Effect of Crown Shape and Mutual Shadowing, IEEE T. Geosci. Remote S., 30, 276–292, https://doi.org/10.1109/36.134078, 1992.
Li, Z., Zhao, X., Kahn, R., Mishchenko, M., Remer, L., Lee, K.-H., Wang, M., Laszlo, I., Nakajima, T., and Maring, H.: Uncertainties in satellite remote sensing of aerosols and impact on monitoring its long-term trend: a review and perspective, Ann. Geophys., 27, 2755–2770, https://doi.org/10.5194/angeo-27-2755-2009, 2009.
Li, Z., Hou, W., Hong, J., Zheng, F., Luo, D., Wang, J., Gu, X., and Qiao, Y.: Directional Polarimetric Camera (DPC): Monitoring aerosol spectral optical properties over land from satellite observation, J. Quant. Spectrosc. Ra., 218, 21–37, https://doi.org/10.1016/J.JQSRT.2018.07.003, 2018.
Litvinov, P., Hasekamp, O., and Cairns, B.: Models for surface reflection of radiance and polarized radiance: Comparison with airborne multi-angle photopolarimetric measurements and implications for modeling top-of-atmosphere measurements, Remote Sens. Environ., 115, 781–792, https://doi.org/10.1016/J.RSE.2010.11.005, 2011a.
Litvinov, P., Hasekamp, O., Cairns, B., and Mishchenko, M.: Semi-empirical BRDF and BPDF models applied to the problem of aerosol retrievals over land: testing on airborne data and implications for modeling of top-of-atmosphere measurements, in: Polarimetric Detection, Characterization and Remote Sensing, Springer, Dordrecht, 2011b.
Liu, L., Mishchenko, M. I., Geogdzhayev, I., Smirnov, A., Sakerin, S. M., Kabanov, D. M., and Ershov, O. A.: Global validation of two-channel AVHRR aerosol optical thickness retrievals over the oceans, J. Quant. Spectrosc. Ra., 88, 97–109, https://doi.org/10.1016/j.jqsrt.2004.03.031, 2004.
Lopatin, A., Dubovik, O., Chaikovsky, A., Goloub, P., Lapyonok, T., Tanré, D., and Litvinov, P.: Enhancement of aerosol characterization using synergy of lidar and sun-photometer coincident observations: the GARRLiC algorithm, Atmos. Meas. Tech., 6, 2065–2088, https://doi.org/10.5194/amt-6-2065-2013, 2013.
Lyapustin, A., Wang, Y., Laszlo, I., Kahn, R., Korkin, S., Remer, L., Levy, R., and Reid, J. S.: Multiangle implementation of atmospheric correction (MAIAC): 2. Aerosol algorithm, J. Geophys. Res., 116, D03211, https://doi.org/10.1029/2010JD014986, 2011a.
Lyapustin, A., Wang, Y., Korkin, S., and Huang, D.: MODIS Collection 6 MAIAC algorithm, Atmos. Meas. Tech., 11, 5741–5765, https://doi.org/10.5194/amt-11-5741-2018, 2018.
Lyapustin, A. I., Martonchik, J. V., Wang, Y., Laszlo, I., and Korkin, S.: Multiangle implementation of atmospheric correction (MAIAC): 1. Radiative transfer basis and look-up tables, J. Geophys. Res., 116, D03210, https://doi.org/10.1029/2010JD014985, 2011b.
Lyapustin, A. I., Wang, Y., Laszlo, I., Hilker, T., Hall, F. G., Seller, P. J., Tucker, C. J., and Korin, S. V.: Multi-angle implementation of atmospheric correction for MODIS (MAIAC): 3. Atmospheric correction, Remote Sens. Environ., 127, 385–393, https://doi.org/10.1016/J.RSE.2012.09.002, 2012.
Maignan, F., Bréon, F. M., Fédèle, E., and Bouvier, M.: Polarized reflectances of natural surfaces: Spaceborne measurements and analytical modeling, Remote Sens. Environ., 113, 2642–2650, https://doi.org/10.1016/j.rse.2009.07.022, 2009.
Milinevsky, G., Oberemok, Y., Syniavskyi, I., Bovchaliuk, A., Kolomiets, I., Fesianov, I., and Wang, Y.: Calibration model of polarimeters on board the Aerosol-UA space mission, J. Quant. Spectrosc. Ra., 229, 92–105, https://doi.org/10.1016/j.jqsrt.2019.03.007, 2019.
Mishchenko, M. I. and Travis, L. D.: Satellite retrieval of aerosol properties over the ocean using measurements of reflected sunlight: Effect of instrumental errors and aerosol absorption, J. Geophys. Res.-Atmos., 102, 13543–13553, https://doi.org/10.1029/97JD01124, 1997.
Mishchenko, M. I., Cairns, B., Hansen, J. E., Travis, L. D., Burg, R., Kaufman, Y. J., Martins, J. V., and Shettle, E. P.: Monitoring of aerosol forcing of climate from space: Analysis of measurement requirements, J. Quant. Spectrosc. Ra., 88, 149–161, https://doi.org/10.1016/j.jqsrt.2004.03.030, 2004.
Myhre, G.: Consistency between satellite-derived and modeled estimates of the direct aerosol effect, Science, 325, 187–90, https://doi.org/10.1126/science.1174461, 2009.
O'Neill, N. T., Eck, T. F., Smirnov, A., Holben, B. N., and Thulasiraman, S.: Spectral discrimination of coarse and fine mode optical depth, J. Geophys. Res.-Atmos., 108, 4559, https://doi.org/10.1029/2002jd002975, 2003.
Parkinson, C. L.: Aqua: An earth-observing satellite mission to examine water and other climate variables, IEEE T. Geosci. Remote S., 41, 173–183, https://doi.org/10.1109/TGRS.2002.808319, 2003.
Popp, T., de Leeuw, G., Bingen, C., Brühl, C., Capelle, V., Chedin, A., Clarisse, L., Dubovik, O., Grainger, R., Griesfeller, J., Heckel, A., Kinne, S., Klüser, L., Kosmale, M., Kolmonen, P., Lelli, L., Litvinov, P., Mei, L., North, P., Pinnock, S., Povey, A., Robert, C., Schulz, M., Sogacheva, L., Stebel, K., Stein Zweers, D., Thomas, G., Tilstra, L., Vandenbussche, S., Veefkind, P., Vountas, M., and Xue, Y.: Development, Production and Evaluation of Aerosol Climate Data Records from European Satellite Observations (Aerosol_cci), Remote Sens., 8, 421, https://doi.org/10.3390/rs8050421, 2016.
Puthukkudy, A., Martins, J. V., Remer, L. A., Xu, X., Dubovik, O., Litvinov, P., McBride, B., Burton, S., and Barbosa, H. M. J.: Retrieval of aerosol properties from Airborne Hyper-Angular Rainbow Polarimeter (AirHARP) observations during ACEPOL 2017, Atmos. Meas. Tech., 13, 5207–5236, https://doi.org/10.5194/amt-13-5207-2020, 2020.
Remer, L. A., Tanré, D., Kaufman, Y. J., Ichoku, C., Mattoo, S., Levy, R., Chu, D. A., Holben, B., Dubovik, O., Smirnov, A., Martins, J. V., Li, R. R., and Ahmad, Z.: Validation of MODIS aerosol retrieval over ocean, Geophys. Res. Lett., 29, 8008, https://doi.org/10.1029/2001GL013204, 2002.
Remer, L. A., Kaufman, Y. J., Tanré, D., Mattoo, S., Chu, D. A., Martins, J. V., Li, R.-R., Ichoku, C., Levy, R. C., Kleidman, R. G., Eck, T. F., Vermote, E., Holben, B. N., Remer, L. A., Kaufman, Y. J., Tanré, D., Mattoo, S., Chu, D. A., Martins, J. V., Li, R.-R., Ichoku, C., Levy, R. C., Kleidman, R. G., Eck, T. F., Vermote, E., and Holben, B. N.: The MODIS Aerosol Algorithm, Products, and Validation, J. Atmos. Sci., 62, 947–973, https://doi.org/10.1175/JAS3385.1, 2005.
Remer, L. A., Kleidman, R. G., Levy, R. C., Kaufman, Y. J., Tanré, D., Mattoo, S., Martins, J. V., Ichoku, C., Koren, I., Yu, H., and Holben, B. N.: Global aerosol climatology from the MODIS satellite sensors, J. Geophys. Res., 113, D14S07, https://doi.org/10.1029/2007JD009661, 2008.
Remer, L. A., Davis, A. B., Mattoo, S., Levy, R. C., Kalashnikova, O. V., Coddington, O., Chowdhary, J., Knobelspiesse, K., Xu, X., Ahmad, Z., Boss, E., Cairns, B., Dierssen, H. M., Diner, D. J., Franz, B., Frouin, R., Gao, B.-C., Ibrahim, A., Martins, J. V., Omar, A. H., Torres, O., Xu, F., and Zhai, P.-W.: Retrieving Aerosol Characteristics From the PACE Mission, Part 1: Ocean Color Instrument, Front. Earth Sci., 7, 152, https://doi.org/10.3389/feart.2019.00152, 2019.
Remer, L. A., Levy, R. C., Mattoo, S., Tanr, D., Gupta, P., Shi, Y., Sawyer, V., Munchak, L. A., Zhou, Y., Kim, M., Ichoku, C., Patadia, F., Li, R., and Gass, S.: The Dark Target Algorithm for Observing the Global Aerosol System?: Past, Present, and Future, Remote Sens., 12, 2900, https://doi.org/10.3390/rs12182900, 2020.
Román, R., Torres, B., Fuertes, D., Cachorro, V. E., Dubovik, O., Toledano, C., Cazorla, A., Barreto, A., Bosch, J. L., Lapyonok, T., González, R., Goloub, P., Perrone, M. R., Olmo, F. J., de Frutos, A., and Alados-Arboledas, L.: Remote sensing of lunar aureole with a sky camera: Adding information in the nocturnal retrieval of aerosol properties with GRASP code, Remote Sens. Environ., 196, 238–252, https://doi.org/10.1016/J.RSE.2017.05.013, 2017.
Ross, J.: The radiation regime and architecture of plant stands, Dr W. Junk Publishers, The Hague, Netherlands. 1981.
Sato, M., Hansen, J., Koch, D., Lacis, A., Ruedy, R., Dubovik, O., Holben, B., Chin, M., and Novakov, T.: Global atmospheric black carbon inferred from AERONET, P. Natl. Acad. Sci. USA, 100, 6319–6324, https://doi.org/10.1073/pnas.0731897100, 2003.
Sayer, A. M. and Knobelspiesse, K. D.: How should we aggregate data? Methods accounting for the numerical distributions, with an assessment of aerosol optical depth, Atmos. Chem. Phys., 19, 15023–15048, https://doi.org/10.5194/acp-19-15023-2019, 2019.
Sayer, A. M., Hsu, N. C., Bettenhausen, C., and Jeong, M.-J.: Validation and uncertainty estimates for MODIS Collection 6 “Deep Blue” aerosol data, J. Geophys. Res.-Atmos., 118, 7864–7872, https://doi.org/10.1002/jgrd.50600, 2013.
Sayer, A. M., Munchak, L. A., Hsu, N. C., Levy, R. C., Bettenhausen, C., and Jeong, M.-J.: MODIS Collection 6 aerosol products: Comparison between Aqua's e-Deep Blue, Dark Target, and “merged” data sets, and usage recommendations, J. Geophys. Res.-Atmos., 119, 13965–13989, https://doi.org/10.1002/2014JD022453, 2014.
Sayer, A. M., Hsu, N. C., Bettenhausen, C., Jeong, M. J., and Meister, G.: Effect of MODIS Terra radiometric calibration improvements on Collection 6 Deep Blue aerosol products: Validation and Terra/Aqua consistency, J. Geophys. Res.-Atmos., 120, 12157–12174, https://doi.org/10.1002/2015JD023878, 2015.
Sayer, A. M., Hsu, N. C., Lee, J., Kim, W. V., Dubovik, O., Dutcher, S. T., Huang, D., Litvinov, P., Lyapustin, A., Tackett, J. L., and Winker, D. M.: Validation of SOAR VIIRS Over Water Aerosol Retrievals and Context Within the Global Satellite Aerosol Data Record, J. Geophys. Res.-Atmos., 123, 2018JD029465, https://doi.org/10.1029/2018JD029465, 2018.
Sayer, A. M., Hsu, N. C., Lee, J., Kim, W. V., and Dutcher, S. T.: Validation, Stability, and Consistency of MODIS Collection 6.1 and VIIRS Version 1 Deep Blue Aerosol Data Over Land, J. Geophys. Res.-Atmos., 124, 4658–4688, https://doi.org/10.1029/2018JD029598, 2019.
Schoeberl, M. R., Douglass, A. R., Hilsenrath, E., Bhartia, P. K., Beer, R., Waters, J. W., Gunson, M. R., Froidevaux, L., Gille, J. C., Barnett, J. J., Levelt, P. F., and DeCola, P.: Overview of the EOS aura mission, IEEE T. Geosci. Remote S., 44, 1066–1072, https://doi.org/10.1109/TGRS.2005.861950, 2006.
Schuster, G. L., Espinosa, W. R., Ziemba, L. D., Beyersdorf, A. J., Rocha-Lima, A., Anderson, B. E., Martins, J. V., Dubovik, O., Ducos, F., Fuertes, D., Lapyonok, T., Shook, M., Derimian, Y., and Moore, R. H.: A Laboratory Experiment for the Statistical Evaluation of Aerosol Retrieval (STEAR) Algorithms, Remote Sens., 11, 498, https://doi.org/10.3390/rs11050498, 2019.
Schutgens, N., Tsyro, S., Gryspeerdt, E., Goto, D., Weigum, N., Schulz, M., and Stier, P.: On the spatio-temporal representativeness of observations, Atmos. Chem. Phys., 17, 9761–9780, https://doi.org/10.5194/acp-17-9761-2017, 2017.
Sinyuk, A., Holben, B. N., Eck, T. F., Giles, D. M., Slutsker, I., Korkin, S., Schafer, J. S., Smirnov, A., Sorokin, M., and Lyapustin, A.: The AERONET Version 3 aerosol retrieval algorithm, associated uncertainties and comparisons to Version 2, Atmos. Meas. Tech., 13, 3375–3411, https://doi.org/10.5194/amt-13-3375-2020, 2020.
Smirnov, A., Holben, B. N., Eck, T. F., Dubovik, O., and Slutsker, I.: Cloud-Screening and Quality Control Algorithms for the AERONET Database, Remote Sens. Environ., 73, 337–349, https://doi.org/10.1016/S0034-4257(00)00109-7, 2000.
Sogacheva, L., Popp, T., Sayer, A. M., Dubovik, O., Garay, M. J., Heckel, A., Hsu, N. C., Jethva, H., Kahn, R. A., Kolmonen, P., Kosmale, M., de Leeuw, G., Levy, R. C., Litvinov, P., Lyapustin, A., North, P., Torres, O., and Arola, A.: Merging regional and global aerosol optical depth records from major available satellite products, Atmos. Chem. Phys., 20, 2031–2056, https://doi.org/10.5194/acp-20-2031-2020, 2020.
Stamnes, S., Hostetler, C., Ferrare, R., Burton, S., Liu, X., Hair, J., Hu, Y., Wasilewski, A., Martin, W., van Diedenhoven, B., Chowdhary, J., Cetiniæ, I., Berg, L. K., Stamnes, K., and Cairns, B.: Simultaneous polarimeter retrievals of microphysicl aerosol and ocean color parameters from the “MAPP” algorithm with comparison to high-spectral-resolution lidar aerosol and ocean products, Appl. Optics, 57, 2394, https://doi.org/10.1364/ao.57.002394, 2018.
Tan, Y., Li, E., Zhang, Z., Lin, X., Chi, Y., Zhou, L., Wu, C., and Wang, Q.: Validation of POLDER-3/GRASP aerosol products using AERONET measurements over China, Atmos. Environ., 215, 116893, https://doi.org/10.1016/j.atmosenv.2019.116893, 2019.
Tanré, D., Kaufman, Y. J., Herman, M., and Mattoo, S.: Remote sensing of aerosol properties over oceans using the MODIS/EOS spectral radiances, J. Geophys. Res.-Atmos., 102, 16971–16988, https://doi.org/10.1029/96JD03437, 1997.
Tanré, D., Bréon, F. M., Deuzé, J. L., Dubovik, O., Ducos, F., François, P., Goloub, P., Herman, M., Lifermann, A., and Waquet, F.: Remote sensing of aerosols by using polarized, directional and spectral measurements within the A-Train: the PARASOL mission, Atmos. Meas. Tech., 4, 1383–1395, https://doi.org/10.5194/amt-4-1383-2011, 2011.
Titos, G., Ealo, M., Román, R., Cazorla, A., Sola, Y., Dubovik, O., Alastuey, A., and Pandolfi, M.: Retrieval of aerosol properties from ceilometer and photometer measurements: long-term evaluation with in situ data and statistical analysis at Montsec (southern Pyrenees), Atmos. Meas. Tech., 12, 3255–3267, https://doi.org/10.5194/amt-12-3255-2019, 2019.
Torres, B., Dubovik, O., Fuertes, D., Schuster, G., Cachorro, V. E., Lapyonok, T., Goloub, P., Blarel, L., Barreto, A., Mallet, M., Toledano, C., and Tanré, D.: Advanced characterisation of aerosol size properties from measurements of spectral optical depth using the GRASP algorithm, Atmos. Meas. Tech., 10, 3743–3781, https://doi.org/10.5194/amt-10-3743-2017, 2017.
Tsekeri, A., Lopatin, A., Amiridis, V., Marinou, E., Igloffstein, J., Siomos, N., Solomos, S., Kokkalis, P., Engelmann, R., Baars, H., Gratsea, M., Raptis, P. I., Binietoglou, I., Mihalopoulos, N., Kalivitis, N., Kouvarakis, G., Bartsotas, N., Kallos, G., Basart, S., Schuettemeyer, D., Wandinger, U., Ansmann, A., Chaikovsky, A. P., and Dubovik, O.: GARRLiC and LIRIC: strengths and limitations for the characterization of dust and marine particles along with their mixtures, Atmos. Meas. Tech., 10, 4995–5016, https://doi.org/10.5194/amt-10-4995-2017, 2017.
Tsikerdekis, A., Schutgens, N. A. J., and Hasekamp, O. P.: Assimilating aerosol optical properties related to size and absorption from POLDER/PARASOL with an ensemble data assimilation system, Atmos. Chem. Phys. Discuss., https://doi.org/10.5194/acp-2020-468, in review, 2020.
Wagner, F. and Silva, A. M.: Some considerations about Ångström exponent distributions, Atmos. Chem. Phys., 8, 481–489, https://doi.org/10.5194/acp-8-481-2008, 2008.
Waquet, F., Cairns, B., Knobelspiesse, K., Chowdhary, J., Travis, L. D., Schmid, B., and Mishchenko, M. I.: Polarimetric remote sensing of aerosols over land, J. Geophys. Res.-Atmos., 114, https://doi.org/10.1029/2008JD010619, 2009.
Wei, J., Peng, Y., Mahmood, R., Sun, L., and Guo, J.: Intercomparison in spatial distributions and temporal trends derived from multi-source satellite aerosol products, Atmos. Chem. Phys., 19, 7183–7207, https://doi.org/10.5194/acp-19-7183-2019, 2019.
Wei, Y., Li, Z., Zhang, Y., Chen, C., Dubovik, O., Zhang, Y., Xu, H., Li, K., Chen, J., Wang, H., Ge, B., and Fan, C.: Validation of POLDER GRASP Aerosol Optical Retrieval Over China Using SONET Observations, J. Quant. Spectrosc. Ra., 246, 106931, https://doi.org/10.1016/j.jqsrt.2020.106931, 2020.
Winker, D. M., Pelon, J., Coakley, J. A., Ackerman, S. A., Charlson, R. J., Colarco, P. R., Flamant, P., Fu, Q., Hoff, R. M., Kittaka, C., Kubar, T. L., Le Treut, H., Mccormick, M. P., Mégie, G., Poole, L., Powell, K., Trepte, C., Vaughan, M. A., and Wielicki, B. A.: The CALIPSO Mission: A Global 3D View of Aerosols and Clouds, B. Am. Meteorol. Soc., 91, 1211–1230, https://doi.org/10.1175/2010BAMS3009.1, 2010.
Xu, F., van Haren, G., Diner, D. J., Kalashnikova, O. V., Seidel, F. C., Bruegge, C. J., and Dubovik, O.: Coupled retrieval of aerosol properties and land surface reflection using the Airborne Multiangle SpectroPolarimetric Imager, J. Geophys. Res., 122, 7004–7026, https://doi.org/10.1002/2017JD026776, 2017.
Xu, F., Diner, D. J., Dubovik, O., and Schechner, Y.: A correlated multi-pixel inversion approach for aerosol remote sensing, Remote Sens., 11, 746, https://doi.org/10.3390/rs11070746, 2019.
Yu, H., Kaufman, Y. J., Chin, M., Feingold, G., Remer, L. A., Anderson, T. L., Balkanski, Y., Bellouin, N., Boucher, O., Christopher, S., DeCola, P., Kahn, R., Koch, D., Loeb, N., Reddy, M. S., Schulz, M., Takemura, T., and Zhou, M.: A review of measurement-based assessments of the aerosol direct radiative effect and forcing, Atmos. Chem. Phys., 6, 613–666, https://doi.org/10.5194/acp-6-613-2006, 2006.
Zhang, Y. and Li, Z.: Remote sensing of atmospheric fine particulate matter (PM2.5) mass concentration near the ground from satellite observation, Remote Sens. Environ., 160, 252–262, https://doi.org/10.1016/j.rse.2015.02.005, 2015.
- Abstract
- Introduction
- Data description and validation approach
- Validation of satellite observation by comparison with AERONET data: results and discussion
- Inter-comparison of satellite products at global scale
- Data availability
- Summary and conclusions
- Author contributions
- Competing interests
- Acknowledgements
- Financial support
- Review statement
- References