the Creative Commons Attribution 4.0 License.
the Creative Commons Attribution 4.0 License.
 | 05 Feb 2018
Towards a cyber-physical era: soft computing framework based multi-sensor array for water quality monitoring
Jyotirmoy Bhardwaj
Karunesh K. Gupta
Rajiv Gupta
New concepts and techniques are replacing traditional methods of water quality parameter measurement systems. This paper introduces a cyber-physical system (CPS) approach for water quality assessment in a distribution network. Cyber-physical systems with embedded sensors, processors and actuators can be designed to sense and interact with the water environment. The proposed CPS is comprised of sensing framework integrated with five different water quality parameter sensor nodes and soft computing framework for computational modelling. Soft computing framework utilizes the applications of Python for user interface and fuzzy sciences for decision making. Introduction of multiple sensors in a water distribution network generates a huge number of data matrices, which are sometimes highly complex, difficult to understand and convoluted for effective decision making. Therefore, the proposed system framework also intends to simplify the complexity of obtained sensor data matrices and to support decision making for water engineers through a soft computing framework. The target of this proposed research is to provide a simple and efficient method to identify and detect presence of contamination in a water distribution network using applications of CPS.
- Article
(1647 KB) -
Supplement
(26633 KB) - BibTeX
- EndNote


Water quality monitoring is one of the most important procedures to follow before consumption for activities ranging from potable, industrial and agricultural processes. Water quality can be effectively monitored in treatment plants and pumping stations, but it is difficult to monitor in distribution networks. Once the water from a treatment plant enters a distribution network, continuous real-time monitoring becomes a challenging task. Cyber-physical systems (CPSs) are engineered systems designed for seamless integration of physical components to a computational algorithm. A CPS can also be described as the next generation of embedded systems. Unlike embedded systems, a full-fledged CPS is typically designed as a network of interacting elements with physical input and output instead of as stand-alone devices. CPSs are basically designed for applications ranging from medical sciences, environmental monitoring, process control, etc. Moreover, a CPS along with electronic sensors can sense and interact with water to identify the contamination in real time. Therefore, to detect water quality in a distribution network, we propose implementation of a cyber-physical system (CPS) based water quality monitoring system. With the advancements in cyber-physical systems, the real-time observation of water can be effectively monitored (Wang et al., 2015). CPS-based approaches have already been experimented for oil pipeline monitoring (Ali et al., 2015). In addition, to foster the paradigm of CPS for sustainable water solutions, a CPS test bed was demonstrated by integrating embedded devices and open-source software architecture (Karagiannidis et al., 2016).
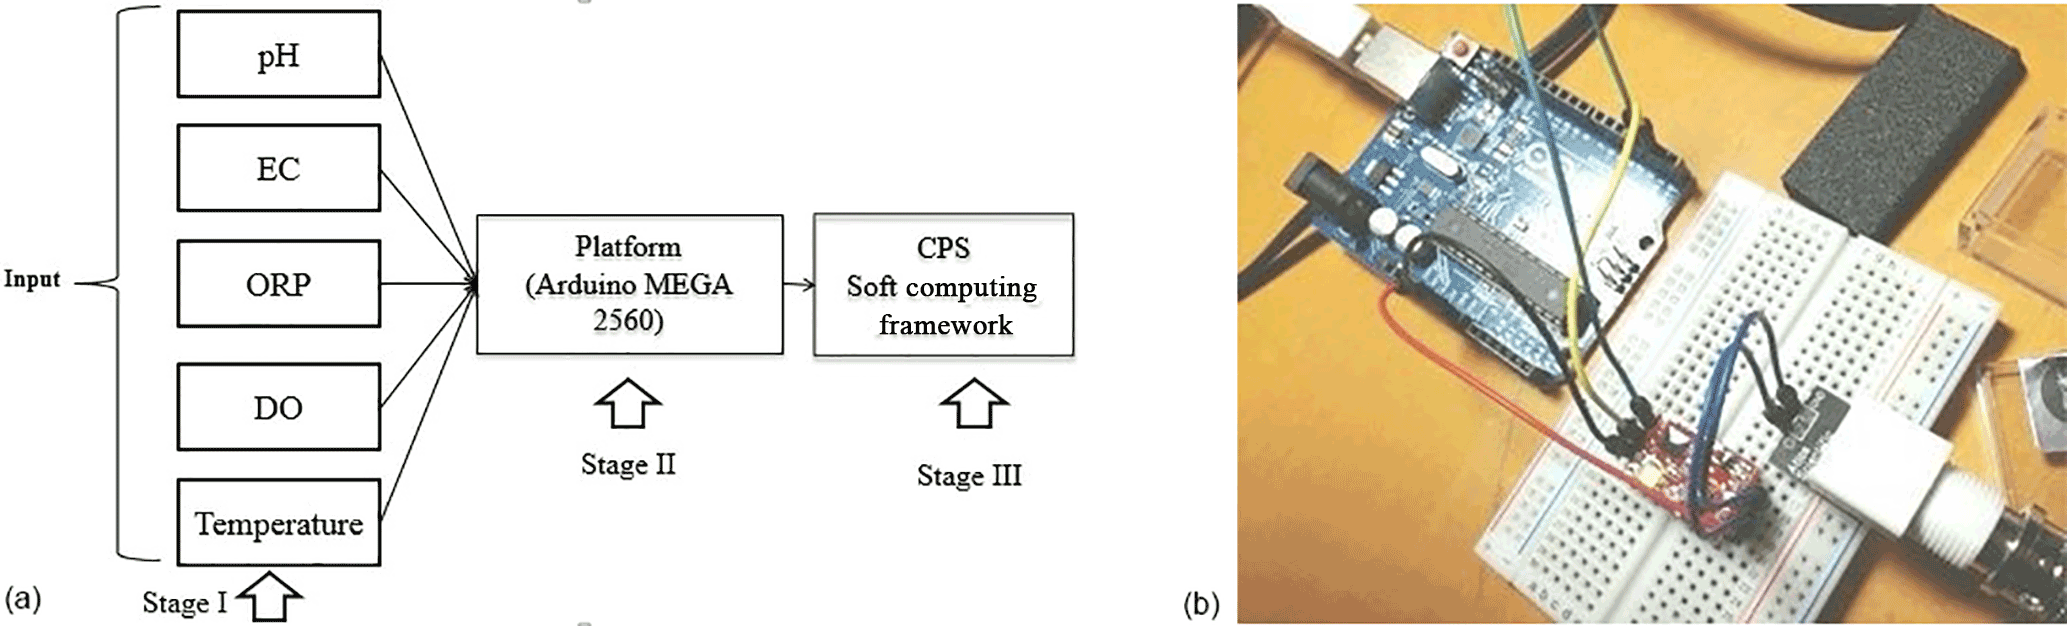
Figure 1(a) CPS design stages for proposed system and (b) Arduino MEGA 2560 with sensor stamp.
This proposed CPS consists of (a) a sensing framework, consisting of a sensor array (SA); (b) a hardware platform design; and (c) soft computing framework for decision making. In development of sensing framework, we integrated an SA from commercially available individual sensors of pH, dissolved oxygen (DO), oxygen reduction potential (ORP), electrical conductivity (EC) and temperature (T). In the second stage, platform design has been carried out utilizing the advantages of Arduino MEGA 2560 for SA data processing. In the third stage, soft computing framework for CPS has been developed for effective user interface and decision support system. Refer to Fig. 1a for design process of CPS and Fig. 1b for Arduino MEGA 2560 with a sensor stamp. Finally, validity of CPSs has been tested through laboratory-based analytical measurements and commercially available multiparameter water quality detection system YSI Sonde 6820 V2 (see YSI, 2013).
2.1 Parameter selection strategy
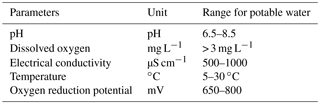
The US Environmental Protection Agency has conducted experimental evaluation of water quality. The main conclusion was that chemical and biological contaminants generally affect pH, DO, EC and ORP (Lambrou et al., 2014). Therefore, the core idea was to detect the variations in the above-mentioned parameters that can significantly detect overall quality of water. Empirical evidence has suggested that water quality parameters such as pH, EC and DO are sensitive indicators of nicotine, arsenic trioxide and Escherichia coli. Therefore, instead of direct detection of contaminants, monitoring these parameters is more feasible (Hall et al., 2007). Hence, we have selected five parameters and their range based on available scientific literature. Table 1 presents targeted water quality parameters with widely acceptable ranges for potable water.
2.2 Cyber-physical system platform design
The CPS platform unit consists of hardware and software which are jointly able to produce potential solutions for targeted application. Re-configurable and scalable systems are the present technological requirements, and therefore platform units are supposed to be reconfigurable and scalable as per the fast-changing demands of applications. The re-configurability and scalability offer value addition, as they offer freedom to modify the system as per changing application requirements and improve the adaptability of overall system in different scenarios. CPSs are primarily scalable and reconfigurable systems because they can be modified based on volume of data, bandwidth requirements, power requirements and sensing applications. The CPS platform design was subdivided into a three-step procedure, which is further explained in the following subsections.
2.2.1 Sensing framework
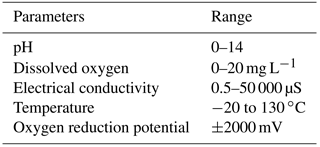
For monitoring water quality, the proposed SA is comprised of five different sensor nodes of water quality parameters. Here, node refers to an individual sensor unit. The sensor nodes are industrially manufactured sensors of Atlas Scientific, USA (see Atlas Scientific, 2017). These individual sensor nodes are capable of supporting open-source architectures that can significantly minimize the overall cost of the system. Table 2 presents a summary of different sensor nodes used, along with their specifications and ranges. However, the data points generated through SA are not user-friendly, complex in nature, and difficult to interpret to measure the extent of potability of water. To address the complexity of data points, a user-friendly decision support system is required, which is addressed in Sect. 2.3.
2.2.2 Hardware platform design for CPS
For this proposed system, SA produces complex data matrices; the hardware platform plays a crucial role in acquisition and processing of generated complex data points. Hardware unit of the system may alternatively be called a data acquisition and processing unit. Traditionally, hardware platform units range from light-weight (e.g. Mica2) to PDA (Platform Design Automation, e.g. Intel stagnates). However, moving towards PDA class increases cost, bandwidth and power requirements. Since the proposed system is supposed to withstand for longer periods of time and should be suitable for remote deployments with low power consumption, we have decided to opt for a light-weight hardware platform unit with the requirement of 5–15 V. The SA operates on the power ranging from 5 to 12 V; therefore, a low-power platform unit is sufficient for overall operations and simultaneously can be supported by batteries. For data acquisition and processing, Arduino MEGA 2560 has been deployed and connected with the SA unit. Arduino MEGA 2560 is a family of Arduino microcontroller units, basically used to design and build devices and objects to interact with the physical world (see Arduino, 2017). Arduino MEGA 2560 consists of a set of digital and analog input/output pins for interfacing with SA and simultaneously utilizes the features of serial bus communication. Arduino MEGA 2560 can be programmed with Arduino Integrated Development Environment (IDE). The Arduino IDE utilizes the features of C and C programming languages and can be used to analyse and generate data points from an MSA unit. The information sensed by SA is then converted into electrical signals which are proportional to the actual values of parameters being sensed, and consecutively applied to Arduino MEGA 2560 for further processing.
2.2.3 CPS soft computing framework development
In continuation with development of overall CPS, soft computing framework development for computational modelling has been carried out. CPSs are able to gather massive volume of real-time information through a distribution network utilizing advanced sensor networking technologies. In addition, they support real-time decision making in the case of occurrence of contamination event detection by filling the information gap between distribution network, consumer and treatment plant. CPSs are able to respond in real time; therefore, recently researchers have been instrumental in the development of CPS for water quality systems (Imen and Cheng, 2016). Apart from development of sensing framework, the challenge is to address the complexity and huge volume of data sets generated by sensing framework and transforming the same in a user-friendly way. Arduino IDE can be used to analyse obtained data points from a matrix. However, data representation of Arduino IDE is not user-friendly and cannot be implemented for effective decision making. Therefore, implementation of Python is preferred over Arduino IDE. Refer to file Supplementary_Material_1 (see Supplement or Bhardwaj and Gupta, 2017) for pH data acquisition programming module from Arduino IDE.
Python is a widely used general-purpose dynamic programming language and has comprehensive standard libraries. Python has been experimented in a wide variety of applications ranging from environmental, home and industrial. Python framework has also been used in the development of ubiquitous wireless sensor network frameworks (Bocchino et al., 2015). Python facilitates the task of application development and minimizes the dependency on expertise of the embedded system. This approach has been followed in visual programming frameworks of wireless sensor networks for smart applications (Serna et al., 2015). The Python module is an effective tool to reduce the complexity of overall system, usually deployed at client side as this allows the user to analyse the results in 2-D∕3-D space in a user-friendly way (Scherer et al., 2000). In addition, it offers benefits of an open-source community and wider programming choices. The Python module has been instrumental in the development of software architecture frameworks to behavioural modelling for CPS (Ringert et al., 2014). On the other hand, in the development of CPS test beds, the Python module has been used as it supports adaptability and re-configurability (Adhikari et al., 2016), although MATLAB is also a potential choice for the development of a soft computing framework for CPS. However, Python offers advantages over MATLAB mainly due to being open-source with a comprehensive library, choices of 2-D∕3-D graphic packages, ease of re-configurability and low cost. This framework has been developed mainly for batch processing of a large volume of data. Additionally, this framework serves as potential starting point for decision-making processes. Real-time data from Arduino MEGA 2560 have been supplied to Python through a serial port and simultaneously exploited the scientific functionalities of NumPy and Matplotlib libraries. NumPy is the core library for scientific and mathematical computing in Python with a wide range of tools and models (Ari and Mamatnazarova, 2014). On the other hand Matplotlib targets the output segment of Python. Python users generally embed Matplotlib in the development of a graphical user interface to observe data sets. Refer to file Supplementary_Material_2 for the use of NumPy and Matplotlib libraries in Python framework development.
2.3 Decision support system
Water quality can be easily monitored in treatment plants and pumping stations, but it is difficult to monitor in distribution networks. This proposed system intends to decide whether water quality in distribution networks is acceptable, adequate or highly acceptable through a decision support system. Traditionally, the water quality has been monitored by either testing the obtained samples in the laboratory or through results of individual sensor nodes. Individual sensor units are not capable of monitoring every aspect of water quality monitoring. Therefore by integrating different sensor nodes of water quality monitoring, the user could monitor the overall water quality. However, multiple sensor nodes generate a huge data set of information. Due to this overwhelming set of information, a lot of variable and relations have to be specified to develop effective decision support system for water quality. Computing-assisted decision support systems facilitate support to complex data modelling and ultimately effective decision making. Fuzzy sets or fuzzy logic is one of the effective techniques that can bolster the decision support system. Fuzzy logic was introduced and formalized by Zadeh (1965). Fuzzy logic translates the expression of natural language into mathematical universe to deal with the ambiguity in decision analysis and to help decision makers make intelligent and well-analysed decisions (Whittle et al., 2010).
Literature review indicates fuzzy performs better than both linear and nonlinear regression methods in terms of model building, adaptive modelling and decision making (Doorsy and Coovert, 2003), although principal component analysis (PCA) is also one of the favourite tools for information extraction and analysis. However, PCA is sensitive to missing data and poor correlation among water quality parameters (Sarbu and Pop, 2005). Moreover, fuzzy offers simplicity, flexibility and reliable results, and it can handle incomplete data sets and nonlinear functions. Therefore, fuzzy has been extensively used in development of decision support systems for applications pertaining to water and CPS. This approach has been widely discussed in several environmental applications ranging from development of decision support systems for urban water management (Makropoulas et al., 2003) to fuzzy-based CPS (Liu and Zhang, 2009).

2.3.1 Formulation of rules
For development of a decision support system, a three-step approach is formulated: (a) determination of the quality ranges of water parameters, (b) selection of the membership functions (MFs) and assignment of MF to different ranges of water quality parameters, and (c) the design of a set of rules for MF. In the first step, the determination, selection and range classification were carried out. The range selection of the water quality parameters to be monitored is discussed in Sect. 2.1 and mentioned in Table 1.
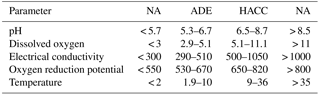
In step two, we selected and formulated three MFs – not acceptable (NA), adequate (ADE) and highly acceptable (HACC) – by defining corresponding mathematical ranges. We assign MF a particular range of water quality parameters, as shown in Table 3. Here, the values are chosen for systems with surface water as source. The obtained membership function provides exact analysis of degree of validation of water quality in distribution networks. Generally MFs are of various forms such as trapezoidal, triangular, and Gaussian. For this particular CPS, the designed MFs are triangular, although trapezoidal MF can also be used but triangular MF gives best response and is simple to implement in fuzzy approach (Zhao and Bose, 2002). Figure 2 represents MF implementation of pH and DO. The rest of the MF can be referred to in file Supplementary_Material_3.
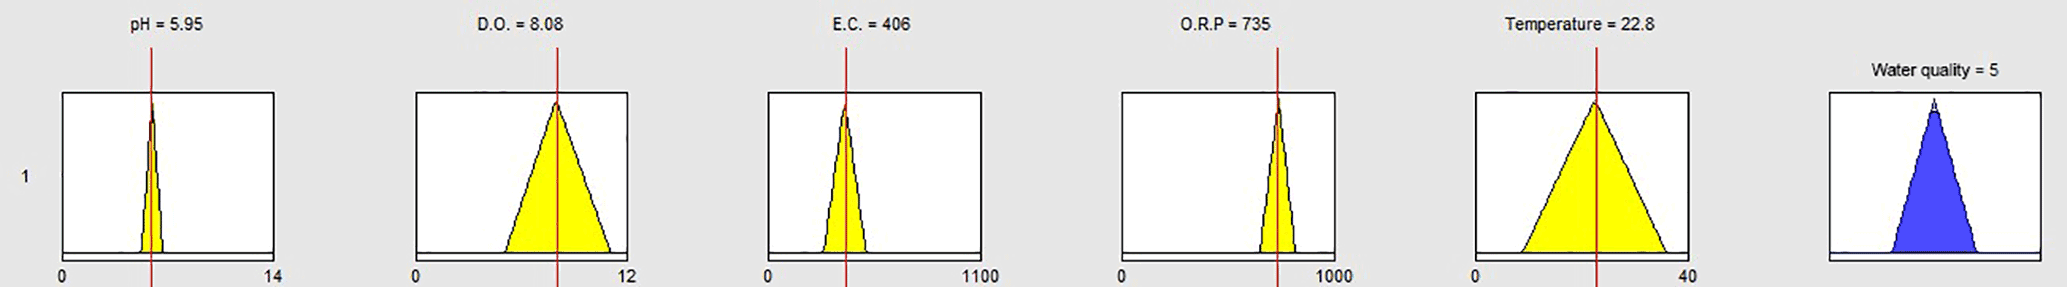
In step three, fuzzy inference rules are formulated by the antecedent “if” part and consequently the “then” part. For this particular decision support system, we implemented five multi-input and single-output Mamdani fuzzy inference system, and rules have been designed accordingly. The rules have been formulated by following three principles. The first principle is as follows: if any of the water quality parameters are NA, then overall water quality will be NA. The second principle is as follows: if all the water quality parameters are HACC, then overall water quality will be HACC; otherwise water quality will be adequate. For HACC case, the fuzzy rule can be regarded as follows: if pH is HACC, DO is HACC, EC is HACC, ORP is HACC and temperature is HACC, then water quality is HACC. The third principal is based on two assumptions. The first assumption is water quality of individual parameters will fluctuate between HACC and ADE provided that not a single quality parameter is NA. The second assumption is the following: if a single water quality parameter is ADE, the overall water quality will be ADE (provided no water quality parameter is NA or all parameters are HACC). In fuzzy description the rule can be regarded as follows: if pH is not NA, DO is not NA, EC is not NA, ORP is not NA, or temperature is not NA, then water quality is ADE. Refer to Fig. 3 to see the graphical representation of the following rule: if pH is ADE, DO is HACC, EC is ADE, ORP is HACC or temperature is HACC, then water quality is ADE. The exact formulation of rules can be referred to in file Supplementary_Material_4.pdf.
2.3.2 Fuzzy inference implementation
Python is one of the programming languages that can be used to define framework for fuzzy inference system. The Python for fuzzy inference approach has been used for sensing air quality, temperature and leakage measurements (Slauddin and Rehman, 2015). Similarly, this approach has been followed to develop fuzzy framework for uncertainty analysis (Santucci and Capocchi, 2014). pyFuzzy or skfuzzy are frameworks of Python to work with fuzzy sets and process them based on designated rules. The fuzzy logic can be applied to SA data sets after every iteration of data collection as explained in Sect. 3.1.2 by averaging the values of samples of individual sensor node. However, this approach is dynamic, modifiable and upgradable as per user requirements and can be applied to data points collected in a particular time frame as suitable for application. Refer to the file Supplementary_Material_5 regarding use of Skfuzzy module.
2.4 Comparative analysis of system cost
The budgetary cost of any water quality monitoring system depends upon two factors: the cost of sensors with hardware platform and cost of soft computing framework development. The cost of sensor node depends upon the way of manufacturing. For example, pH and DO nodes can be manufactured either by using a glass electrode based method or through optical sensors (Bhardwaj et al., 2015). Different manufacturers follow different procedures to develop individual sensor nodes with varied ranges, resolution and requirements, whether industrial or potable. Therefore, varied requirements significantly vary the overall cost of sensor nodes. For example a commercially available multiparameter water quality monitoring system (e.g. YSI Sonde V2) varies in the range of USD 5000 to USD 8000 (with computing framework) mainly used for industrial purposes. On the other hand, general-purpose sensor nodes of commercially available Vernier cost around USD 800 to USD 1000 (without computing framework) for potable water testing. The cost of commercially available computing tools (e.g. MATLAB and LoggerPro) varies in the range of USD 350 to USD 500. By exploiting the benefits of open-source computing modules and libraries, the overall system cost can significantly be lower down with the additional feature of reconfigurability. For the proposed system, the cost of SA is summation of the individual costs of pH, DO, ORP, EC and temperature nodes and was USD 530. In addition, the hardware platform has a cost of USD 59, which includes Arduino MEGA 2560 and XBee (wireless data transmission unit). Therefore, overall cost of sensors and hardware unit was USD 589. Computing framework development for scientific analysis was carried out by exploiting the advantages of open-source libraries of Python, which further reduced the overall system cost and makes the system cost-effective. The cost of consumables, data collection, power source, scientific supervision, labour, resources used for sample collection and shipping to analytical laboratories are not considered as these costs will be approximately same for all other commercially available systems.
3.1 Measurement procedure
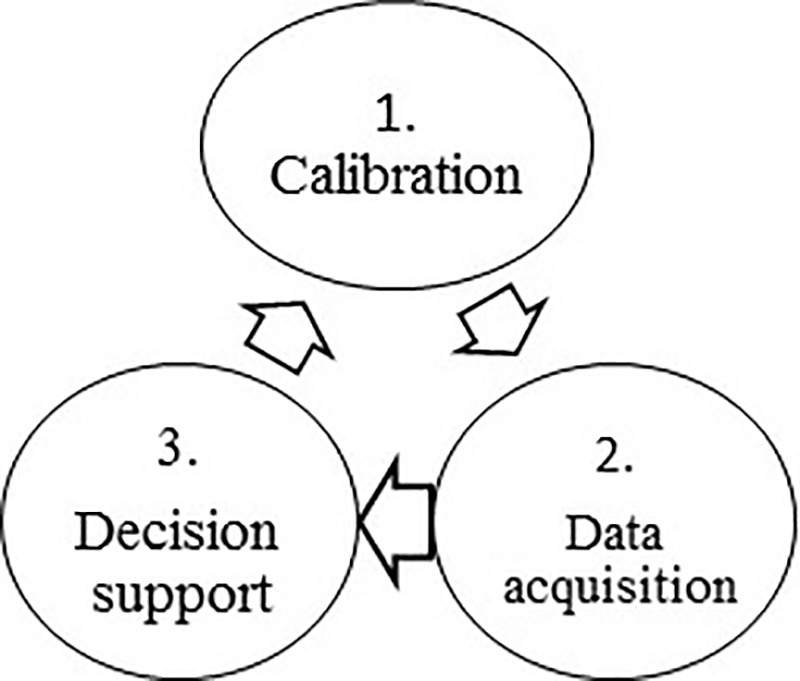
The system has been deployed to five different water distribution sites of Birla Institute of Technology and Science, Pilani, India. The location was selected at random to collect real-time data in a potable water distribution network. The measurement procedure was divided into three steps of one iteration: (a) calibration of SA, with already known value samples; (b) real-time data acquisition from SA through Python module; and (c) decision support analysis through fuzzy decision approach. Refer to Fig. 4 for steps employed in one iteration of measurement process.
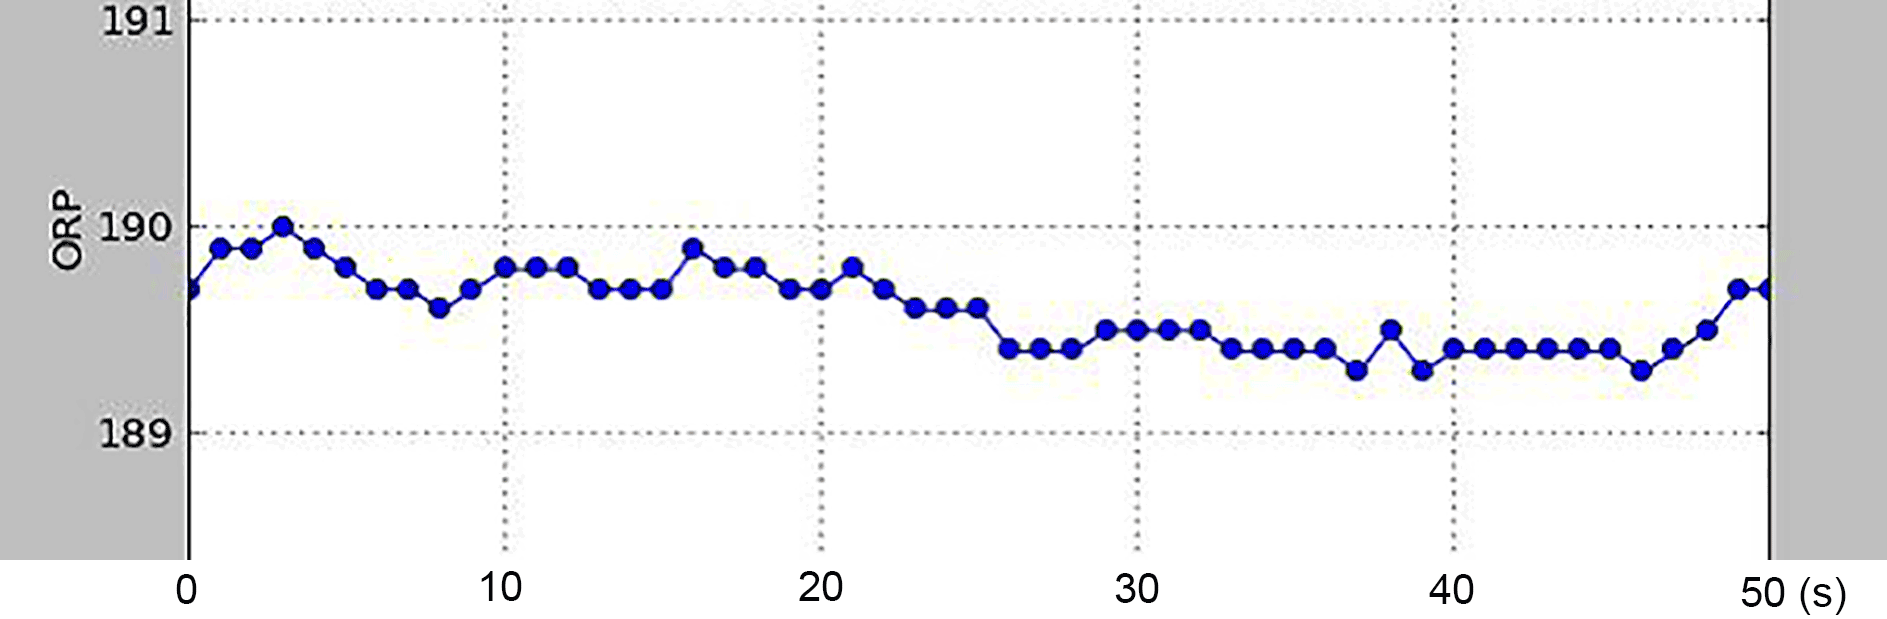
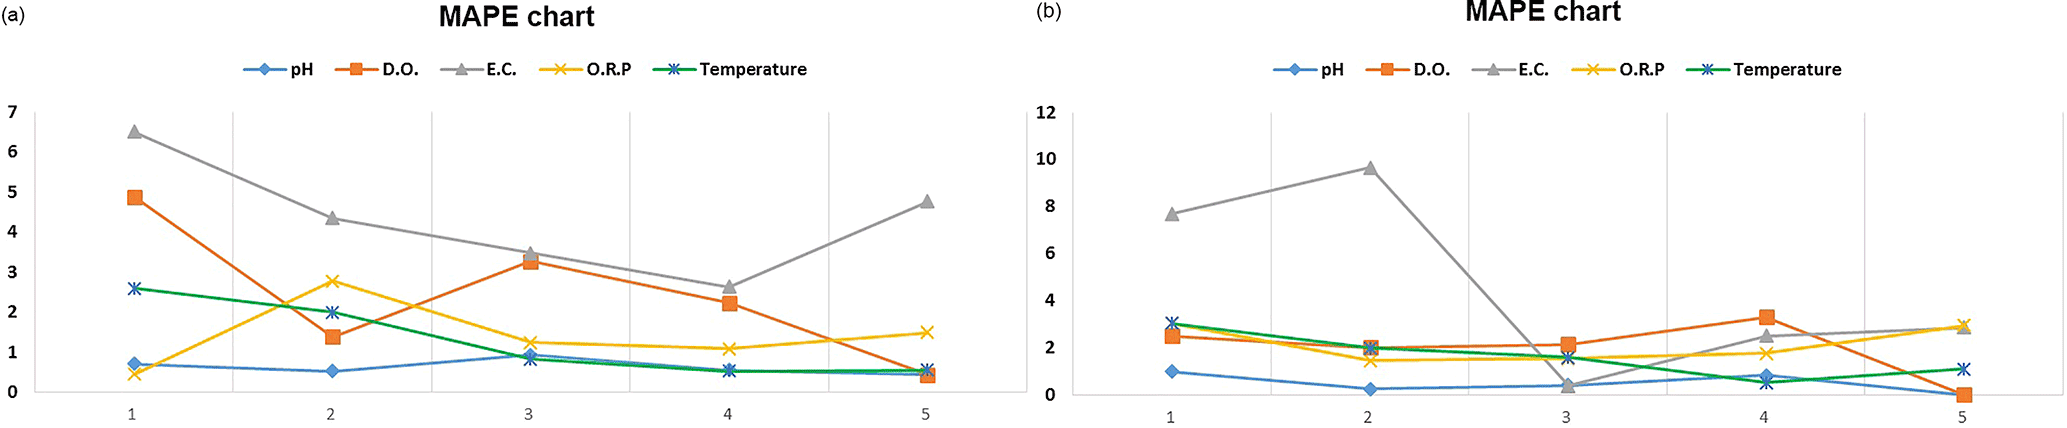
Figure 6MAPE chart (in %) (a) SA against laboratory results and (b) SA against YSI Sonde 6820 V2 results.
3.1.1 Calibration methodology for SA
Atlas Scientific sensor nodes follow the standard procedure of calibration by immersing sensor nodes in already known solutions. For example, Atlas Scientific pH node can be calibrated by immersing it in already known pH solution of value 7. Thereafter, place the circuit in continuous mode, wait for 1–2 min and transmit the command corresponding to pH value 7 (see Atlas Scientific). Calibration of overall system was carried out through standard available buffer solutions of different pH values of 4.0, 7.0 and 10.0. Similarly, EC node was calibrated by 80 000 and 12 880 µS cm−1 solution. DO node was calibrated by known DO solution of 8 mg L−1 and ORP node was calibrated with 225 mV solution. The same procedure can be followed to calibrate the remaining sensor nodes.
3.1.2 Real-time data acquisition from SA
The SA was used to collect samples roughly in every one and half seconds from potable water flowing through distribution network. Therefore, roughly 50 data points containing information of potable water could be collected in 1 min from every single node. The proposed SA has the maximum capacity to supply 250 data points per minute. The data collection capacity is adjusted to avoid the overlapping of arriving data points from the sensor array. Primarily, the system has been designed to collect sensor data points over an infinite period of time for real-time continuous monitoring.
However, for the experimental verifications and measurements, the system has been tested for 10 different sessions of 2 h each. The primary reason behind 10 different sessions is to avoid over-homogeneity of data points. The collected samples are taken for a period of 5 days, further divided in 10 sessions of 2 h each, with overall functioning time of 20 h at each location. The laboratory samples for verifications are collected for every session. In each session the deployed system generated 2500 data points of SA.
Figure 5 presents real-time 2-D representation of data points through an interactive user interface. In Fig. 5, the y axis represents continuous variations in values of ORP in water distribution network, while the x axis represents the time in seconds. For convenience and limitations, only the first 50 points for ORP values are shown in Fig. 5. However, all the other parameters can be demonstrated by the same procedure. See Supplementary_Material_6 for real-time demonstration of data point generation.
The validation of the proposed system was carried out through analytical results and commercially available multiparameter system YSI Sonde 6820. Water samples have been collected after every iteration at five different locations in a potable water distribution network. The targeted parameters were measured analytically and thereafter compared by proposed system and commercially available YSI Sonde 6820 multiparameter water quality measurement system. In analytical measurement, pH was measured by titration with sodium hydroxide method, DO was measured with Winkler method, EC was measured by two flat electrodes, ORP was measured by inert sensing electrode and temperature was measured by lab-based water temperature sensor. Baud rate of system was set to 9600, data rate was set at 1 kbps without parity and Kermit protocol was applied for YSI Sonde 6820 V2 system.
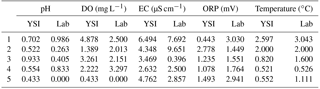
Obtained samples of these models are compared through mean average percentage error (MAPE). The mean average percentage error (MAPE), alternatively known as mean average percentage deviation (MAPD), is a method to determine result accuracy. It usually expresses accuracy in percentage and can be defined by the following formula:
where M represents MAPE, At is the actual results obtained for an individual parameter, Ft is the results obtained from SA and n is the number of data points generated through SA for one iteration.
The obtained MAPE values are presented in Table 4. The MAPE has been obtained for SA against one iteration of laboratory measurements, which are presented in Fig. 6a. Similarly, Fig. 6b presents the MAPE of SA against YSI Sonde 6820 V2. The x axis represents the particular location number, and the y axis is indicative of calculated MAPE. Blue, orange, green, yellow and grey lines correspond to MAPE values of pH, DO, temperature, ORP and EC. Refer to Supplementary_Material_7 for obtained average values of iteration used for calculating MAPE. The lower MAPE values demonstrate better accuracy. Among tested water quality parameters, pH and temperature received the lowest values of MAPE, which varies in the range of 0–2 %, corresponding to very high accuracy of the sensor nodes. At the same time, MAPE for DO and ORP nodes varies in the range of 3–5 % at two locations and can be attributed to slight deviation from obtained results, and EC node MAPE varies in the range of 0–8 %. This MAPE is an indication of performance comparison. However, the actual behaviour of CPS accuracy will depend upon sensing framework.
Cyber-physical systems make sensing of environmental applications ubiquitous with advanced capability of complex data processing to improve overall decision making. Since reliable and effective continuous water quality monitoring has always been challenging, this paper demonstrated the CPS-based water quality monitoring system in a distribution network. This method is an effective way to detect water quality in distribution networks. Moreover, data acquired by this prototype are user-friendly and can assist in better understanding of water distribution network. The obtained data can be useful to interpret more valuable information by analysing interrelationship among water quality parameters using techniques like artificial neural network or partial least square regression. Moreover, the proposed system is reconfigurable and can be modified according to application requirement ranging from industrial, urban, rural or environmental. This paper also demonstrates the integration of soft computing techniques Python and fuzzy logic with cyber-physical system to facilitate decision support system. Comparative analysis of developed system with lab-based measurement techniques and commercially available system has been carried out. On analysing both models at different locations, it can be inferred that their performance is being governed by the robustness of integrated sensor. The proposed system can be implemented in remote locations as recommended input voltage requirement ranges from 7 to 12 V, which can be supported by batteries. The developed system is low-cost, consumes low power and is capable of processing, logging, and remotely presenting data as per user requirements.
Programming codes and data related to this article can be found in the Supplement and are publicly accessible online at https://doi.org/10.5281/zenodo.1163102 (Bhardwaj and Gupta, 2017). Readers can access and use the programming codes by quoting this paper as a reference.
The supplement related to this article is available online at: https://doi.org/10.5194/dwes-11-9-2018-supplement.
The authors declare that they have no conflict of interest.
The development of this system would not have been possible without the
support of Centre of Excellence, in Waste, Water and Energy
Management, Birla Institute of Technology and Science, Pilani. We would
particularly like to thank Rajiv Gupta for valuable input and
far-sighted approach. We are thankful to Ramón Martínez
Mañez, Instituto Interuniversitario de Investigación de
Reconocimiento Molecular y Desarrollo Tecnológico, Universidad
Politécnica de Valencia, Spain, for valuable training and support.
Edited by: Ran Shang
Reviewed
by: two anonymous referees
Adhikari, U., Morris, T., and Pan, S.: WAMS cyber-physical test bed for power system, cybersecurity study, and data mining, IEEE T. Smart Grid, 8, 2744–2753, https://doi.org/10.1109/TSG.2016.2537210, 2016.
Ali, S., Qaisar, S. B., Saeed, H., Khan, M. F., Naeem, M., and Anpalagan, A.: Network challenges for cyber physical systems with tiny wireless devices: a case study on reliable pipeline condition monitoring, Sensors, 15, 7172–7205, 2015.
Arduino: Arduino MEGA 2560 Rev 3, available at: https://store.arduino.cc/usa/arduino-mega-2560-rev3, last access: 23 September 2017.
Ari, N. and Mamatnazarova, N.: Symbolic python, in: IEEE 11th International Conference on Electronics, Computer and Computation (ICECCO), Abuja, Nigeria, 29 September–1 October 2014, 1–8, https://doi.org/10.1109/ICECCO.2014.6997580, 2014.
Atlas Scientific: Atlas Scientific Environmental Robotics, available at: https://www.atlas-scientific.com/, last access: 23 September 2017.
Bhardwaj, J. and Gupta, K. K.: Towards Cyber Physical Era: Soft Computing framework based Multi-Sensor Array for Water Quality Monitoring (Version 2), Zenodo, available at: http://doi.org/10.5281/zenodo.1163102 (last access: 31 January 2018), 2017.
Bhardwaj, J., Gupta, K. K., and Gupta, R.: A review of emerging trends on water quality measurement sensors, in: IEEE International Conference on Technologies for Sustainable Development (ICTSD), Mumbai, India, 4–6 February 2015, 1–6, https://doi.org/10.1109/ICTSD.2015.7095919, 2015.
Bocchino, S., Fedor, S., and Petracca M.: Pyfuns: A python framework for ubiquitous networked sensors in: European Conf. on Wireless Sensor Networks, Porto, Portugal, 9–11 February 2015, Springer, 1–18, 2015.
Dorsey, D. W. and Coovert, M. D.: Mathematical modeling of decision making: a soft and fuzzy approach to capturing hard decisions, Hum. Factors, 45, 117–135, 2003.
Hall, J., Zaffiro, A. D., Marx, R. B., Kefauver, P. C., Krishnan, E. R., Haught, R. C., and Herrmann, J. G.: On-line water quality parameters as indicators of distribution system contamination, J. Am. Water Works Ass., 99, 66–77, 2007.
Imen, S. and Cheng N. B.: Developing a cyber-physical system for smart and sustainable drinking water infrastructure management in: IEEE 13th International Conference on Networking Sensing and Control, Mexico City, Mexico, 28 April–30 April 2016, 1–8, https://doi.org/10.1109/ICNSC.2016.7478983, 2016.
Karagiannidis, L., Vrettopoulos, M., Amditis, A., Makri, E., and Gkonos, N.: A CPS-enabled architecture for sewer mining systems, IEEE International Workshop on Cyber-physical Systems for Smart Water Networks (CySWater), 11 April 2016, Vienna, Austria, 1–6, 2016.
Lambrou, T. P., Anastasiou, C. C., Panayiotou, C. G., and Polycarpou, M. M.: A low-cost sensor network for real-time monitoring and contamination detection in drinking water distribution systems, IEEE Sens. J., 14, 2765–2772, 2014.
Liu, X. J. and Zhang, J. W.: CPS compliant fuzzy neural network load frequency control, in: American Control Conference, 10–12 June 2009, St. Louis, MO, USA, ACC'09, IEEE, 2755–2760, https://doi.org/10.1109/ACC.2009.5160181, 2009.
Makropoulos, C. K., Butler, D., and Maksimovic, C.: Fuzzy logic spatial decision support system for urban water management, J. Water Res. Pl., 129, 69–77, 2003.
Ringert, J. O., Rumpe, B., and Wortmann, A.: From software architecture structure and behavior modeling to implementations of cyber-physical systems, arXiv preprint arXiv:1408.5690, 155–170, 2014.
Santucci, J. F. and Capocchi, L.: Fuzzy Discrete-Event Systems Modeling and Simulation with Fuzzy Control Language and DEVS Formalism, in: Sixth International Conference on Advances in System Simulation (SIMUL2014), 12–16 October 2014, Nice, France, 250–255, 2014.
Sarbu, C. and Pop, H. F.: Principal component analysis versus fuzzy principal component analysis: a case study: the quality of Danube water (1985–1996), Talanta, 65, 1215–1220, 2005.
Scherer, D., Dubois, P., and Sherwood, B.: VPython: 3D interactive scientific graphics for students, Comp. Sci. & Eng. , 2, 56–62, 2000.
Serna, M. Á., Sreenan, C. J., and Szymon, F.: A visual programming framework for wireless sensor networks in smart home applications, IEEE Tenth International Conference on Intelligent Sens., Sensor Netw. and Info, Processing (ISSNIP), Singapore, 7–9 April 2015, 1–6, 2015.
Slauddin, F. and Rahman, T. R.: A Fuzzy based low-cost monitoring module built with raspberry pi–python–java architecture, in: International Conference on Smart Sensors and Application (ICSSA), Kualalumpur, Malaysia 26–28 May 2015, 127–132, 2015.
Wang, Z., Song, H., Watkins, D. W., Ong, K. G., Xue, P., Yang, Q., and Shi, X.: Cyber-physical systems for water sustainability: challenges and opportunities, IEEE Commun. Mag., 53, 216–222, 2015.
Whittle, A. J., Girod, L., Preis, A., Allen, M., Lim, H. B., Iqbal, M., and Goldsmith, D.: WATERWISE@ SG: A testbed for continuous monitoring of the water distribution system in Singapore, Water Distribution Systems Analysis, 1, 1362–1378, https://doi.org/10.1061/41203(425)122, 2010.
YSI: 6820 V2 Compact Sonde for Field Sampling of Dissolved Oxygen and More, available at: https://www.ysi.com/6820-V2-2 (last access: 10 October 2017), 2013.
Zadeh, L. A.: Fuzzy sets, Inform. Control, 8, 338–353, 1965.
Zhao, J. and Bose, B. K.: Evaluation of membership functions for fuzzy logic controlled induction motor drive, in: IEEE 28th Annual Conference of the Industrial Electronics Society, Sevilla, Spain, 5–8 November 2002, 229–234, https://doi.org/10.1109/IECON.2002.1187512, 2002.