the Creative Commons Attribution 4.0 License.
the Creative Commons Attribution 4.0 License.
 | 13 Jun 2022
CO2 emissions from peat-draining rivers regulated by water pH
Tim Rixen
Denise Müller-Dum
Moritz Müller
Justus Notholt
Thorsten Warneke
Southeast Asian peatlands represent a globally significant carbon store that is destabilized by land-use changes like deforestation and the conversion into plantations, causing high carbon dioxide (CO2) emissions from peat soils and increased leaching of peat carbon into rivers. While this high carbon leaching and consequentially high DOC concentrations suggest that CO2 emissions from peat-draining rivers would be high, estimates based on field data suggest they are only moderate. In this study, we offer an explanation for this phenomenon by showing that carbon decomposition is hampered by the low pH in peat-draining rivers. This limits CO2 production in and emissions from these rivers. We find an exponential pH limitation that shows good agreement with laboratory measurements from high-latitude peat soils. Additionally, our results suggest that enhanced input of carbonate minerals increases CO2 emissions from peat-draining rivers by counteracting the pH limitation. As such inputs of carbonate minerals can occur due to human activities like deforestation of river catchments, liming in plantations, and enhanced weathering application, our study points out an important feedback mechanism of those practices.
- Article
(8794 KB) -
Supplement
(102 KB) - BibTeX
- EndNote


Rivers and streams emit high amounts of carbon dioxide (CO2) to the atmosphere (Cole et al., 2007), but estimates of these emissions (0.6–1.8 PgC yr−1) are highly uncertain (Aufdenkampe et al., 2011; Raymond et al., 2013). Studies agree that more than three-quarters of global river CO2 emissions occur in the tropics (Raymond et al., 2013; Lauerwald et al., 2015). River CO2 emissions are controlled by the partial pressure difference between CO2 in the atmosphere and the river water (Raymond et al., 2012). Riverine CO2 is fed by the decomposition of organic matter leached from soils (Wit et al., 2015), by direct leaching of dissolved CO2 from soil respiration (Abril and Borges, 2019; Lauerwald et al., 2020), and by photomineralization of dissolved organic carbon (DOC) (Nichols and Martin, 2021; Zhou et al., 2021). Studies suggest Southeast Asia as a potential hotspot for river CO2 emissions (Raymond et al., 2013; Lauerwald et al., 2015) due to the presence and degradation of carbon-rich peat soils. However, measurements of river CO2 emissions from this region are sparse.
More than half of the known tropical peatlands are located in Southeast Asia (Page et al., 2011; Dargie et al., 2017), whereby 84 % of these are Indonesian peatlands, mainly on the islands of Sumatra, Borneo, and Irian Jaya (Page et al., 2011). Already in 2010, land-use change affected 90 % of the peatlands located on Sumatra and Borneo (Miettinen and Liew, 2010) and turned them from CO2 sinks to CO2 sources (Hooijer et al., 2010; Miettinen et al., 2017; Hoyt et al., 2020). Enhanced decomposition in disturbed peatlands additionally increases the leaching of organic matter from soils into peat-draining rivers (Moore et al., 2013; Rixen et al., 2016; Cook et al., 2018). According to Regnier et al. (2013), land-use change remobilizes (1.0±0.5) Pg of soil organic carbon per year, of which 40 % is decomposed in rivers and emitted as CO2 to the atmosphere. The resulting CO2 emissions of 0.4 PgC yr−1 represent 33 % of the total CO2 emissions from rivers (Regnier et al., 2013).
Peat soils are rich in carbon, causing high concentrations of DOC in peat-draining rivers that increase with increasing peat coverage of the river catchments (Wit et al., 2015). However, despite high carbon leaching rates that cause DOC concentrations which can be more than 4 times higher than those in temperate regions (Butman and Raymond, 2011; Müller et al., 2015; Gandois et al., 2020), measured CO2 fluxes from tropical rivers with high peat coverage (18–41 ) hardly exceed those measured for rivers in temperate regions (18.5 , Müller et al., 2015; Butman and Raymond, 2011). Different reasons for this were suggested in literature. Müller et al. (2015) suggested short residence times of peat-derived DOC in rivers due to the location of peatlands near the coast as a possible cause. Other suggestions are the recalcitrant nature of DOC (Müller et al., 2016) and the lack of oxygen (O2, Wit et al., 2015), which both lower the rate of DOC decomposition. Moreover, Borges et al. (2015) suggested a limitation of bacterial production and the resulting DOC decomposition in African peat-draining rivers as a consequence of low pH based on observations at rivers in the Congo basin.
The assumption of low O2 concentrations and pH as a cause for moderate CO2 emissions is supported by the regulating effect of these parameters on decomposition rates in peat soils. pH and O2 are the key parameters that limit the activity of the decomposition-impelling enzyme phenol oxidase (Pind et al., 1994; Freeman et al., 2001). Phenol oxidase is needed to decompose phenolic compounds that are especially present in tropical peat soils (Hodgkins et al., 2018; Yule et al., 2018). Those phenolic compounds are more rapidly decomposed in the upper layer of peat soils than in deep peat (Gandois et al., 2014). Studies agree that the limiting effect of oxygen on decomposition is accurately represented by the Michaelis–Menten kinetics (Fang and Moncrieff, 1999; Pereira et al., 2017). This approach assumes that DOC decomposition is linearly limited for low O2 concentrations but that there is no limitation for higher O2 concentrations once they are sufficient to meet the decomposition demands (Keiluweit et al., 2016). Due to high rates of decomposition caused by the carbon-rich environment and low rates of photosynthesis caused by low nutrient concentrations and dark water colours that limit light availability to algae, peat-draining rivers are usually undersaturated with regard to atmospheric O2 (Wit et al., 2015; Baum and Rixen, 2014). Still, their O2 concentrations exceed those in peat soils due to gas exchange with the atmosphere (Müller et al., 2015; Rixen et al., 2008) and thus are assumed to limit decomposition less strongly than in peat soils (Pind et al., 1994). The same applies to the pH limitation, as pH in peat-draining rivers is usually higher than in peat soils (Pind et al., 1994). Other than for O2 limitation, however, the form of the pH limitation is still subject to discussion. Linear (Sinsabaugh, 2010) and exponential (Williams et al., 2000; Kang et al., 2018) correlations have been stated in the literature.
This study aims at quantifying the limiting impact of pH and O2 on the DOC decomposition in peat-draining rivers to explain the moderate CO2 emissions observed from these rivers. We analysed data from 10 Southeast Asian peat-draining rivers with DOC concentrations between 200 and 3000 µmol L−1 and pH and O2 concentrations ranging from 3.8 to 7.1 and from 50 to 200 µmol L−1, respectively.
This study's methods were separated into two parts. The first part provides information on the study area, conducted measurement campaigns, and collected data that our analyses are based on. The second part describes the processes and equations used to quantify the decomposition dependency on O2 and pH.
2.1 Measurement campaigns and study area
2.1.1 Study area
Southeast Asian peatlands store 42 Pg soil carbon across an area of 271 000 km2 (Hooijer et al., 2010). More than 97 % of these peat soils are located in lowlands (Hooijer et al., 2006). The development of peatlands in Southeast Asia is favoured by its tropical climate with high precipitation rates that range between 120 mm in July and 310 mm in November with an annual mean of 2700 mm yr−1 (Yatagai et al., 2020). Due to land-use changes like deforestation and the conversion into plantations, today less than one-third of those Southeast Asian peatlands remain covered by peat swamp forests, while in 1990 it was more than three-quarters (Miettinen et al., 2016). Southeast Asian rivers mostly originate in mountain regions and cut through coastal peatlands on their way to the ocean (Fig. 1). Measurement data included in this study were obtained in river parts that flow through peat soils to capture the influence of peatlands on the carbon dynamics in the rivers. The impact of sampling locations and seasonality is discussed in Appendix B.

Figure 1Map of river catchments with the location of peat areas. Blue lines indicate the main rivers. Blue shaded areas outline the river basins, and brown areas indicate peatlands. Coloured data points indicate the sampling stations of the individual campaigns.
The collective data for this study were derived from four rivers on Borneo (Sarawak, Malaysia) and six rivers on Sumatra (Indonesia). The investigated rivers on Borneo are the Rajang, Simunjan, Sebuyau, and Maludam, and the rivers surveyed on Sumatra are the Rokan, Kampar, Indragiri, Batang Hari, Musi, and Siak (Fig. 1). We additionally include data from the Siak's tributaries Tapung Kiri, Tapung Kanan, and Mandau. River peat coverages range from 4 % in the Musi catchment to 91 % in the Maludam catchment, whereby the bigger rivers that originate in the uplands generally have lower peat coverages than smaller coastal rivers.
2.1.2 River expeditions and measured parameters
Data were derived from a total of 16 campaigns in Sumatra and Sarawak (Fig. 1, Table A1 in the Appendix). For the Indonesian rivers, 10 measurement campaigns between 2004 and 2013 were conducted. We use published data from Baum et al. (2007) for the Mandau, Tapung Kanan, and Tapung Kiri rivers; from Wit et al. (2015) for the Siak, Indragiri, Batang Hari, and Musi rivers; and from Rixen et al. (2016) for the Rokan and Kampar rivers. CO2 measurements are available for the campaigns performed after 2008.
For the Malaysian rivers, measurements were performed in six campaigns between 2014 and 2017. We use data published by Müller-Dum et al. (2019) and Martin et al. (2018) for the Rajang River and by Müller et al. (2015) for the Maludam campaigns in 2014 and 2015. Additional campaigns for this study were conducted in March 2015 at the Simunjan and Sebuyau rivers as well as in January 2016 and March and July 2017 at the Simunjan, Sebuyau, and Maludam rivers. Measurements of DOC, CO2, and O2 concentrations as well as water pH, water temperatures (T), and gas exchange coefficients (k600) for these additional campaigns were performed in the same manner as during the 2014 Maludam campaign (Müller et al., 2015). However, due to instrumental problems, the CO2, O2, and pH data measured at the Simunjan River in 2016 were not available for our analysis. Table 3 lists the averaged river parameters, including the catchments' peat coverages and atmospheric CO2 fluxes.
During the January 2016 and March and July 2017 campaigns, concentrations of particulate inorganic carbon (PIC) in the form of CaCO3 were measured in addition to the other parameters. These data are not included in the before-mentioned studies. Therefore, we describe the measurement principle here. Discrete water samples, taken from approximately 1 m below the water surface, were filtered through pre-weighed and pre-combusted glass fibre filters (0.7 µm) to sample particulate material within the water volume. To determine the particulate carbon (organic and inorganic), the samples were catalytically combusted at 1050 ∘C, and combustion products were measured by thermal conductivity using an Euro EA3000 elemental analyser. The PIC was determined from the difference between this total particulate carbon and particulate organic carbon that was measured after addition of 1 M hydrochloric acid in order to remove the inorganic carbon from the sample.
2.1.3 River catchment size and peat coverage
River catchment sizes were derived from Hydro-SHEDS (Lehner et al., 2008) at 15 s resolution in WGS 1984 Web Mercator Projection. Sub-basins belonging to the catchments were identified using the HydroSHEDS 15 s flow direction data set and added to the main basins. The estimated accuracy of final catchment lines is 0.4 %.
Catchment peat coverage was derived from peat maps downloaded from https://www.globalforestwatch.org/ (last access: 10 December 2018) for Indonesia and Malaysia. The Indonesian peatland map was published by the Indonesian Ministry of Agriculture (MoA, 2012). The Malaysian peat map was made available by (Wetlands International, 2004) and is based on a national inventory by the Land and Survey Department of Sarawak (1968). Both maps include peatlands in different conditions, from undisturbed peat swamp forest to disturbed peat under plantations, which is nowadays widespread in those countries. Peat coverage was determined from the areal extent of peatlands in the catchment divided by catchment size. Peat coverages derived using other peat maps are compared in Appendix C.
2.2 Analysis of decomposition dependency on pH and O2
Decomposition dependencies on pH and O2 were derived based on the assumption that concentrations of dissolved inorganic carbon (DIC) and O2 in peat-draining rivers, as a first approximation, are derived from an equilibrium between gas exchange with the atmosphere and DOC decomposition in the river water. This approximation assumes photosynthetic CO2 consumption, photomineralization, and direct CO2 leaching from soils to be negligible. We discuss the impact of these processes later on. In this section, we introduce the calculation of atmospheric gas exchange fluxes and decomposition rates. Then we derive equations to quantify decomposition limitations by pH and O2 based on an equilibrium between these two processes.
2.2.1 Gas exchange between rivers and the atmosphere
Atmospheric CO2 fluxes from rivers were calculated from CO2 gas exchange coefficients and river CO2 concentrations according to
Exchange coefficients for CO2 () were calculated from k600 and water temperature according to Wanninkhof (1992) as
An exponent of (valid for rough surfaces; Zappa et al., 2007) was used for the rivers. The temperature T is given in degrees Celsius. pCO is the atmospheric partial pressure of CO2 (≈400 µatm), and describes the temperature-dependent Henry coefficient for CO2, which was calculated according to Weiss (1974) as
and , derived for the individual rivers, are listed in Table A2.
Atmospheric O2 fluxes () were derived analogously to , with calculated according to Wanninkhof (1992) as
and Henry coefficients for O2 () calculated according to Weiss (1970) as
and for the individual rivers in this study are also listed in Table A2.
2.2.2 Decomposition rates and their dependency on pH and O2
The decomposition rate of DOC (R) is defined as molecules of CO2 that are produced per available molecule of DOC during a specific time step and thus represents the proportionality factor between the CO2 production rate and the DOC concentration:
As discussed before, R can be limited by O2 concentrations and by pH. We use an O2 limitation factor that is based on the Michaelis–Menten equation () as suggested by Pereira et al. (2017). For pH limitation, we consider an exponential limitation factor () as suggested by Williams et al. (2000) and a linear limitation factor () as suggested by Sinsabaugh (2010). Considering the definition of pH as the negative decadic logarithm of H+ activity ({H+}), the exponential limitation factor is equivalent to a linear correlation with .
The CO2 production rates due to DOC decomposition for the linear and the exponential pH limitation approach are thus defined as follows.
Rmax is the maximum decomposition rate. Km is the Michaelis constant for O2 inhibition. It is also called the half-saturation constant and gives the O2 concentration at which O2 limits decomposition by 50 % (Loucks and Beek, 2017). λ is the exponential pH inhibition constant, and pH0 is a normalization constant that was set to 7.5 since this is reported to be the optimal pH for the activity of the decomposition-impelling enzyme phenol oxidase (Pind et al., 1994; Kocabas et al., 2008). Calculations of pH0 based on our data and the exponential pH approach are described in Appendix D4. They yield an optimum pH of approximately 7.2 and thus agree well with the pH0 of 7.5 used in this study.
and LpH can take values between 0 and 1. Thus, Eq. (7) is only valid for pH ⩽ pH0. For higher water pH, a different approach would be needed. However, for the rivers in this study Eq. (7) is sufficient since their pH is <7.5 (Table 3). The limitation factors represent the fraction of decomposition that remains after the limitation by the parameter. Later on, we refer to the fraction by which decomposition is limited, which is (1−LpH) for pH limitation and () for O2 limitation. The total fraction by which pH and O2 limit decomposition is given by (). When O2 concentrations and water pH are high enough not to limit the decomposition rate, Eq. (7) simplifies to Eq. (6) with R=Rmax.
2.2.3 Least-squares optimization to quantify the pH and O2 impact on decomposition rates
As mentioned before, we base our calculations on the assumption that DIC concentrations in peat-draining rivers result from an equilibrium between CO2 emissions and CO2 production by decomposition. Thus, we optimized the parameters in Eq. (7) such that the production of CO2 in the water volume beneath a specific surface area equals the atmospheric CO2 flux through this area. The CO2 production is calculated by multiplication of Eq. (7) with the product of river depth d and surface area A, and the CO2 emissions are calculated by multiplication of Eq. (1) with the surface area A:
Analogously, river O2 concentrations result from an equilibrium between the atmospheric O2 flux and O2 consumption due to decomposition. During decomposition, the O2 consumption is proportional to the CO2 production (). The proportionality factor b is usually <1 since a fraction of the O2 used for decomposition is taken from the oxygen content in the dissolved organic matter (Rixen et al., 2008). Thus, the equilibrium between O2 consumption within the water volume and O2 flux through the surface area can be written as
In order to compare these dependencies to measured data, Eq. (8) and Eq. (9) were analytically solved for CO2 and for O2, respectively. The resulting equations based on linear pH limitation () are listed in Table 1. The analogously derived equations for CO2 and O2 based on the exponential pH approach are listed in Table 2.
Table 1Equations to derive CO2 and O2 based on the linear pH approach.

Equations to derive CO2 from measured temperature (T), DOC, pH, and O2 as well as to derive O2 from measured T, DOC, and pH. Rmax, Km, and b, derived via least-squares optimization using measured DOC, pH, T, O2, and CO2 data of the investigated rivers, are listed in Table 5.
Table 2Equations to derive CO2 and O2 based on the exponential pH approach.
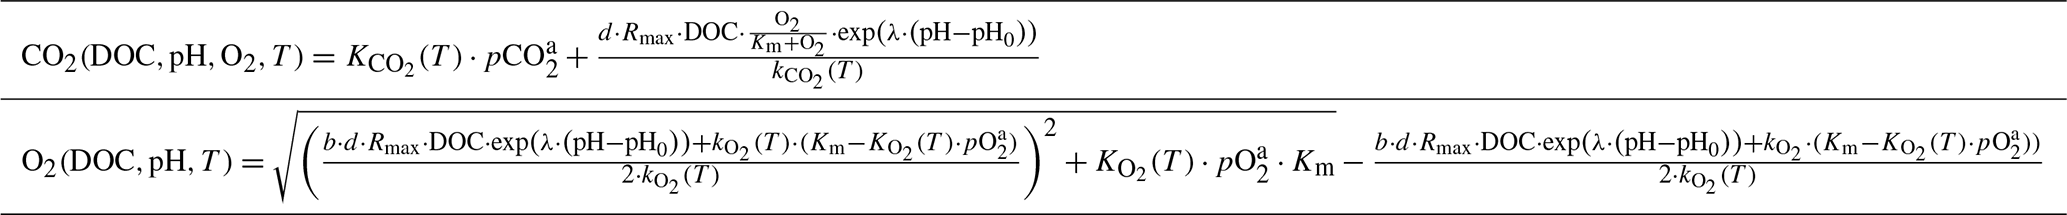
Equations to derive CO2 from measured temperature (T), DOC, pH, and O2 as well as to derive O2 from measured T, DOC, and pH. Rmax, Km, λ, and b, derived via least-squares optimization using measured DOC, pH, T, O2, and CO2 data of the investigated rivers, are listed in Table 5.
Based on these equations, least-squares optimizations were performed to derive the decomposition parameters Rmax, b, Km, and λ such that CO2(DOC, pH, O2, T) and O2(DOC, pH, T) are simultaneously optimized for the measured parameters of DOC, pH, T, CO2, and O2.
The equations in Tables 1 and 2 depend on the river gas exchange coefficients for CO2 () and O2 (), which both depend on k600. Those exchange coefficients are poorly constrained and spatially as well as temporally extremely variable. The k600 values we list in this study are based on a variety of techniques, including floating chamber measurements (Müller et al., 2015), calculations based on wind speed and catchment parameters (Müller-Dum et al., 2019), and balance models of water parameters (Rixen et al., 2008). Although all of those estimates remain highly uncertain, we find a fairly good agreement between k600 and river depths (d, Fig. A1). We therefore use a fixed ratio of for the least-squares optimizations rather than individual exchange coefficients and depths of the rivers.
3.1 Correlation with peat coverage
The data presented in Table 3 yield a linear increase in river DOC concentration with peat coverage (Fig. 2a) as well as a negative linear correlation between river pH and peat coverage (Fig. 2b). The river CO2 concentration shows a strong increase for peat coverages <30 %. Despite further increase in DOC concentrations, CO2 concentrations in rivers with peat coverage >30 % level off, resulting in a fairly constant CO2 for peat coverages >50 % (Fig. 2c). The river O2 shows an opposite behaviour to the CO2. O2 concentrations initially decrease with increasing peat coverage and show a decline in the regression rate for high peat coverages, resulting in a minimum O2 concentration of approximately 65 µmol L−1 (Fig. 2d).
Table 3Measured data from the investigated rivers.
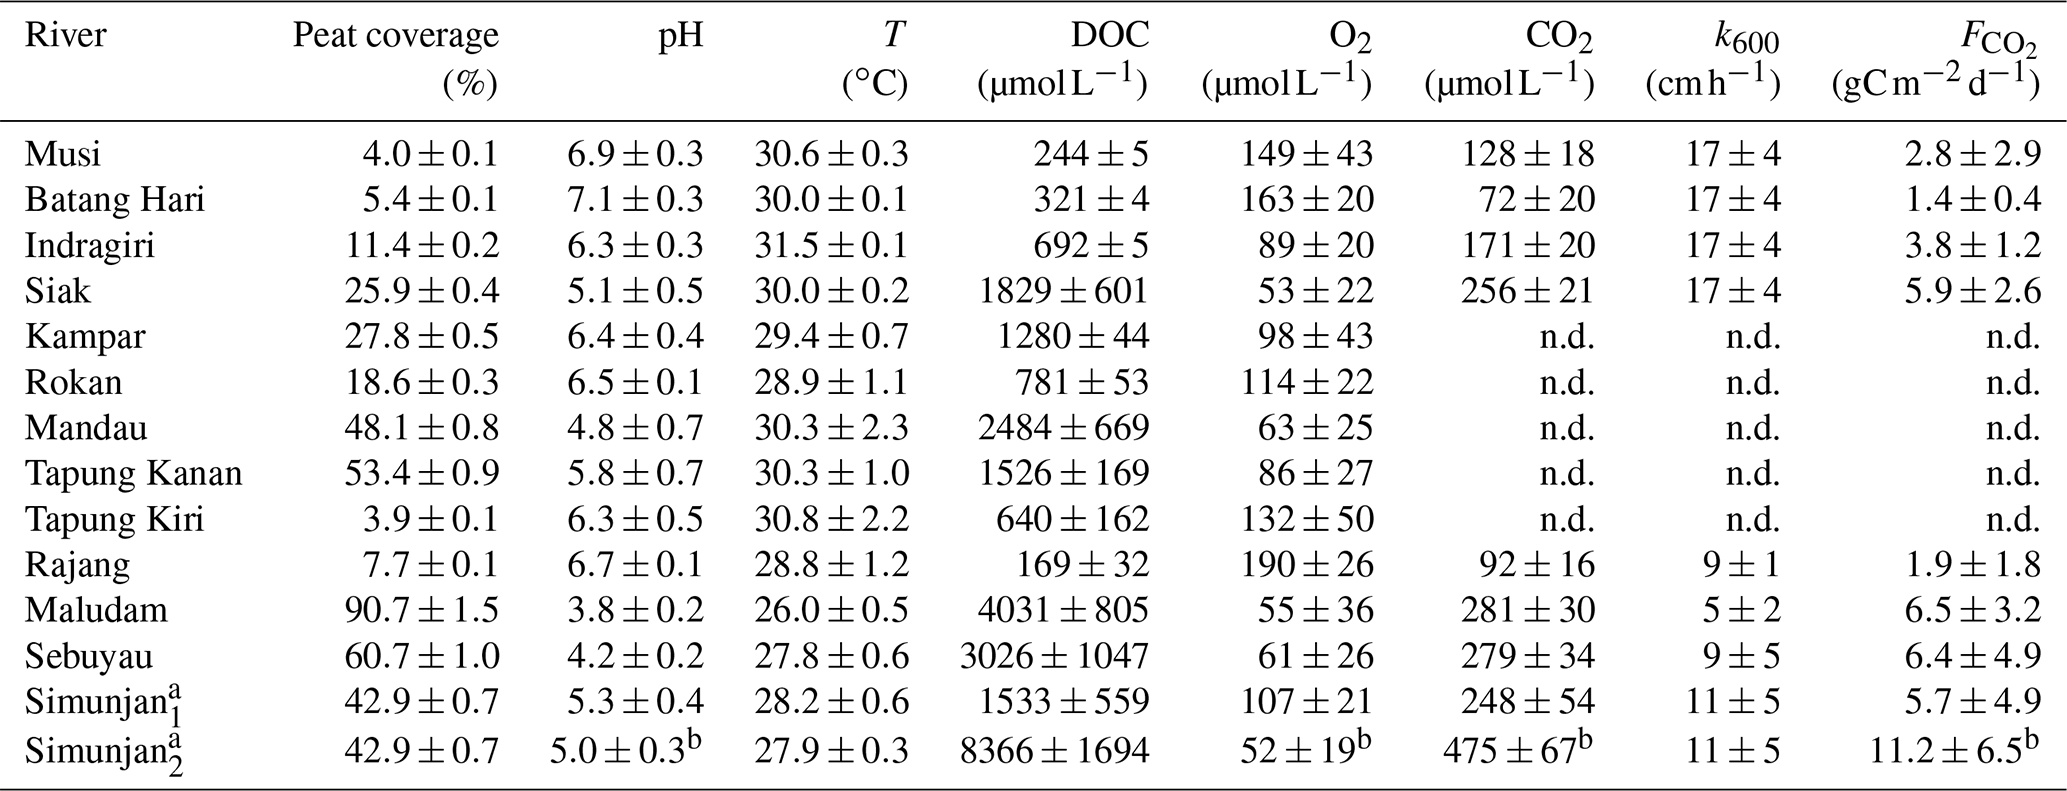
Values are means of river campaigns. Data variability is given by the standard deviation of the measurements. For rivers with campaigns exclusively before 2009 there are no data (n.d.) on river CO2 concentrations or fluxes. a For the Simunjan, the March 2015 and July 2017 campaigns (Simunjan1) were separated from the January 2016 and March 2017 campaigns (Simunjan2) due to strong differences in the parameters. b Due to technical problems during the Simunjan campaign in January 2016, these values are only based on one measurement campaign.
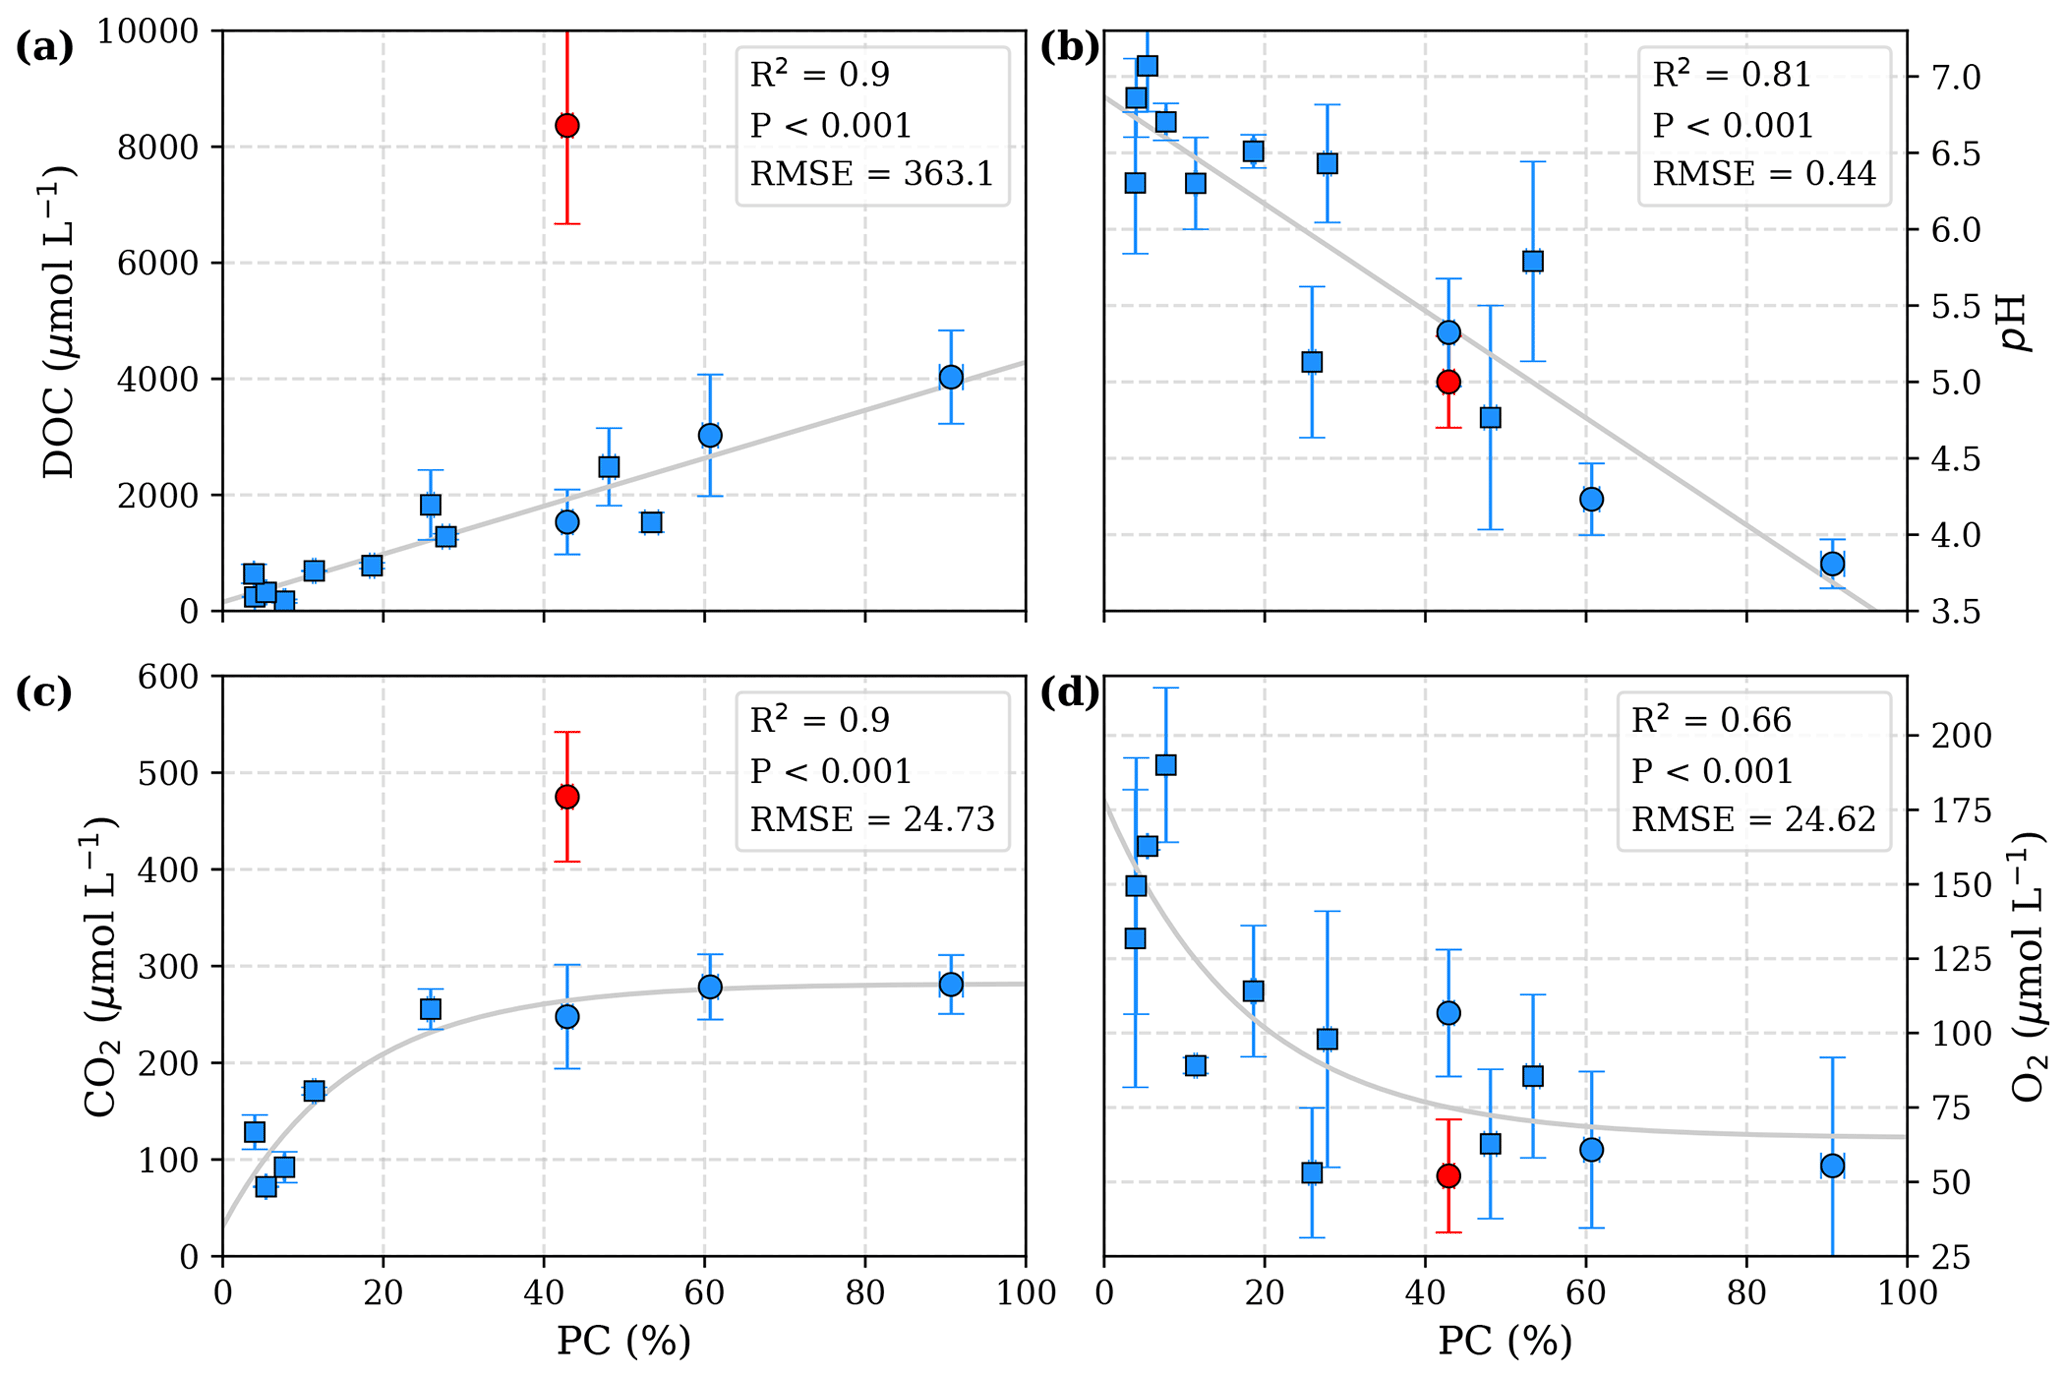
Figure 2Correlation of peat coverage (PC) with (a) DOC, (b) pH, (c) CO2, and (d) O2. Each data point represents one river. Variability is indicated by the error bars, which are given by standard deviation. For the Simunjan River, the January 2016 and March 2017 campaigns (Simunjan2; see Tables 3 and 4), indicated by red data points, were separated from the other Simunjan campaigns (Simunjan1) and excluded from the correlations due to strong deviations from the other campaigns that imply an additional process discussed in Sect. 4.4. Ordinary least-squares optimizations were used to calculate linear correlations with DOC and pH and exponential correlations with CO2 and O2. Rivers included in a previous study investigating these correlations (Wit et al., 2015) are indicated by squares.
Table 4Data measured in the four Simunjan campaigns.
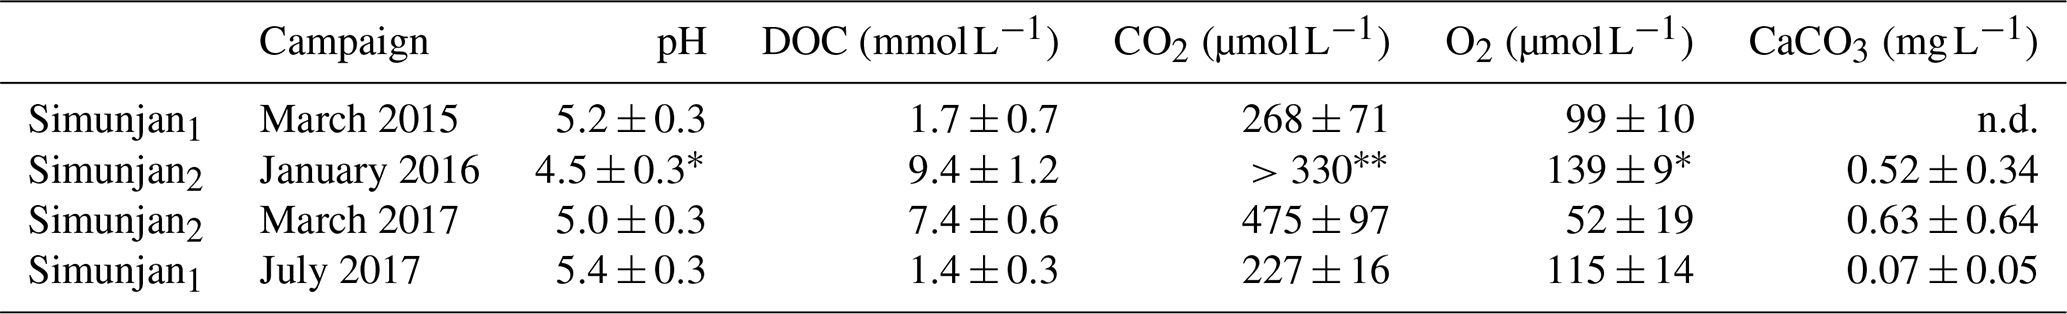
Values are means of measurements. Data variability is given by standard deviation of measurements. * Due to technical problems, the March 2017 pH, CO2, and O2 data need to be treated cautiously. In March 2017 only a minimum CO2 concentration could be derived.
The Simunjan River shows exceptions to these correlations. Although generally CO2 concentrations stagnate for high peat coverages, extremely high CO2 concentrations were measured during two campaigns in the Simunjan River (Fig. 2). In January 2016 and March 2017 DOC and CO2 concentrations in the Simunjan River were significantly higher than in March 2015 and July 2017 (Simunjan1, Table 4). O2 concentrations during these campaigns were lower (≈50 µmol L−1) than for the other Simunjan campaigns (≈107 µmol L−1), while the water pH of 5.0 was only slightly lower than during the other campaigns (pH≈5.3). The Simunjan campaigns with high DOC and CO2 concentrations were accompanied by high concentrations of particulate carbonate (CaCO3, Table 4), while CaCO3 concentrations in July 2017 were much lower.
3.2 Limitation of decomposition rates by pH and O2
To gain a better understanding of the pH and O2 impacts on decomposition rates, least-squares optimizations of the equations in Table 1 (linear pH limitation) and Table 2 (exponential pH limitation) were performed based on measured pH, DOC, CO2, O2, and temperature data. The resulting decomposition parameters for the two pH approaches are listed in Table 5. A quality assessment of the least-squares optimizations can be found in Appendix D.
Table 5Decomposition parameters derived via least-squares optimization.
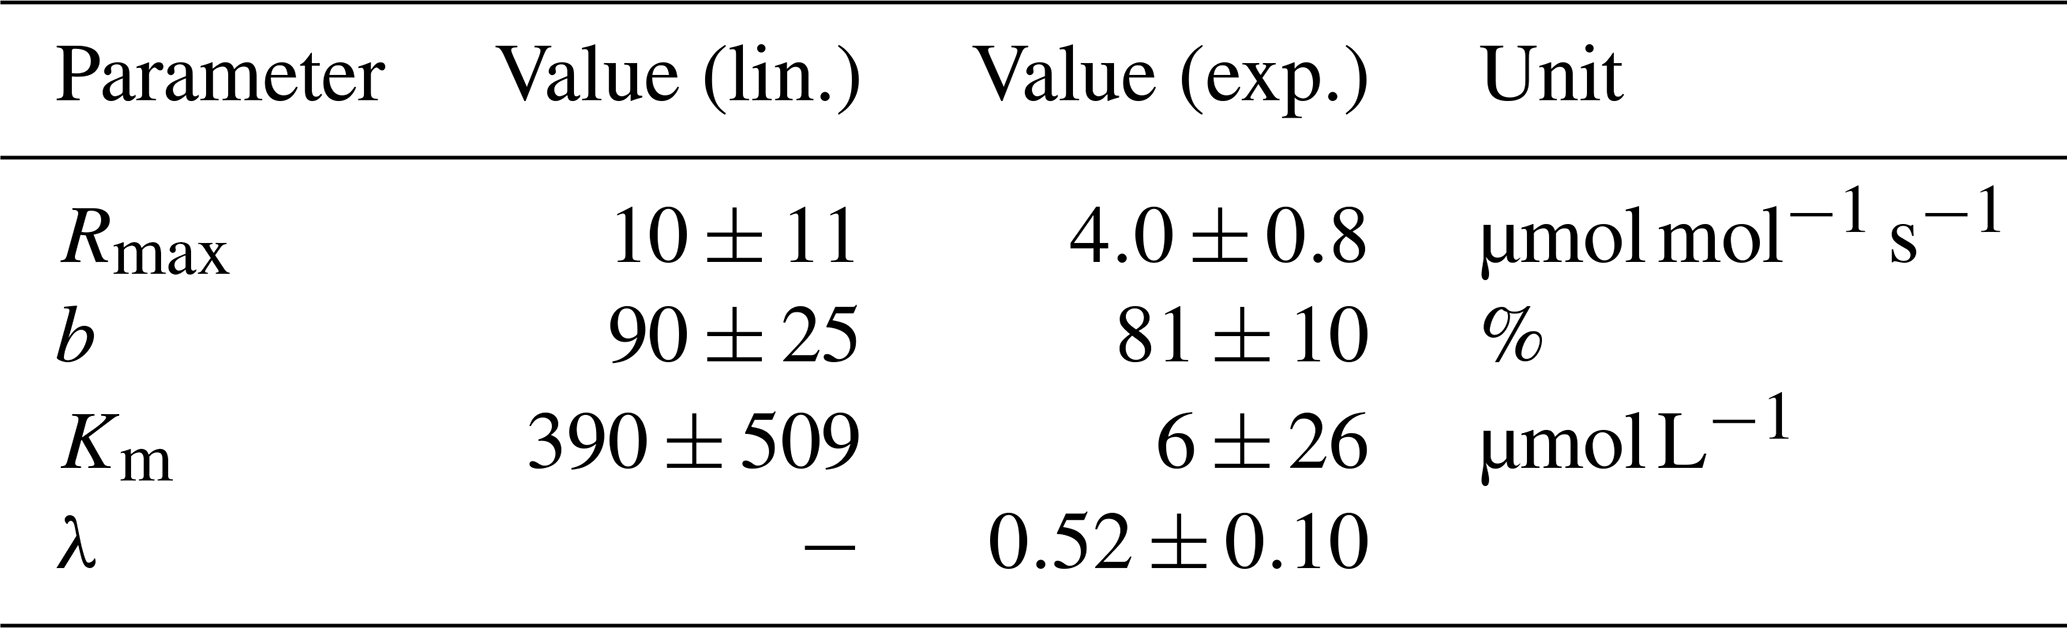
Data for linear (lin.) and exponential (exp.) approaches for the pH limitation of decomposition were derived via least-squares optimization of the equations in Table 1 and Table 2, respectively. Rmax is the maximum decomposition rate, b is the fraction of O2 consumption, Km is the Michaelis constant for O2 limitation, and λ is the exponential pH limitation constant.
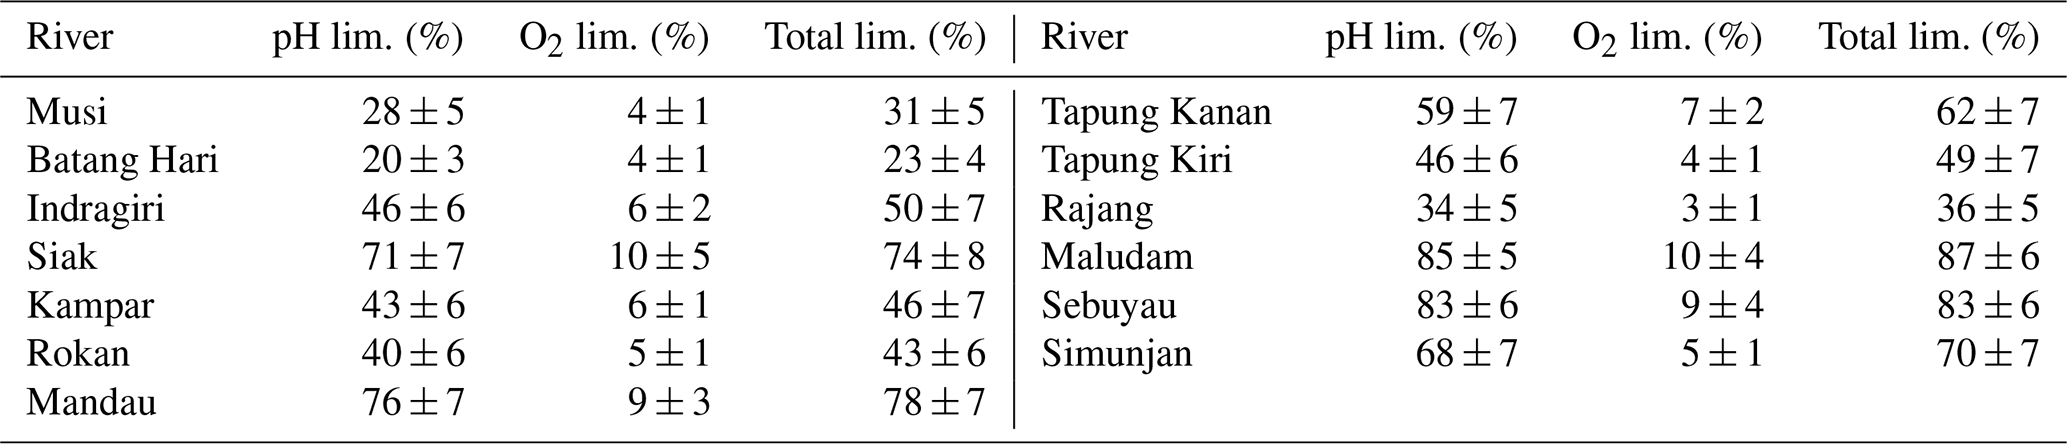
For the linear pH limitation approach, the decomposition parameters result in a Michaelis constant for O2 limitation of , a maximum decomposition rate of , and a fraction of O2 consumption of b≈90 % (Table 5). Thus, the fraction by which pH limits decomposition according to this linear approach ranges from 6 % in the Batang Hari to 49 % in the Maludam, and the limitation by O2 ranges from 71 % in the Batang Hari to 88 % in the Maludam and Siak. In total, O2 and pH would limit decomposition in a range between 71 % and 93 %. Limitation fractions for all rivers are listed in Table A3.
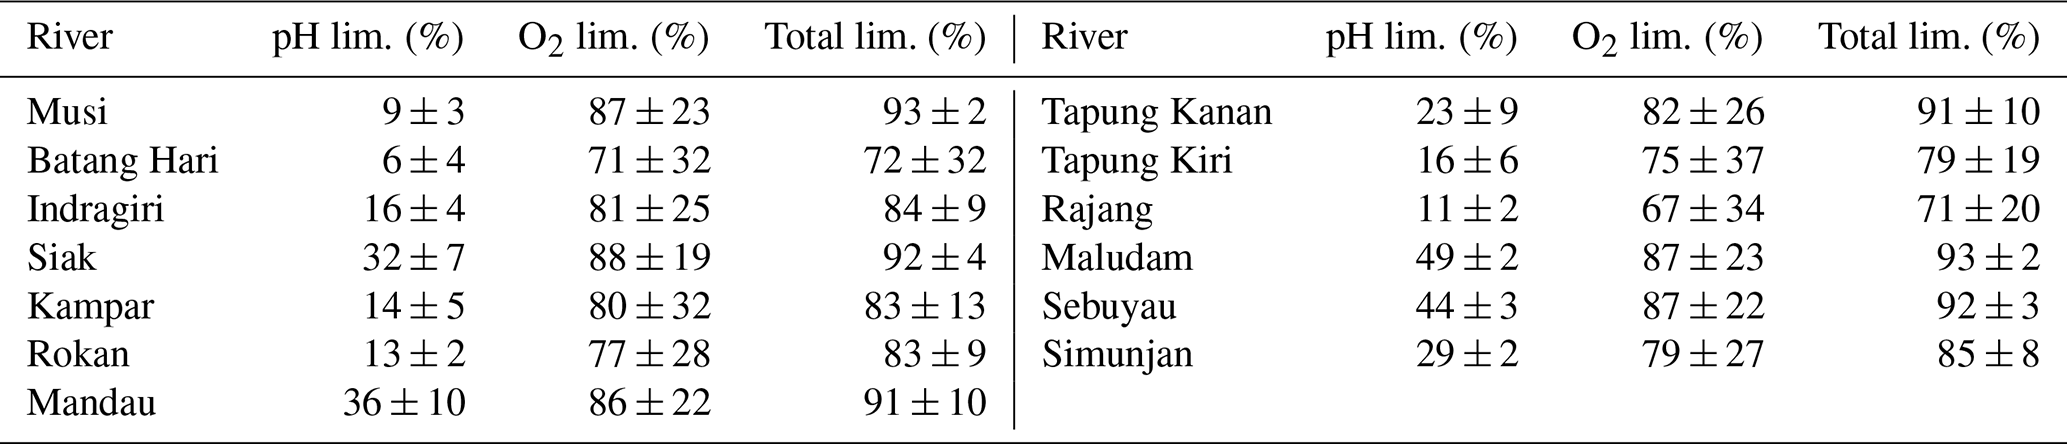
For the exponential pH limitation approach, the Michaelis constant for O2 () is significantly smaller than the constant derived for linear pH limitation (Table 5). The maximum decomposition rate () and the fraction of O2 consumption (b≈81 %) are also smaller than for linear pH limitation, but on the same order of magnitude. The exponential pH limitation factor results in λ≈0.5. According to these parameters, O2 limits decomposition in the investigated rivers by ≤10 %, while the fraction of pH limitation ranges from 20 % in the Batang Hari to 85 % in the Maludam. The total limitation by O2 and pH ranges from 23 % to 87 % (Table A4).
To evaluate both decomposition approaches, CO2 and O2 concentrations calculated based on the equations in Tables 1 and 2 with the parameters in Tables 3 and 5 were compared to measured CO2 and O2 concentrations in the individual rivers. For the linear pH limitation approach, correlation coefficients for CO2 and O2 correlations are R2=0.80 and R2=0.88, respectively (Fig. 3). For the exponential pH limitation approach, the resulting correlation coefficients are similar, whereas the correlation for CO2 (R2=0.89) is slightly stronger and the O2 correlation (R2=0.85) is slightly weaker (Fig. 4).
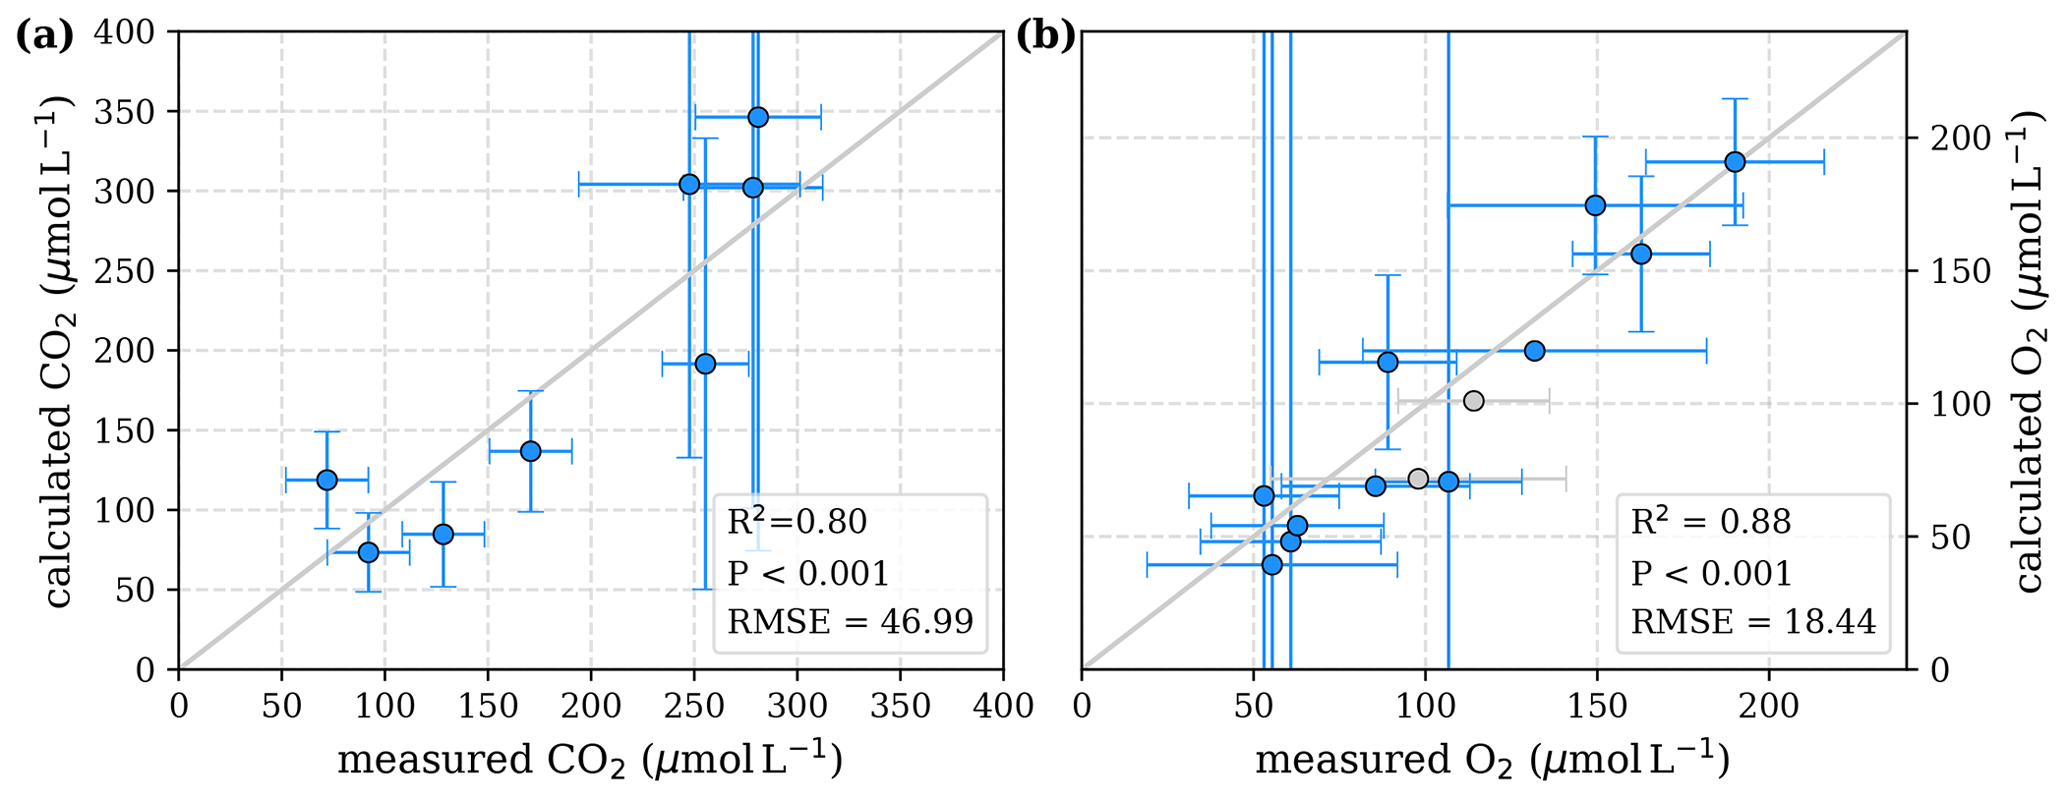
Figure 3Correlation between measured and calculated concentrations of (a) CO2 and (b) O2. Grey lines indicate the 1:1 line. Calculations were performed based on the equations in Table 1 which represent linear pH limitation of decomposition rates. Each data point represents one river. Grey data points are excluded from the correlation since the data for these rivers are based on fewer than three campaigns within the same season. This includes the Simunjan campaigns with high carbon concentrations, which are excluded here due to figure scaling and further discussed in Appendix D5.
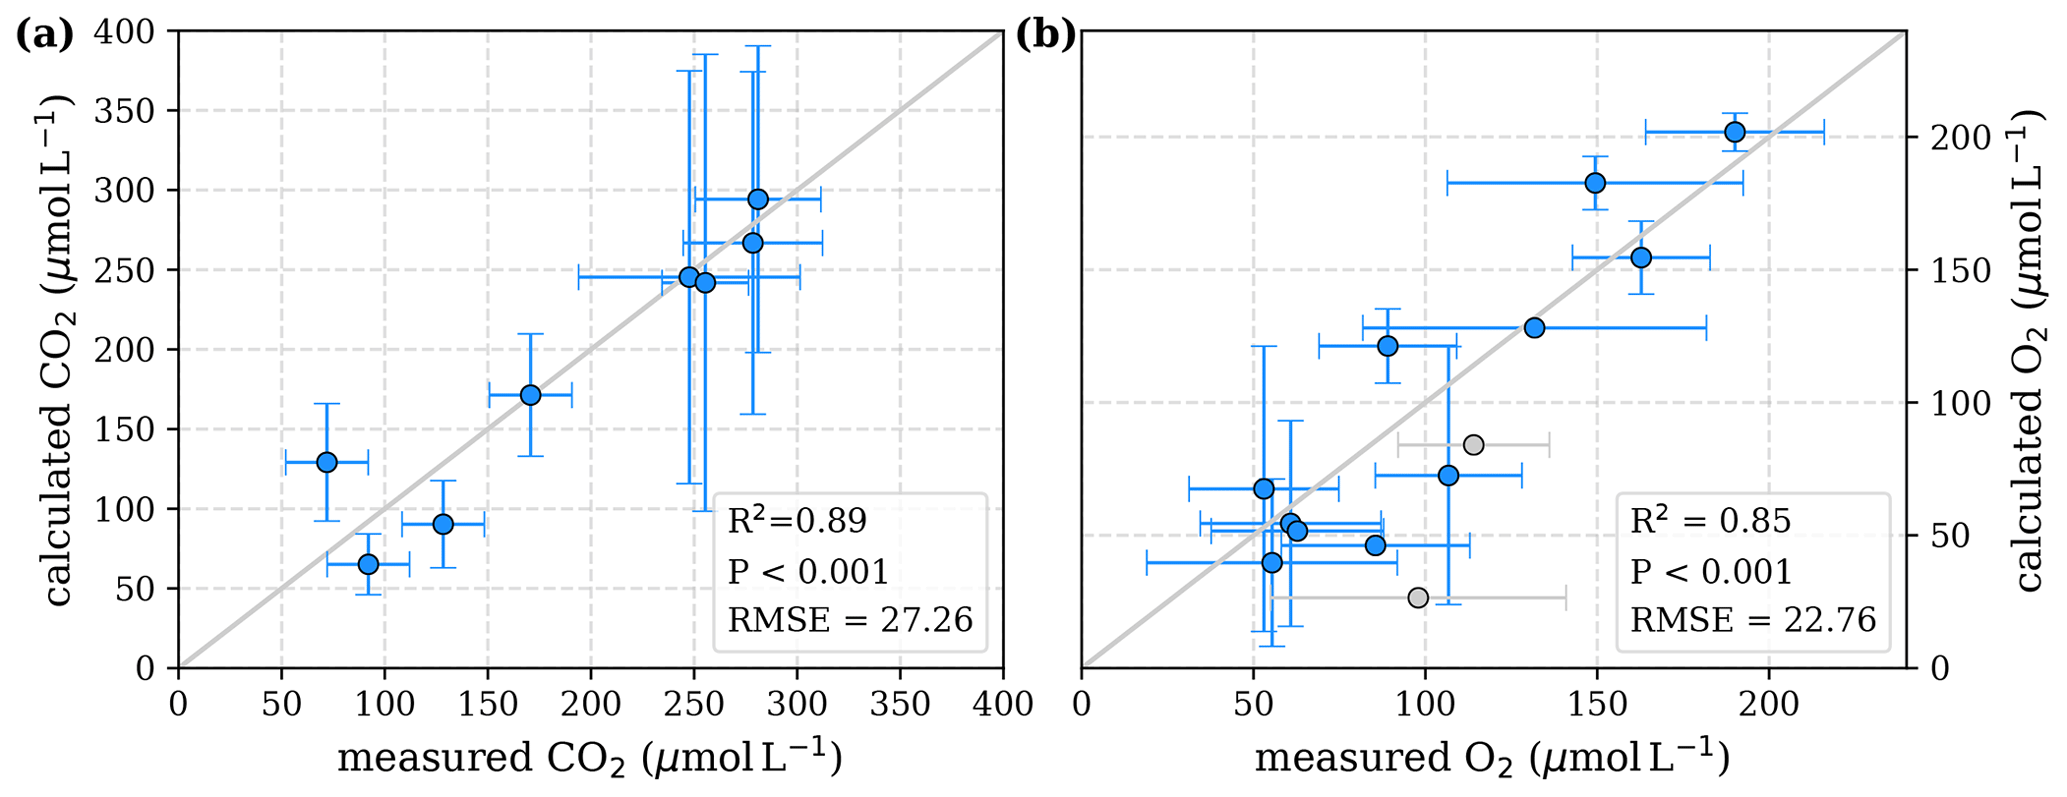
Figure 4Correlation between measured and calculated concentrations of (a) CO2 and (b) O2. Grey lines indicate the 1:1 line. Calculations were performed based on the equations in Table 2 which represent exponential pH limitation of decomposition rates. Each data point represents one river. Grey data points are excluded from the correlation since the data for these rivers are based on fewer than three campaigns within the same season. This includes the Simunjan campaigns with high carbon concentrations, which are excluded here due to figure scaling and further discussed in Appendix D5.
4.1 Carbon dynamics in peat-draining rivers and their dependencies on peat coverage
The linear correlations observed between peat coverage and DOC (Fig. 2a) as well as between peat coverage and pH (Fig. 2b) agree with results by Wit et al. (2015) and confirm the importance of peat soils as a major DOC source to these rivers, whereas the decomposition of DOC and leaching of organic acids lower the pH. The initial increase in CO2 concentrations (Fig. 2c) and decrease in O2 concentrations (Fig. 2d) with peat coverage can be explained by increased DOC decomposition due to higher DOC concentrations and also agrees with the results of Wit et al. (2015).
Previous studies included no data for rivers with peat coverage >25 % (Wit et al., 2015). In this study, we include additional campaigns at rivers with peat coverages up to 91 %. We observe that CO2 concentrations in rivers of peat coverage >30 % level off to fairly constant values for peat coverage >50 % (Fig. 2c). This agrees with moderate CO2 emissions that were stated for those rivers (Müller et al., 2015; Moore et al., 2013). We find that, according to Eq. (7), the stagnation can be explained by the pH and O2 limitations of decomposition. A similar pattern of stagnating CO2 concentrations has been observed in river sections of high DOC at the Congo River (Borges et al., 2015). The CO2 and DOC concentrations measured in these rivers are comparable to those measured in our study, indicating that the underlying process is valid not only for Southeast Asian rivers but for tropical peat-draining rivers in general.
4.2 Decomposition in peat-draining rivers and its dependency on O2 and pH
We were able to reproduce the stagnation in CO2 and O2 concentrations by introducing O2 and pH limitations for decomposition rates in the rivers. Model approaches for both linear and exponential pH limitation factors reproduce the observed stagnation in CO2 and O2 concentrations and result in reasonably good correlations with the measured concentrations (Figs. 3 and 4). However, to evaluate the quality of the two approaches, the resulting parameters need to be further discussed.
The fractions of O2 consumption by decomposition that we derived for both approaches, with and , agree with the fraction of 0.8 that was calculated based on the oxygen-to-carbon ratio in Southeast Asian peat soils (Rixen et al., 2008).
The maximum decomposition rates of for the exponential approach and for the linear approach are higher than global soil phenol oxidase activity data published by Sinsabaugh et al. (2008) that stated global average soil phenol oxidase activity of 70.6 µmol h−1 g−1 organic matter. For a carbon content in organic matter of 38 mmol g−1 (Sinsabaugh, 2010), this represents approximately , while sites of high phenol oxidase activity are listed with up to (Sinsabaugh et al., 2008). Thus, the derived Rmax values are slightly higher than measured decomposition rates and therewith of a realistic order of magnitude.
4.2.1 Functional dependency of decomposition on O2
The two Michaelis constants for O2 limitation of decomposition, derived for the linear and exponential pH limitation approaches, differ strongly (Table 5). As discussed before, the Michaelis constant represents the O2 concentration at which O2 availability limits decomposition by 50 %. In literature, Michaelis constants between 1 and 40 µmol L−1 are suggested for the O2 impact on phenol oxidase, depending on the phenolic species (Fenoll et al., 2002).
The linear pH limitation approach yields a Michaelis constant of . This constant is higher than the O2 concentration in atmospheric equilibrium (), which implies an oxygen deficit at atmospheric conditions that does not exist (Vaquer-Sunyer and Duarte, 2008). However, though the derived Km value for this linear pH limitation is unrealistically high, this does not necessarily negate the linear pH approach. High parameter interdependence between Km and Rmax complicate the computation of these decomposition parameters (Sect. D1). To disentangle the impact of the intercorrelated parameters, additional least-squares optimizations at fixed Km values ranging from 1 to 40 µmol L−1 (Fenoll et al., 2002) were performed (Sect. D2). These optimizations result in maximum decomposition rates of Rmax = (1.4–2.4) and O2 consumption factors of and therewith do not agree with literature values of these parameters ( and b≈80 %; Sinsabaugh et al., 2008; Rixen et al., 2008).
The exponential pH limitation approach yields a Michaelis constant of . This value is in good agreement with the literature data of 1 to 40 µmol L−1 (Fenoll et al., 2002). Its large uncertainty (>400 %, Table 5) is mainly caused by relatively high concentrations of O2 in the rivers. Due to exchange with atmospheric O2, the concentrations in all rivers exceed the median O2 threshold to lethal hypoxic conditions of 50 µmol L−1 (Vaquer-Sunyer and Duarte, 2008). Thus, the O2 limitation in peat-draining rivers is relatively small (between 3 % and 10 %, Table A4). Consequentially a majority of the decomposition limitation is caused by the low pH in peat-draining rivers that we found to limit the decomposition rates in rivers of high peat coverage (low pH) by up to 85 % (Table A4).
4.2.2 Functional dependency of decomposition on pH
Our results indicate the exponential pH limitation of decomposition to be more realistic than the linear pH limitation. The exponential limitation better represents river CO2, especially for high CO2 concentrations which are most strongly affected by the pH limitation. The exponential limitation is additionally supported by the unrealistically high O2 limitation resulting from the linear pH approach. The strong collinearity between decomposition parameters in the linear pH limitation approach complicates the interpretation of the parameters mentioned above. Additional calculations of the parameters Rmax and b for fixed Km disagree with literature data and thus further disprove the linear approach (Sect. D2).
The exponential pH coefficient results in . Thus, in terms of H+ activity the correlation is given by , which roughly equals the fifth root of H+ activity. The derived limitation coefficient is similar to coefficients reported for high-latitude peat soils (λ=0.65 and λ=0.77) that were determined via laboratory measurements of phenol oxidase activity (Williams et al., 2000). The fact that the exponential inhibition by pH can be found in those high-latitude peat soils, as well as in tropical peat-draining rivers, suggests that the investigated correlations and processes are also relevant in other regions and that soil pH and water pH are important regulators of global carbon emissions.
4.3 Impact of additional processes
Our results neglect the direct leaching of CO2 from soils as well as the photo-mineralization of DOC and the consumption of CO2 by autotrophic production within rivers. CO2 leaching rates are likely higher for peat soils than for mineral soils (Kang et al., 2018; Abril and Borges, 2019), and autotrophic production is limited in peat-draining rivers (Wit et al., 2015). Thus, both of these processes would work against the observed stagnation in CO2 concentrations, and the exclusion of these processes could cause underestimation of the limitation factors rather than overestimation.
A recent study by Nichols and Martin (2021) found low phenol oxidase activity in Southeast Asian peat-draining rivers and low degradation of DOC from those rivers in an additional incubation experiment. They concluded that the remineralization of peat-derived DOC in Southeast Asian aquatic systems is likely dependent on photodegradation rather than microbial respiration (Nichols and Martin, 2021). This is supported by photolability of DOC from those regions (Martin et al., 2018). However, photomineralization rates would not be impacted by river pH or O2. Thus, with photomineralization as the main cause of DOC degradation, no stagnation in CO2 is expected. Accordingly, photomineralization of DOC, like the before-mentioned processes, would work against the observed CO2 stagnation and could cause underestimation of the limitation parameters.
4.4 Disruption of the pH limitation by carbonates
Typically, concentrations of particulate carbonate in peat-draining rivers are low (Wit et al., 2018). However, we observed high CaCO3 concentrations for two of the four campaigns in the Simunjan River. These two campaigns also show high DOC and CO2 concentrations (Table 4). Possible causes for high carbonate concentrations during these campaigns could be increased erosion of mineral soils due to deforestation in mountain regions upstream or liming practices in plantations along the river. In either case, high carbonate concentrations at such a low pH indicate high dissolution of carbonates, which might have counteracted a more prominent decrease in pH due to decomposition of DOC. At the same time, the low river pH causes transformation of dissolved carbonates to CO2 and thus additionally increases CO2 concentrations. These processes seem to have suspended the natural pH limitation of CO2 production in peat-draining rivers. This explains the high CO2 concentrations observed during those two Simunjan campaigns (Table 4). Calculation based on the derived decomposition dependencies would indicate even higher CO2 concentrations than measured. This indicates that the river carbon parameters were not in thermodynamic equilibrium during these campaigns as is further discussed in Sect. D5.
Our study shows that CO2 concentrations in and emissions from Southeast Asian rivers stagnate for high peat coverages of the river catchments. Despite further increase in river DOC concentrations, CO2 concentrations are fairly constant for peat coverages >50 %. We find that this stagnation is caused by a natural limitation of DOC decomposition in these rivers. This process provides an explanation of moderate CO2 emissions measured from rivers of high carbon content
Correlation to measured data indicates that the limitation in decomposition is mainly caused by low river pH. Data reveal an exponential limitation of DOC decomposition by pH as the most realistic scenario. This reduces the CO2 production in rivers of high peat coverage by up to 85 %. The limiting impact of O2 on decomposition in the rivers is comparatively small with <10 %. This derived limitation of decomposition should be included to improve model studies and accurately capture river CO2 emissions from tropical peat areas.
Campaigns with high carbon loads in the Simunjan River indicate that the natural CO2 limitation can be suspended by high input of DOC and carbonates. Data from campaigns with enhanced concentrations of DOC and suspended carbonates reveal CO2 emissions that were increased by almost 100 %. Here, the high DOC concentrations enhance decomposition, and the input of carbonates counteracts the pH decrease associated with large inputs of CO2. Possible sources for enhanced carbonate concentrations can be soil erosion upstream of coastal peatlands, or liming practices in plantations along the rivers, which are common practice to improve plant growth on acidic soils. This carbonate impact should be considered for anthropogenic activities like liming and enhanced weathering.
Our study is based on measurements in Southeast Asian peat-draining rivers. However, comparison to data from African rivers and laboratory studies of decomposition in temperate peat soils suggests that the investigated correlations and processes are also relevant in other regions and that soil pH and water pH are important regulators of global carbon emissions.
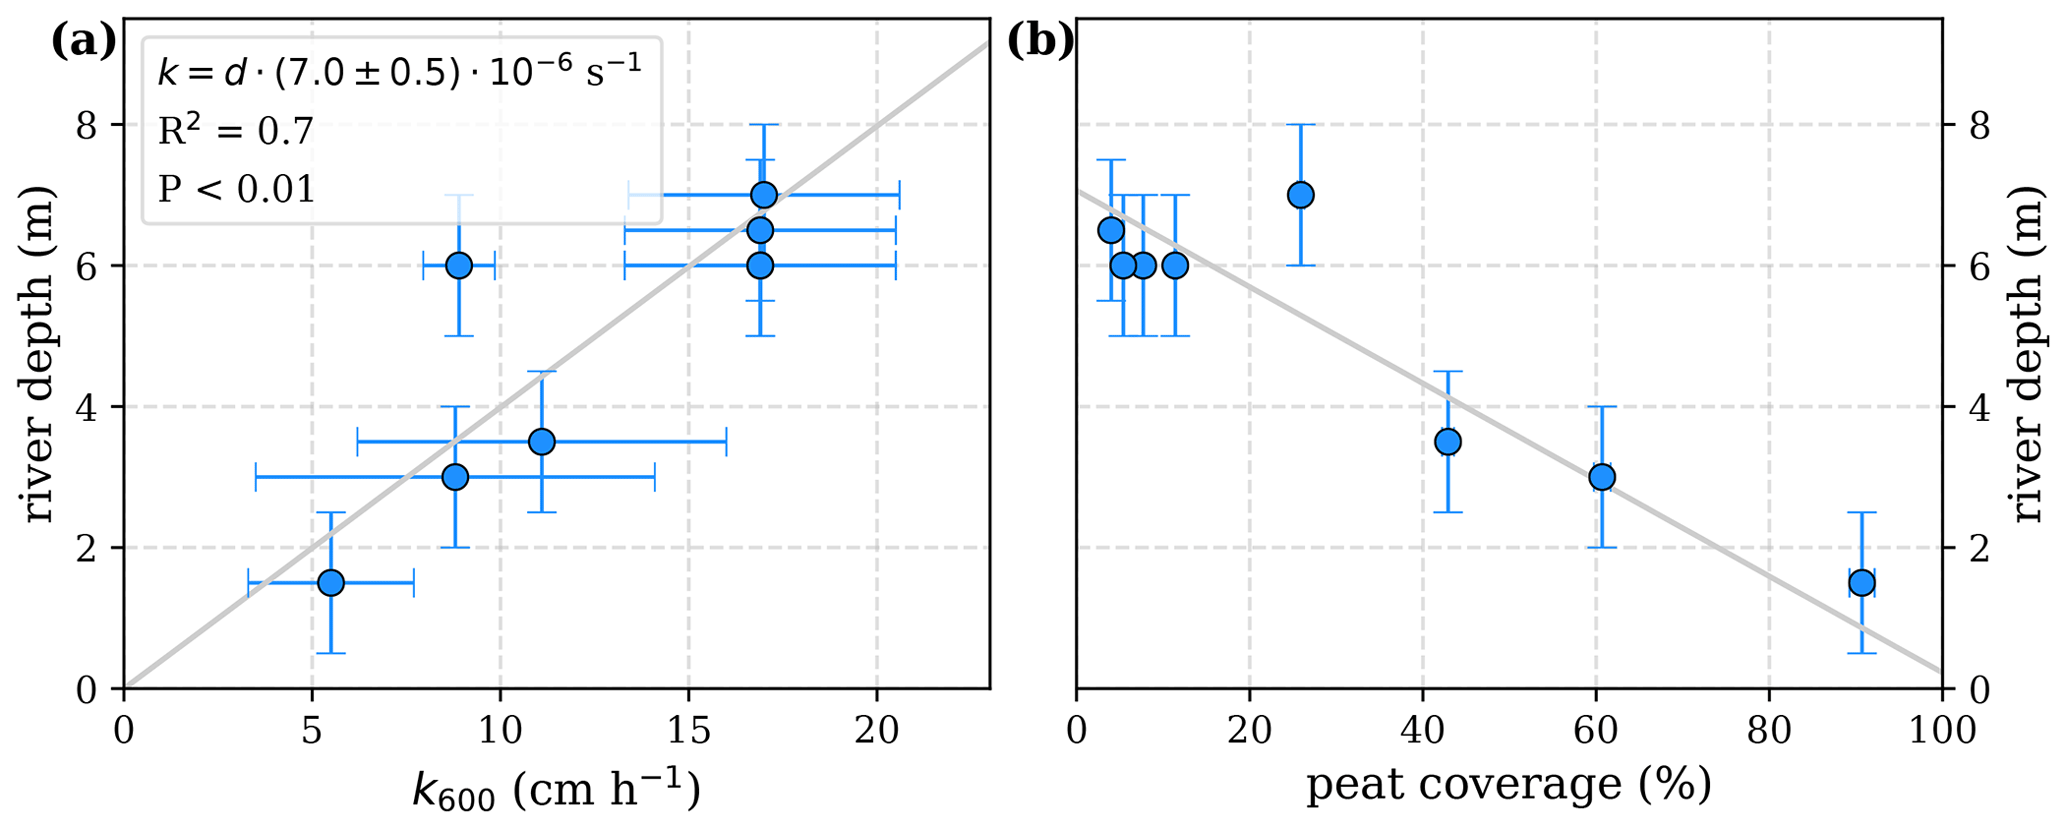
Figure A1Correlation of river depth with (a) atmospheric exchange coefficients (k600) and (b) catchment peat coverage. A linear correlation between river depth and exchange coefficient reveals a slope of .

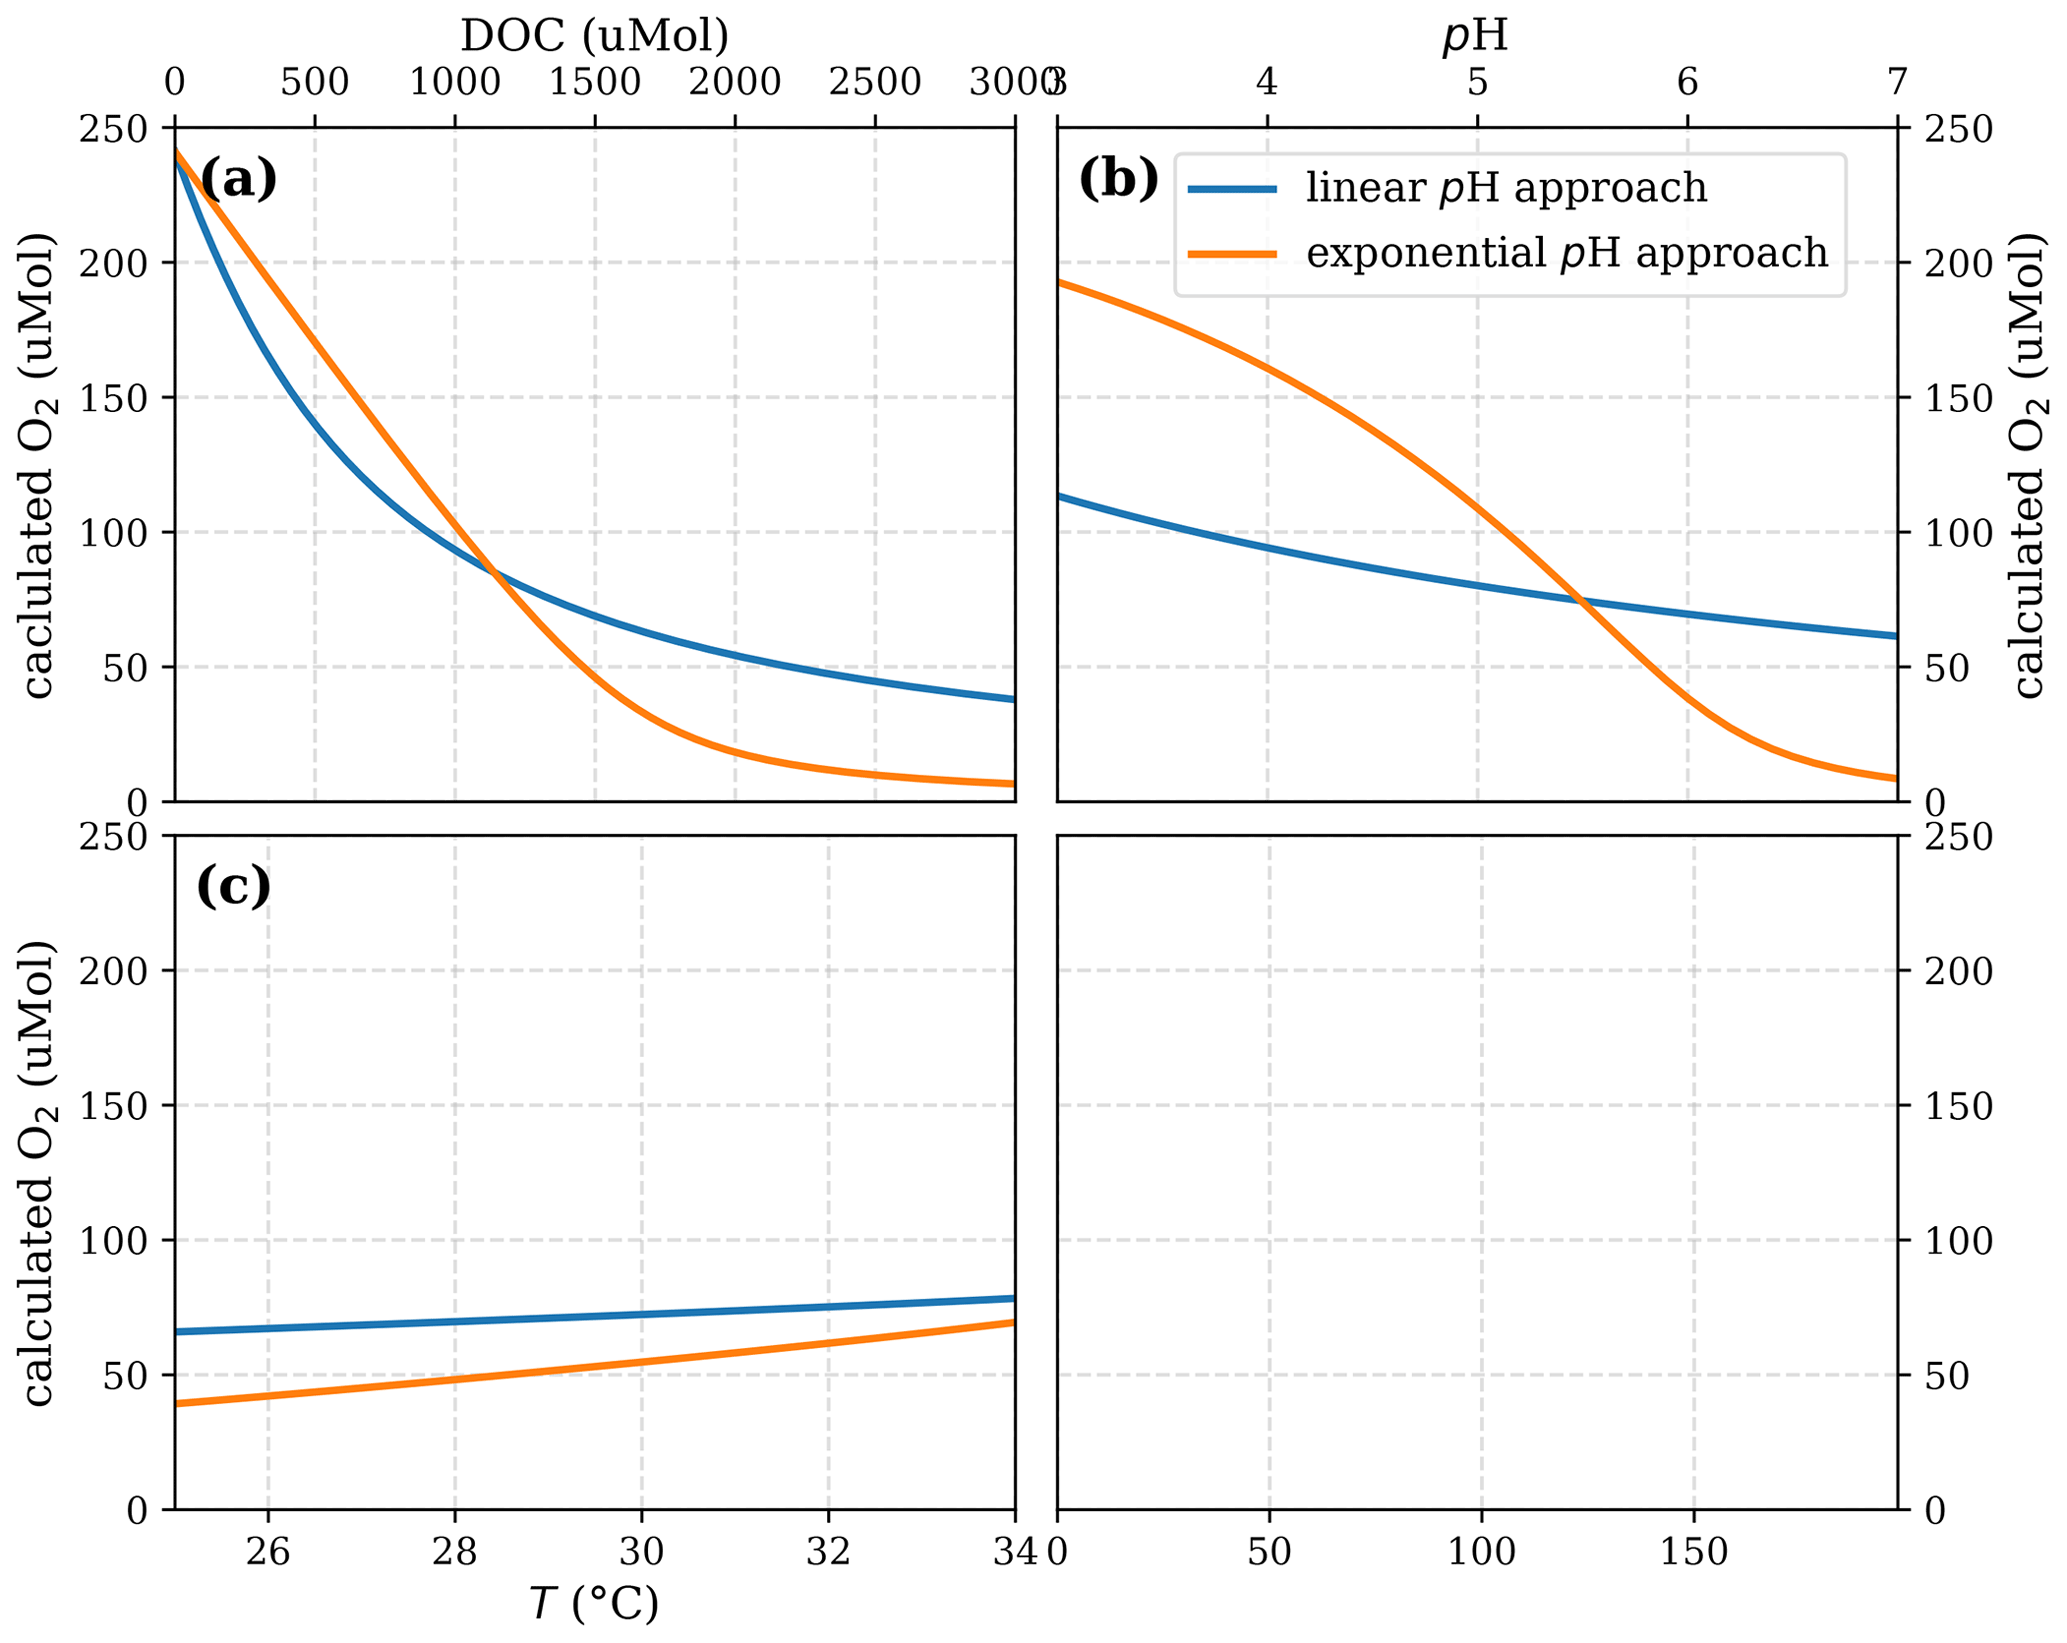
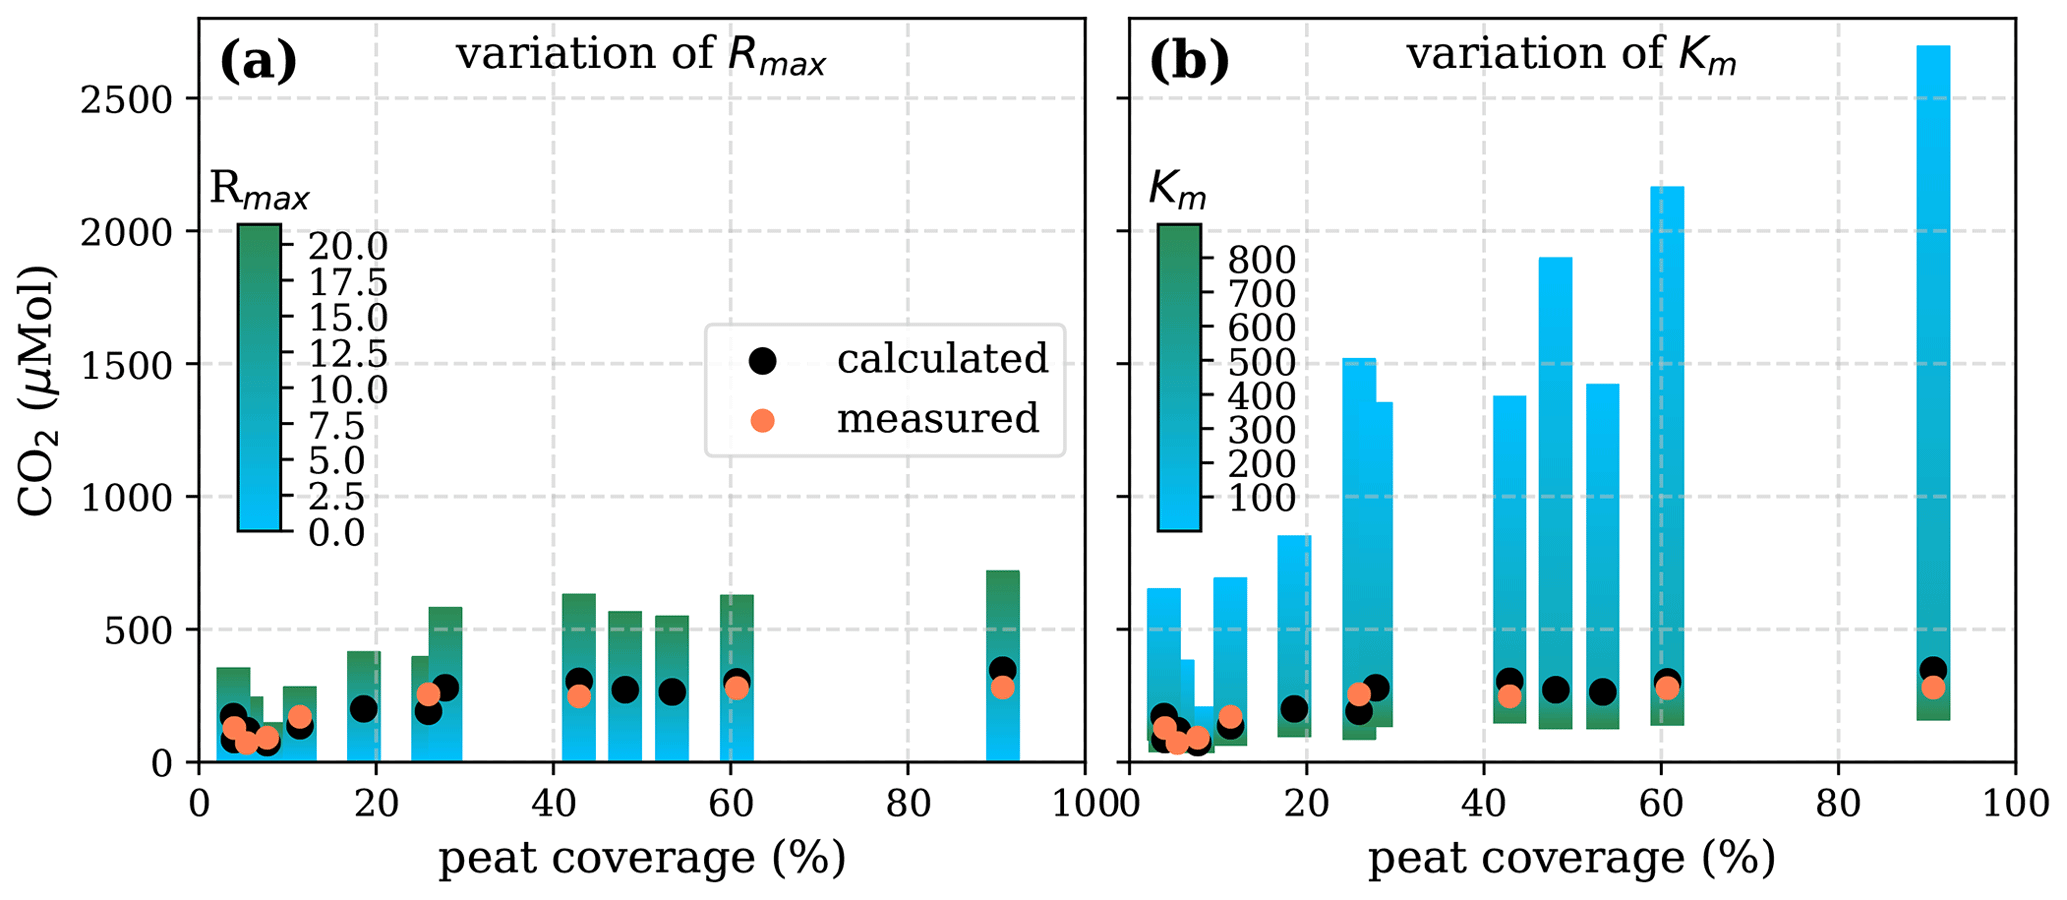
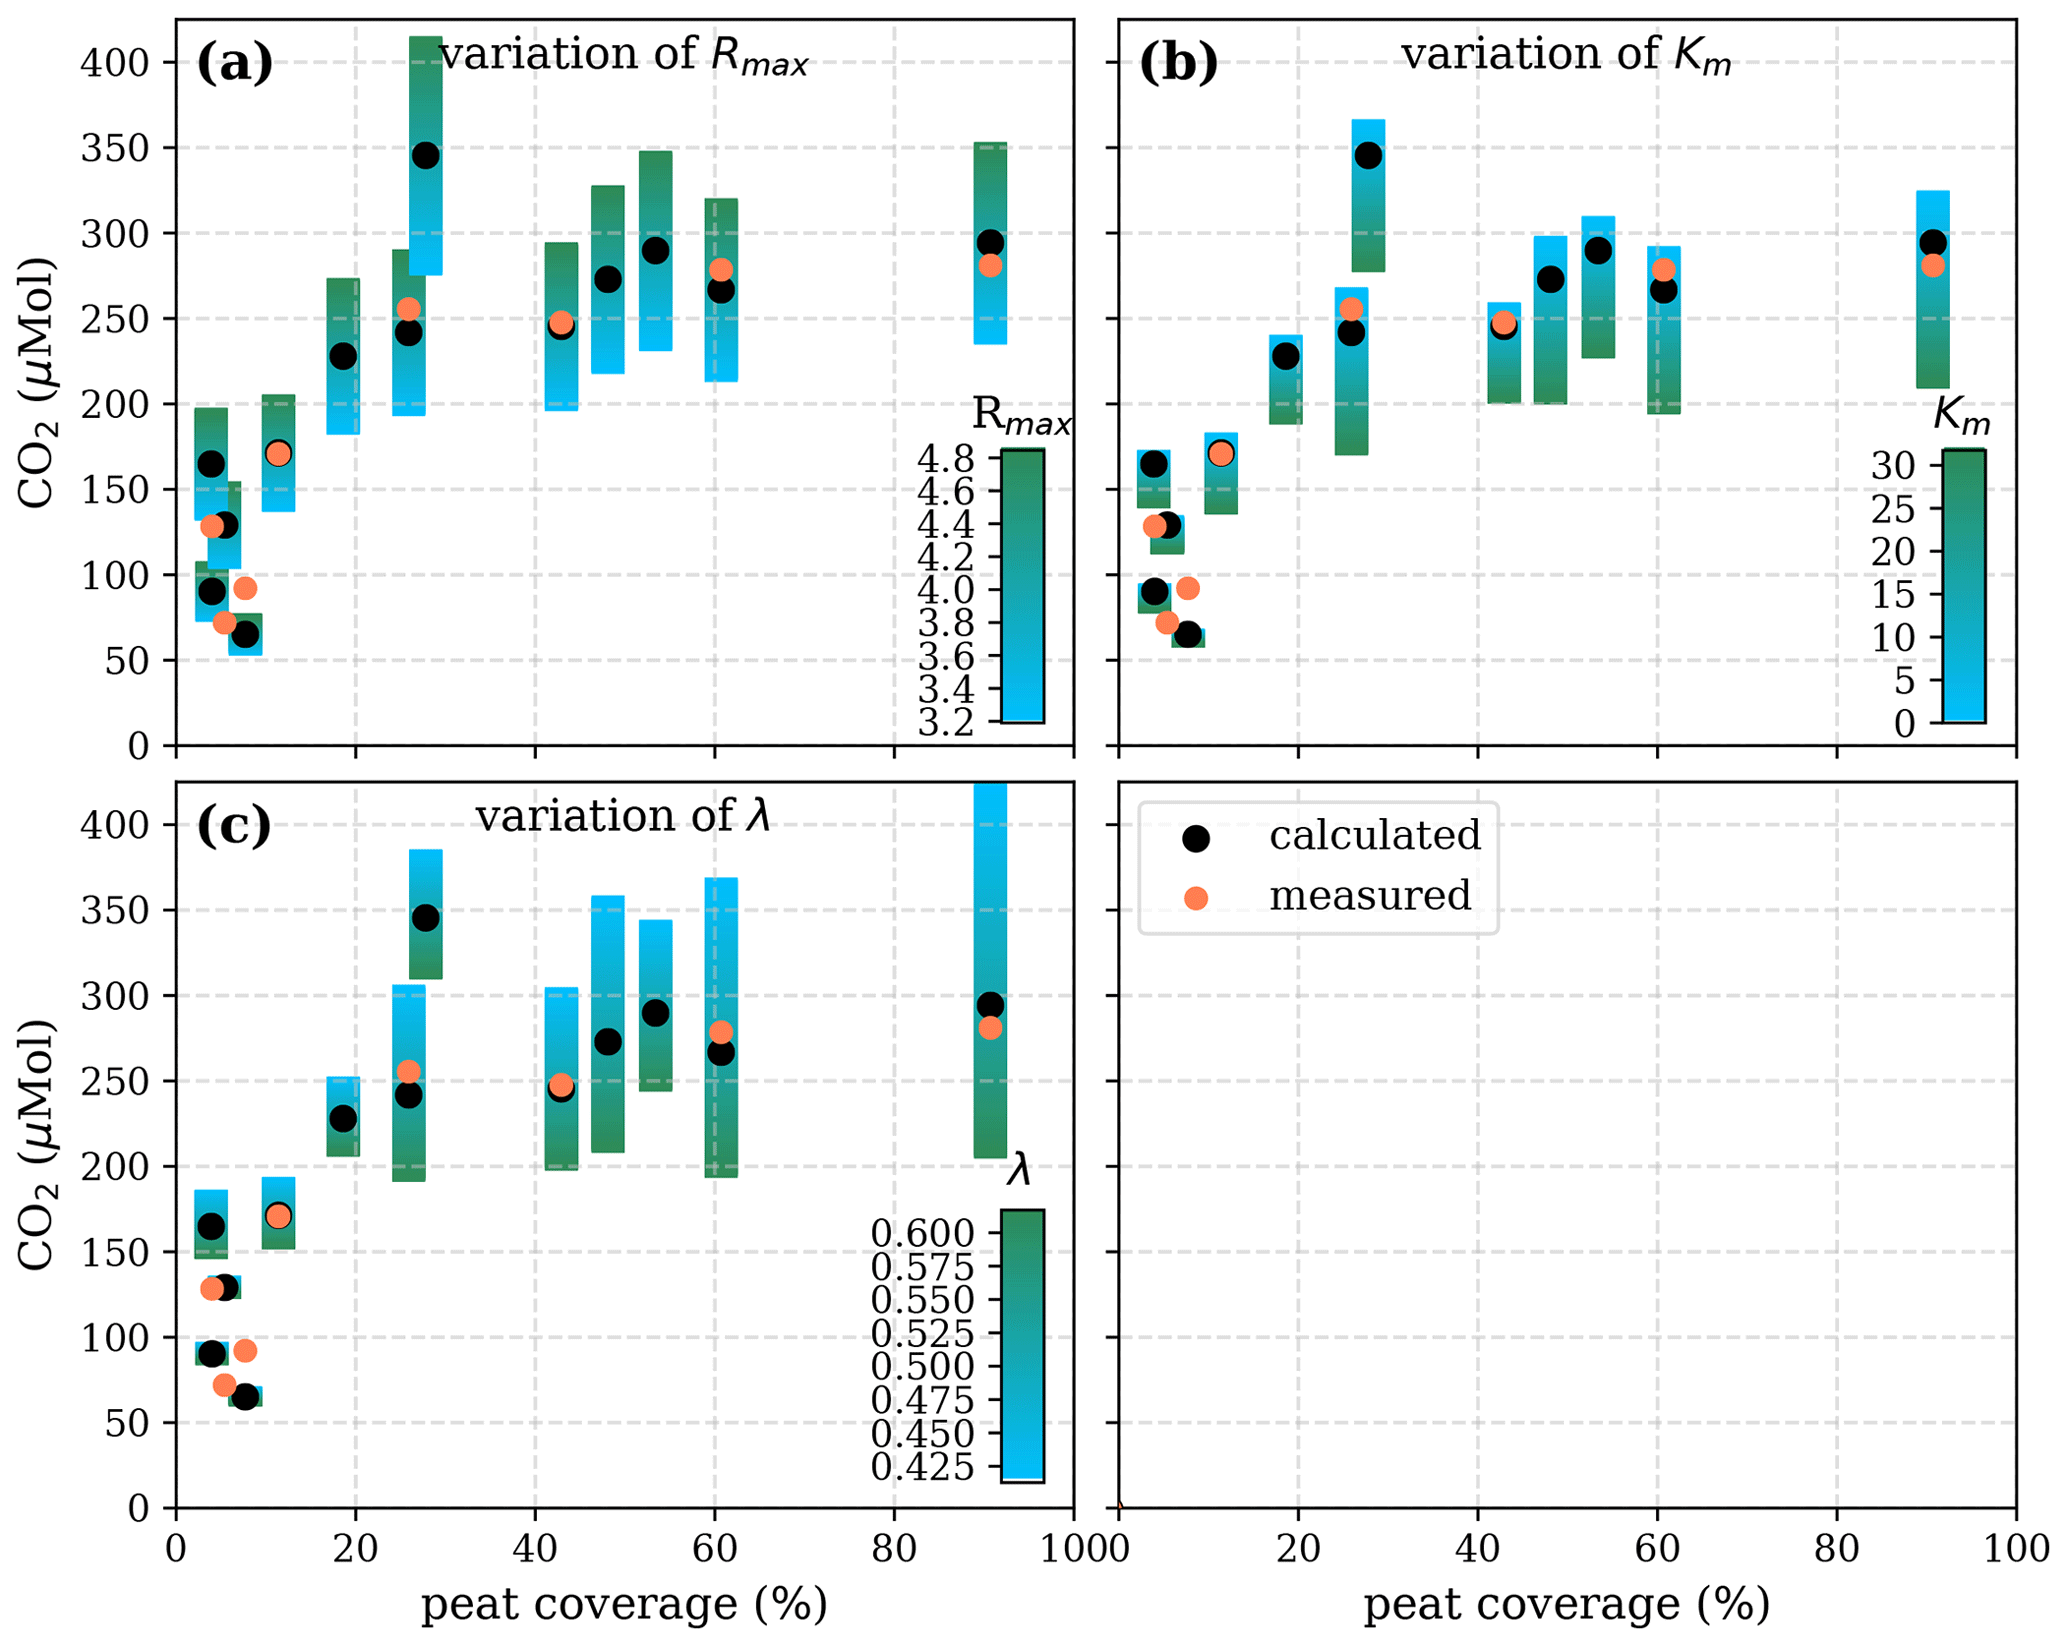
Figure A5Sensitivity of calculated CO2 to (a) the maximum decomposition rate (Rmax), (b) the Michaelis constant for O2 concentration (Km), and (c) the exponential pH limitation constant (λ) according to the equation in Table 2 for the exponential pH approach and the parameter ranges given in Table 5.
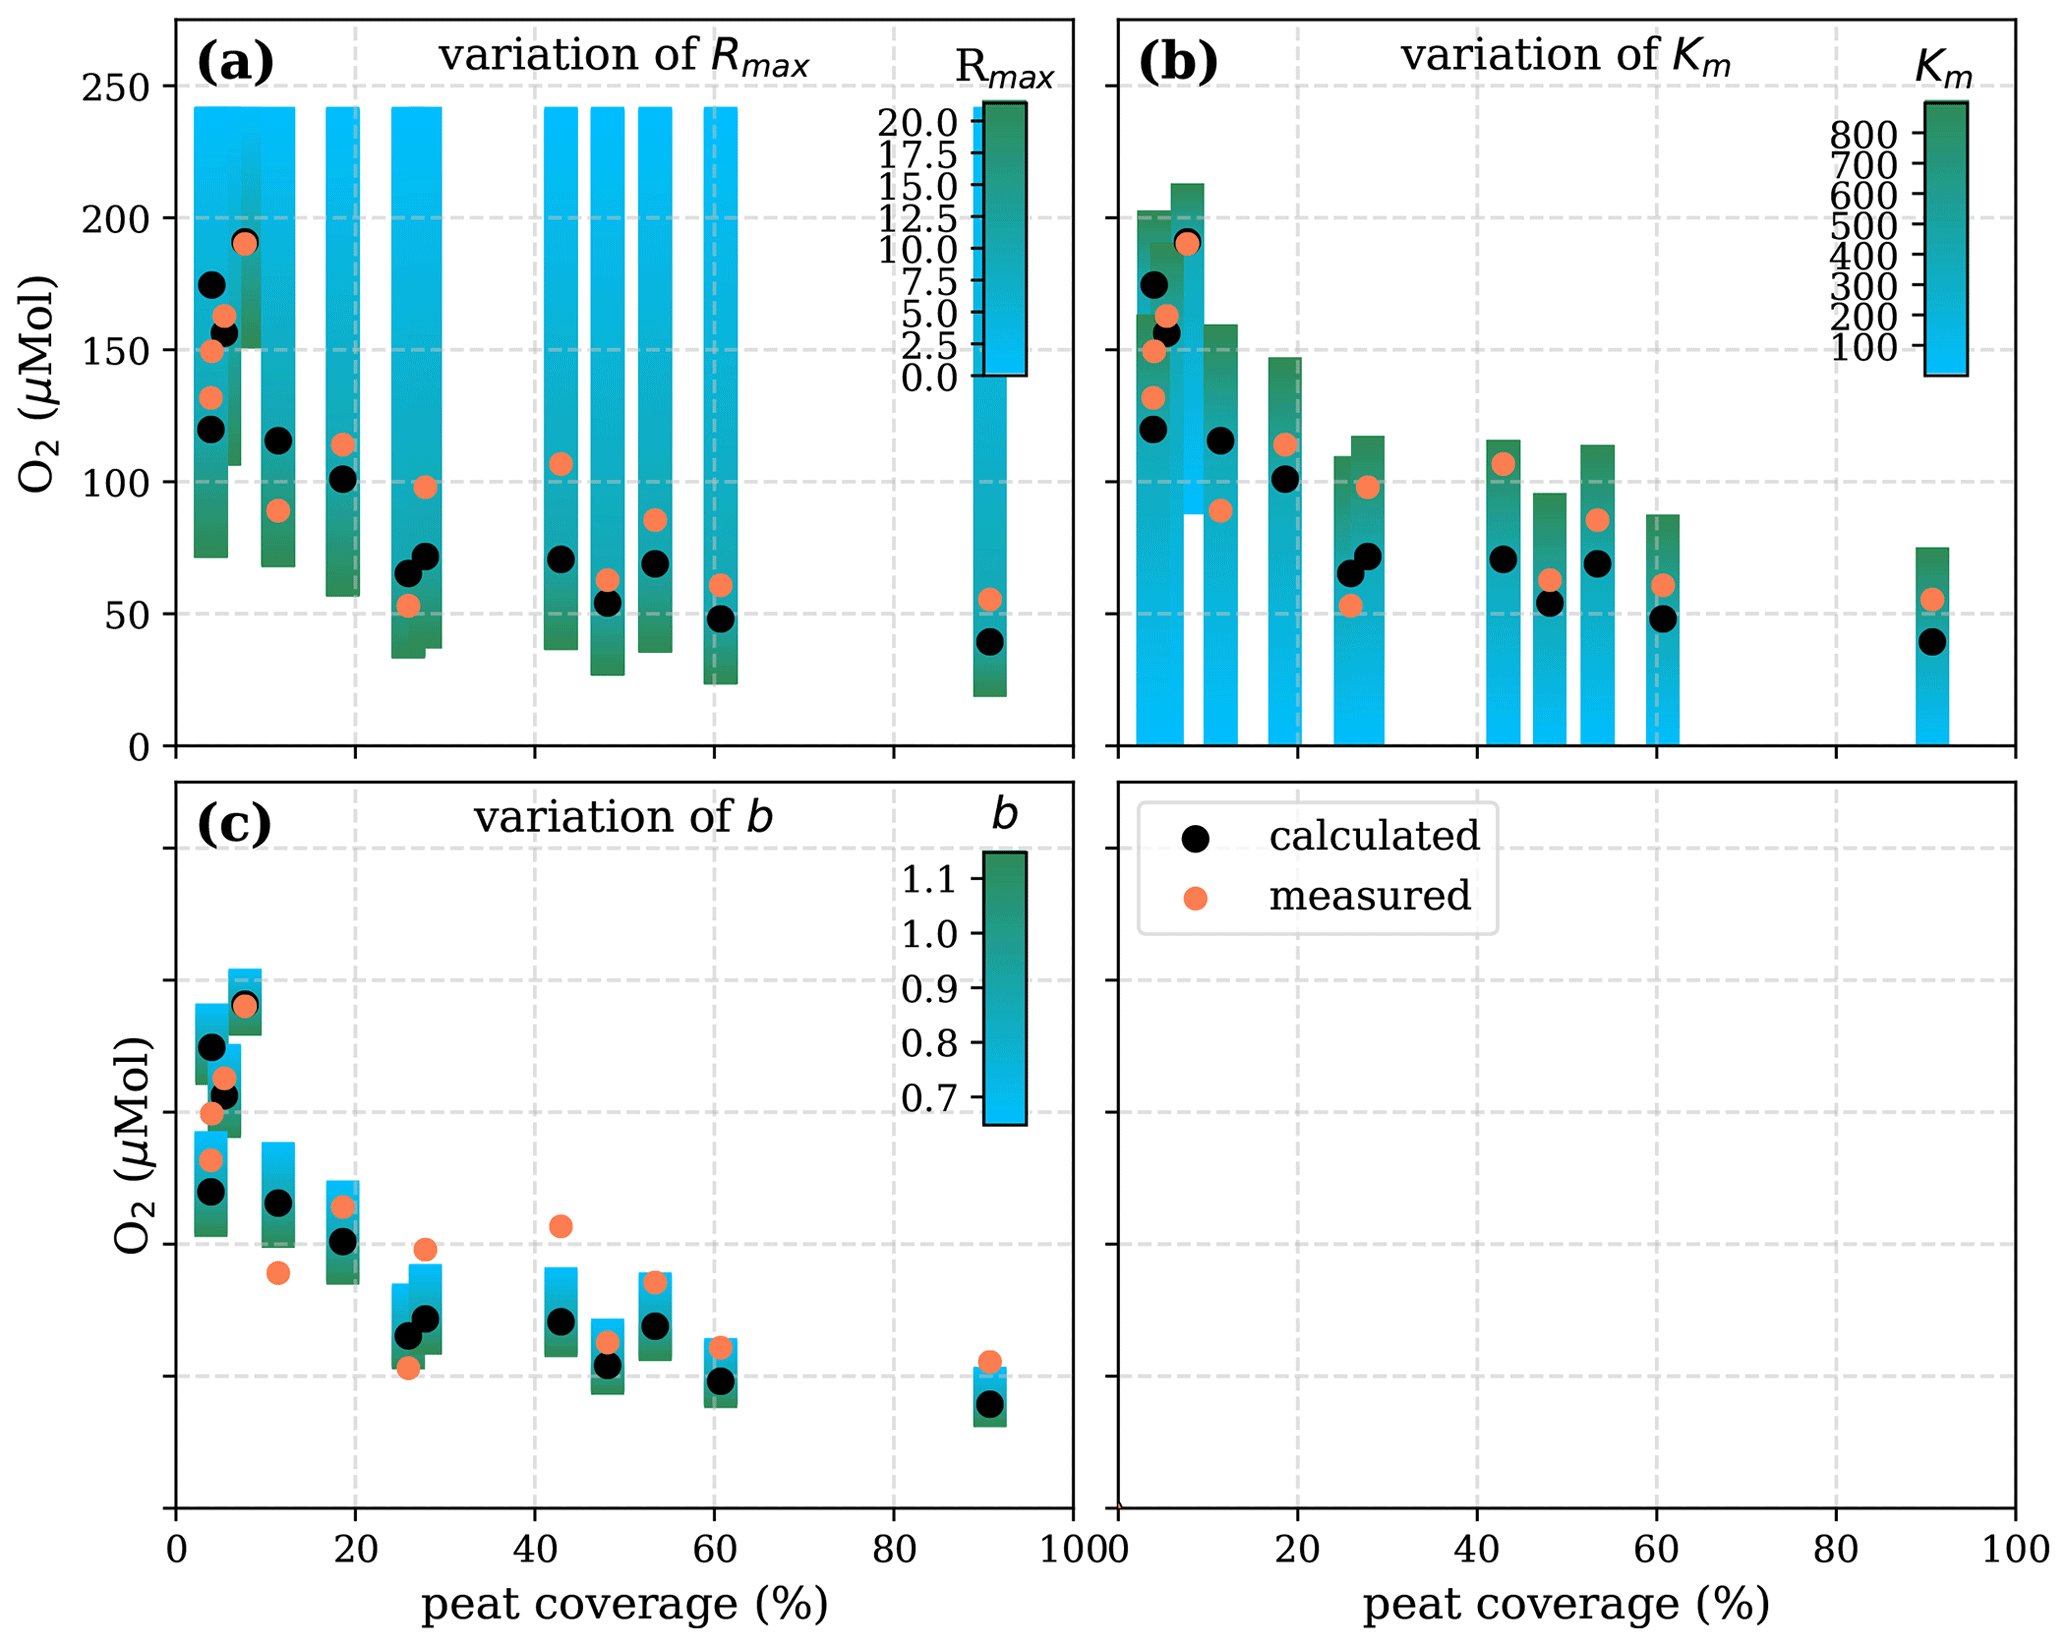
Figure A6Sensitivity of calculated O2 to (a) the maximum decomposition rate (Rmax), (b) the Michaelis constant for O2 concentration (Km), and (c) the fraction of O2 consumption by decomposition (b) according to the equation in Table 1 for the linear pH approach and the parameter ranges given in Table 5.
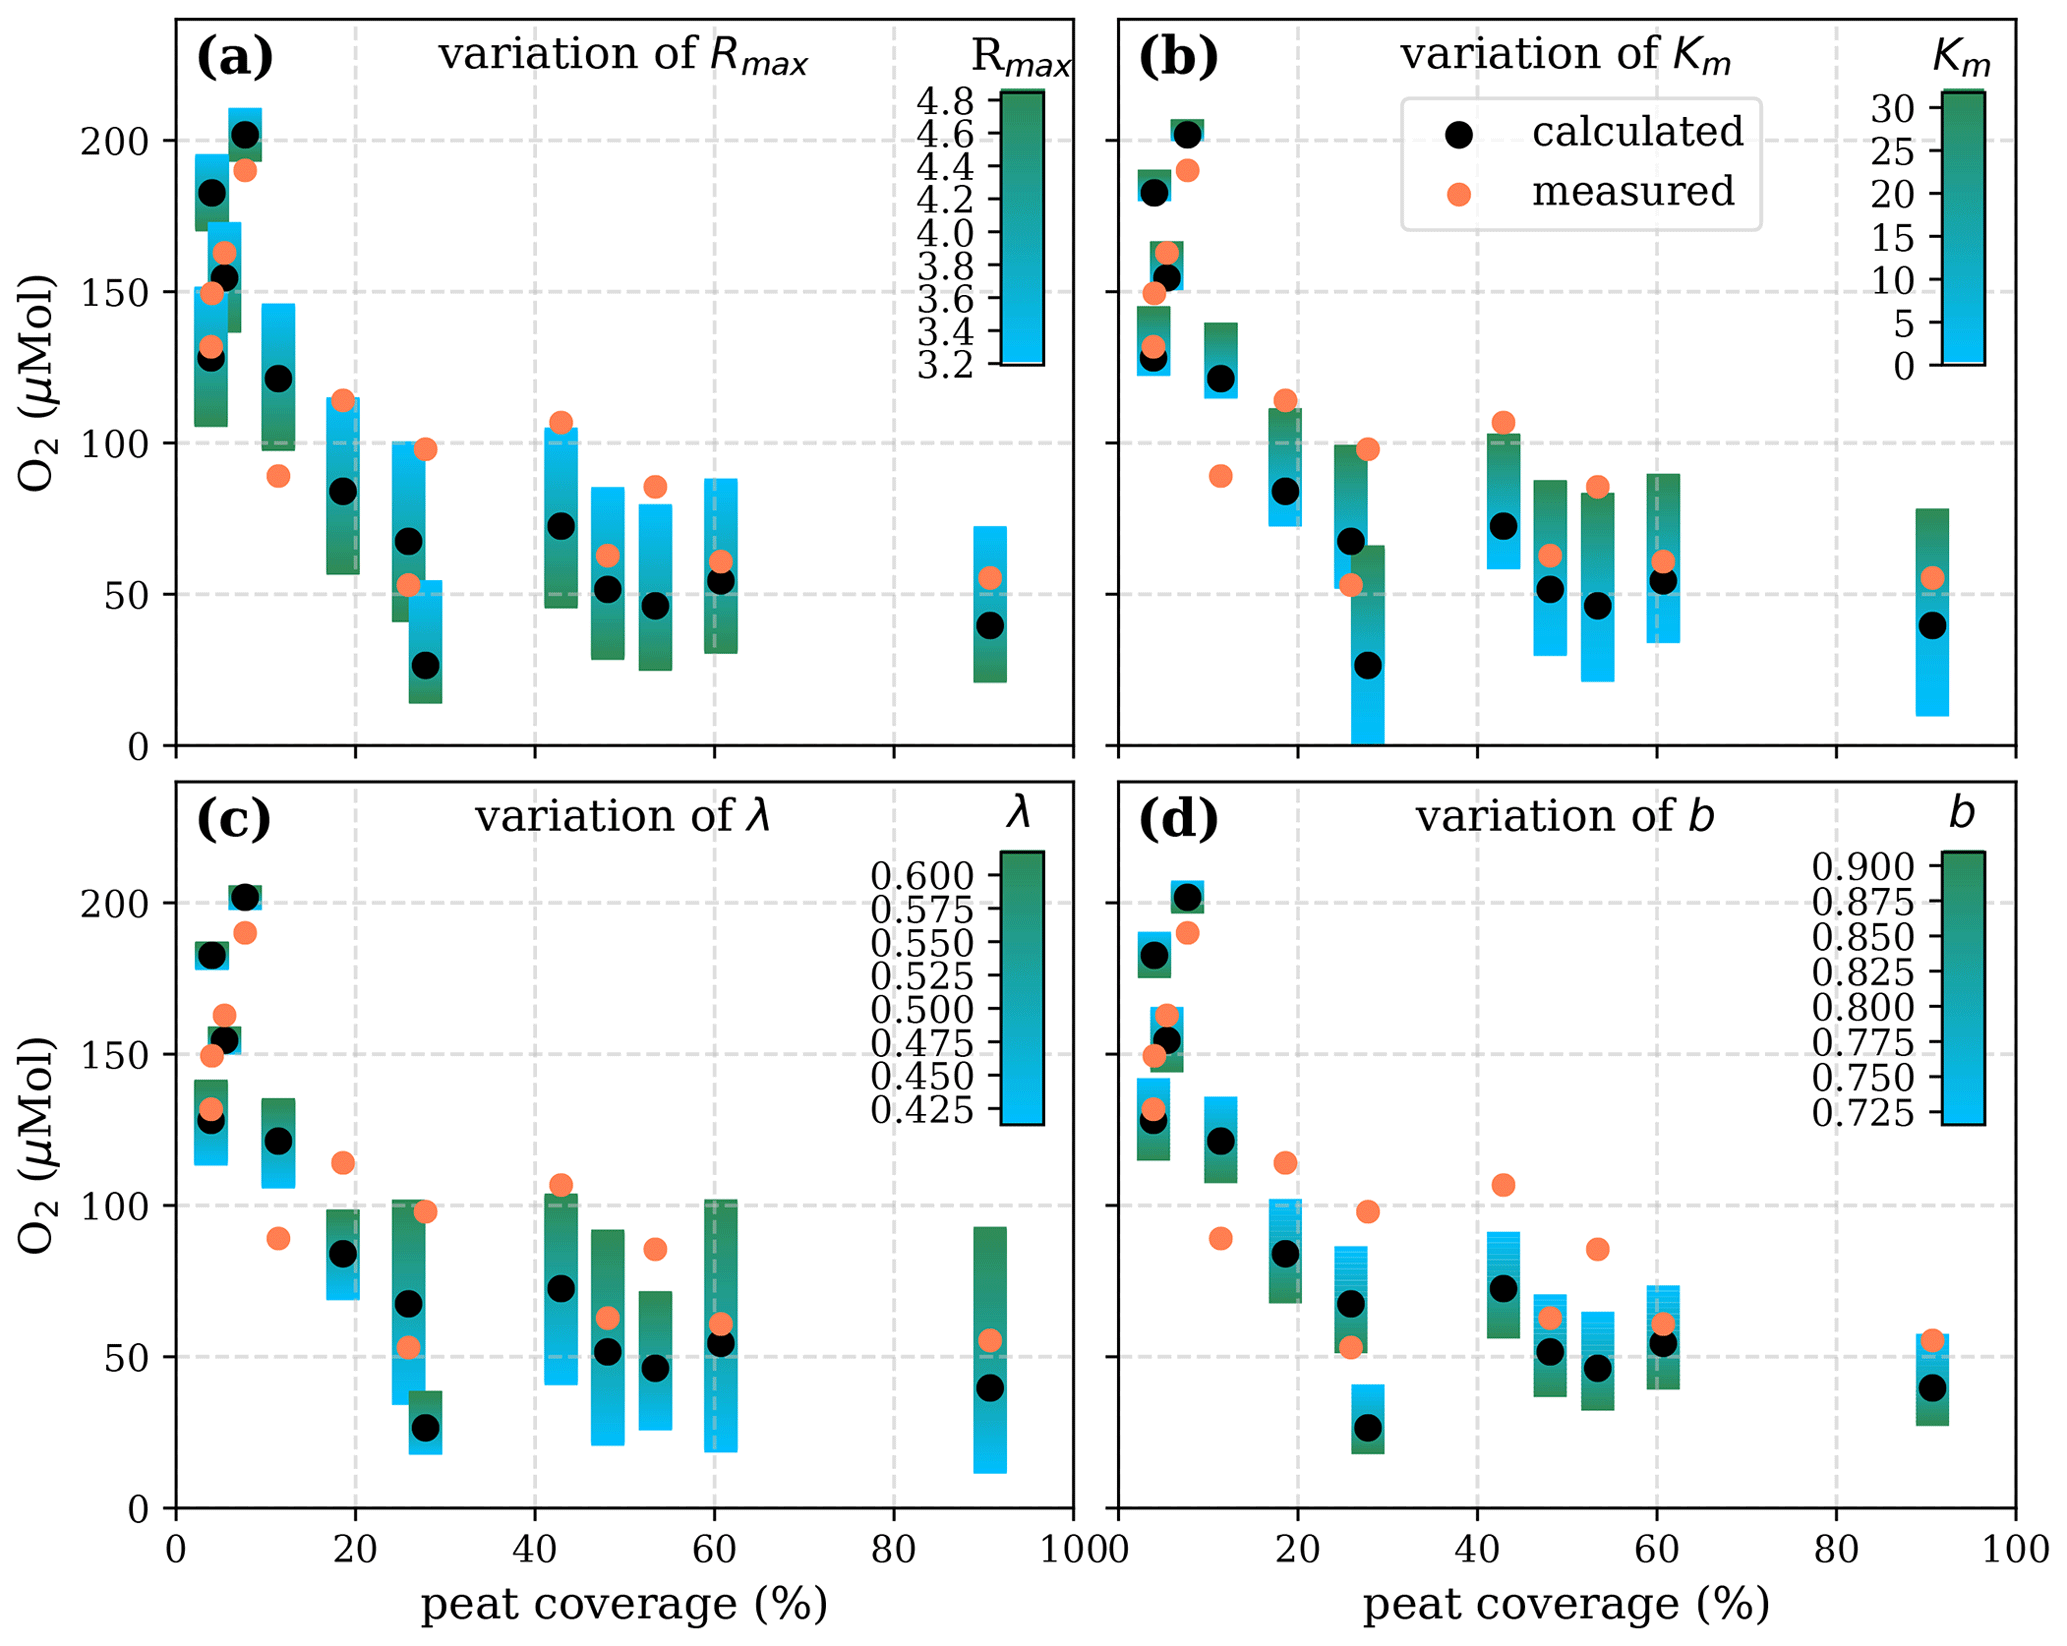
Figure A7Sensitivity of calculated O2 to (a) the maximum decomposition rate (Rmax), (b) the Michaelis constant for O2 concentration (Km), (c) the exponential pH limitation constant (λ), and (d) the fraction of O2 consumption by decomposition according to the equation in Table 2 for the exponential pH approach and the parameter ranges given in Table 5.
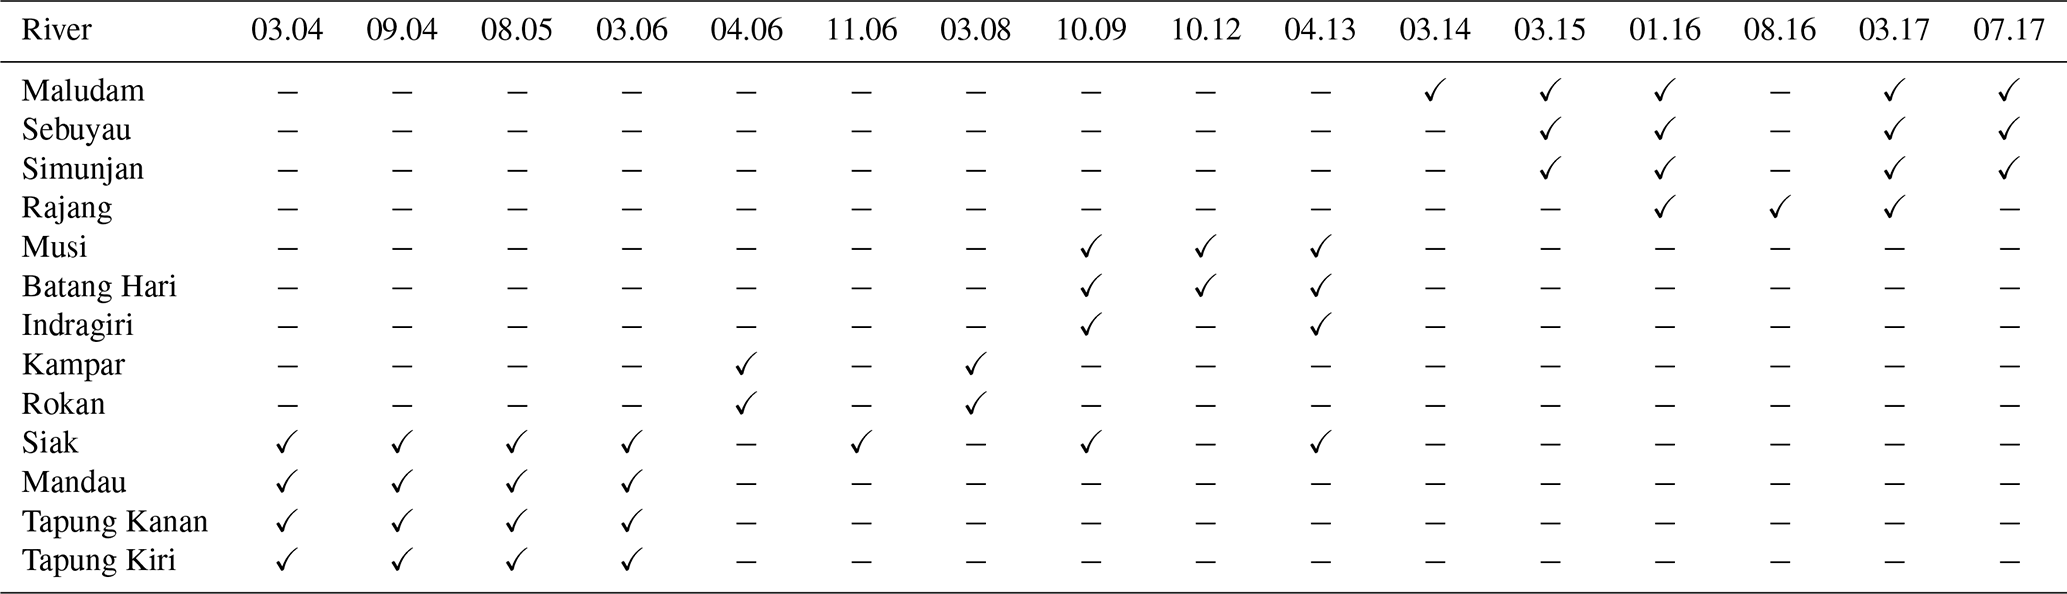
Table A2Temperature-dependent exchange coefficients k and Henry coefficients K of CO2 and O2 for the individual rivers.
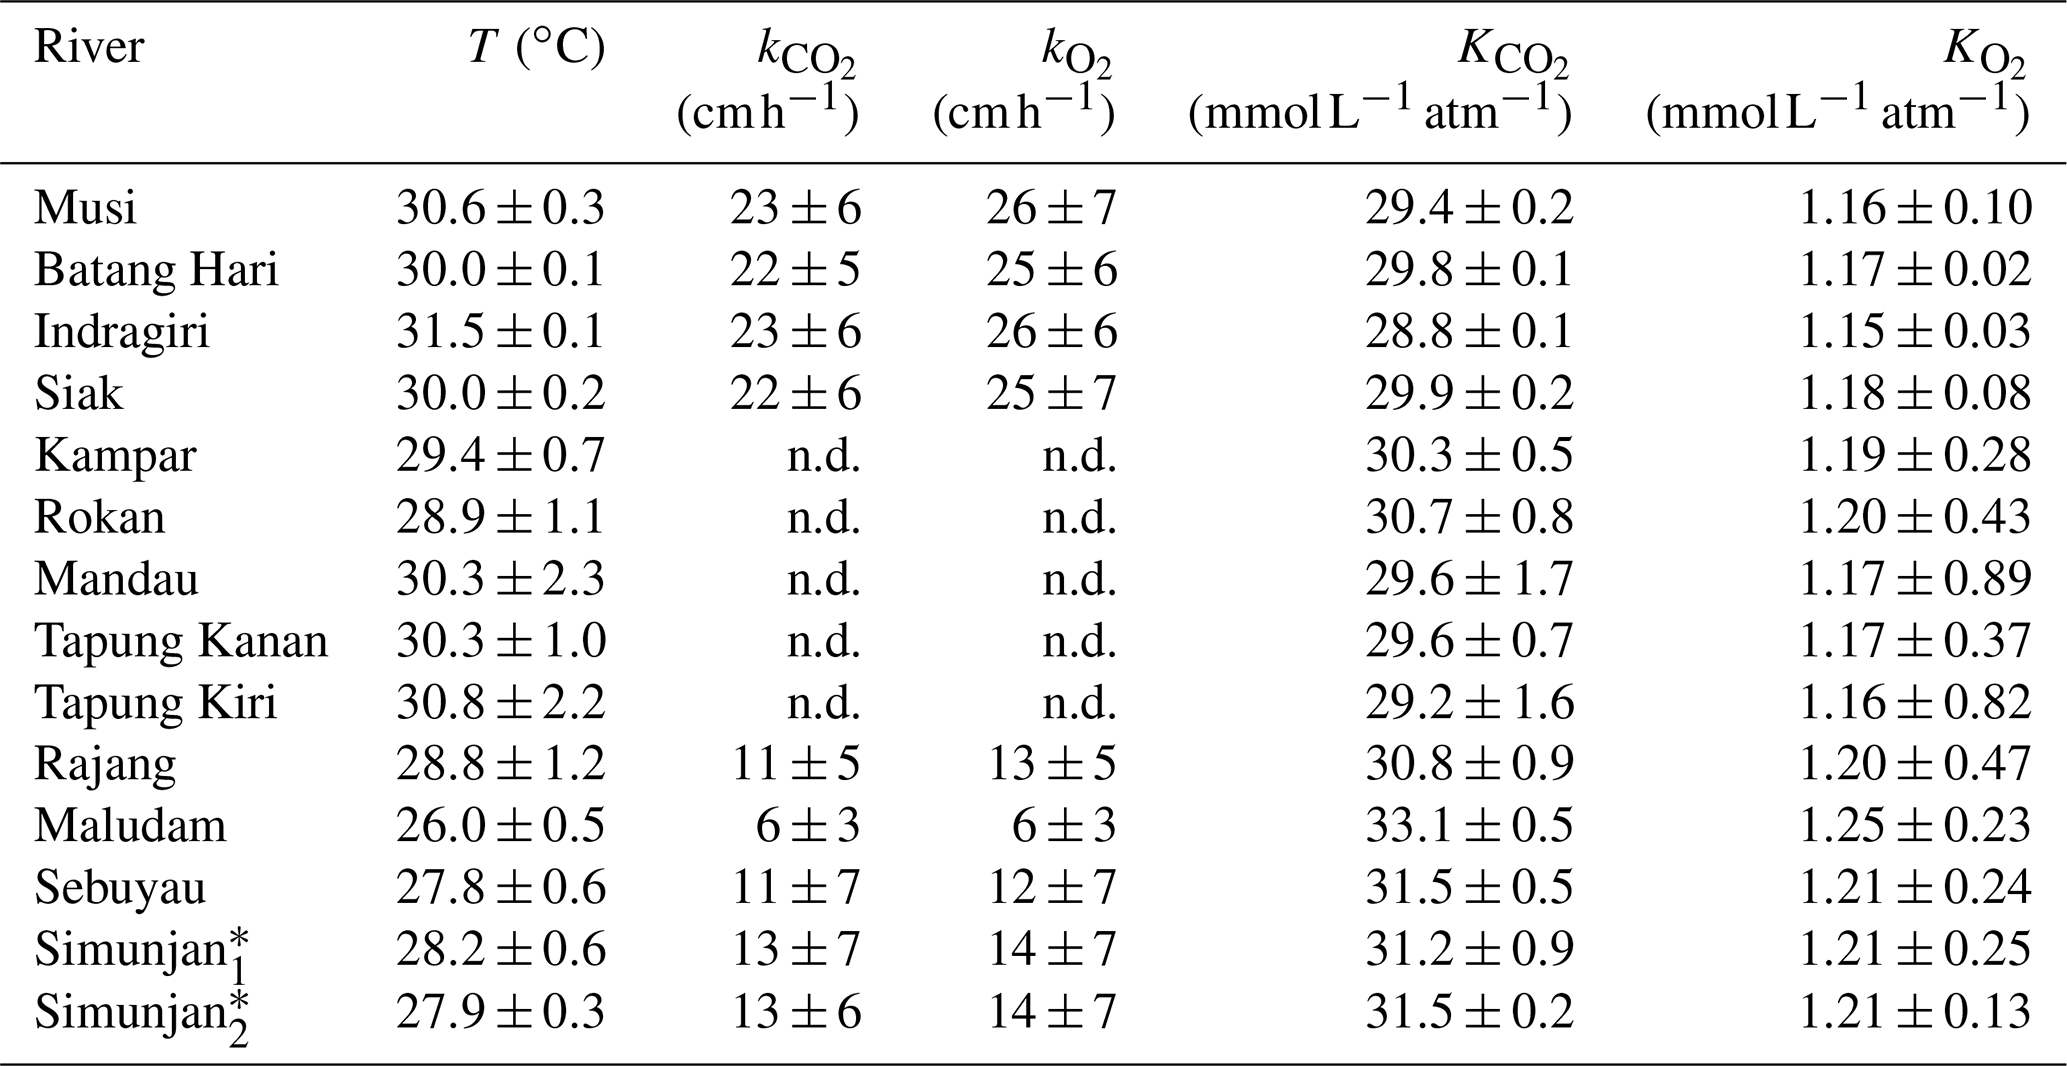
Exchange coefficients were derived from measured k600 (Table 3) and water temperature (T) according to with Schmidt numbers and derived according to the equations in Wanninkhof (1992). An exponent of (valid for rough surfaces, Zappa et al., 2007) was used for the rivers. Henry coefficients were derived based on water temperature from the equations stated in Weiss (1974) for CO2 and the equations stated in Weiss (1970) for O2.
Table A3pH and O2 limitations in the individual rivers based on linear pH approach.
B1 Impact of sampling location
The data for this study were collected from samples taken in river sections that flow through peat soil. This ensures that the impact of peat soils on the river parameters is captured.
Concentrations measured in the small Malaysian rivers (Maludam and Sebuyau and Simunjan), with the exception of the Simunjan campaigns in January 2016 and March 2017 (Table 4, Fig. B3), show little variation over the river path and between campaigns (Figs. B1, B2 B3). However, the larger rivers drain mineral soils for the majority of their path and only reach peat regions close to the coast. Those rivers exhibit stronger differences in carbon concentrations along the length of the river. Rixen et al. (2010) found that DOC concentrations in the Siak River are higher by a factor of up to 4 in coastal peat regions than in the upstream river. CO2 concentrations in the large Sumatran rivers were not measured outside of the coastal peat regions. Due to the lower pH in river parts that cut through peat and the related pH limitation of DOC decomposition, the difference in CO2 concentrations along the river is likely lower than the difference in DOC concentrations. This is also indicated by CO2 measurements in the Rajang River that reveal CO2 concentrations in the peat-draining river sections to be only 15 %–20 % higher than CO2 concentrations upstream of the peat regions (Müller-Dum et al., 2019).
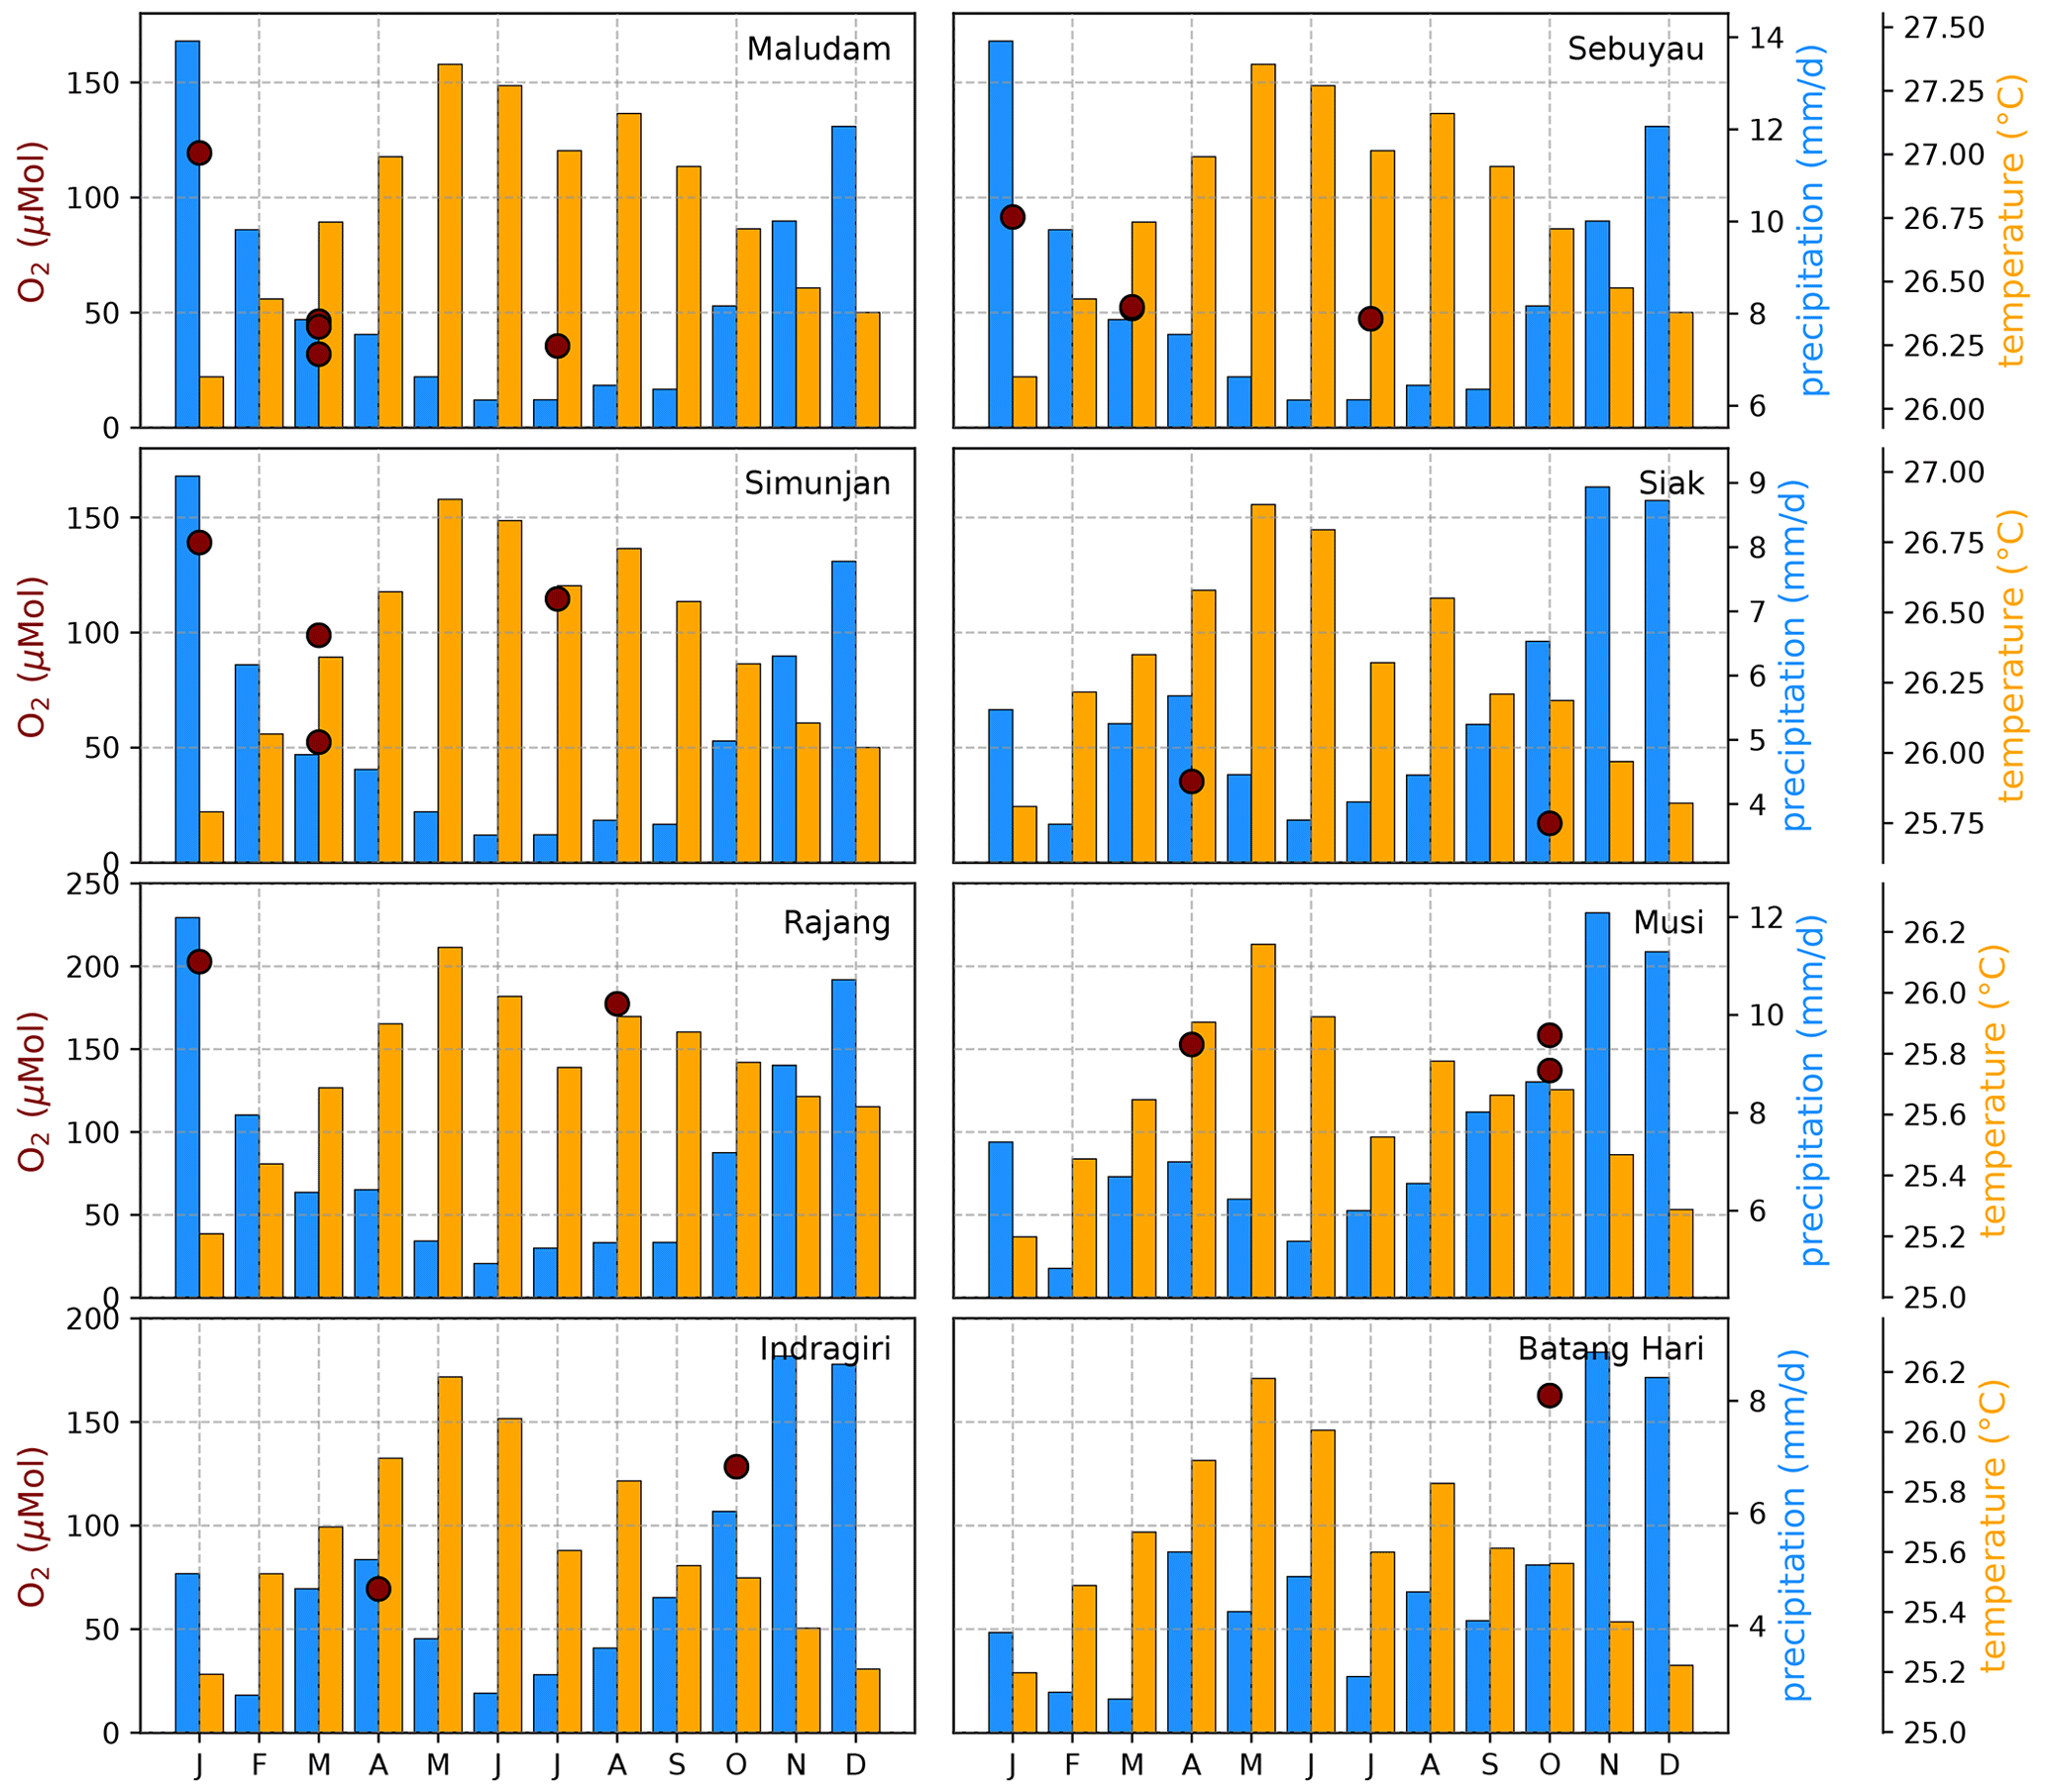
B2 Impact of seasonality
The Southeast Asian study area is impacted by the Malaysian–Australian monsoon that causes the presence of moisture-loaded air with high precipitation rates from October to April while dry air dominates from May to September. To catch the impact of these rain and dry seasons on river carbon dynamics, campaigns in different months of the year were performed (Table A1). However, the seasonal data coverage is not dense enough to clearly identify or disprove a seasonal pattern in the measured data (Figs. B4, B5, and B6).
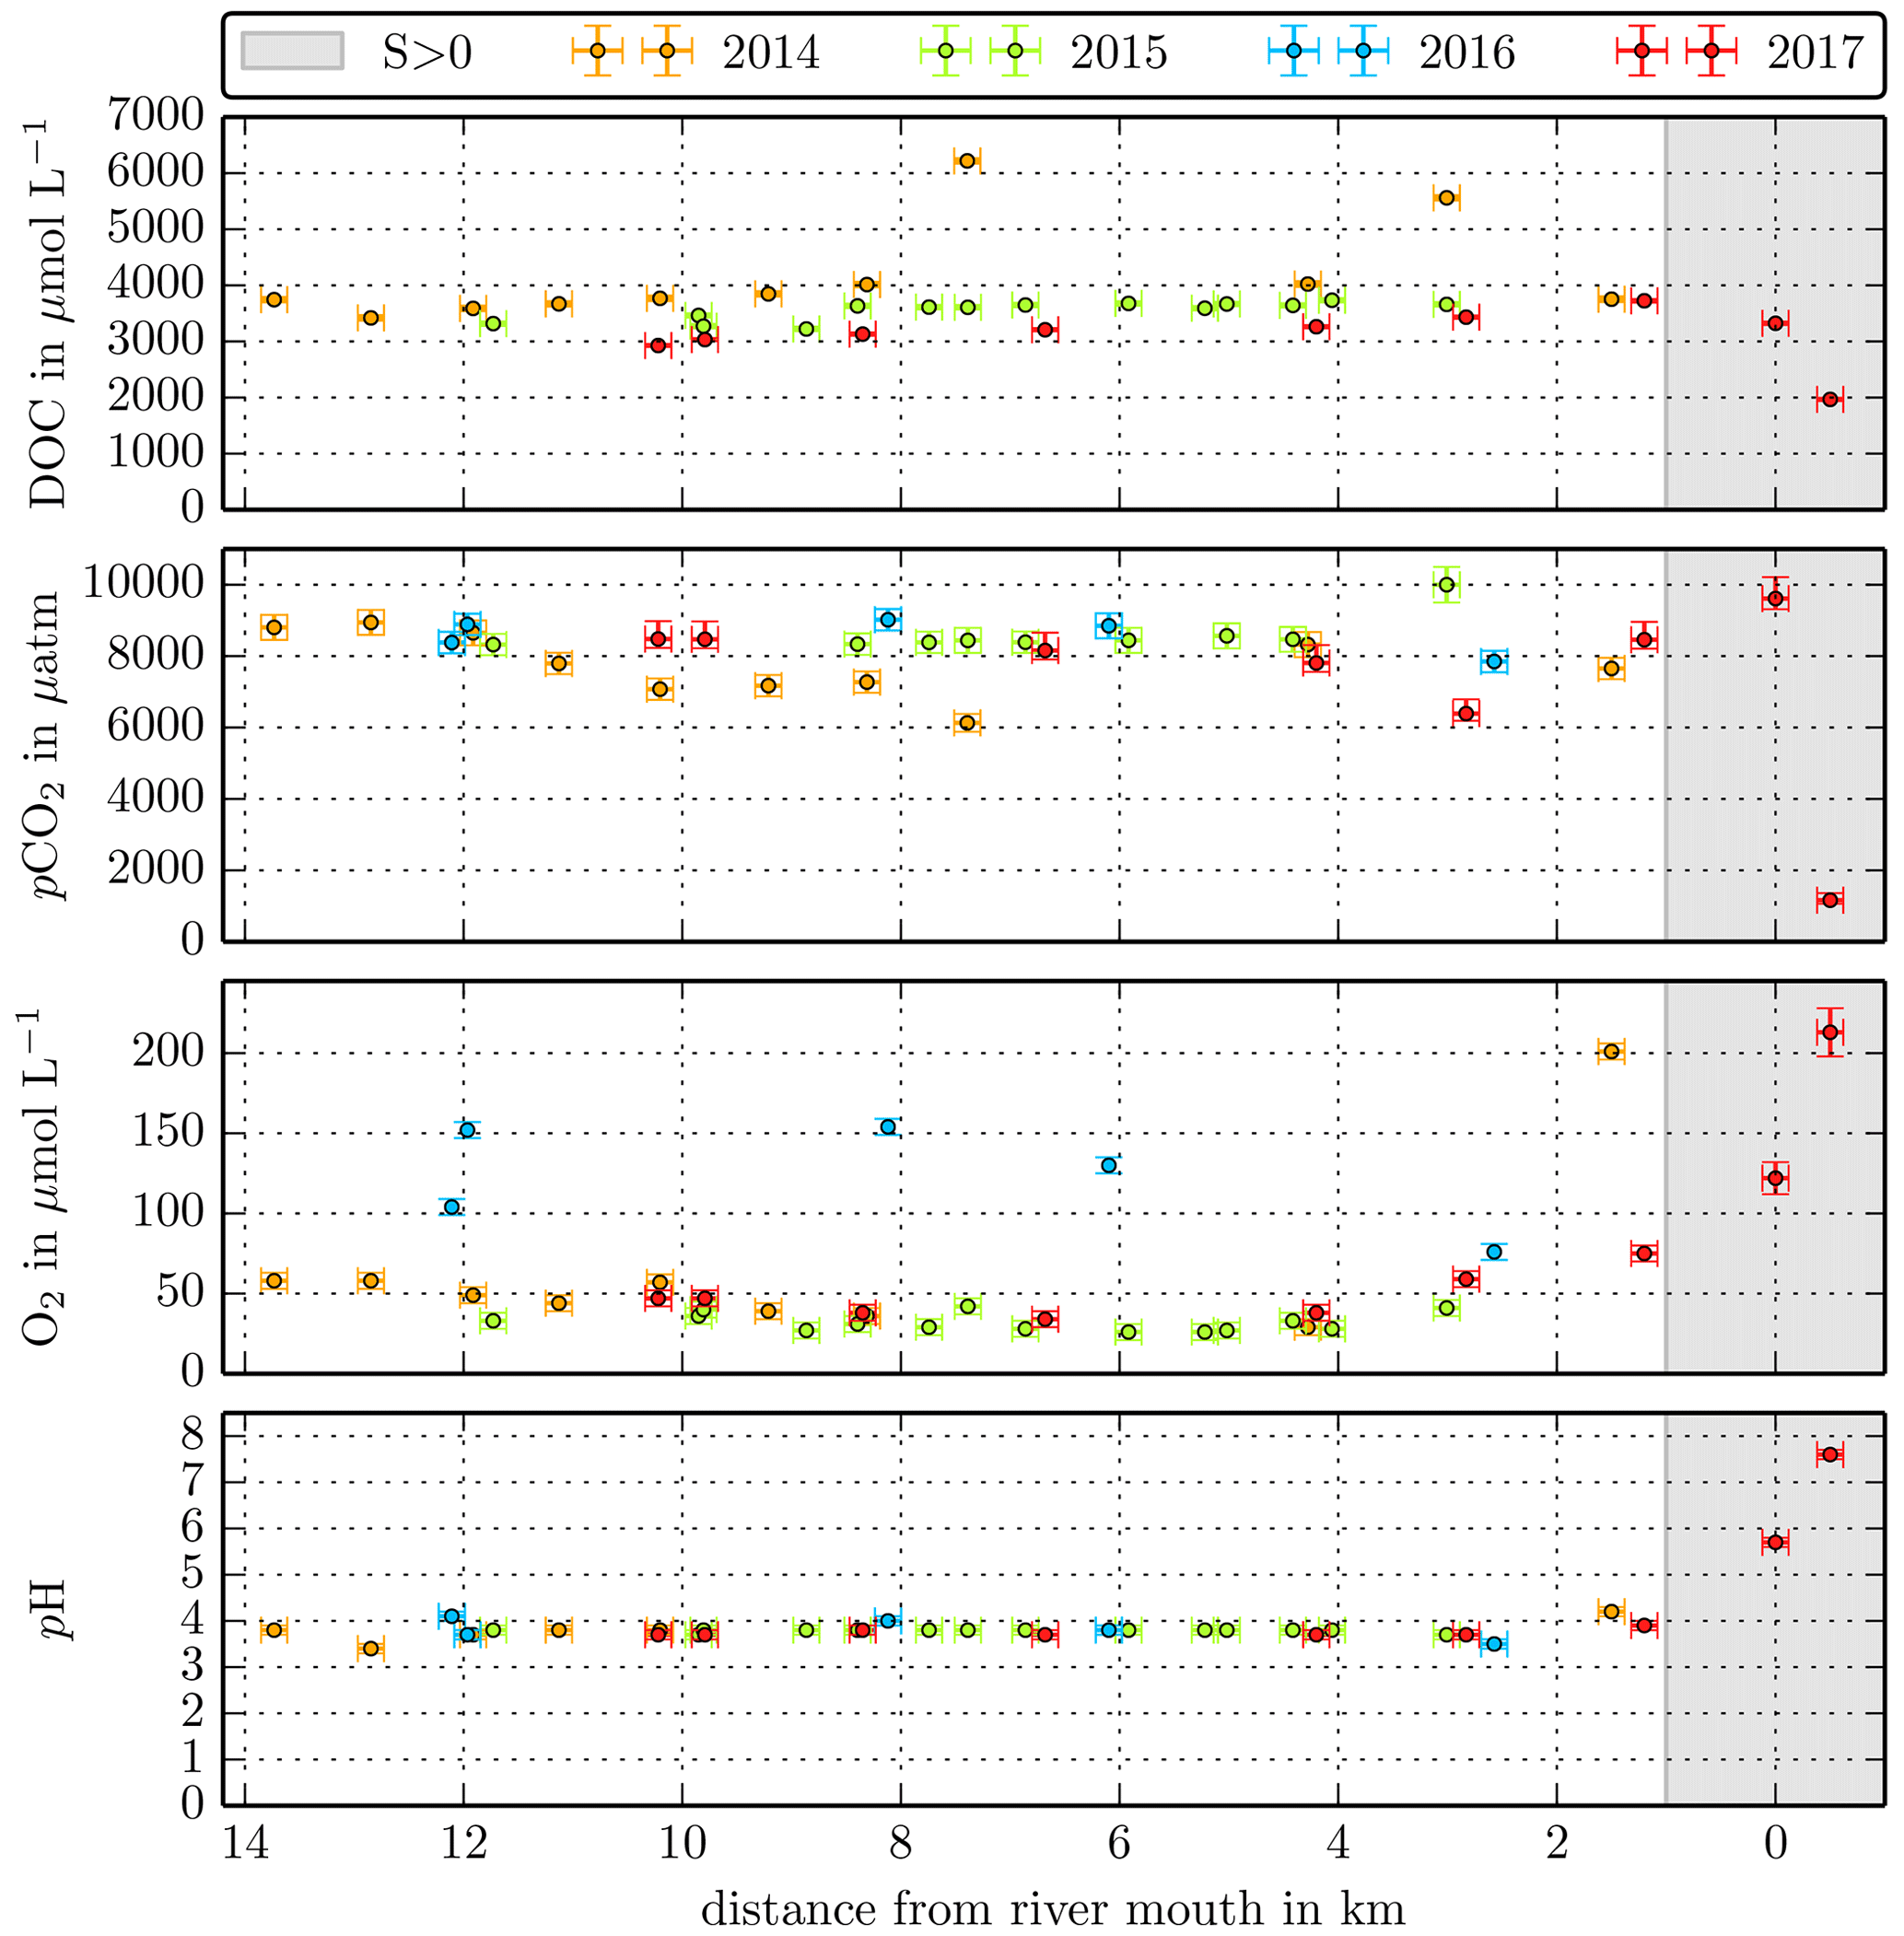
Figure B1Individual DOC, CO2, O2, and pH measurements in the Maludam River versus the distance from the river mouth. Different colours stand for the individual river campaigns, and the grey shaded area indicates regions of S>1 that were excluded from the data in this study.
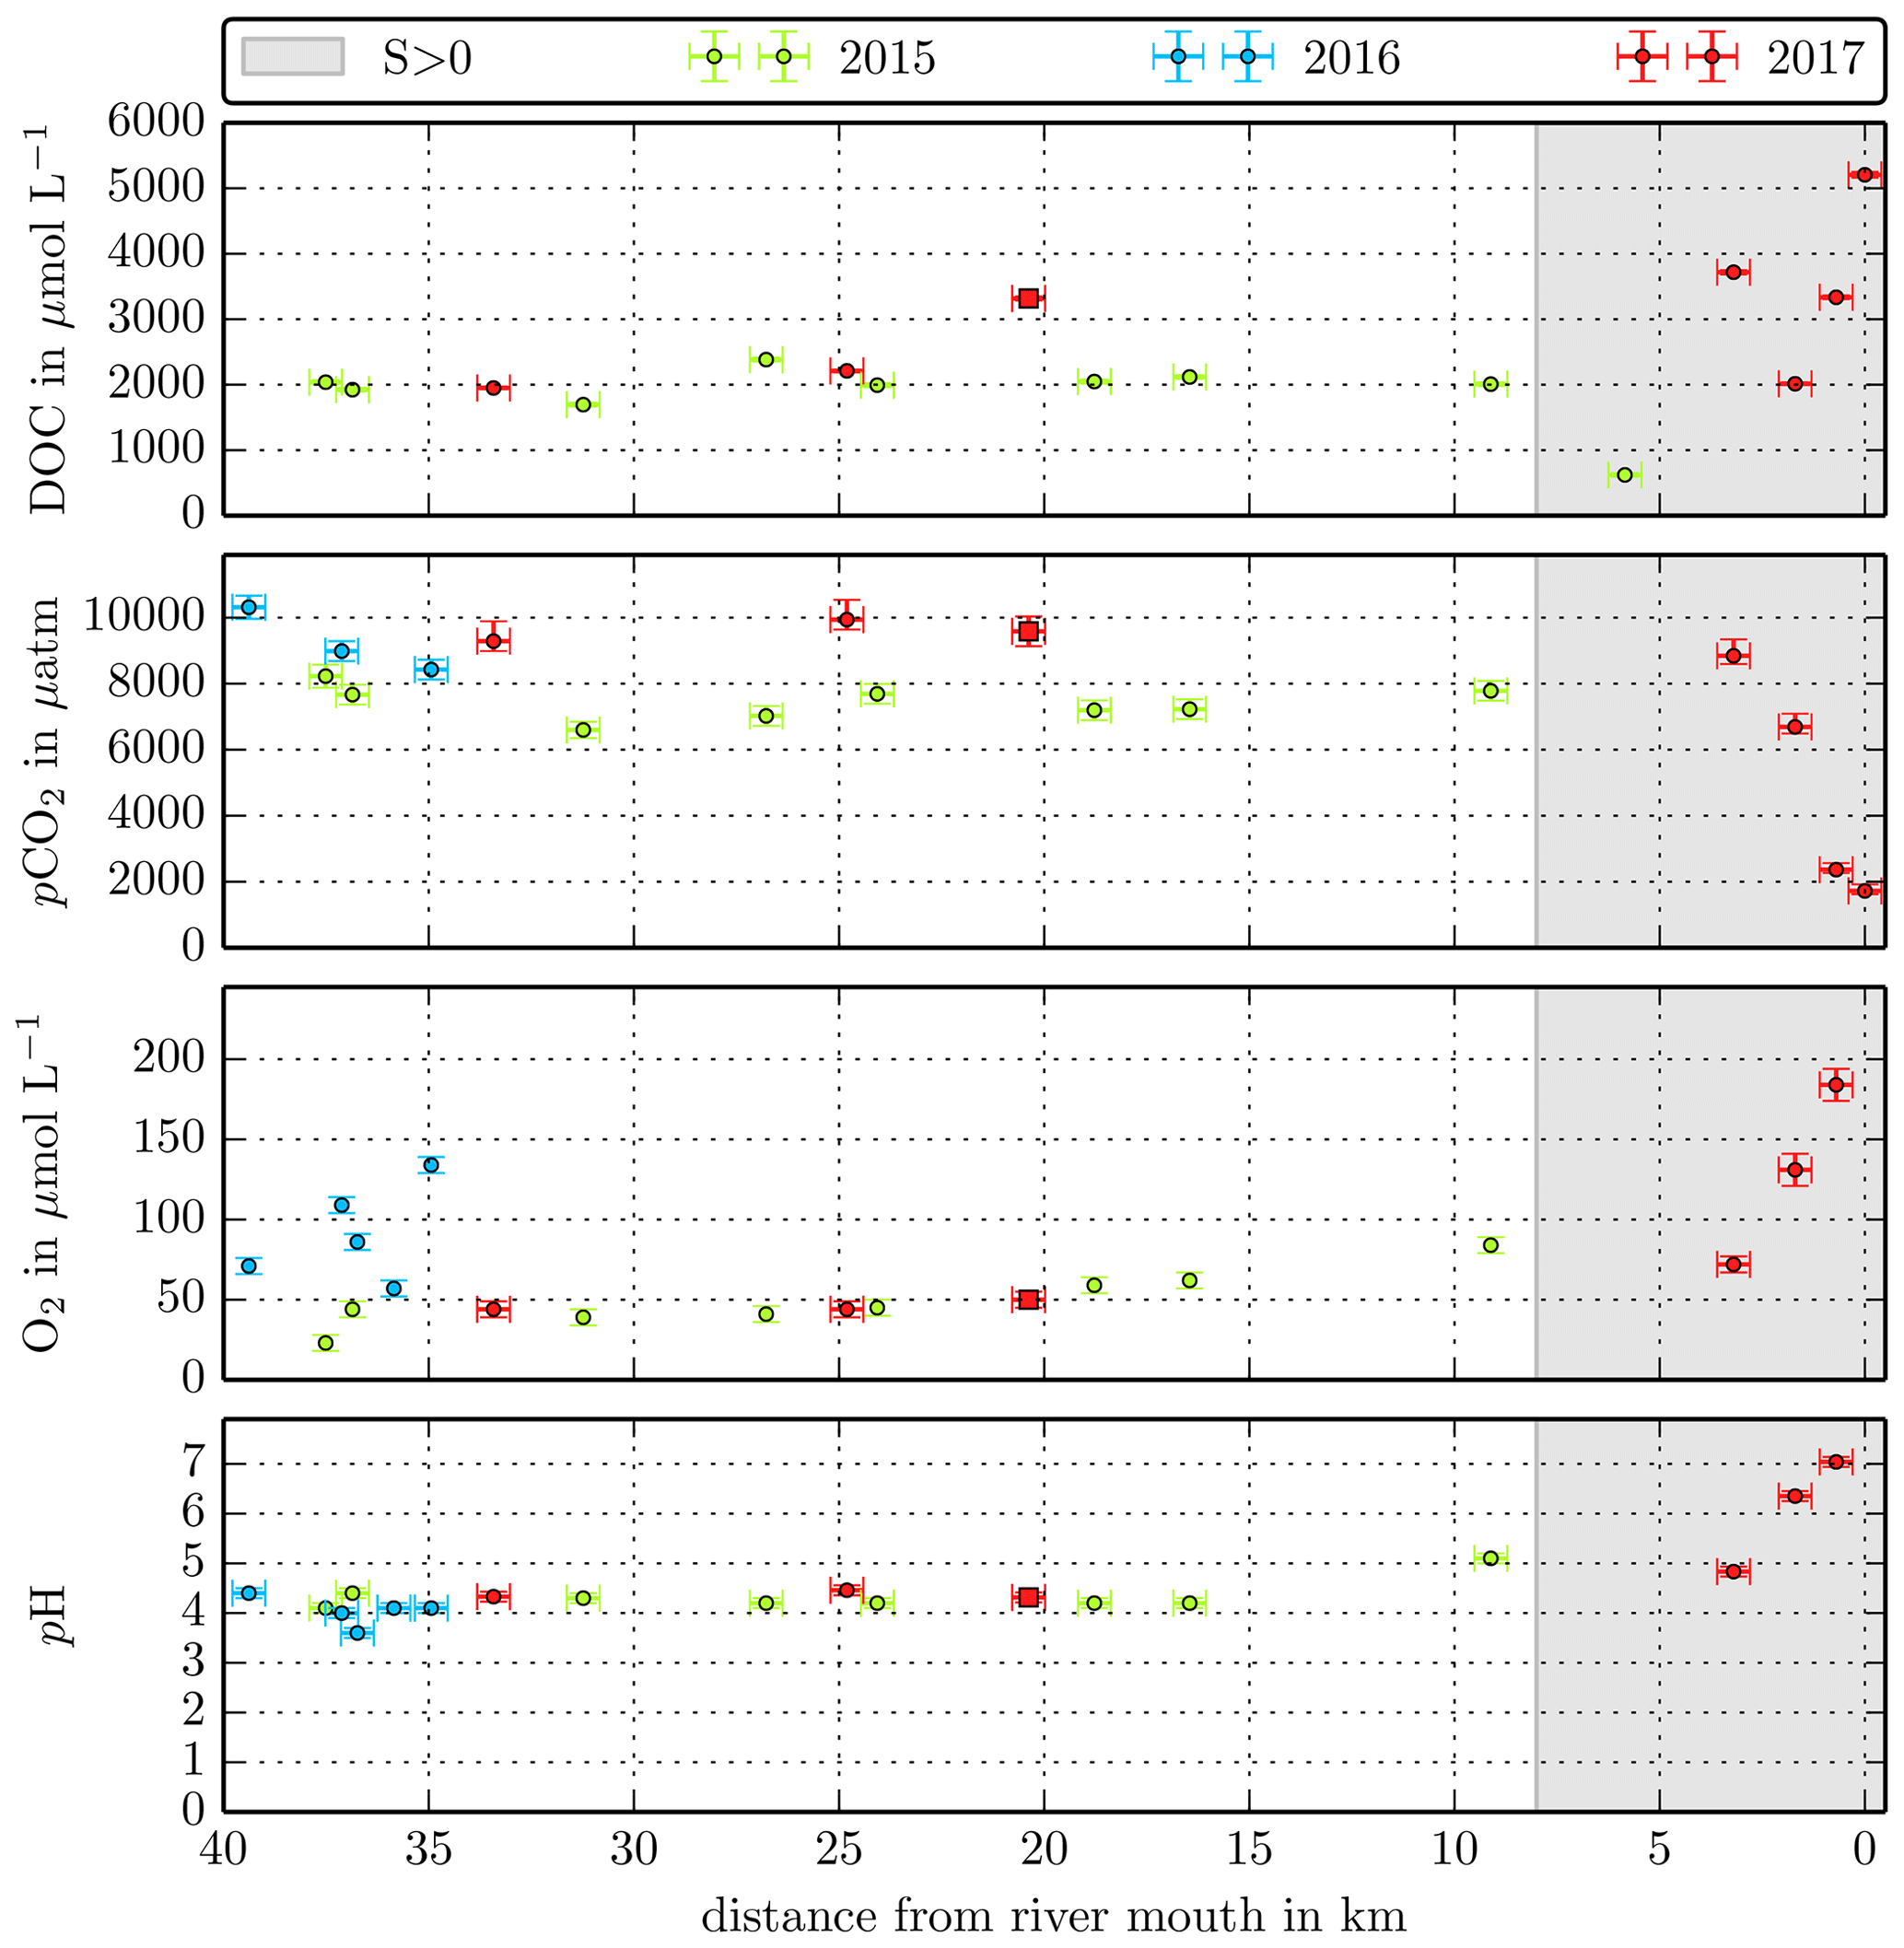
Figure B2Individual DOC, CO2, O2, and pH measurements in the Sebuyau River versus the distance from the river mouth. Different colours stand for the individual river campaigns, and the grey shaded area indicates regions of S>1 that were excluded from the data in this study.
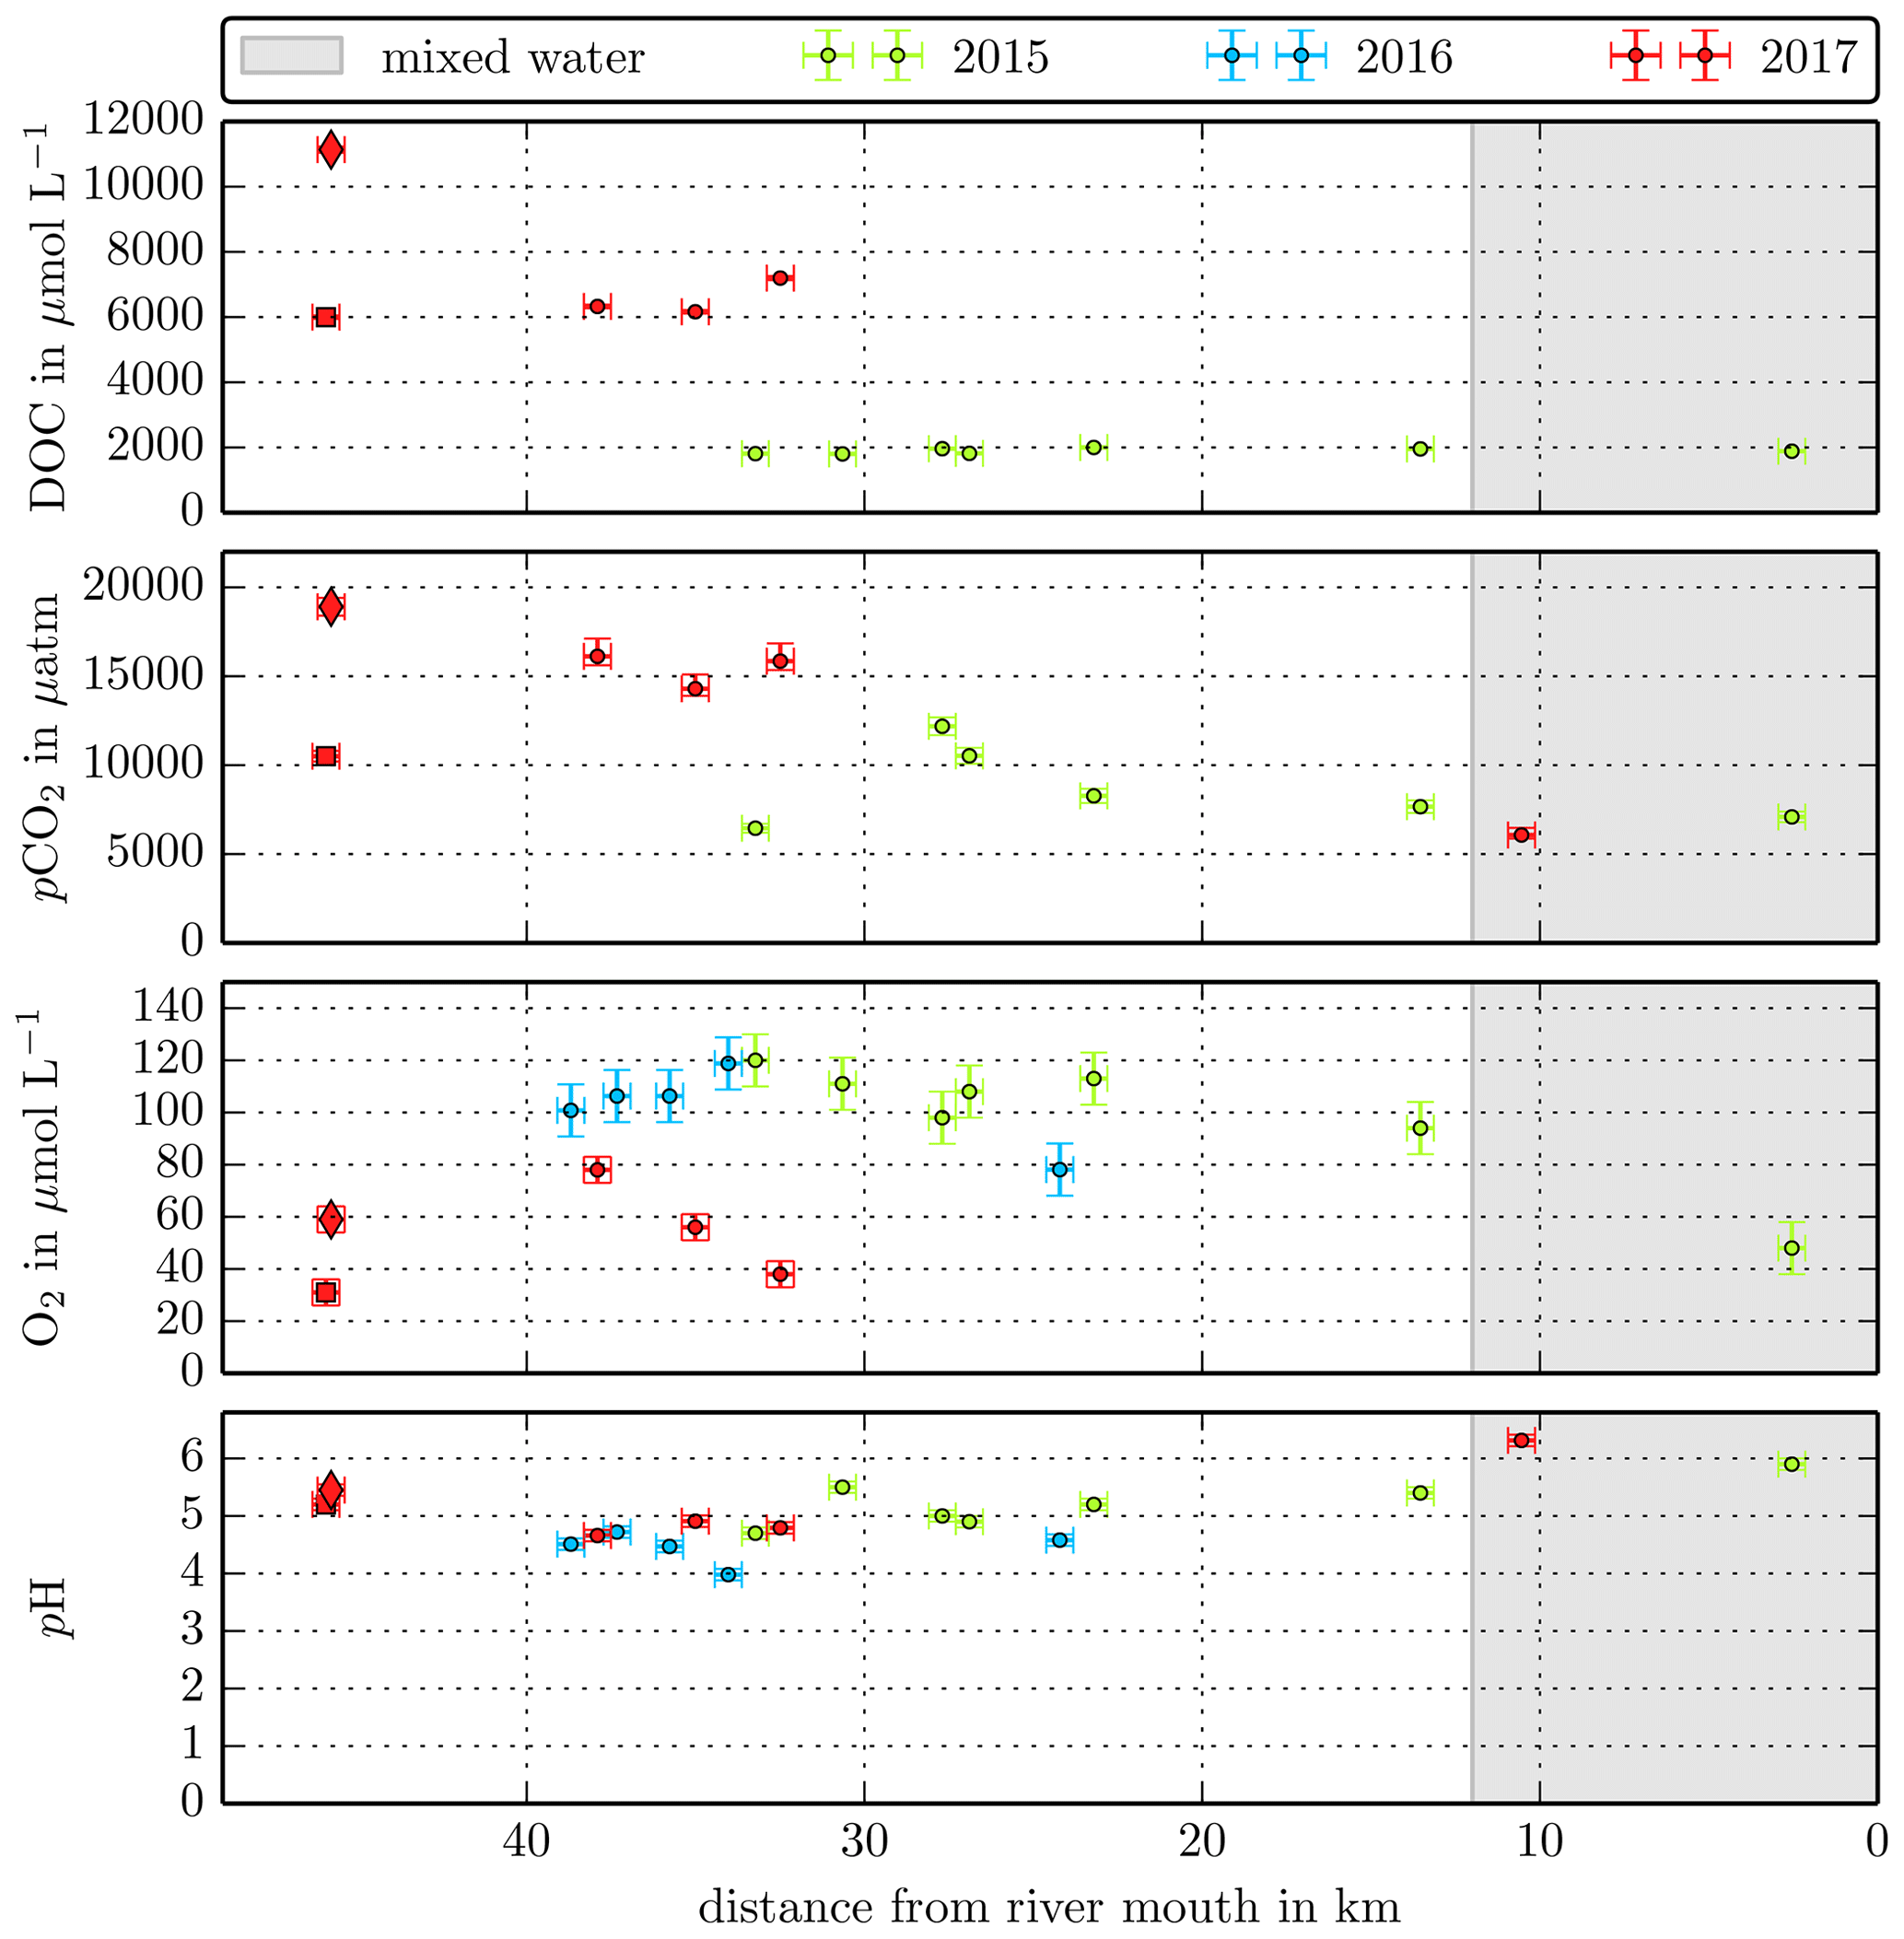
Figure B3Individual DOC, CO2, O2, and pH measurements in the Simunjan River versus the distance from the river mouth. Different colours stand for the individual river campaigns, and the grey shaded area indicates regions of S>1 that were excluded from the data in this study.
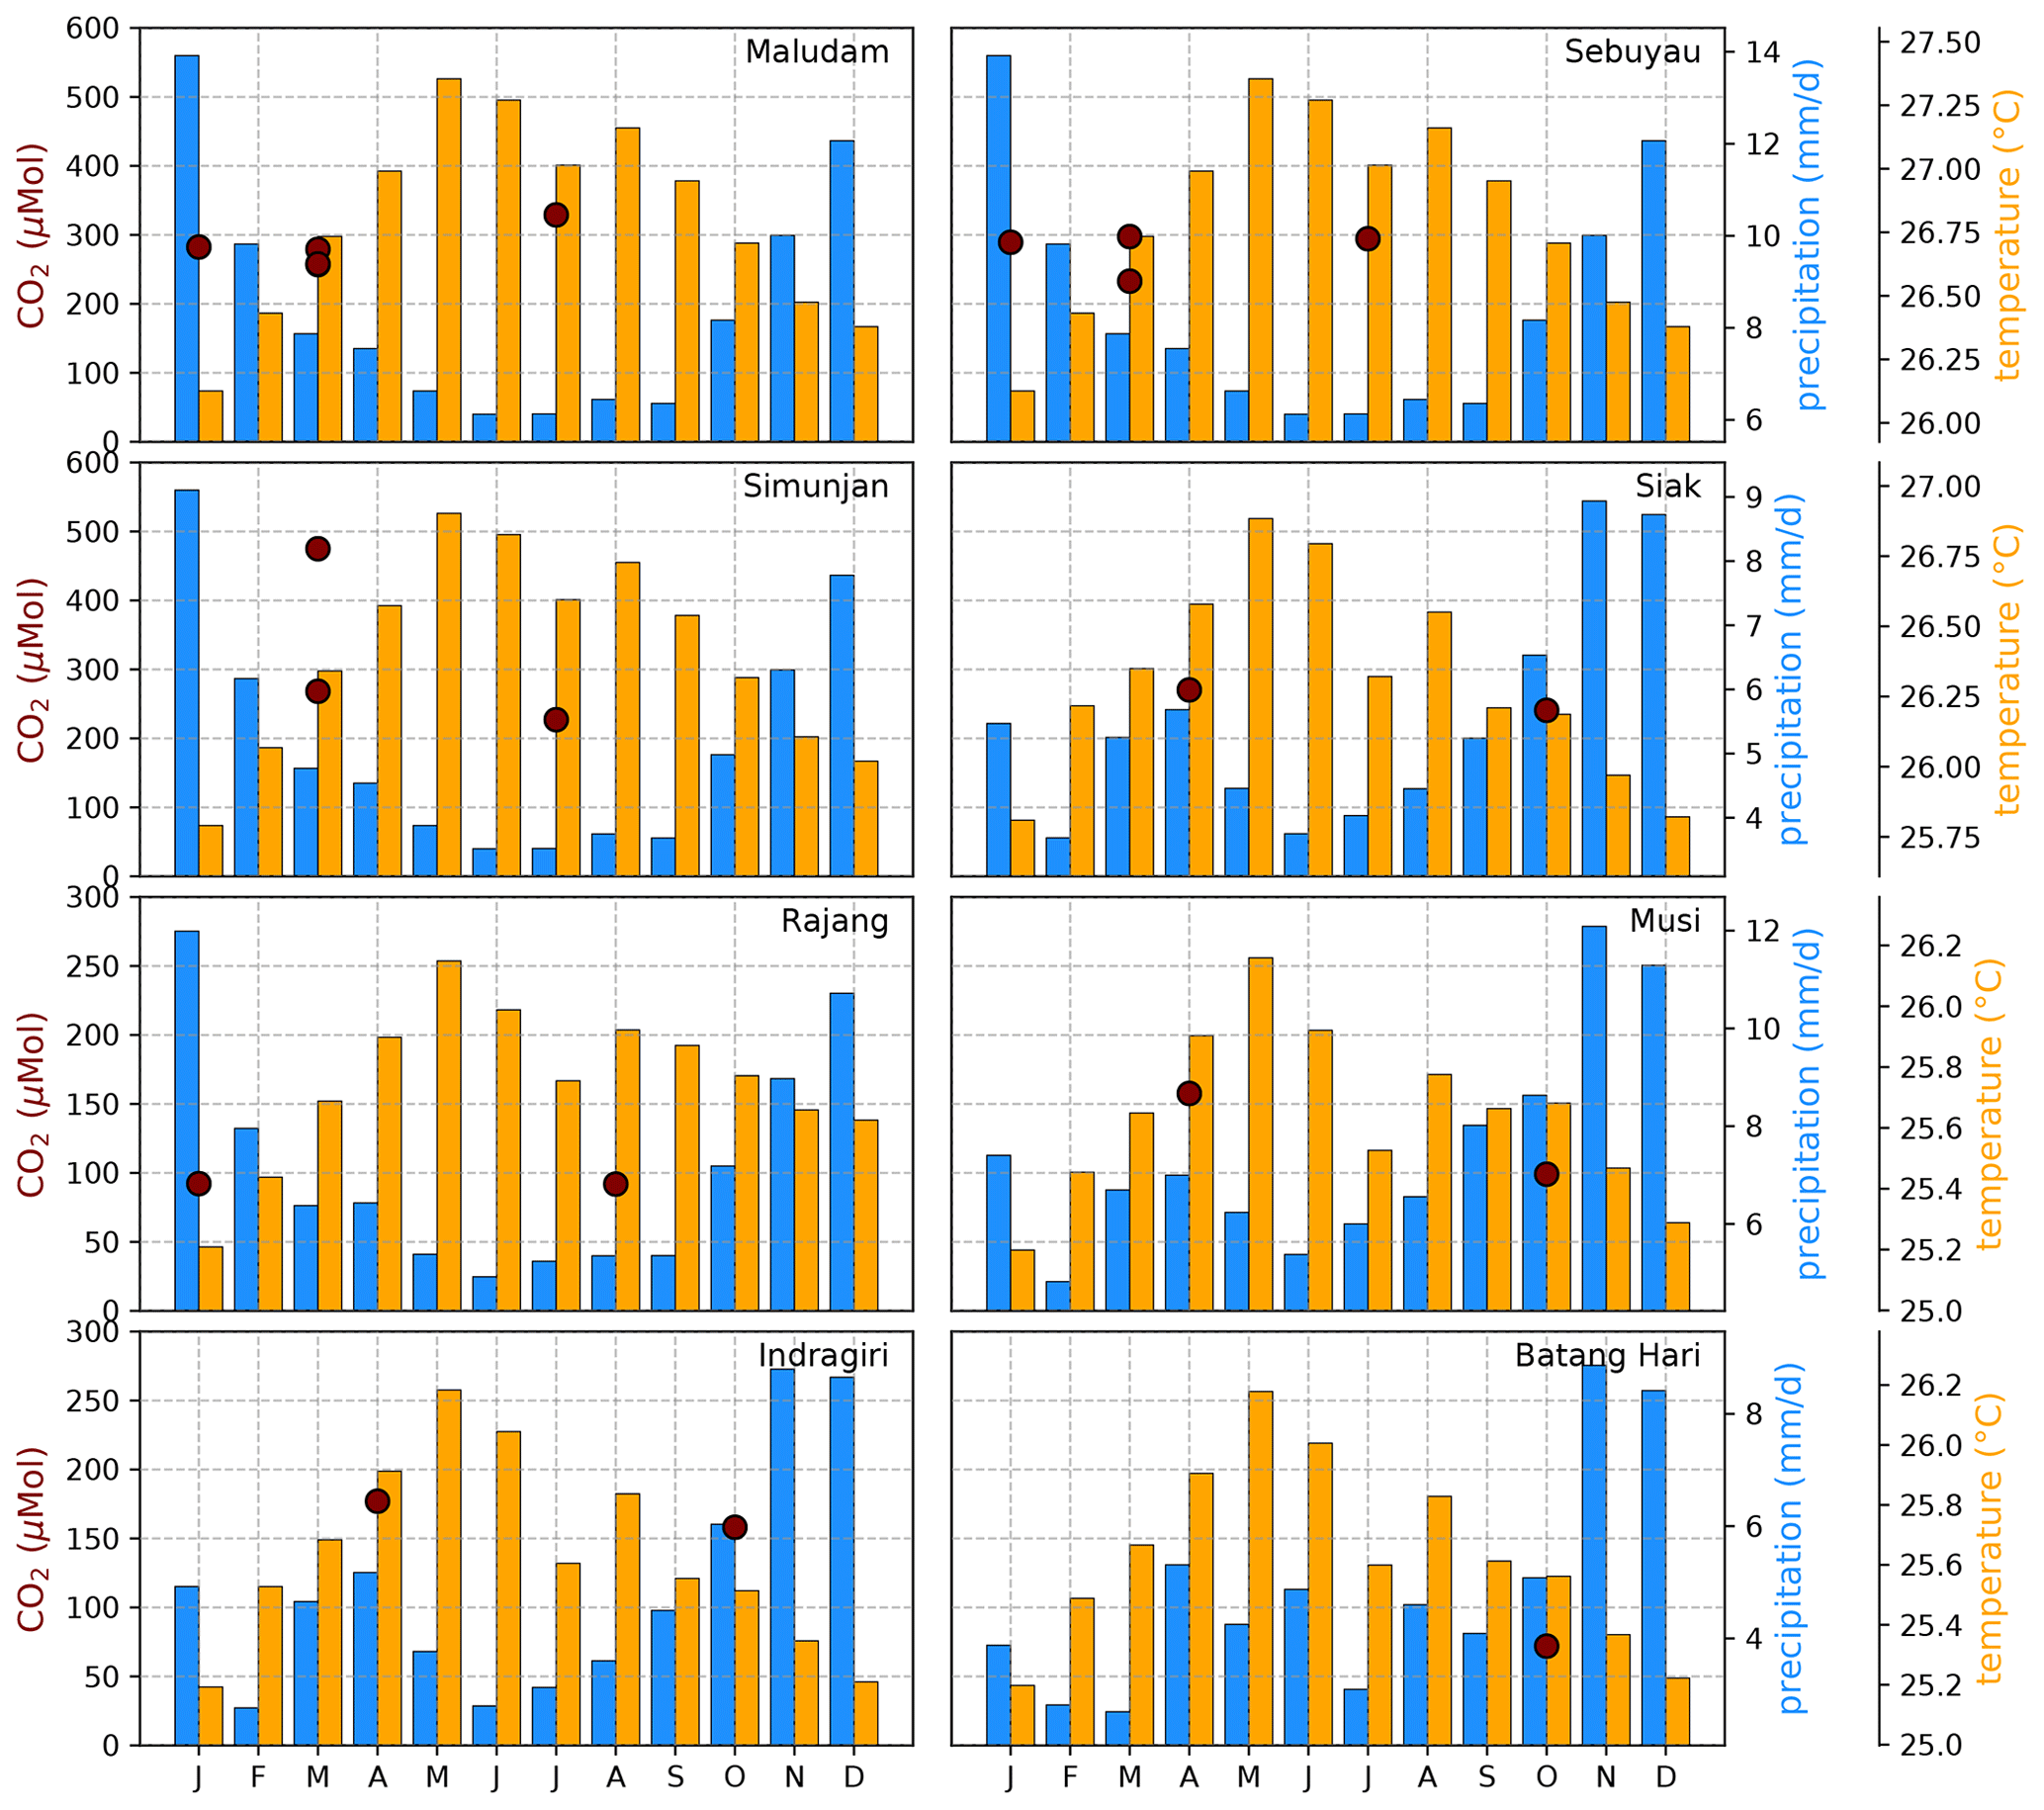
Figure B4Average CO2 concentrations for individual campaigns compared to monthly temperature (Natawa, 2018a; Yasutomi et al., 2011) and precipitation (Natawa, 2018b; Yatagai et al., 2020) data (2005–2015 average) at the location of the respective river. Each panel represents one river.
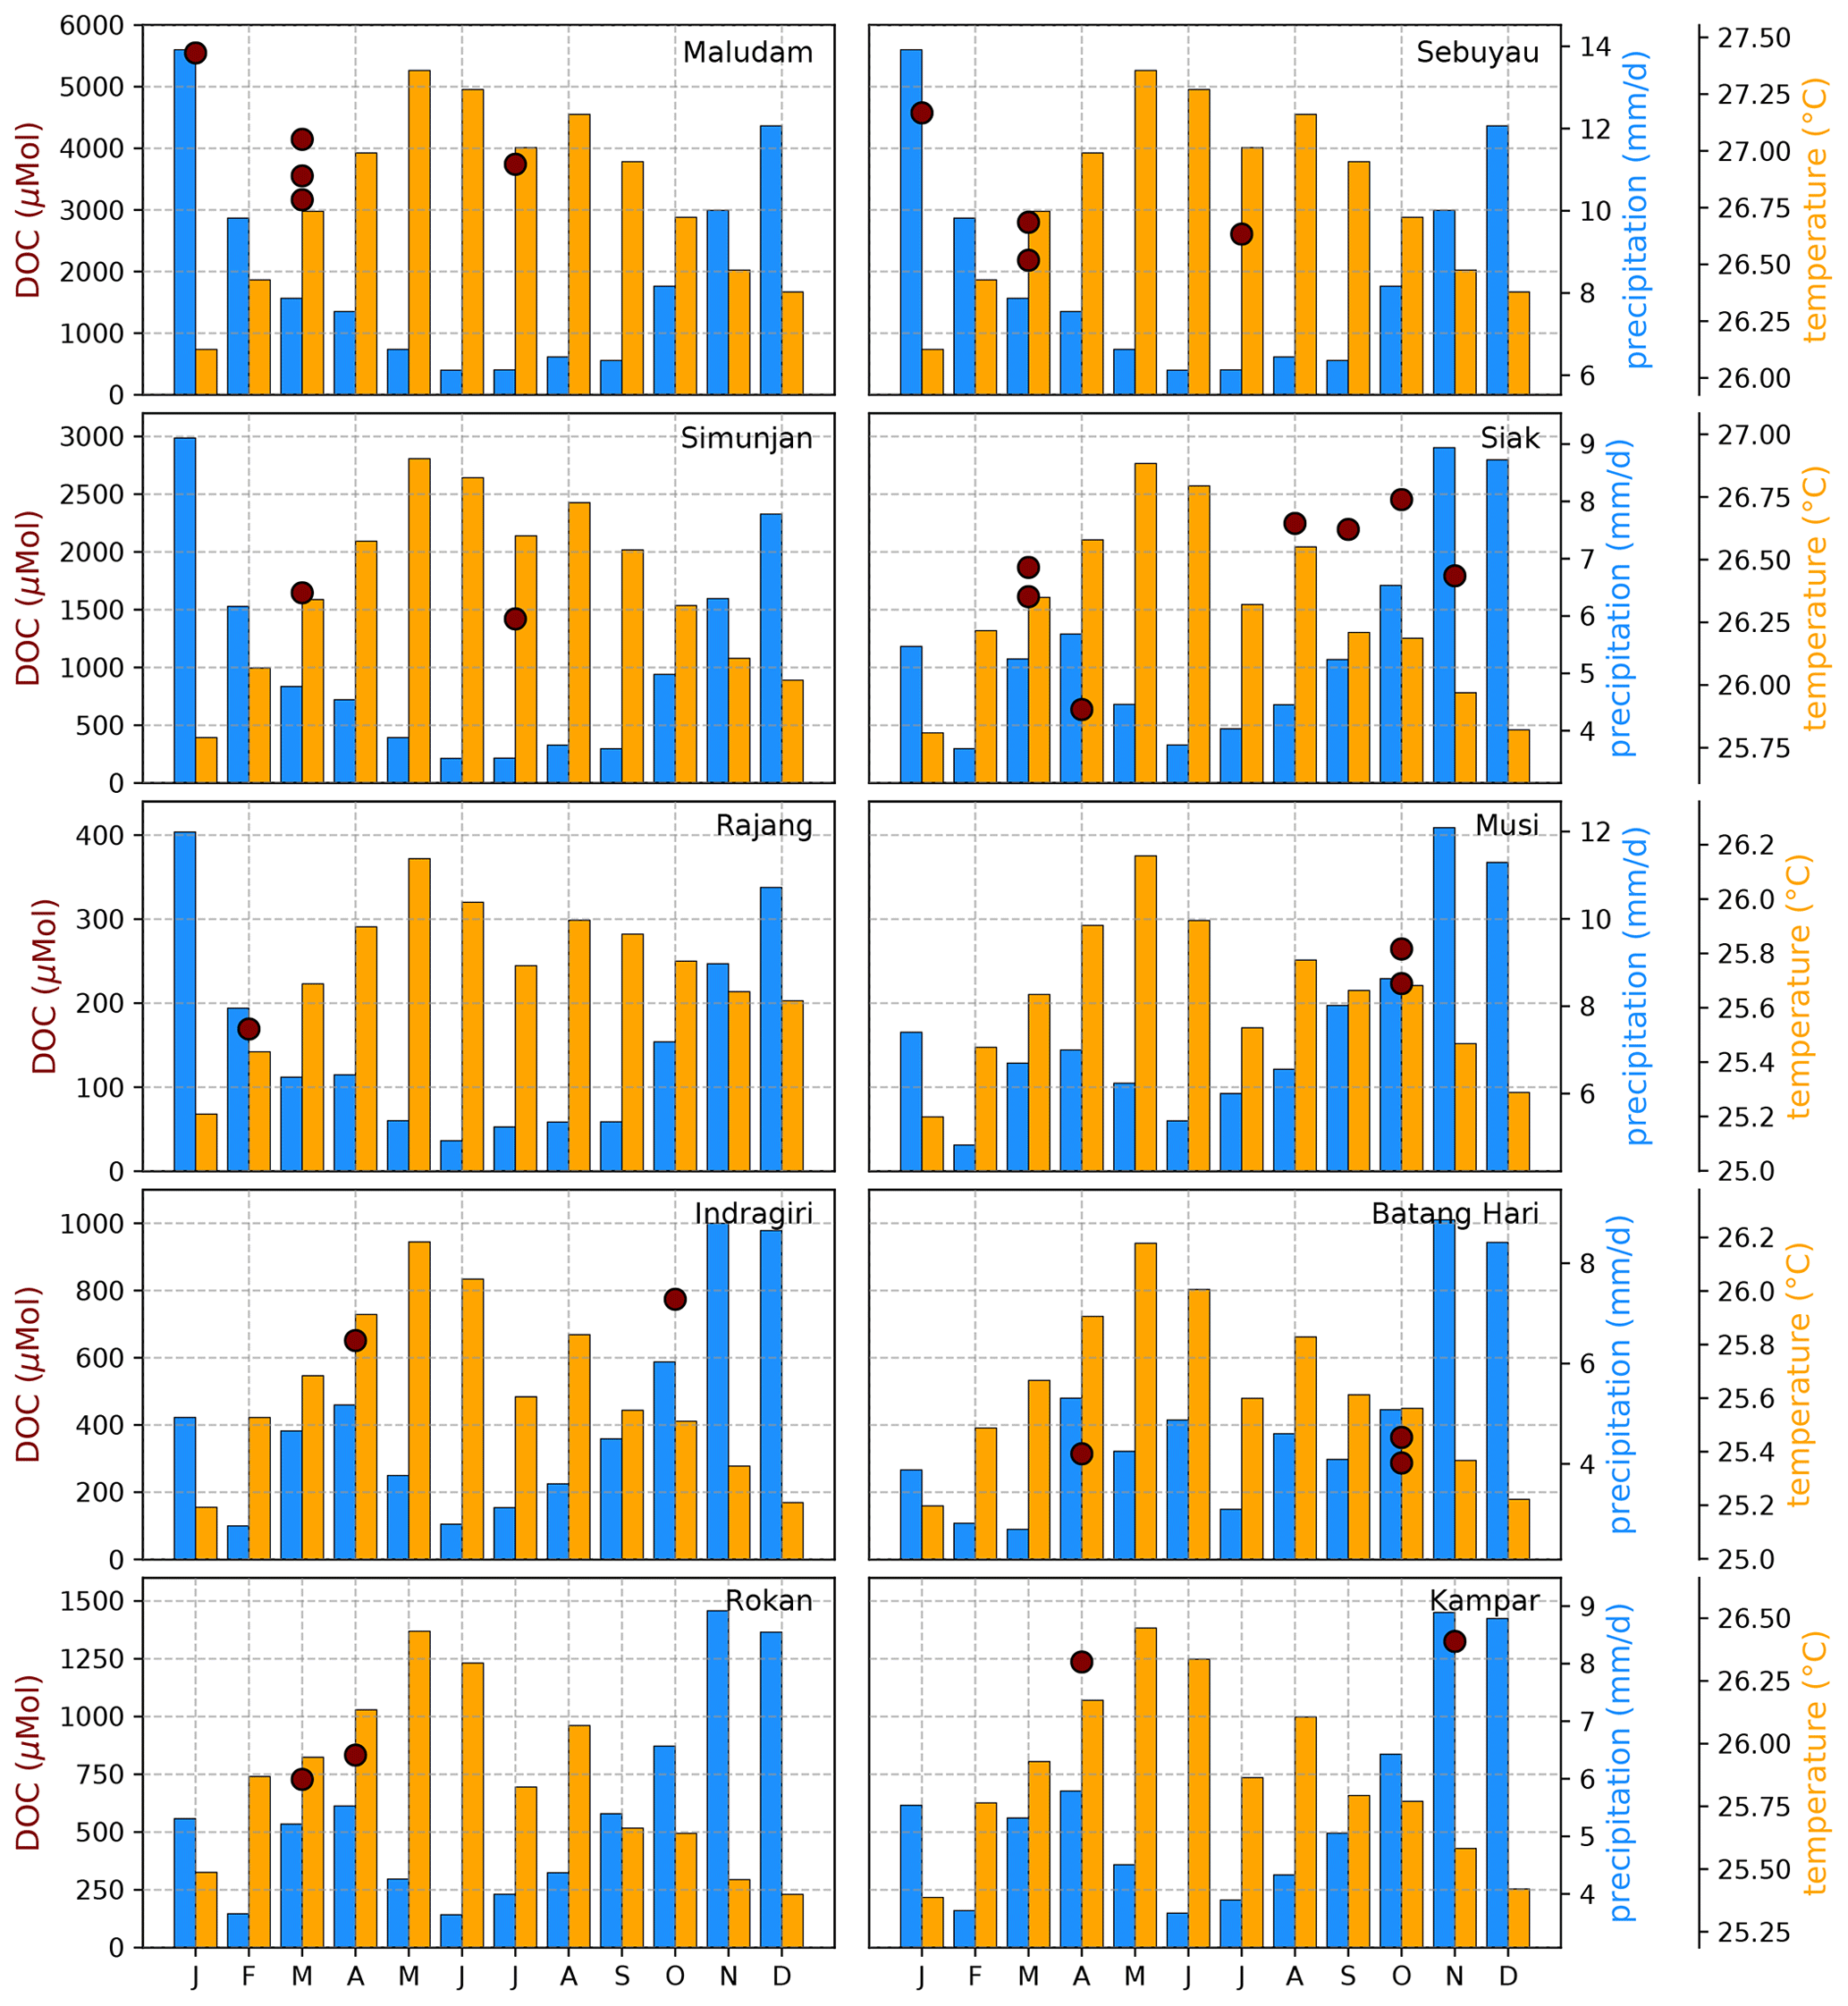
Figure B5Average DOC concentrations for individual campaigns compared to monthly temperature (Natawa, 2018a; Yasutomi et al., 2011) and precipitation (Natawa, 2018b; Yatagai et al., 2020) data (2005–2015 average) at the location of the respective river. Each panel represents one river.
Different peat maps are available for Southeast Asia, and the approaches to determine peat coverage of river catchments were inconsistent among different studies cited in our paper. We want to show here that the choice of a data product is crucial for the determination of peat coverage. We compare three different products (Table C1): the FAO Digital Soil Map of the World, country products downloaded at Global Forest Watch, and the Center for International Forestry Research (CIFOR) Wetlands distribution.
Those three products lead to highly different results (Table C2). We observed a tendency that CIFOR leads to smaller peat coverage than FAO and GFW. This is because CIFOR misses some, but not all peat areas that are known to be under industrial plantations. Gumbricht et al. (2017a) already pointed out that their model underestimates peatland area in Sumatra because peats are largely drained, which the model does not capture. However, in the Musi and Batang Hari catchment, CIFOR sees larger peat areas than FAO and GFW, which means that some peatlands might be missing in those maps.
We decided to use the GFW maps for several reasons: (1) CIFOR seems to miss peat under industrial plantations, which is still relevant for river carbon dynamics. Therefore, we chose not to use the CIFOR maps. (2) Between GFW and FAO, GFW is more recent than FAO for Indonesia. For Sarawak (Malaysia), both are based on the 1968 soil map by the Land Survey Department, but FAO uses a 10-fold coarser scale than the 1968 soil map (1:5 000 000 compared to 1:5 000 000). Thus, the GFW product was used. (3) GFW maps are based on official information, and we believe that the local authorities would know best about the peatland distribution in their country.
Similar to the peat coverage, the publications from which we use data in our study all had different approaches to determining catchment size – either including (Müller-Dum et al., 2019) or excluding (Wit et al., 2015) smaller sub-catchments. In our study, we aimed to unify those different approaches. Therefore, we recalculated catchment areas from one single data product (HydroSHEDS, Lehner et al., 2008), including sub-catchments that were identified using HydroSHEDS flow directions. The Simunjan catchment is included in the bigger Sadong catchment in HydroSHEDS. Therefore, it was manually delineated using HydroSHEDS flow directions.
(FAO-UN, 2007)(MoA, 2012)(Wetlands International, 2004)Gumbricht et al. (2017b)Gumbricht et al. (2017a)Table C1Different data products used to assess peatland extent in the catchments.
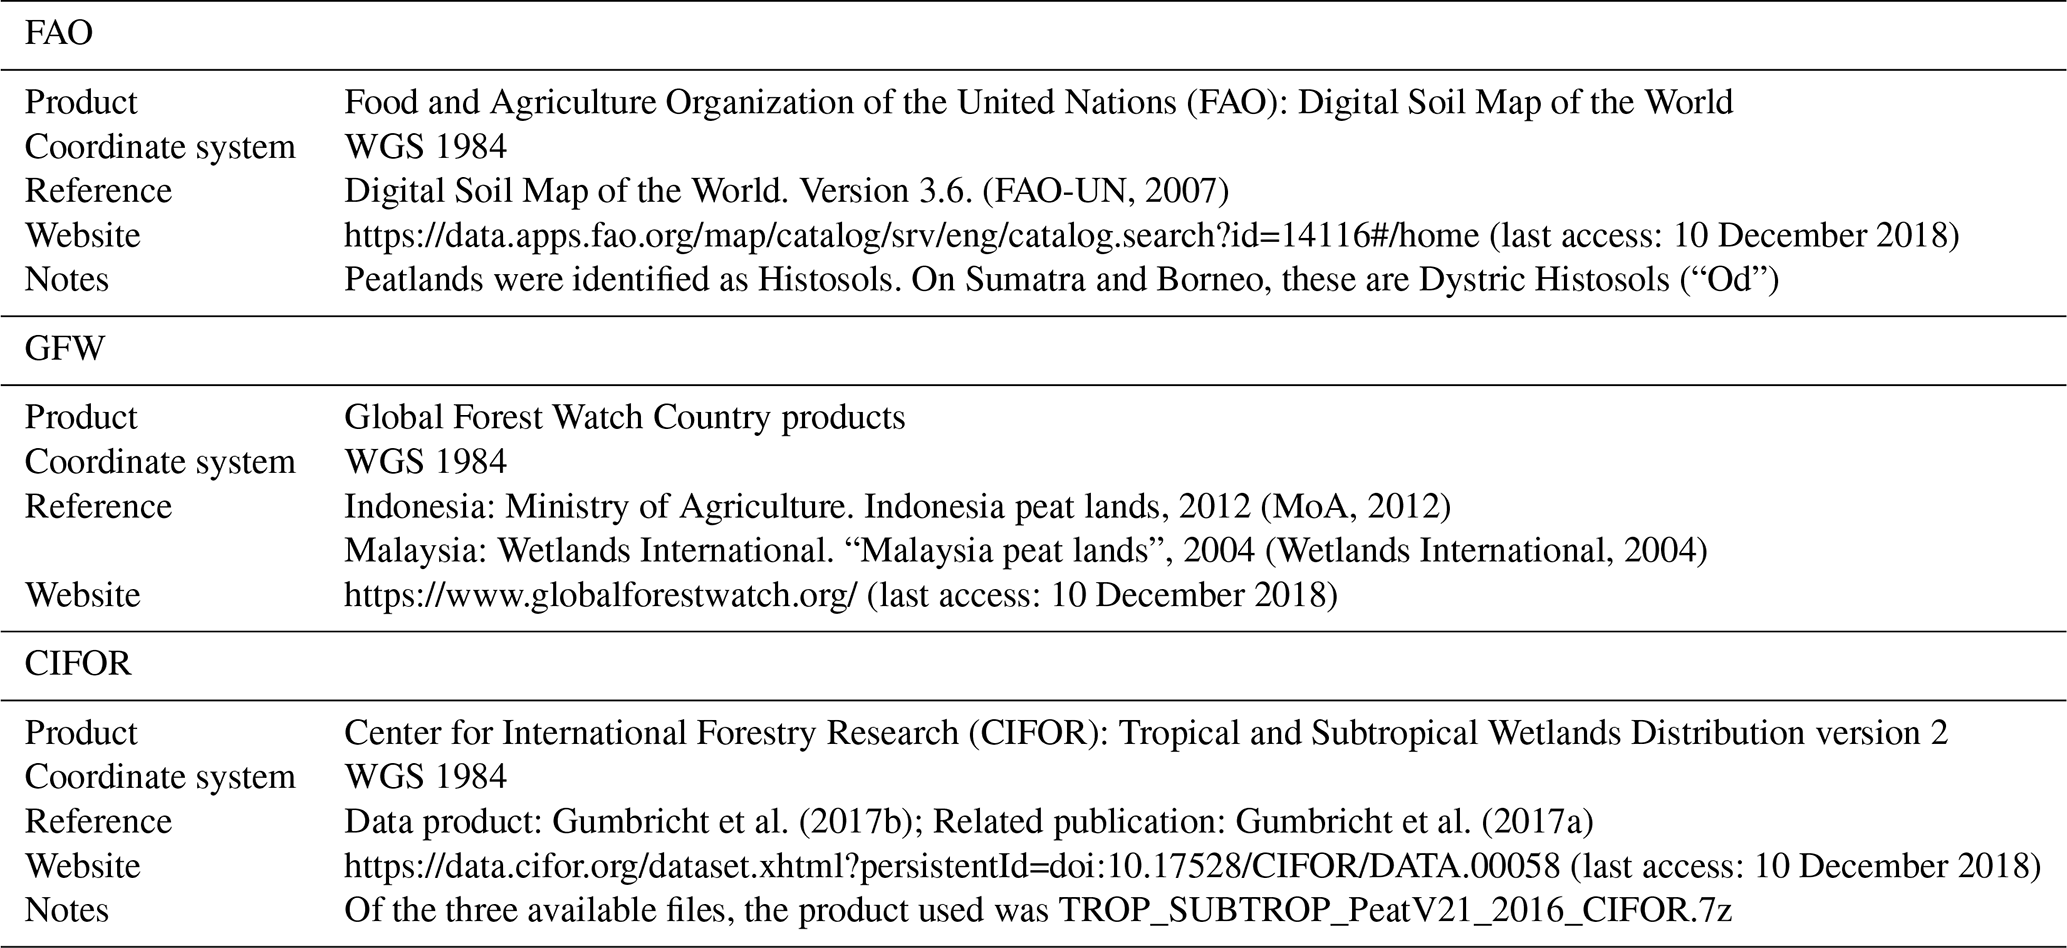
Table C2Results for peat coverage (PC) in the different catchments using the three different data products.
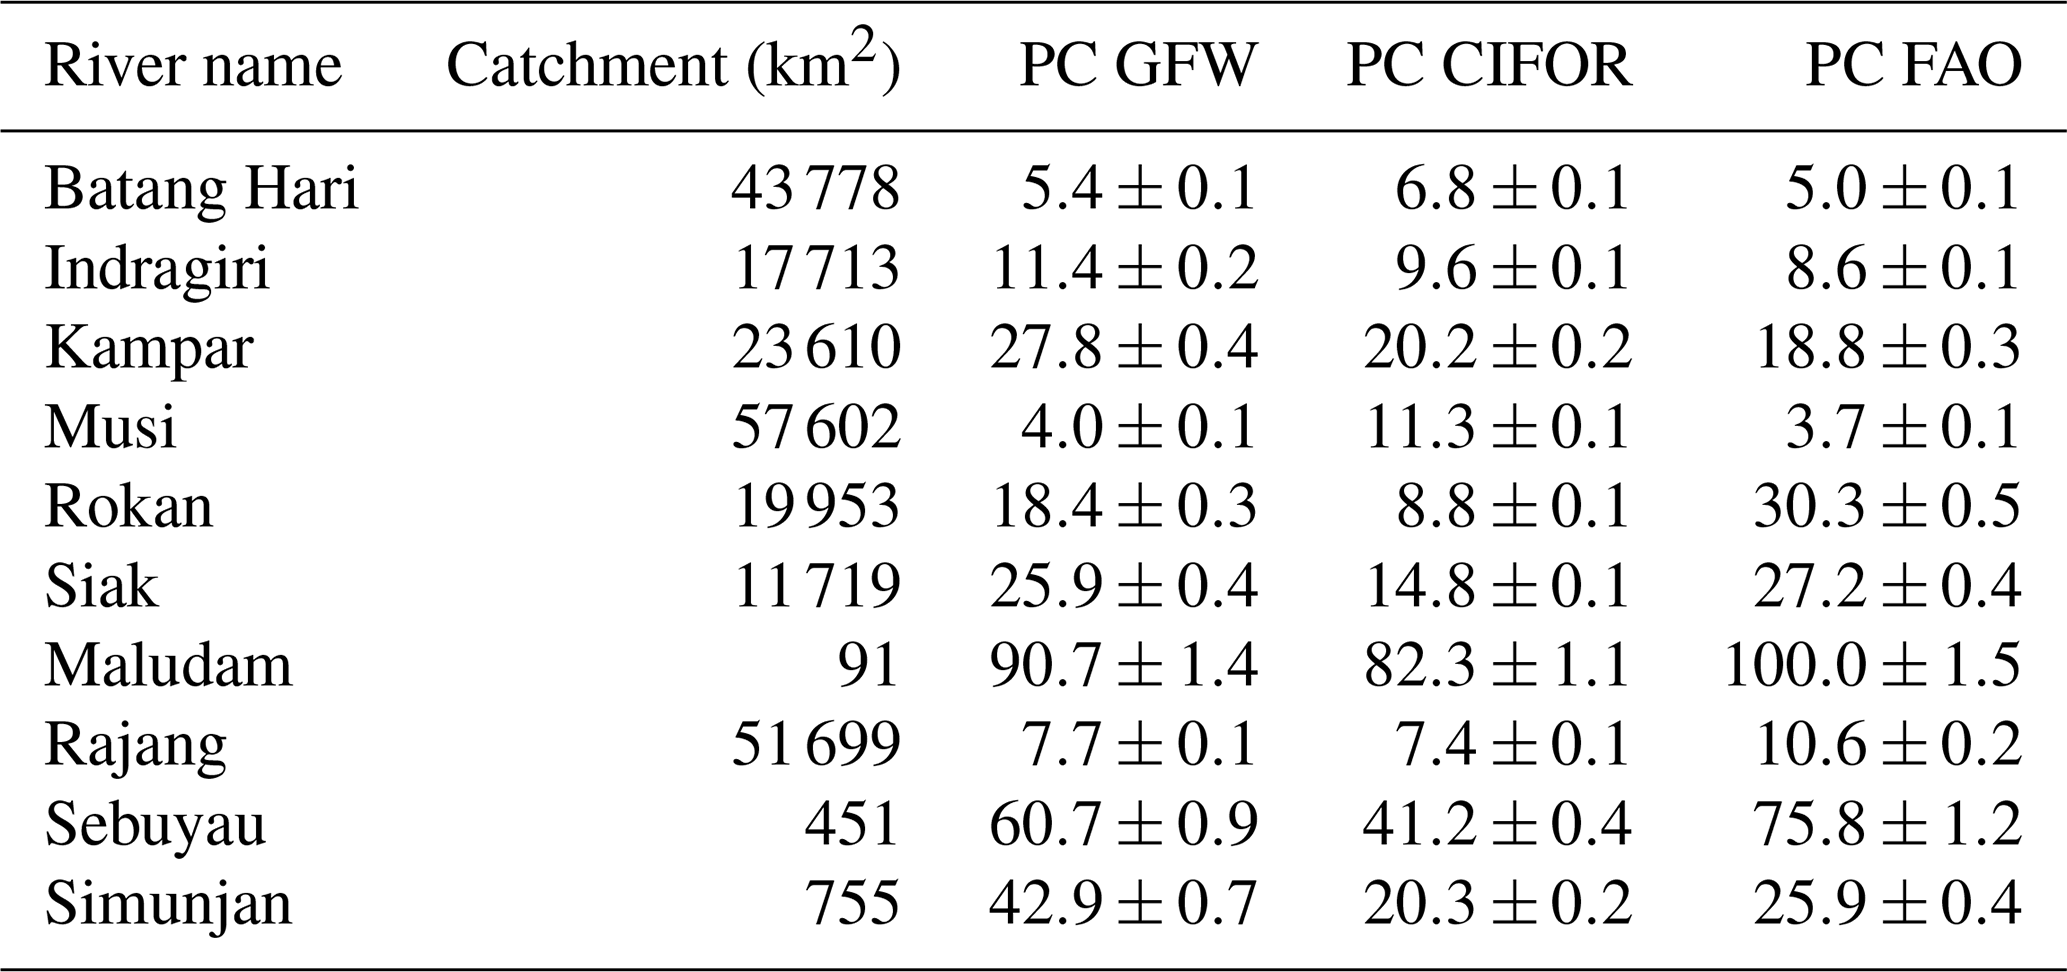
Table C3Correlations between the derived parameters.
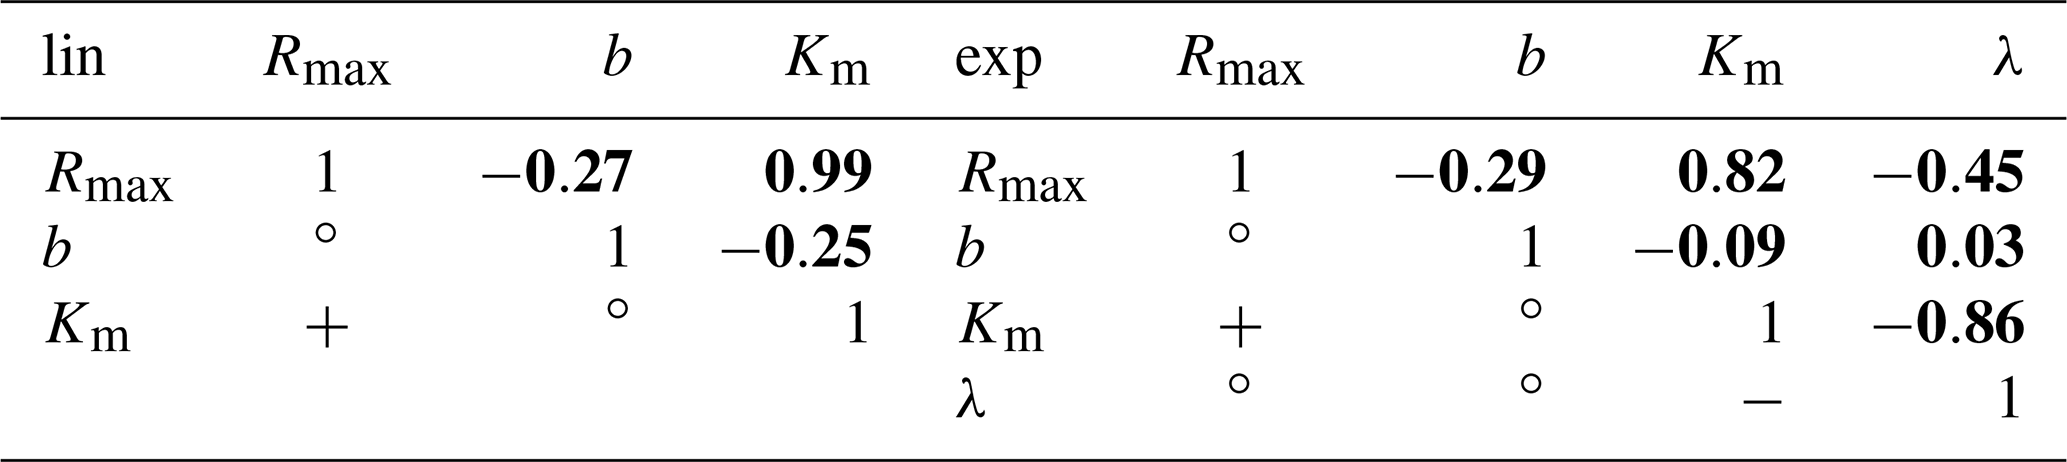
Positive (), negative (), and non-significant () correlations between the parameters are indicated in the bottom left. The top right bold numbers represent the numerical Pearson correlation coefficients (ρ) between the parameters. The correlations are derived from the least-squares optimization of the linear pH approach (left table) and the exponential pH approach (right table). Rmax is the maximum decomposition rate, b is the fraction of O2 consumption by decomposition, Km is the Michaelis constant for O2 concentrations, and λ is the exponential pH limitation constant.
Uncertainty sources in the least-squares optimizations are interdependencies between the fitted parameters and noise in the measured data. We try to minimize the impact of measurement noise by including relative uncertainties (σ) of measured CO2 and O2 in the least-squares optimization. Thus, data from rivers with higher variation in measured parameters are constrained less rigidly in the optimization. The parameter interdependence is a more important source of uncertainties for our optimization as they cause interdependencies between the fitted parameters as well. This is especially relevant for the linear approach, where the functional dependencies of CO2 and O2 on the different river parameters are more similar than for the exponential approach (Fig. A2).

Figure D1Correlation between measured and calculated concentrations of (a) CO2 and (b) O2. Grey lines indicate the 1:1 line. Calculations were performed for exponential pH limitation without O2 limitation. Each data point represents one river. Grey data points are excluded from the correlation since the data for these rivers are based on fewer than three campaigns within the same season.
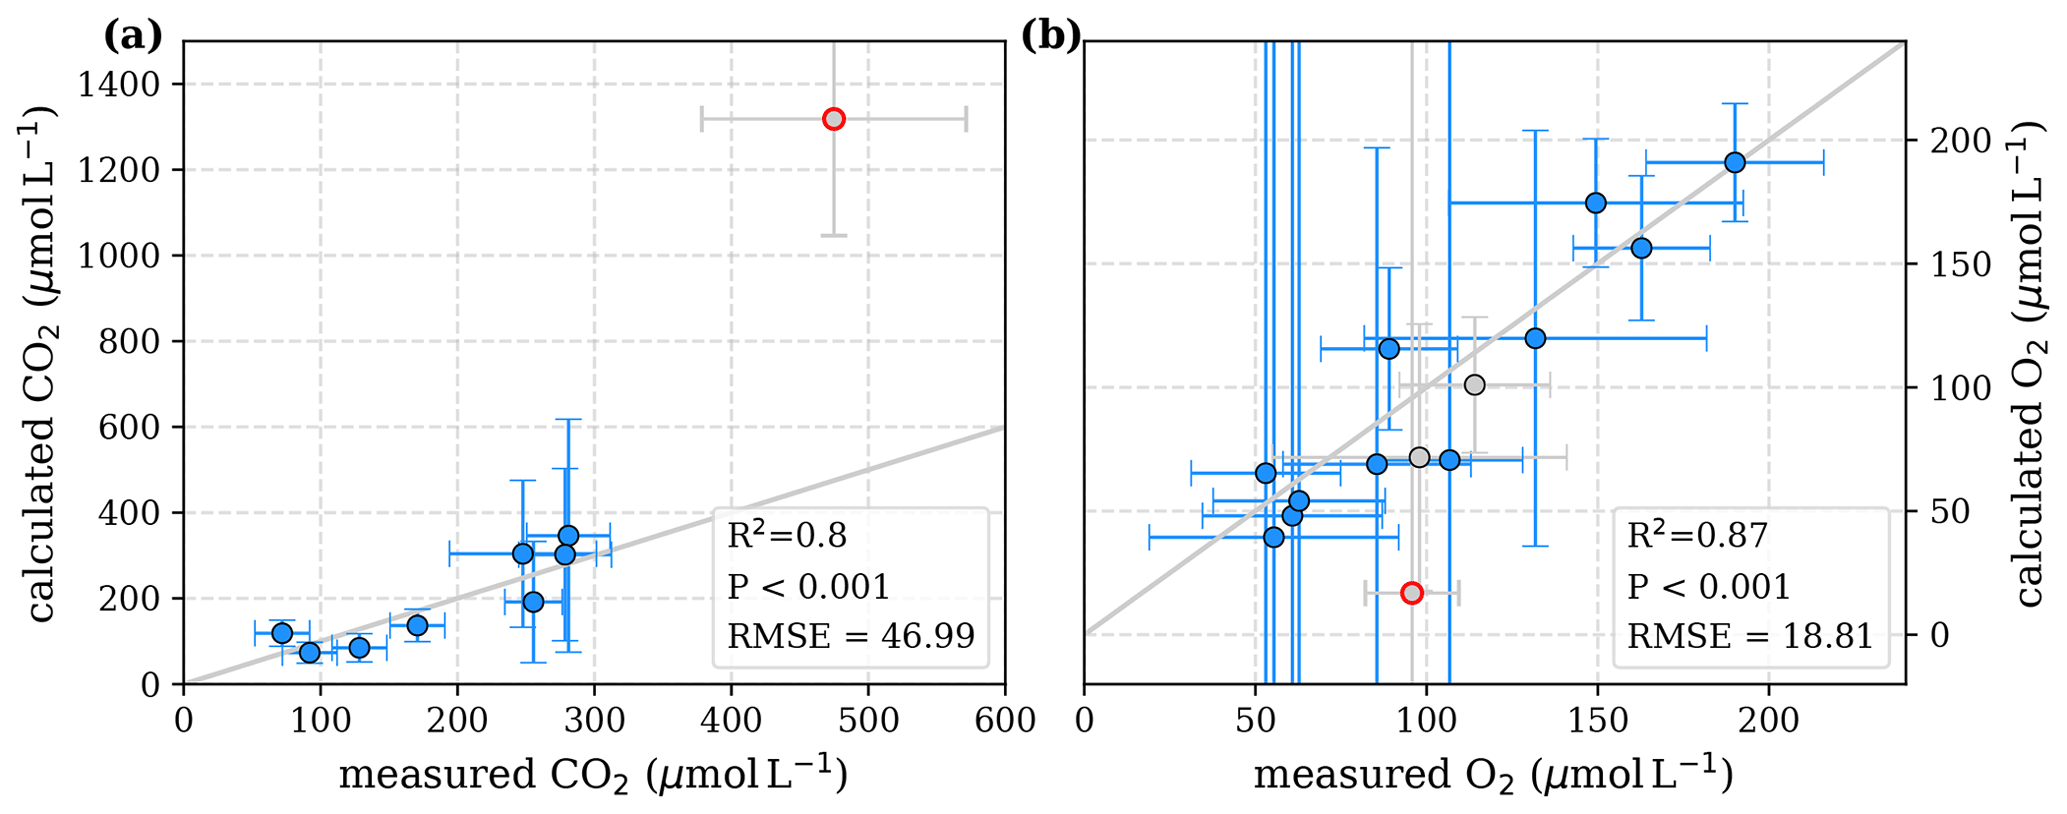
Figure D2Correlation between measured and calculated concentrations of (a) CO2 and (b) O2. Grey lines indicate the 1:1 line. Calculations were performed based on the equations in Table 1, which represent linear pH limitation of decomposition rates. Each data point represents one river. Grey data points are excluded from the correlation since the data for these rivers are based on fewer than three campaigns within the same season. The Simunjan campaigns with high carbon concentrations (Simunjan2, Table 4) are indicated by red circles.
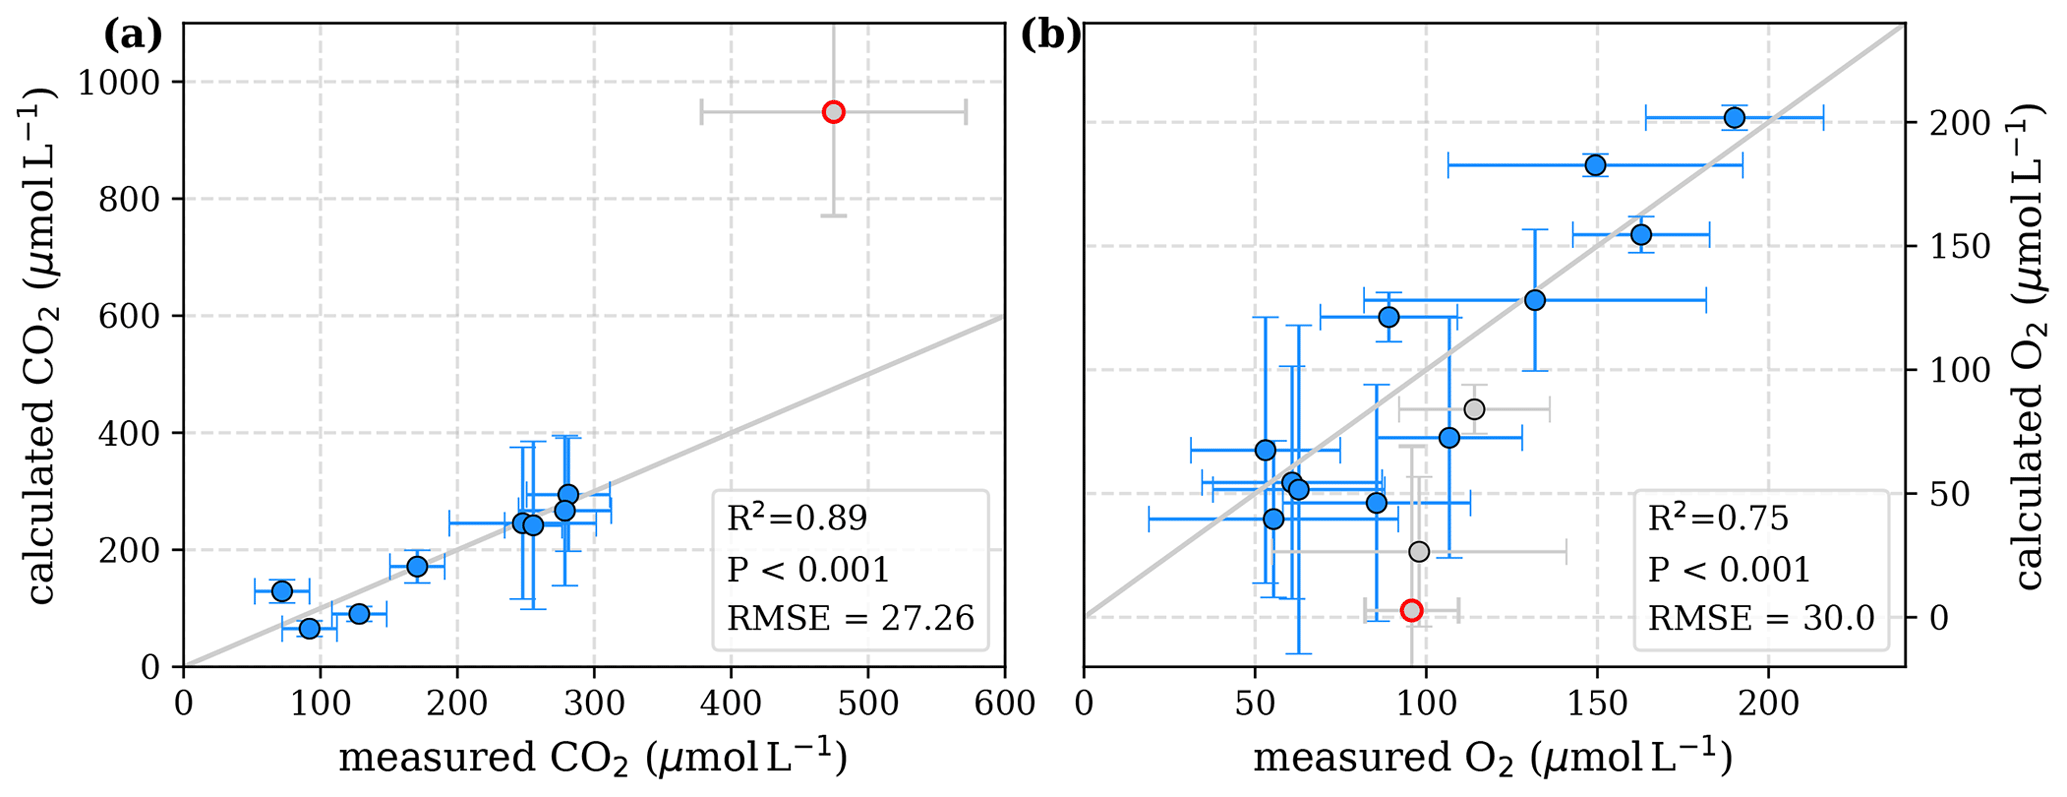
Figure D3Correlation between measured and calculated concentrations of (a) CO2 and (b) O2. Grey lines indicate the 1:1 line. Calculations were performed based on the equations in Table 2, which represent exponential pH limitation of decomposition rates. Each data point represents one river. Grey data points are excluded from the correlation since the data for these rivers are based on fewer than three campaigns within the same season. The Simunjan campaigns with high carbon concentrations are excluded from these figures and further discussed in the Appendix D5. The Simunjan campaigns with high carbon concentrations (Simunjan2, Table 4) are indicated by red circles.
D1 Parameter collinearity
The functional CO2 dependencies on pH, O2, and DOC are more similar to each other for the linear than for the exponential pH approach (Fig. A2). This is also reflected in higher parameter uncertainties derived from the linear pH approach (Table 5). However, investigation of the correlation coefficients between the individual parameters reveals a strong positive correlation between the maximum decomposition rate (Rmax) and the Michaelis constant for O2 (Km) in both the linear and the exponential pH approaches (Table C3). Additionally, there is a significant negative correlation between the exponential pH limitation constant (λ) and Km (Table C3).
For the linear pH approach, the extremely high correlation between Rmax and Km (ρ=0.99) makes it impossible to meaningfully disentangle the individual impacts of these parameters. To test the possibility of a linear pH limitation in decomposition, least-squares correlations with fixed Km parameters within literature values (1–40 µmol L−1, Fenoll et al., 2002) were performed (Appendix D2).
For the exponential approach, while the parameters show a strong correlation (ρ=0.82 for Rmax and Km and for Km and λ; Table C3), the functional dependencies are distinct enough to disentangle the parameter's impacts comparatively well, and the comparison to literature values supports the exponential pH limitation. The high uncertainty in the Km parameter for this approach is only of small relevance as the O2 limitation is comparatively weak. In fact, the pH limitation alone is able to reproduce the measured parameters quite well (Appendix D3).
D2 Least-squares optimizations of linear pH approach with fixed Km parameters
To test the possibility of a linear pH limitation in decomposition, least-squares correlations for fixed O2 Michaelis constants within literature values of 1–40 µmol L−1 (Fenoll et al., 2002) were performed (Table D1). The good agreement for all Km values is caused by the strong collinearity between Km and Rmax that enables a change in Rmax to compensate for changes in Km. Rmax values for the fixed Km values range between 1.4 and . These maximum decomposition rates are lower than high decomposition rates derived based on global phenol oxidase activity by Sinsabaugh et al. (2008). The fraction of O2 consumption ranges between 102 % and 109 %, indicating that for this approach to be true, more O2 would need to be consumed than CO2 is produced. In reality, additional O2 can be taken from the organic matter, reducing the needed O2 compared to CO2 production. Thus, despite the good correlation to measured data (Table D1) the derived parameters for the linear approach do not agree well with literature data, which makes this approach unlikely.
D3 Least-squares optimizations of exponential pH approach without O2 limitation
Our study revealed that low pH is the main decomposition-impelling parameter in peat-draining rivers. To study whether this parameter alone can explain the observed stagnation on CO2 and O2 for high peat coverage (Fig. 2), a least-squares optimization without O2 limitation was performed. This optimization yields decomposition parameters that differ only insignificantly from the parameters derived for exponential pH limitation with additional limitation by O2 (Table D2). The correlation of measured CO2 and O2 to concentrations derived based on these parameters and the equations in Table 2 reveals a good agreement (Fig. D1). Only for the Kampar River does neglect of the O2 limitation yield negative river O2 concentrations (Fig. D1). This indicates that for O2 concentrations in the examined rivers (O), the pH limitation alone is sufficient to explain the majority of the observed stagnation.
D4 Validation of optimal pH for phenol oxidase activity
To validate the optimal pH for decomposition (pH0) in our study area, a least-squares optimization of the exponential pH approach (Table 2) including the parameter pH0 was performed. The resulting pH value of pH0≈7.2 agrees well with the literature value of 7.5 used in our study (Table D3). However, it reveals a high collinearity to Rmax that causes high parameter uncertainties.
D5 Decomposition approach for abnormal Simunjan campaigns
In the correlation figures Figs. 3 and 4, the Simunjan campaigns of January 2016 and March 2017 (Table 4) were excluded due to scaling of the figures. Here we show the correlation figures with inclusion of those campaigns (Figs. D2 and D3). Since the data are based on only one campaign, they were excluded from the least-squares optimization. Calculated CO2 concentrations based on both limitation approaches result in significantly higher concentrations than measured during the campaign (Figs. D2 and D3). At the same time, calculated O2 concentrations are lower than measured concentrations in the rivers.
This indicates that the parameters in these campaigns are not in equilibrium based on the processes of atmospheric gas exchange and decomposition. This could be caused by additional processes of CO2 sources and sinks during these anomalous campaigns. However, since the observed events are temporal, we consider it likely that the river parameters simply had not reached a state of equilibrium yet. With such high carbon yields it is also possible that the river cannot reach a state of equilibrium before the water discharges into the ocean. However, as mentioned before, the data are mainly based on one campaign. To validate this assumption, further studies would be needed.
Table D1Decomposition parameters for fixed Km values.
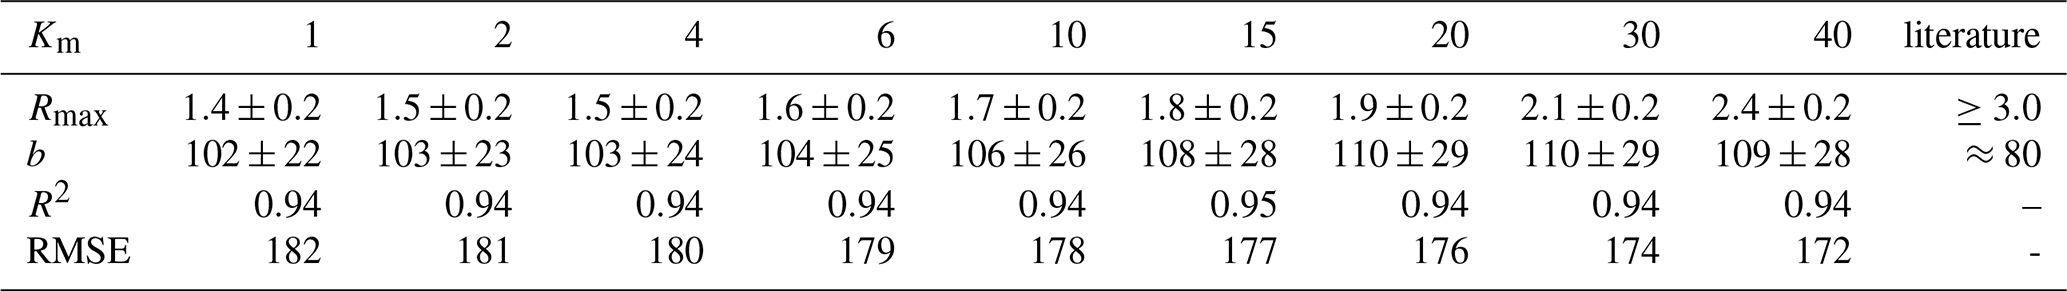
Decomposition parameters derived for the linear pH limitation approach via least-squares optimization of the equations in Table 1 with fixed Michaelis constant for O2 concentrations given in µmol L−1. Rmax is the maximum decomposition rate stated in , and b is the fraction of O2 consumption by decomposition stated in percent. Literature values for Rmax and b are taken from Sinsabaugh et al. (2008) and Rixen et al. (2008), respectively. Additionally, coefficients of determination (R2) and root-mean-square errors (RMSEs) of the correlation between measured CO2 and CO2 derived using these parameters and the equations in Table 1 are listed to indicate the quality of the fit.
Table D2Decomposition parameters for exponential pH limitation without O2 limitation.
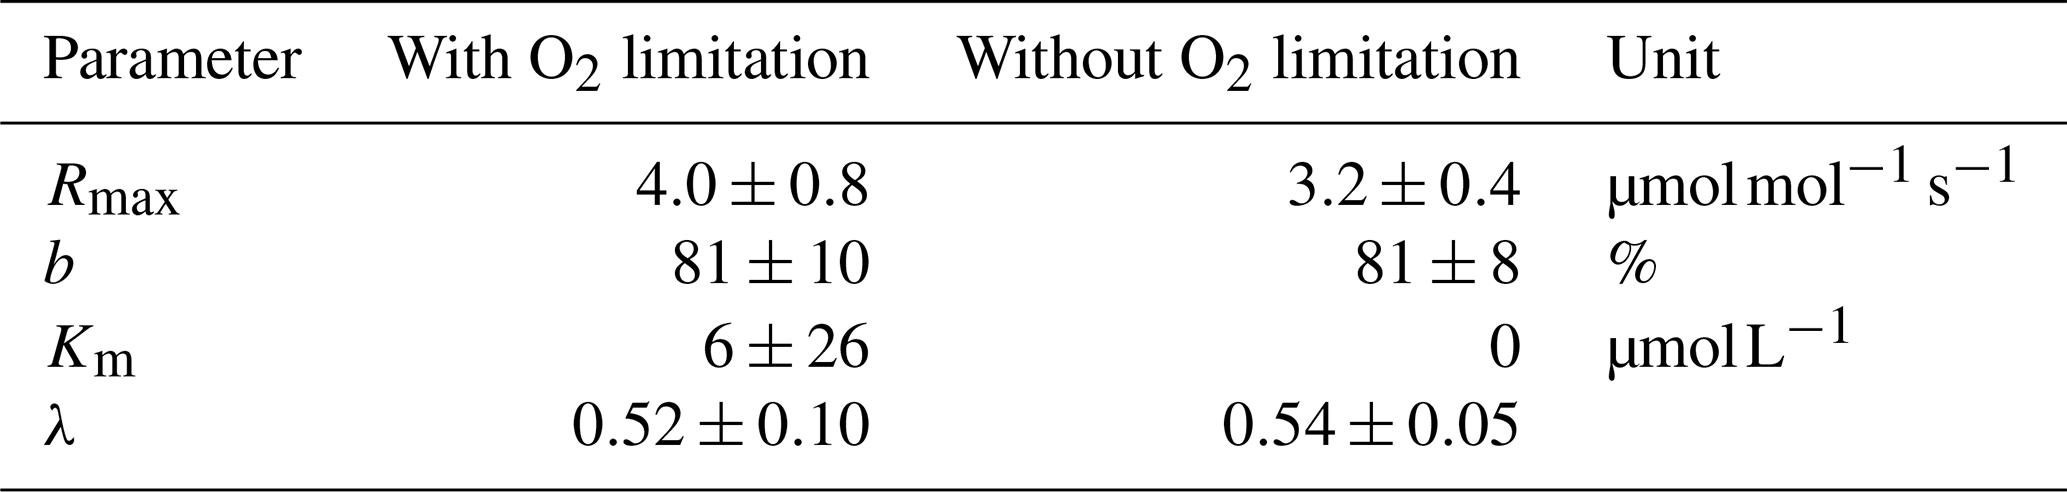
Decomposition parameters derived for exponential pH limitation with and without additional O2 limitation. Parameters were derived via least-squares optimization of the equations in Table 2 to measured data. Rmax is the maximum decomposition rate, b is the fraction of O2 consumption by decomposition, Km is the Michaelis constant for O2 limitation, and λ is the exponential pH limitation constant.
Table D3Decomposition parameters for exponential pH limitation without O2 limitation.
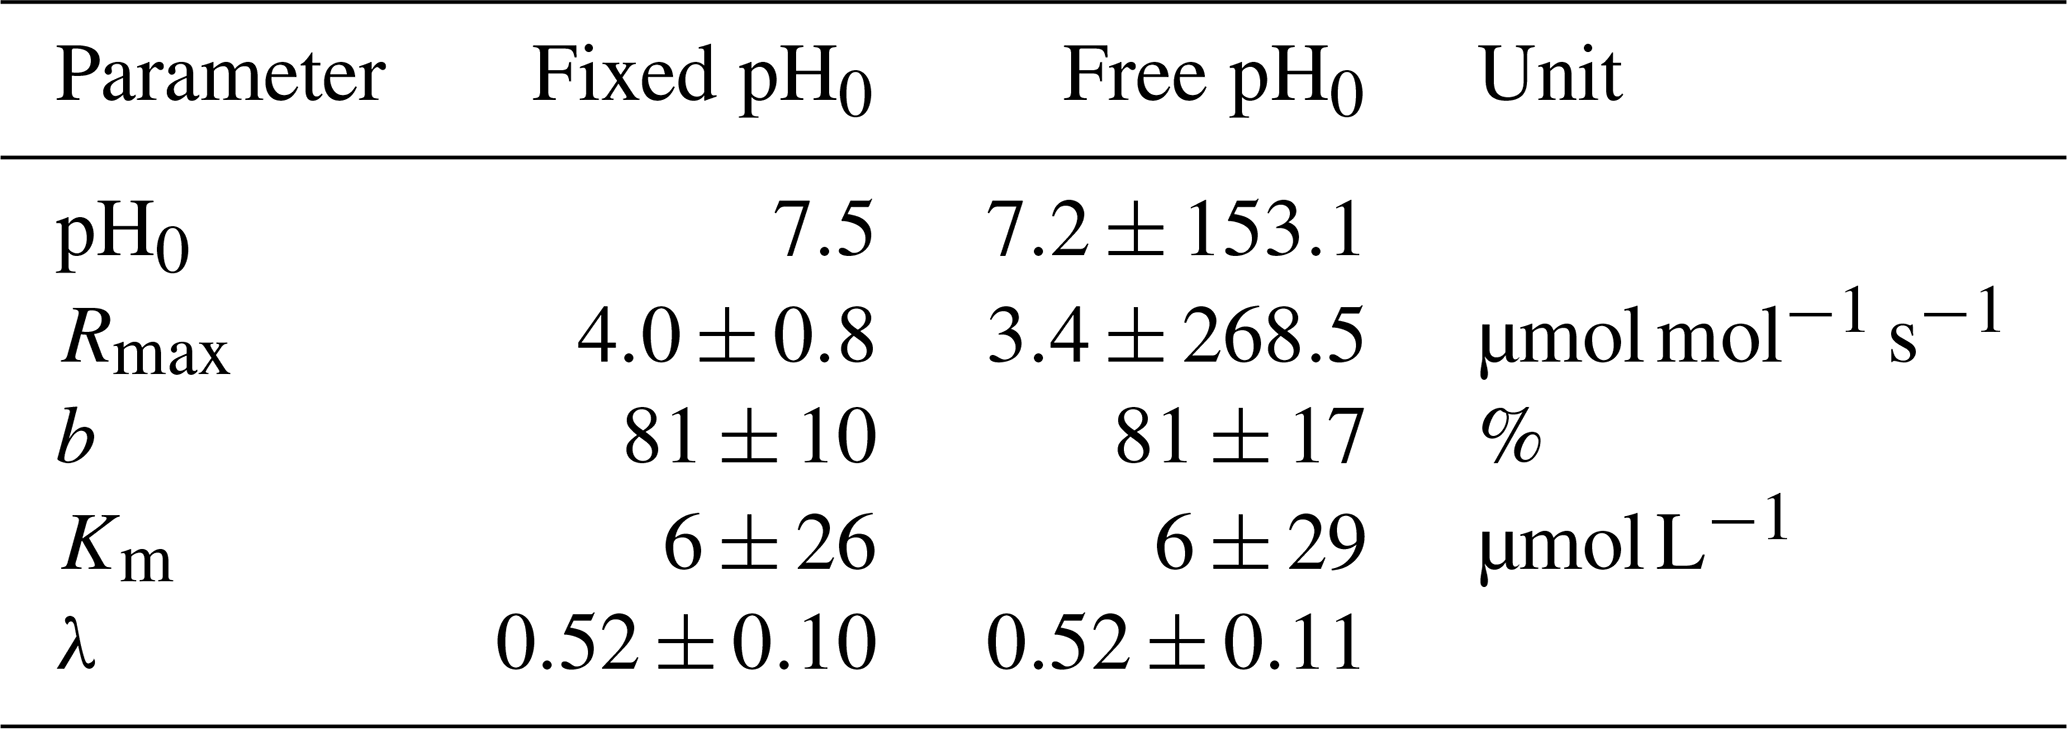
Decomposition parameters derived for exponential pH limitation with freely set pH0 and with a fixed pH0 of 7.5. Parameters were derived via least-squares optimization of the equations in Table 2 to measured data. Rmax is the maximum decomposition rate, b is the fraction of O2 consumption by decomposition, Km is the Michaelis constant for O2 limitation, and λ is the exponential pH limitation constant.
Averaged data from the river campaigns investigated in this study as well as the Python code for the performed least-squares approximations are available as supplementary files to this paper. Raw data from the measurement campaigns are available at the Institute of Environmental Physics, University of Bremen, Bremen, Germany, and will be provided upon request.
The supplement related to this article is available online at: https://doi.org/10.5194/bg-19-2855-2022-supplement.
AK performed the analysis and led the writing of the paper jointly with TR and TW. DMD provided calculations of catchment parameters and in-depth comments on the manuscript. MM coordinated the field data collection in Malaysia. JN contributed to the data interpretation. All authors discussed results and commented on the manuscript.
The contact author has declared that neither they nor their co-authors have any competing interests.
Publisher’s note: Copernicus Publications remains neutral with regard to jurisdictional claims in published maps and institutional affiliations.
We are grateful to the Sarawak Forestry Department and Sarawak Biodiversity Centre for permission to conduct collaborative research in Sarawak under permit numbers NPW.907.4.4(Jld.14)-161 and SBC-RA-0097-MM and Park Permit WL83/2017.
The article processing charges for this open-access publication were covered by the University of Bremen.
This paper was edited by Ny Riavo G. Voarintsoa and reviewed by three anonymous referees.
Abril, G. and Borges, A. V.: Ideas and perspectives: Carbon leaks from flooded land: do we need to replumb the inland water active pipe?, Biogeosciences, 16, 769–784, https://doi.org/10.5194/bg-16-769-2019, 2019. a, b
Aufdenkampe, A. K., Mayorga, E., Raymond, P. A., Melack, J. M., Doney, S. C., Alin, S. R., Aalto, R. E., and Yoo, K.: Riverine coupling of biogeochemical cycles between land, oceans and atmosphere, Front. Ecol. Environ., 9, 53–60, https://doi.org/10.1890/100014, 2011. a
Baum, A. and Rixen, T.: Dissolved Inorganic Nitrogen and Phosphate in the Human Affected Blackwater River Siak, Central Sumatra, Indonesia, Asian Journal of Water, Environ. Pollut., 11, 13–24, 2014. a
Baum, A., Rixen, T., and Samiaji, J.: Relevance of peat draining rivers in central Sumatra for the riverine input of dissolved organic carbon into the ocean, Estuar. Coast. Shelf. S., 73, 563–570, https://doi.org/10.1016/j.ecss.2007.02.012, 2007. a
Borges, A. V., Darchambeau, F., Teodoru, C. R., Marwick, T. R., Tamooh, F., Geeraert, N., Omengo, F. O., Guérin, F., Lambert, T., Morana, C., Okuku, E., and Bouillon, S.: Globally significant greenhouse-gas emissions from African inland waters, Nat. Geosci., 8, 637–642, https://doi.org/10.1038/ngeo2486, 2015. a, b
Butman, D. and Raymond, P.: Significant efflux of carbon dioxide from streams and rivers in the United States., Nat. Geosci., 4, 13–24, https://doi.org/10.1038/ngeo1294, 2011. a, b
Cole, J. J., Prairie, Y. T., Caraco, N. F., McDowell, W. H., Tranvik, L. J., Striegl, R. G., Duarte, C. M., Kortelainen, P., Downing, J. A., Middelburg, J. J., and Melack, J.: Plumbing the global carbon cycle, Ecosystem., 10, 172–185, https://doi.org/10.1007/s10021-006-9013-8, 2007. a
Cook, S., Whelan, M. J., Evans, C. D., Gauci, V., Peacock, M., Garnett, M. H., Kho, L. K., Teh, Y. A., and Page, S. E.: Fluvial organic carbon fluxes from oil palm plantations on tropical peatland, Biogeosciences, 15, 7435–7450, https://doi.org/10.5194/bg-15-7435-2018, 2018. a
Dargie, G. C., Lewis, S. L., Lawson, I. T., Mitchard, E. T. A., Page, S. E., Bocko, Y. E., and Ifo, S. A.: Age, extent and carbon storage of the central Congo Basin peatland complex, Nature, 542, 86–90, https://doi.org/10.1038/nature21048, 2017. a
Fang, C. and Moncrieff, J.: A model for soil CO2 production and transport 1: Model development, Agr. Forest. Meterol., 95, 225–236, https://doi.org/10.1016/S0168-1923(99)00036-2, 1999. a
FAO-UN – Land and Water Division: Digital Soil Map of the World, Version 3.6., Food and Agriculture Organization of the United Nations (FAO) [data set], https://data.apps.fao.org/map/catalog/srv/eng/catalog.search?id=14116#/metadata/446ed430-8383-11db-b9b2-000d939bc5d8 (last access: 10 December 2018), 2007. a
Fenoll, L. G., Rodriǵuez-López, J. N., Graciá-Molina, F., Graciá-Cánovas, F., and Tudela, J.: Michaelis constants of mushroom tyrosinase with respect to oxygen in the presence of monophenols and diphenols, Int. J. Biochem. Cell B, 34, 332–336, https://doi.org/10.1016/S1357-2725(01)00133-9, 2002. a, b, c, d, e
Freeman, C., Ostle, N., and Kang, H.: An exzymic “latch” on a global carbon store, Nature, 409, 149, https://doi.org/10.1038/35051650, 2001. a
Gandois, L., Teisserenc, R., Cobb, A., Chieng, H., Lim, L., Kamariah, A., Hoyt, A., and Harvey, C.: Origin, composition, and transformation of dissolved organic matter in tropical peatlands, Geochim. Cosmochim. Ac., 137, 35–47, https://doi.org/10.1016/j.gca.2014.03.012, 2014. a
Gandois, L., Hoyt, A. M., Mounier, S., Le Roux, G., Harvey, C. F., Claustres, A., Nuriman, M., and Anshari, G.: From canals to the coast: dissolved organic matter and trace metal composition in rivers draining degraded tropical peatlands in Indonesia, Biogeosciences, 17, 1897–1909, https://doi.org/10.5194/bg-17-1897-2020, 2020. a
Gumbricht, T., Roman-Cuesta, R. M., Verchot, L., Herold, M., Wittmann, F., Householder, E., Herold, N., and Murdiyarso, D.: An expert system model for mapping tropical wetlands and peatlands reveals South America as the largest contributor, Glob. Change Biol., 23, 3581–3599, https://doi.org/10.1111/gcb.13689, 2017a. a, b
Gumbricht, T., Román-Cuesta, R. M., Verchot, L. V., Herold, M., Wittmann, F., Householder, E., Herold, N., and Murdiyarso, D.: Tropical and Subtropical Wetlands Distribution, Center for International Forestry Research (CIFOR) [data set], https://doi.org/10.17528/CIFOR/DATA.00058, 2017b. a
Hodgkins, S. B., Richardson, C. J., Dommain, R., Wang, H., Glaser, P. H., Verbeke, B., Winkler, B. R., Cobb, A. R., Rich, V. I., Missilmani, M., Flanagan, N., Ho, M., Hoyt, A. M., Harvey, C. F., Vining, S. R., Hough, M. A., Moore, T. R., Richard, P. J. H., De La Cruz, F. B., Toufaily, J., Hamdan, R., Cooper, W. T., and Chanton, J. P.: Tropical peatland carbon storage linked to global latitudinal trends in peat recalcitrance, Nat. Commun., 9, 3640, https://doi.org/10.1038/s41467-018-06050-2, 2018. a
Hooijer, A., Silvius, M., Wösten, H., and Page, S.: PEAT-CO2, Assessment of CO2 emissions from drained peatlands in SE Asia, http://inis.iaea.org/search/search.aspx?orig_q=RN:42022627 (last access: 18 October 2021), 2006. a
Hooijer, A., Page, S., Canadell, J. G., Silvius, M., Kwadijk, J., Wösten, H., and Jauhiainen, J.: Current and future CO2 emissions from drained peatlands in Southeast Asia, Biogeosciences, 7, 1505–1514, https://doi.org/10.5194/bg-7-1505-2010, 2010. a, b
Hoyt, A. M., Chaussard, E., Seppalainen, S. S., and Harvey, C. F.: Widespread subsidence and carbon emissions across Southeast Asian peatlands, Nat. Geosci., 13, 435–440, https://doi.org/10.1038/s41561-020-0575-4, 2020. a
Kang, H., Kwon, M. J., Kim, S., Lee, SeunghoonRogelj, J., Jones, T. G., Johncock, A. C., Haraguchi, A., and Freeman, C.: Biologically driven DOC release from peatlands during recovery from acidification, Nat. Commun., 9, 3807, https://doi.org/10.1038/s41467-018-06259-1, 2018. a, b
Keiluweit, M., Nico, P. S., Kleber, M., and Fendorf, S.: Are oxygen limitations under recognized regulators of organic carbon turnover in upland soils?, Biogeochemistry, 127, 157–171, https://doi.org/10.1007/s10533-015-0180-6, 2016. a
Kocabas, D. S., Bakir, U., Phillips, S. E. V., McPherson, M. J., and Ogel, Z. B.: Purification, characterization, and identification of a novel bifunctional catalase-phenol oxidase from Scytalidium thermophilum, Appl. Microbiol. Biot., 79, 407–415, https://doi.org/10.1007/s00253-008-1437-y, 2008. a
Lauerwald, R., Laruelle, G. G., Hartmann, J., Ciais, P., and Regnier, P. A. G.: Spatial patterns in CO2 evasion from global river network, Global Biogeochem. Cy., 29, 534–554, https://doi.org/10.1002/2014GB004941, 2015. a, b
Lauerwald, R., Regnier, P., Guenet, B., Friedlingstein, P., and Ciais, P.: How Simulations of the Land Carbon Sink Are Biased by Ignoring Fluvial Carbon Transfers: A Case Study for the Amazon Basin, One Earth, 3, 226–236, https://doi.org/10.1016/j.oneear.2020.07.009, 2020. a
Lehner, B., Verdin, K., and Jarvis, A.: New global hydrography derived from spaceborne elevation data, Eos, Transactions, 89, 93–94, https://www.hydrosheds.org (last access: 10 December 2018), 2008. a, b
Loucks, P. and Beek, E.: Water Quality Modeling and Prediction, Springer International Publishing, 417–467, https://doi.org/10.1007/978-3-319-44234-1_10, 2017. a
Martin, P., Cherukuru, N., Tan, A. S. Y., Sanwlani, N., Mujahid, A., and Müller, M.: Distribution and cycling of terrigenous dissolved organic carbon in peatland-draining rivers and coastal waters of Sarawak, Borneo, Biogeosciences, 15, 6847–6865, https://doi.org/10.5194/bg-15-6847-2018, 2018. a, b
Miettinen, J. and Liew, S. C.: Degradation and development of peatlands in Peninsular Malaysia and in the islands of Sumatra and Borneo since 1990, Land Degrad. Dev., 21, 285–296, https://doi.org/10.1002/ldr.976, 2010. a
Miettinen, J., Shi, C., and Liew, S. C.: Land cover distribution in the peatlands of Peninsular Malaysia, Sumatra and Borneo in 2015 with changes since 1990, Global Ecol. Conserv., 6, 67–78, https://doi.org/10.1016/j.gecco.2016.02.004, 2016. a
Miettinen, J., Hooijer, A., Vernimmen, R., Liew, S. C., and Page, S. E.: From carbon sink to carbon source: extensive peat oxidation in insular Southeast Asia since 1990, Environ. Res. Lett., 12, 024014, https://doi.org/10.1088/1748-9326/aa5b6f, 2017. a
MoA, Indonesia peat lands, Indonesia: Ministry of Agriculture [data set], accessed through Global Forest Watch, https://data.globalforestwatch.org/datasets/indonesia-peat-lands (last access: 10 December 2018), 2012. a, b
Moore, S., Evans, C. D., Tage, S. E., Garnett, M. H., Jones, T. G., Freeman, C., Hooijer, A., Wiltshire, A. J., Limin, S. H., and Gauci, V.: Deep instability of deforsted tropical peatlands revealed by fluival organic carbon fluxes, Nature, 493, 660–663, https://doi.org/10.1038/nature11818, 2013. a, b
Müller, D., Warneke, T., Rixen, T., Müller, M., Jamahari, S., Denis, N., Mujahid, A., and Notholt, J.: Lateral carbon fluxes and CO2 outgassing from a tropical peat-draining river, Biogeosciences, 12, 5967–5979, https://doi.org/10.5194/bg-12-5967-2015, 2015. a, b, c, d, e, f, g, h
Müller, D., Warneke, T., Rixen, T., Müller, M., Mujahid, A., Bange, H. W., and Notholt, J.: Fate of terrestrial organic carbon and associated CO2 and CO emissions from two Southeast Asian estuaries, Biogeosciences, 13, 691–705, https://doi.org/10.5194/bg-13-691-2016, 2016. a
Müller-Dum, D., Warneke, T., Rixen, T., Müller, M., Baum, A., Christodoulou, A., Oakes, J., Eyre, B. D., and Notholt, J.: Impact of peatlands on carbon dioxide (CO2) emissions from the Rajang River and Estuary, Malaysia, Biogeosciences, 16, 17–32, https://doi.org/10.5194/bg-16-17-2019, 2019. a, b, c, d
Nawata, E.: APHRO_MA_TAVE_V1808, Nepal – Department of Hydrology [data set], http://aphrodite.st.hirosaki-u.ac.jp/products.html (last access: 20 October 2021), 2018a. a, b, c
Nawata, E.: APHRO_MA_V1801R1, Nepal – Department of Hydrology and Meteorology [data set], http://aphrodite.st.hirosaki-u.ac.jp/products.html (last access: 20 October 2021), 2018b. a, b, c
Nichols, R. S. and Martin, P.: Low Biodegradability of Dissolved Organic Matter From Southeast Asian Peat-Draining Rivers, J. Geophys. Res.-Biogeo., 126, e2020JG006182, https://doi.org/10.1029/2020JG006182, 2021. a, b, c
Page, S. E., Rieley, J. O., and Banks, C. J.: Global and regional importance of the tropical peatland carbon pool, Glob. Change Biol., 17, 798–818, https://doi.org/10.1111/j.1365-2486.2010.02279.x, 2011. a, b
Pereira, M., Amaro, A., Pintado, M., and Poças, M.: Modeling the effect of oxygen pressure and temperature on respiration rate of ready-to-eat rocket leaves. A probabilistic study of the Michaelis-Menten model, Postharvest Biol. Tec., 131, 1–9, https://doi.org/10.1016/j.postharvbio.2017.04.006, 2017. a, b
Pind, A., Freeman, C., and Lock, M. A.: Enzymic degradation phenolic materials in peatlands, Plant. Soil., 159, 227–231, https://doi.org/10.1007/BF00009285, 1994. a, b, c, d
Raymond, P. A., Zappa, C. J., Butman, D., Bott, T. L., Potter, J., Mulholland, P., Laursen, A. E., McDowell, W. H., and Newbold, D.: Scaling the gas transfer velocity and hydraulic geometry in streams and small rivers, Limnol. Oceanogr., 2, 41–53, https://doi.org/10.1215/21573689-1597669, 2012. a
Raymond, P. A., Hartmann, J., Sobek, S., Hoover, M., McDonald, C., Butman, D., Striegel, R., Mayorga, E., Humborg, C., Kortelainen, P., Dürr, H., Meybeck, M., Ciais, P., and Guth, P.: Global carbon dioxide emissions from inland waters, Nature, 503, 355–359, https://doi.org/10.1038/nature12760, 2013. a, b, c
Regnier, P., Friedlingstein, P., Ciais, P., Mackenzie, F. T., Gruber, N., Janssens, I. A., Laruelle, G. G., Lauerwald, R., Luyssaert, S., Andersson, A. J., Arndt, S., Arnosti, C., Borges, A. V., Dale, A. W., Gallego-Sala, A., Goddéris, Y., Goossens, N., Hartmann, J., Heinze, C., Ilyina, T., Joos, F., LaRowe, D. E., Leifeld, J., Meysman, F. J. R., Munhoven, G., Raymond, P. A., Spahni, R., Suntharalingam, P., and Thullner, M.: Anthropogenic perturbation of the carbon fluxes from land to ocean, Nat. Geosci., 6, 597–607, https://doi.org/10.1038/ngeo1830, 2013. a, b
Rixen, T., Baum, A., Pohlmann, T., Blazer, W., Samiaji, J., and Jose, C.: The Siak, a tropical black water river in central Sumatra on the verge of anoxia, Biogeochemistry, 90, 129–140, https://doi.org/10.1007/s10533-008-9239-y, 2008. a, b, c, d, e, f
Rixen, T., Baum, A., Sepryani, H., Pohlmann, T., Jose, C., and Samiaji, J.: Dissolved oxygen and its response to eutrophication in a tropical black water river, J. Environ. Manage., 91, 1730–1737, https://doi.org/10.1016/j.jenvman.2010.03.009, 2010. a
Rixen, T., Baum, A., Wit, F., and Samiaji, J.: Carbon leaching from tropical peat soils and consequences for carbon balances, Front. Earth. Sci., 4, 74, https://doi.org/10.3389/feart.2016.00074, 2016. a, b
Sinsabaugh, R.: Phenol oxidase, peroxidase and organic matter dynamics of soil, Soil. Biol. Biochem., 42, 391–404, https://doi.org/10.1016/j.soilbio.2009.10.014, 2010. a, b, c
Sinsabaugh, R. L., Lauber, C. L., Weintraub, M. N., Ahmed, B., Allison, S. D., Crenshaw, C., Contosta, A. R., Cusack, D., Frey, S., Gallo, M. E., Gartner, T. B., Hobbie, S. E., Holland, K., Keeler, B. L., Powers, J. S., Stursova, M., Takacs-Vesbach, C., Waldrop, M. P., Wallenstein, M. D., Zak, D. R., and Zeglin, L. H.: Stoichiometry of soil enzyme activity at global scale, Ecol. Lett., 11, 1252–1264, https://doi.org/10.1111/j.1461-0248.2008.01245.x, 2008. a, b, c, d, e
Vaquer-Sunyer, R. and Duarte, C. M.: Thresholds of hypoxia for marine biodiversity, P. Natl. Acad. Sci. USA, 105, 15452–15457, https://doi.org/10.1073/pnas.0803833105, 2008. a, b
Wanninkhof, R.: Relationship between wind speed and gas exchange over the ocean, J. Geophys. Res.-Oceans., 97, 7373–7382, https://doi.org/10.1029/92JC00188, 1992. a, b, c
Weiss, R.: The solubility of nitrogen, oxygen and argon in water and seawater, Deep Sea Res., 17, 721–735, https://doi.org/10.1016/0011-7471(70)90037-9, 1970. a, b
Weiss, R. F.: Carbon dioxide in water and seawater: The solubility of a non-ideal gas, Mar. Chem., 2, 203–215, https://doi.org/10.1016/0304-4203(74)90015-2, 1974. a, b
Wetlands International, Malaysia peat lands, Wetlands International [data set], https://data.globalforestwatch.org/datasets/gfw::malaysia-peat-lands, (last access: 10 December 2018), 2004. a, b
Williams, C. J., Shingara, E. A., and Yavitt, J. B.: Phenol oxidase activity in peatlands in new york state: Response to summer drought and peat type, Wetlands, 20, 416–421, https://doi.org/10.1672/0277-5212(2000)020[0416:POAIPI]2.0.CO;2, 2000. a, b, c
Wit, F., Müller, D., Baum, A., Warneke, T., Pranowo, W. S., and Müller, M.: The impact of disturbed peatlands on river outgassing in Southeast Asia, Nat. Commun., 6, 10155, https://doi.org/10.1038/ncomms10155, 2015. a, b, c, d, e, f, g, h, i, j, k
Wit, F., Rixen, T., Baum, A., Pranowo, W. S., and Hutahaean, A. A.: The Invisible Carbon Footprint as a hidden impact of peatland degradation inducing marine carbonate dissolution in Sumatra, Indonesia, Sci. Rep.-UK, 8, 2045–2322, https://doi.org/10.1038/s41598-018-35769-7, 2018. a
Yasutomi, N., Hamada A., and Yatagai A.: Development of a long-term daily gridded temperature dataset and its application to rain/snow descrimination of daily precipitation, Global Environmental Research, 15, 165–172, https://www.chikyu.ac.jp/precip/old/data/Yasutomi2011GER.pdf (last access: 1 June 2022), 2011. a, b, c
Yatagai, A., Maeda, M., Khadgarai, S., Masuda, M., and Xie, P.: End of the Day (EOD) Judgment for Daily Rain-Gauge Data, Atmosphere-Basel, https://doi.org/10.3390/atmos11080772., 2020. a, b, c, d
Yule, C. M., Lim, Y. Y., and Lim, T. Y.: Recycling of phenolic compounds in Borneo’s tropical peat swamp forests, Carbon Balance and Management, 13, 3, https://doi.org/10.1186/s13021-018-0092-6, 2018. a
Zappa, C. J., McGillis, W. R., Raymond, P. A., Edson, J. B., Hintsa, E. J., Zemmelink, H. J., Dacey, J. W. H., and Ho, D. T.: Environmental turbulent mixing controls on air-water gas exchange in marine aquatic systems, Geophys. Res. Lett., 34, 10, https://doi.org/10.1029/2006GL028790, 2007. a, b
Zhou, Y., Evans, C., Chen, Y., Chang, K., and Martin, P.: Extensive remineralization of peatland-derived dissolved organic carbon and acidification in the Sunda Shelf Sea, Southeast Asia, Earth and Space Science Open Archive, p. 67, https://doi.org/10.1002/essoar.10506636.1, 2021. a
- Abstract
- Introduction
- Materials and methods
- Results
- Discussion
- Conclusions
- Appendix A
- Appendix B: Impact of data limitation on study results
- Appendix C: Comparison of different peat coverage estimates
- Appendix D: Quality assessment of least-squares optimizations
- Code and data availability
- Author contributions
- Competing interests
- Disclaimer
- Acknowledgements
- Financial support
- Review statement
- References
- Supplement