the Creative Commons Attribution 4.0 License.
the Creative Commons Attribution 4.0 License.
 | 26 Apr 2021
The role of termite CH4 emissions on the ecosystem scale: a case study in the Amazon rainforest
Hella van Asperen
João Rafael Alves-Oliveira
Thorsten Warneke
Bruce Forsberg
Alessandro Carioca de Araújo
Justus Notholt
The magnitude of termite methane (CH4) emissions is still an uncertain part of the global CH4 budget and current emission estimates are based on limited field studies. We present in situ CH4 emission measurements of termite mounds and termite mound subsamples performed in the Amazon rainforest. Emissions from five termite mounds of the species Neocapritermes brasiliensis were measured by use of a large flux chamber connected to a portable gas analyser measuring CH4 and CO2. In addition, the emissions of mound subsamples were measured, after which the termites were counted so that a termite CH4 and CO2 emission factor could be determined.
Mound emissions were found to range between 17.0 and 34.8 nmol mound−1 s−1 for CH4 and between 1.1 and 13.0 µmol mound−1 s−1 for CO2. A termite emission factor of 0.35 µmol CH4 g h−1 was found, which is almost twice as high as the only other reported value for the Amazon. By combining mound emission measurements with the termite emission factor, colony sizes could be estimated, which were found to range between 55–125 thousand individuals. Estimates were similar to literature values, and we therefore propose that this method can be used as a quick non-intrusive method to estimate termite colony size in the field.
The role of termites in the ecosystem's CH4 budget was evaluated by use of two approaches. Termite mound emission values were combined with local mound density numbers, leading to an estimate of 0.15–0.71 nmol CH4 m−2 s−1, on average, emitted by termite mounds. In addition, the termite CH4 emission factor from this study was combined with termite biomass numbers, resulting in an estimate of termite-emitted CH4 of ∼1.0 nmol m−2 s−1. Considering the relatively low net CH4 emissions previously measured at this ecosystem, we expect that termites play an important role in the CH4 budget of this terra firme ecosystem.


Methane (CH4) is one of the most important greenhouse gases, but its natural sources are still not well understood. Anaerobic decomposition processes in wetlands are expected to represent the largest natural CH4 source, but estimates remain a large source of uncertainty (Kirschke et al., 2013; Saunois et al., 2020). Recently, alternative CH4 production mechanisms and their possible important role on the ecosystem scale have been proposed, such as CH4 production by living vegetation (Bruhn et al., 2012; Wang et al., 2014), CH4 emission due to photo and thermal degradation (Lee et al., 2012), or the transport of anaerobic soil-produced CH4 through wetland trees (Pangala et al., 2015; Rice et al., 2010). An additional known CH4 source in tropical ecosystems is emission by termites.
Termites (Isoptera) can mostly be found between 45∘ N and 45∘ S and are especially abundant in warm ecosystems (Bignell, 2006; Brian and Brian, 1978; Gomati et al., 2011; Wood, 1988). They are highly socialised insects, living in large communities of up to several million individuals (Wood, 1988). Termites are considered “ecosystem engineers”: they are known for decomposing organic substances and moving and mixing organic and mineral materials, thereby enhancing humus formation, modifying soil structure, and improving soil fertility (Bignell, 2006; Brian and Brian, 1978; Bignell and Eggleton, 2000; Mishra and Sen-Sarma, 1980; De Bruyn and Conacher, 1990; Wood, 1988). In addition, they are able to modify their environment to their needs: most termite species live in complex above- or (partly) below-ground nests where temperature and moisture remain stable (Bignell, 2019; Noirot and Darlington, 2000; Wood, 1988). Recently, it was shown that termites increase their activity during droughts, resulting in, among other things, enhanced litter decomposition, elevated soil moisture, and higher seedling survival rates, thereby demonstrating a mitigating effect during droughts in tropical rainforests (Ashton et al., 2019).
Three main groups of termites can be distinguished based on their main feeding habits: soil-feeding (humiverous) termites, which can mainly be found in and on the soil, decomposing decayed organic soil material; xylophagous termites, which feed on (decomposed) wood and can also be found in living trees; and fungus-feeding termites, which live in a symbiotic relationship with fungus (Eggleton, 2000; Sanderson, 1996).
CH4 production by termites was first described and measured by Cook (1932). Follow-up studies found that methane is produced by almost all termite species and that its production takes place in the termite gut. In higher termites (dominant in tropical forests; more evolved species with respect to diet and community complexity) CH4 production is caused by symbiotic bacteria, and in lower termites the production is caused by flagellate protozoa (Bignell et al., 1997; Brune, 2018; Lee and Wood, 1971). In a laboratory experiment Zimmerman et al. (1982) measured the emission strength of individual termites and, by use of termite biomass numbers, presented a global termite emission estimate of 150 Tg CH4 yr−1, which was estimated to be 40 % of the global natural CH4 emissions. Different estimates followed, resulting in lower values, such as by Seiler et al. (1984) of 2–5 Tg yr−1, by Fraser et al. (1986) of 14 Tg yr−1, by Khalil et al. (1990) of 12 Tg yr−1, and by Martius et al. (1993) of 26 Tg yr−1. More recent literature uses estimates in the range of 2–15 Tg CH4 yr−1 (Ciais et al., 2014; Kirschke et al., 2013; Sanderson, 1996; Saunois et al., 2020), which is approximately 0.5 %–4 % of the total estimated natural source of CH4 emissions (Saunois et al., 2020). While global-scale termite emissions can be considered small in comparison to natural sources like wetland emissions (∼147 Tg yr−1) or fresh water emissions (∼159 Tg yr−1) (Saunois et al., 2020), the question of what their role can be in the CH4 budget of a local tropical ecosystem remains.
Estimates of global termite CH4 emissions are based on field and laboratory measurements. To estimate global CH4 termite emissions, most commonly the CH4 emission per termite (mg CH4 termite−1 h−1) or termite mass (mg CH4 g h−1) is measured, whereby termite mass can either be measured directly or be taken from literature (Sanderson, 1996). The disadvantage of this approach is that termites are removed from their natural environment, thereby possibly changing their emission and behaviour. Another approach is to measure termite nest CH4 emissions in situ in the field. In this case, emissions are expressed per mound or nest (mg CH4 mound−1 h−1). While this method does not disturb the natural environment, correct estimation of termite nest colony size is challenging; therefore, values are hard to convert to emission-per-termite values (Jones et al., 2005).
Besides CH4, termite emissions of other gases have also been investigated, such as for CO2, O2, CO, H2, CHCI3, N2O, and different hydrocarbons (Cook, 1932; Khalil et al., 1990; Zimmerman et al., 1982). In previous studies, measurements of termite CO2 emissions were often performed alongside CH4 emission measurements and generally a clear relationship between CH4 and CO2 emissions was found, of which the ratio is expected to be species dependent (Seiler et al., 1984; Jamali et al., 2013). For termite-emitted CO2, reported global estimates are 50 Pg yr−1 (Zimmerman et al., 1982), 4 Pg yr−1 (Khalil et al., 1990), and 3.5 Pg yr−1 (Sanderson, 1996) (1 Pg = 1000 Tg). In addition, Khalil et al. (1990) observed mound CO uptake and emissions but reported them to be irregular and small. Strong termite mound N2O emissions have also been detected (Brümmer et al., 2009b; Brauman et al., 2015), although they were also found to be very irregular or undetectable (Khalil et al., 1990; Zimmerman et al., 1982). Brauman et al. (2015) suggested that termite mound N2O emissions occur if nitrogen-rich organic matter is available.
Current global termite CH4 emission estimates are based on relatively few studies, and there is still a lack of data on termite CH4 emission rates (Brune, 2018). In addition, existing studies have mostly focused on Australian or Asian species (Eggleton et al., 1999; Fraser et al., 1986; Jamali et al., 2011a, b, 2013; Khalil et al., 1990; Macdonald et al., 1998; Sugimoto et al., 1998a, b) or African species (Brauman et al., 1992; Brümmer et al., 2009a; Macdonald et al., 1998; Rouland et al., 1993; Sawadogo et al., 2011, 2012; Seiler et al., 1984). To our knowledge, only two studies focused on CH4 emission of termites in the Amazon (Martius et al., 1993; Queiroz, 2004) and only one study reported CH4 emission values for Amazonian termites (Martius et al., 1993). Martius et al. (1993) performed field measurements on wood-feeding termites by semi-field and laboratory measurements, and suggested that Amazonian termites release more methane than species in other regions. In addition, for the Amazon, it is expected that most termites are soil feeding (Jones and Eggleton, 2010), a group which are expected to be the strongest emitters of CH4 (Bignell and Eggleton, 2000; Brauman et al., 1992).
In this paper, we present a case study performed in a tropical rainforest in the Amazon, where we measured the emission of CH4 and other gases of epigeal (above-ground) termite nests of the species Neocapritermes brasiliensis, a soil-feeding species1 abundant in the Amazon (Constantino, 1992; Pequeno et al., 2013) and one of the most common species in the region (Dambros et al., 2016). In addition we measured the CH4 emission of countable groups of termites. The goal of our research was twofold. Firstly, we provide the first CH4 and other gas emission measurements of the species N. brasiliensis, thereby expanding the limited literature on CH4 emissions from Amazonian termites. Secondly, we aim to quantify the role of termite emissions in the CH4 budget of this specific ecosystem as part of a larger ecosystem CH4 budget study (in preparation). In addition, we are presenting a possible quick, non-intrusive field method to estimate termite colony size in situ.
2.1 Study site
The study was conducted at the experimental field site Reserva Biológica do Cuieiras–ZF2 (2∘36′32.67′′ S, 60∘12′33.48′′ W, 40–110 m above sea level (a.s.l.)), which is managed by the Instituto Nacional de Pesquisas da Amazônia (INPA) and located ∼ 50 km northwest of Manaus (Brazil). Field site ZF2 consists of plateaus and valleys with typical terra firme forest with tree heights of 35–40 m on the plateaus and 20–35 m in the valleys. Soils on the plateau are clayey and can be classified as Oxisols and Ultisols. Soils in the valleys contain more sand and can be classified as Spodosols (Luizão et al., 2004; Zanchi et al., 2014). The field site has a strong seasonality, with a wet season from December to April and a dry season from June to September. Annual average temperatures range between 26–28∘ C and annual average precipitation is around 2400 mm. More information about the field site can be found in Araújo et al. (2002), Chambers et al. (2004), Luizão et al. (2004), Quesada et al. (2010), and Zanchi et al. (2014). Measurements took place at the end of the wet season (March 2020).
2.2 Selection of termite mounds
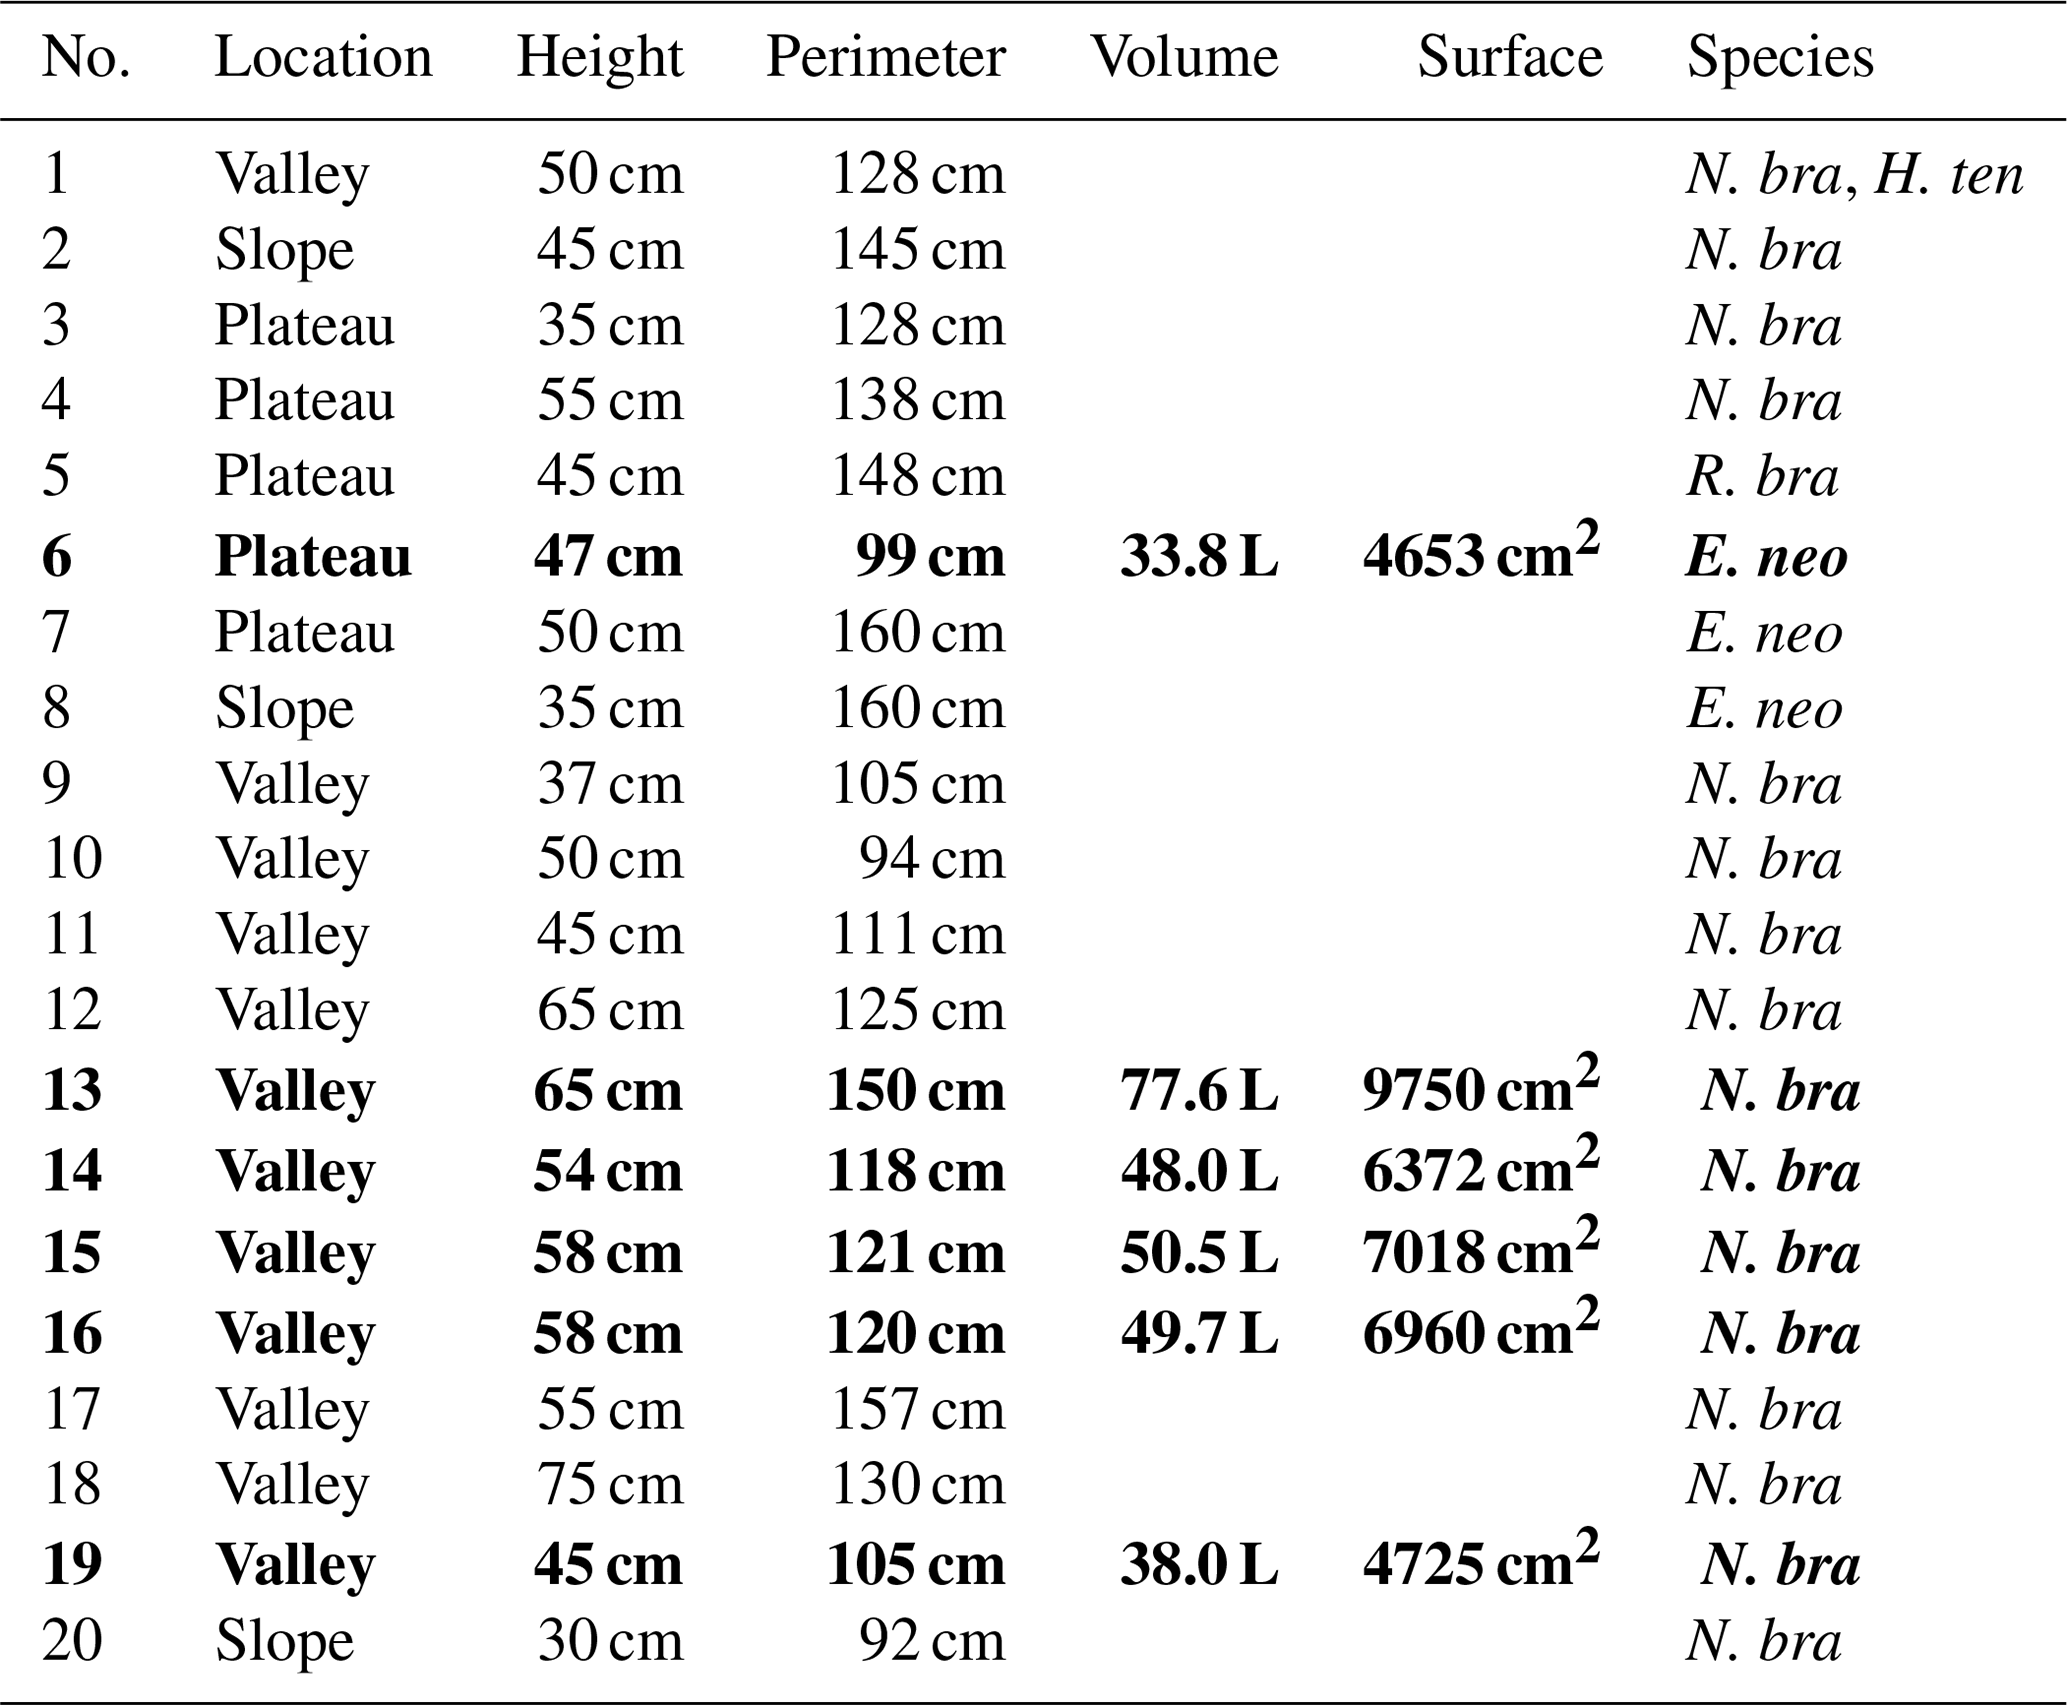
In the study area, two main trails exist following the topography from valley to plateau, and termite nests in the vicinity of these trails were inventoried. For practical reasons, only free-standing epigeal (above-ground) nests were considered (hereafter called mounds). Twenty termite mounds were selected for further research and for each mound the termite species was determined. For flux chamber measurements, five mounds with the same termite species were selected (nos. 13, 14, 15, 16, and 19); for practical reasons, chosen mounds were in close proximity to each other and all located in the valley. As an exploratory measurement, an additional mound of a different species was selected on the plateau (no. 6). For each mound, height and perimeter were measured. Termite mound volumes were estimated by use of the following formula, as also used in Ribeiro (1997) and in Pequeno et al. (2013):
where V is the mound volume (cm3), H is the height (cm), W is the width (cm), and T is the thickness (cm) of the mound. The termite mound surface was estimated by mathematically considering the lower part of the mound as a column and the upper part as half a sphere. Details of each mound (dimensions, species, location) are given in Table 1.
Table 1Termite mounds: location, dimensions, and observed species. Volume is the estimated mound volume as calculated by Eq. (1) and surface is the estimated mound surface by mathematically considering the lower part of the mound as a column and the upper part as half a sphere. In mound 1, two different termite species were found. N. bra stands for Neocapritermes brasiliensis, H. ten for Heterotermes tenuis, R. bra for Rotunditermes bracantinus, and E. neo for Enbiratermes neotenicus. The five mounds indicated in bold (mound nos. 13, 14, 15, 16, and 19) were the mounds selected for flux measurements.
2.3 Mound flux chamber setup
Collars (stainless steel, 15 cm height, 56.5 cm diameter) were placed around the five selected termite mounds a week before the start of the measurements. Collars were inserted approximately 5 cm into the soil and litter layer. A flux chamber was created by use of a 220 L slightly cone-shaped polyethylene bucket, with a diameter of 57.5 cm. A strip of closed-pore foam (1 cm × 1 cm × 57.5 cm) was attached over the whole inner perimeter so that if the bucket was placed on the collar, the foam strip would seal the part between the bucket and the collar. Two one-touch fittings ( in., SMC Pneumatics) were installed on each side of the bucket. On the inside of the bucket, a four-inlet vertical sampling tube was placed so that air was sampled from different heights (∼ 10, ∼ 25, ∼ 35, and ∼ 50 cm) in the headspace (Clough et al., 2020). The setup (chamber and tubing) was tested for internal emissions of all measured gases. For CO (see Appendix), an internal emission of <0.014 nmol s−1 was found; the presented CO fluxes are not corrected for this possible internal emission.
CH4 and CO2 concentrations were measured with a Los Gatos Ultraportable Greenhouse Gas Analyser. The instrument was connected in a closed loop with the flux chamber (2×2 m PTFE tubing, in.). For air circulation, the internal pump of the Los Gatos instrument was used with a flow of ∼ 0.35 L min−1. The instrument measures concentrations every second; 10 s averaged concentrations were saved and used for flux calculations. For each measurement, the flux chamber was closed for 20 min, during which time concentrations were measured continuously. All five mounds were always measured on the same day and in the same order. Over one week, each mound was measured three times, each time at approximately the same hour of the day.
2.4 Flux calculations
Fluxes were calculated as follows. By use of the ideal gas law, mole fractions (mol mol−1) were converted to concentrations (mol m−3). For chamber temperature, a standard temperature of 25 ∘C was assumed. For chamber volume (CV), the termite mound volume (Table 1) was deducted from the bucket volume (220 L).
Fluxes could be calculated as follows:
where F is the mound emission (mol s−1), is the concentration change (mol m−3 s−1), and CV the corrected chamber volume (m3). Linear regression was used to derive the concentration change and the given error bars are the propagated standard error of the linear regression slope. Concentration increases were calculated over the last 10 min of the chamber closure to avoid possible effects of the bag filling (see Appendix). If clear headspace concentration fluctuations were observed in the beginning of this time window, possibly by a remaining effect of the bag filling, the window was shortened by a maximum of 2 min (leaving a time window of 8 min). All calculated increases showed an R2>0.95. Unless mentioned otherwise, the given mound CO2 emissions are corrected for the estimated contribution of soil respiration by subtracting the average valley soil emission (see Sect. 2.5). For mound no. 6, the average plateau soil emission was subtracted.
2.5 Valley and mound-adjacent soil fluxes
To quantify the CH4 and CO2 emissions of the soils adjacent to the termite mounds, four soil collars were installed around each mound: two soil collars were placed at 20 and 45 cm distance from the mound (distance between mound collar and middle of soil collar) and two additional soil collars were placed on the opposite side of the mound at the same distances. The soil collars were of 20 cm diameter with a height of 10 cm and were inserted 5 cm into the soil. The flux chamber height was 15 cm so that the soil chamber volume was 4.7 L. To be able to connect the Los Gatos instrument, the soil chamber had two one-touch fittings on top. The chamber and collars were created from a common PVC sewage pipe. Every mound-adjacent soil flux measurement was 4 min, and the set of 4 collar measurements was performed once per mound, with the exception of mound no. 19. For mound nos. 13 and 14, the measurements were performed on the second measurement day, for mound nos. 15 and 16, the measurements were done on the third measurement day. Mound-adjacent soil fluxes will be expressed per mound-collar area (0.25 m2) to be better comparable to mound emissions. The same chamber setup was also used in a substudy at a nearby transect (∼ 500 m from termite mounds) where, among other things, valley soil (10 collars) and plateau soil (10 collars) fluxes were measured (three repetitions). Measured soil fluxes from the valley will be shown for comparison.
2.6 Termite mound subsample emission measurements
After each last mound flux measurement, a mound sample was taken of approximately 1 L volume. From this, three small subsamples were taken (volume not determined). When selecting a piece, we tried to look for solid not crumbling pieces, so that the inside of the subsample was undisturbed. From the sample from mound no. 19, only one suitable subsample was found. Each subsample was placed in a small closed box (12.6 cm × 19.2 cm × 6.8 cm) with two one-touch fittings, functioning as a small closed flux chamber. A blank measurement was made with the small box and no internal emissions were found. Each mound subsample was measured with the Los Gatos instrument for 5 min, to determine the CH4 and CO2 production in the chamber over time. After each measurement, the mound sample was carefully broken open and termites were counted, so that the CH4 and CO2 emission per termite (the termite emission factor) could be calculated. The measurements took place next to the mound and time between sampling and measuring was always less than 15 min. To verify whether the termite emission factor was stable between seasons and mounds, additional measurements were performed. In October 2020 (dry season), the same type of measurements were performed on 15 subsamples of the same termite mounds, and in December 2020 (transition dry–wet season), measurements were performed on five subsamples of a different mound of the same species.
2.7 Termite mass measurement
Termite mass was measured in the Laboratory of Systematics and Ecology of Soil Invertebrates at INPA. A total of 480 living workers of the species N. brasiliensis were weighed in five subgroups (, ) by use of a precision scale (FA2104N). Reported individual termite mass is fresh weight per termite (mg termite−1).
3.1 Mound CH4 and CO2 emissions
Headspace concentrations increased strongly during chamber closure, and chamber concentrations climbed up to 5750 nmol CH4 mol−1 and up to 1950 µmol CO2 mol−1. CH4 emissions of mounds nos. 13–19 ranged between 17.0 and 34.8 nmol mound−1 s−1 (Fig. 1), with an average emission of 25.2 nmol mound−1 s−1. Additional valley measurements showed heterogeneous soil CH4 fluxes with small uptake and emission taking place alongside, ranging between −0.1 and 2.9 nmol m−2 s−1 (med = −0.02, avg = 0.15, SD = 0.54). Mound-adjacent soil CH4 fluxes, measured at 20 and 45 cm from the mound, ranged between 0.4 and 8.9 nmol CH4 m−2 s−1 (avg = 2.14, SD = 2.00) and were, on average, enhanced in comparison to valley soils (Fig. 2). Soil valley CO2 fluxes were found to range between 0.9 and 3.7 µmol m−2 s−1 (avg = 2.14, SD = 0.74) (Fig. 2) and the average plateau soil CO2 emission was 4.03 µmol m−2 s−1 (SD = 1.36). Mound-adjacent soil CO2 fluxes showed an average emission of 4.81 µmol CO2 m−2 s−1 (range = 2.0–10.1, SD = 2.04), thereby being enhanced with respect to the surrounding valley soils (Fig. 2). Mound CO2 emissions, corrected for the average valley and plateau soil respiration, ranged between 1.1 and 13.0 µmol mound−1 s−1, with an average emission of 8.14 µmol mound−1 s−1 (average of mounds nos. 13–19).
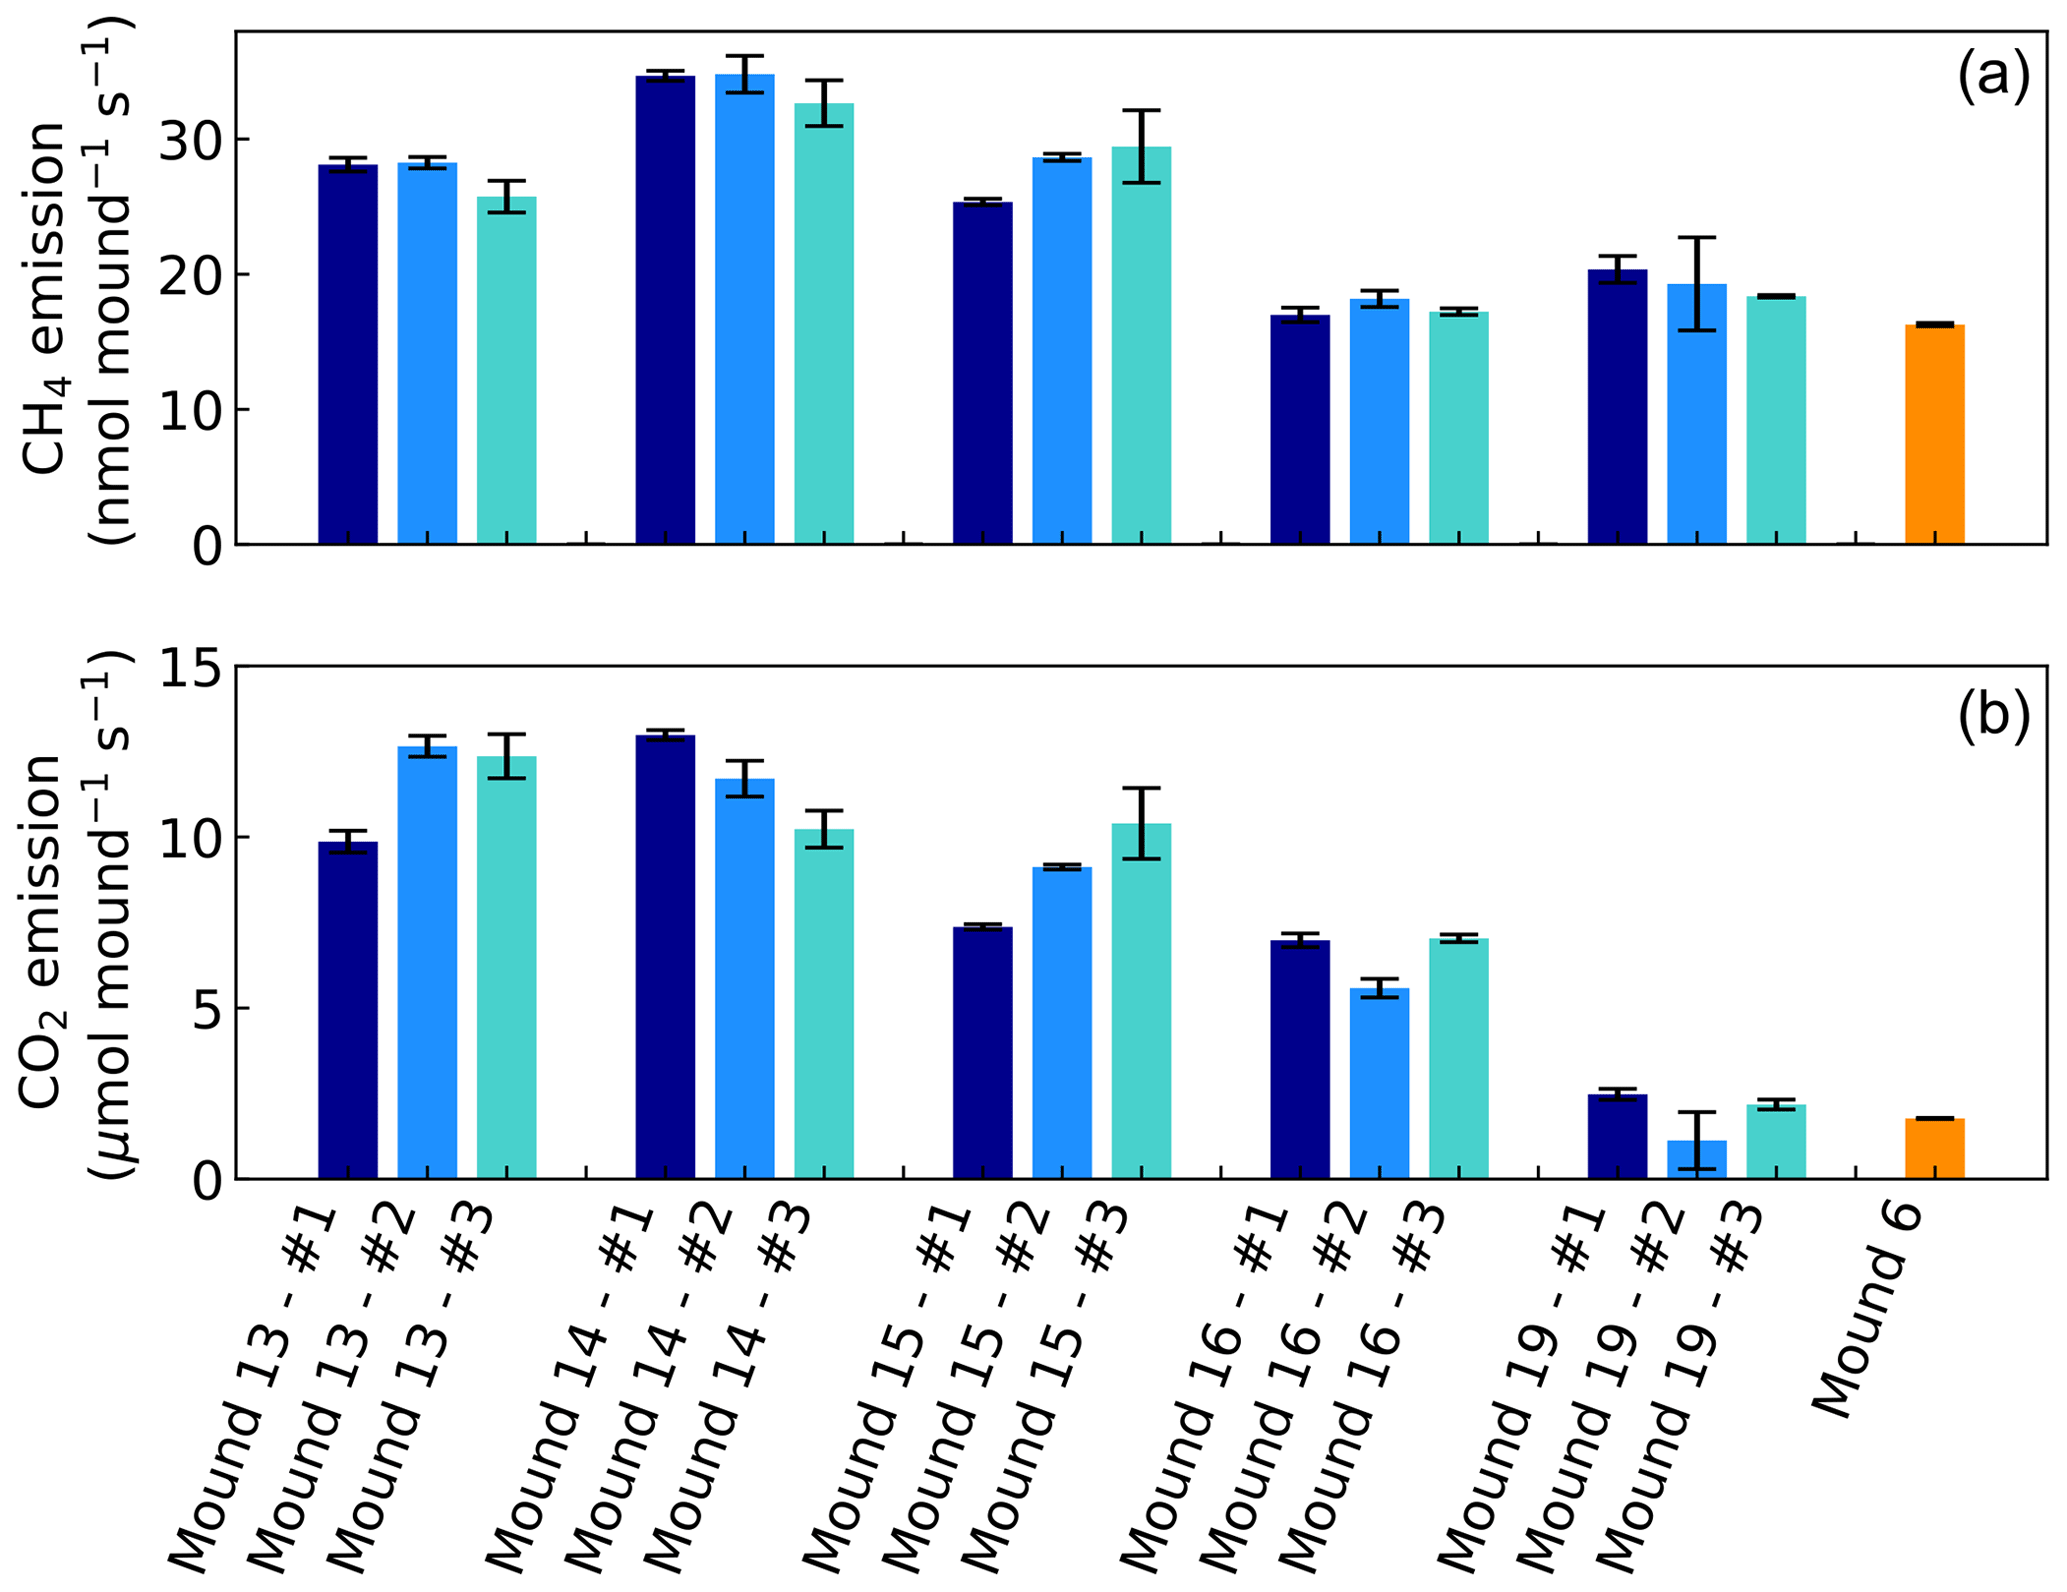
Figure 1CH4 and CO2 emissions of mounds nos. 13–19 (in valley) and of mound no. 6 (on plateau) expressed in nmol and µmol mound−1 s−1, which represents a collar area of 0.25 m2. All mounds (except mound no. 6) were measured three times during one week and each series no. (#) was measured on the same day and in the same order. Error bars are propagated standard errors of the linear regression slope, as described in Sect. 2.4.
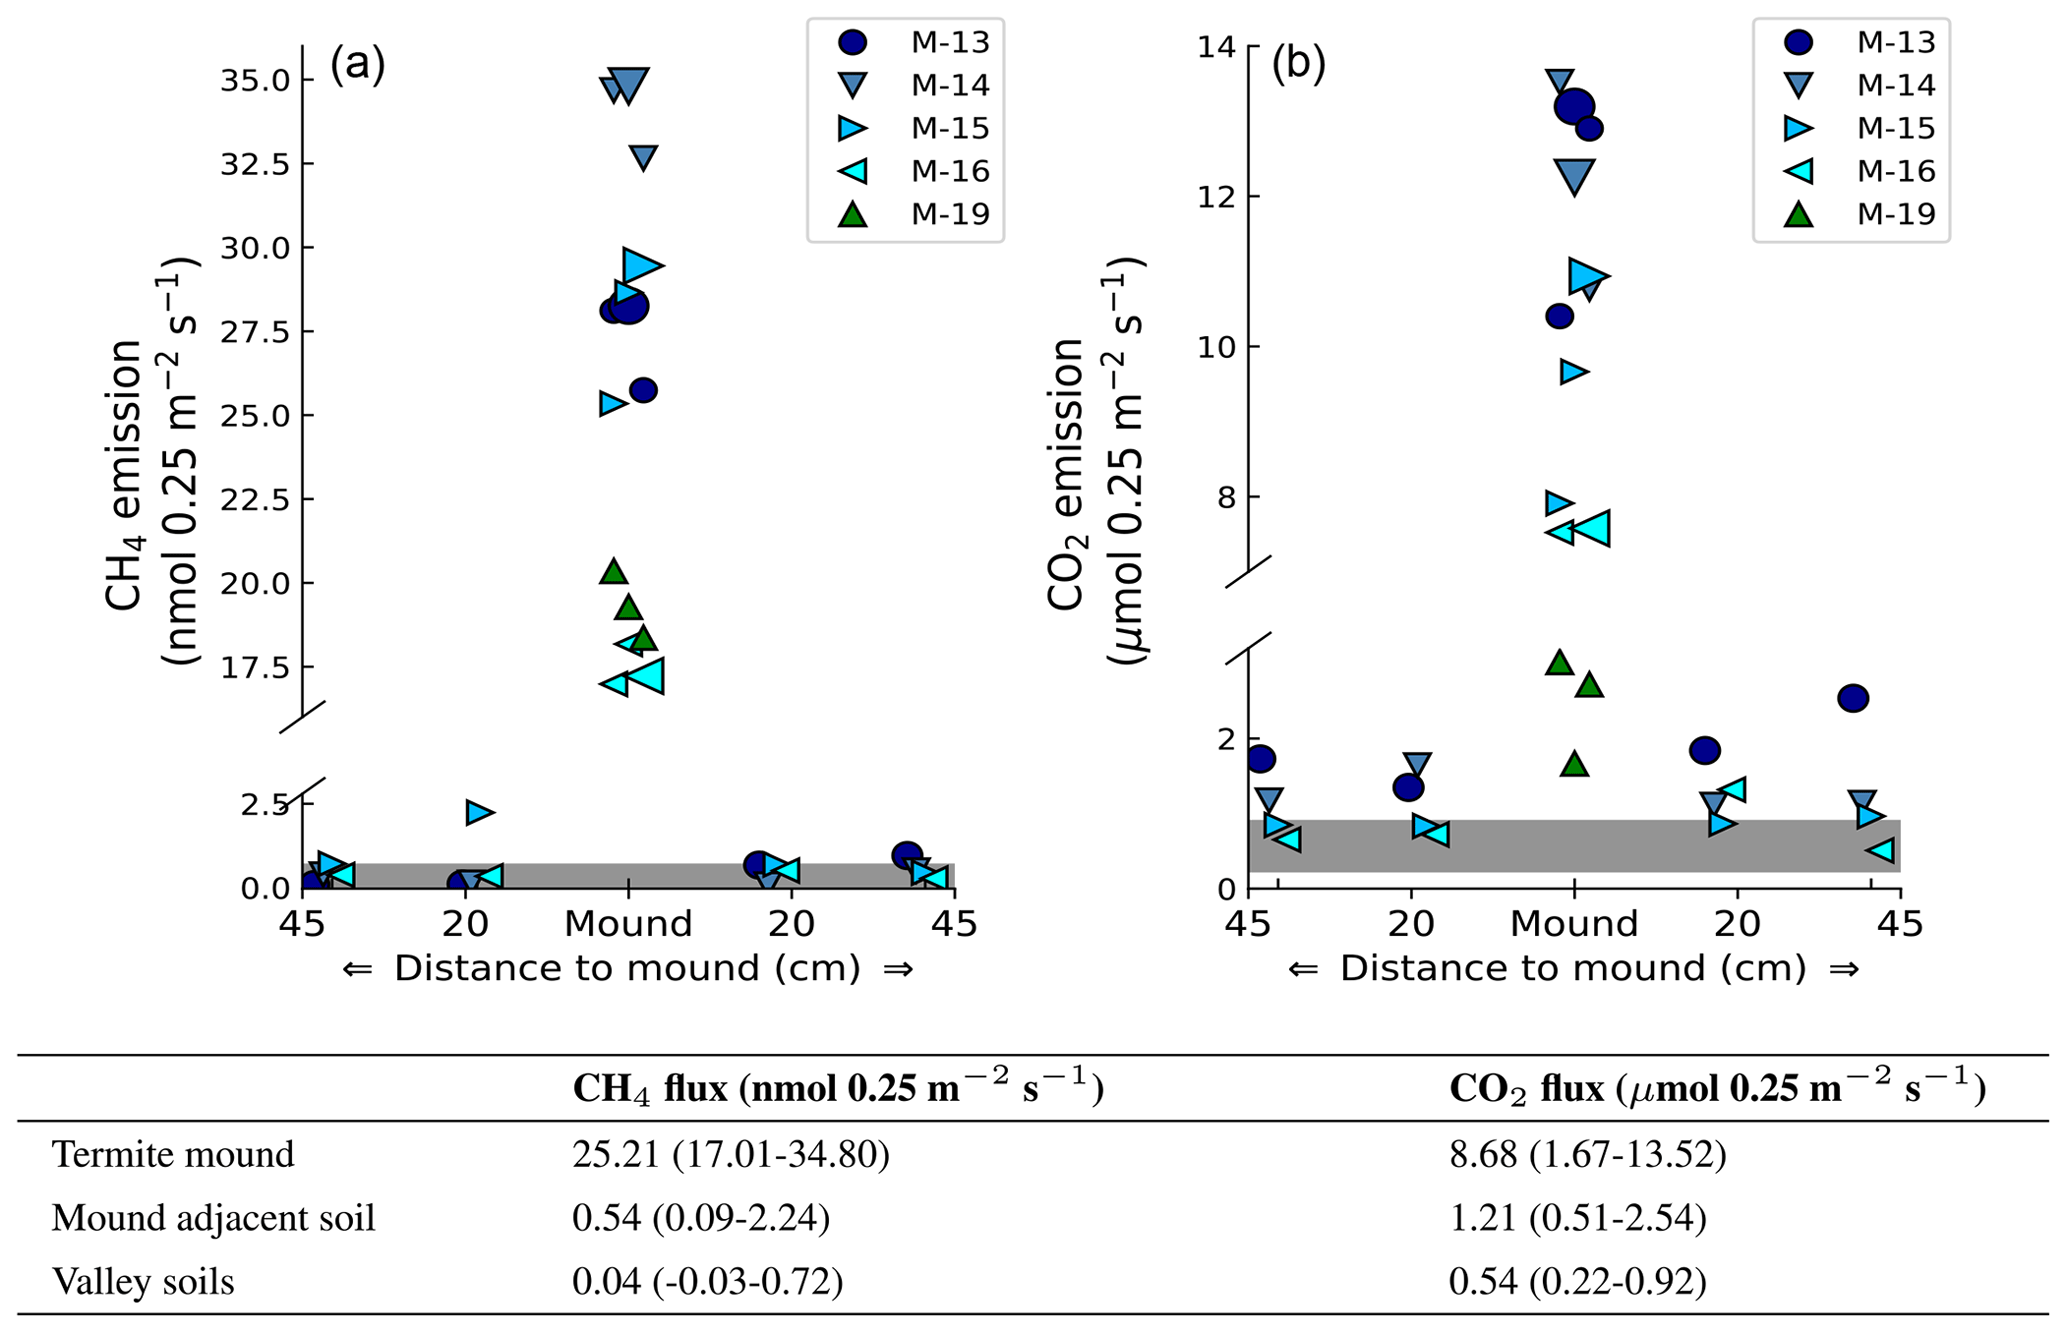
Figure 2Measured mound emissions and mound-adjacent soil fluxes for CH4 (a) and CO2 (b) for mound nos. 13, 14, 15, and 16 expressed in nmol 0.25 m−2 s−1 for CH4 and µmol 0.25 m−2 s−1 for CO2 (collar area is 0.25 m2). Note that for CO2 the total mound emissions per collar area not corrected for soil respiration are shown and stated. The centrally placed markers are the measured mound emissions (also for mound no. 19); the larger marker indicates the day-specific mound emission when mound-adjacent soil fluxes were measured. The grey bar indicates the range of additionally measured soil valley fluxes. The range and average flux for each group of measurements are given in the table. On average, measured mound CH4 and CO2 fluxes were a factor of 630 and 16 higher in comparison to the surrounding soil valley fluxes.
During chamber closure, the concentration changes in CH4 and CO2 were strongly correlated (R2>0.95 for each chamber closure). The ratio between the mound CH4 and CO2 emission () ranged between 2.1 and (Fig. 3) and showed a constant ratio when data from mound no. 19 (furthest away from other mounds) and mound no. 6 (different species) were excluded (average ratio: , SD = 0.4). The smallest mound (no. 19) clearly showed smaller-than-average emissions, but in general no strong correlation was found between mound CH4 emissions and mound height (R2=0.07) or volume (R2=0.08), and a small correlation was found between mound CO2 emissions and mound height (R2=0.43) and mound volume (R2=0.44).
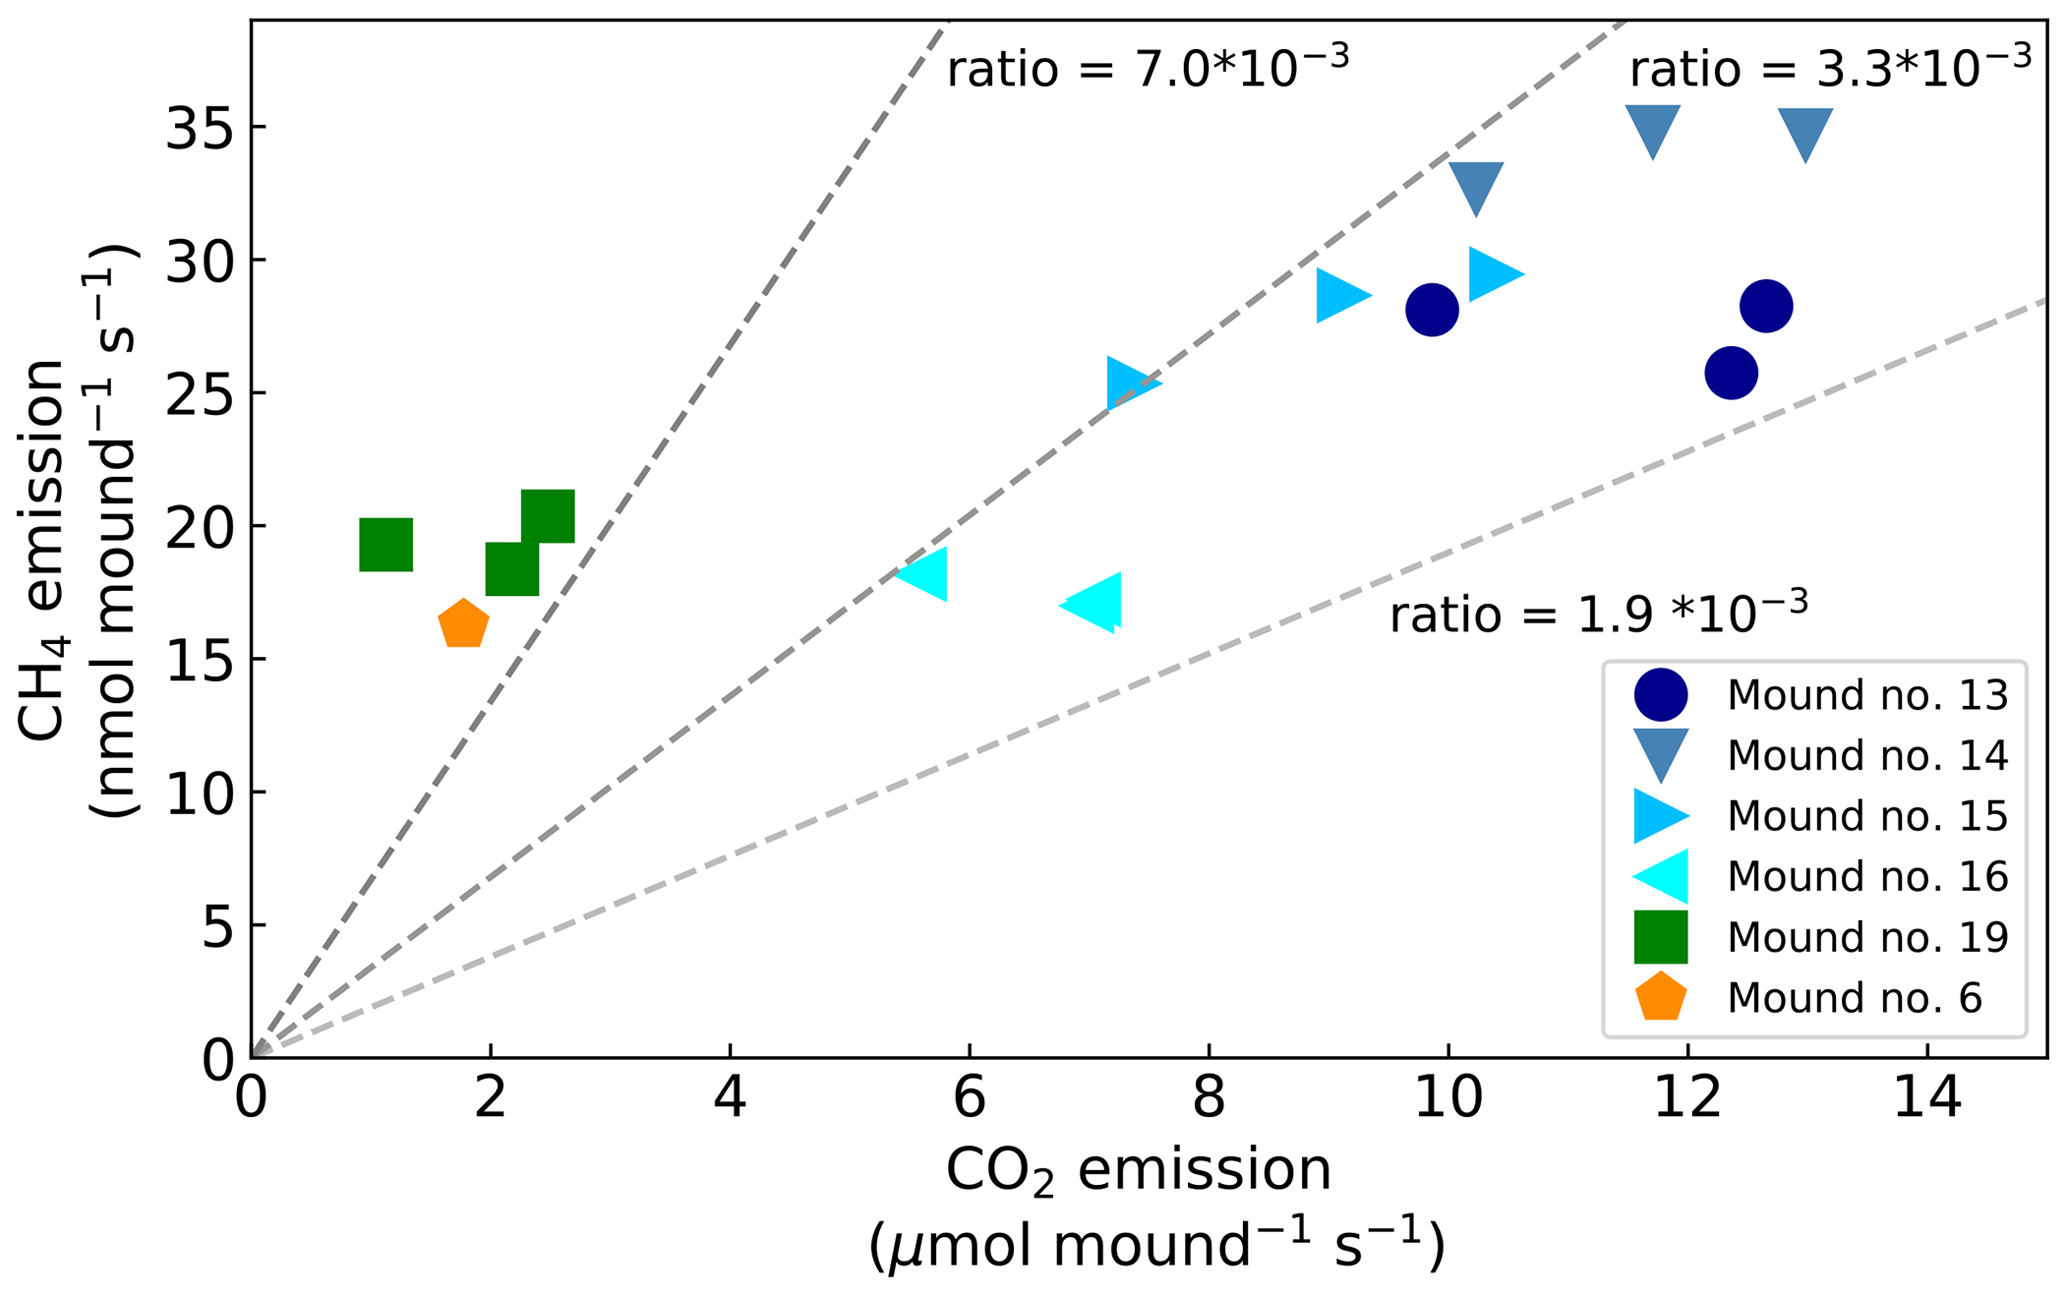
Figure 3Mound CO2 emissions (µmol mound−1 s−1) vs. mound CH4 emissions (nmol mound−1 s−1). Dotted lines indicate the different emission ratios.
3.2 Termite weight, individual termite emission, and colony size estimation
The average weight of five subsets of living workers of the species N. brasiliensis was determined and was found to range between 2.83 and 3.33 mg with an average weight of 3.07 mg (SD = 0.18), which is similar to what was found by Pequeno et al. (2013), who reported 3.0 mg (SD = 0.4). Since the species N. brasiliensis has a relatively low soldiers : workers ratio of 1 : 100 (Krishna and Araujo, 1968), we will use the worker weight 3.07 mg (SD = 0.18) as an average termite weight for the species N. brasiliensis.
CH4 and CO2 emissions of 13 mound subsamples were measured. For each subsample, the measured gas production was plotted over the counted termites (Fig. 4). The fitted line has a forced intercept at y=0. For CH4, an emission of 0.0002985 nmol termite−1 s−1 was found (se = ) and fitted with an R2 of 0.95 (n=13). The set of additional measurements resulted in similar termite CH4 emission factors, namely 0.0002976 nmol termite−1 s−1 (se = ) and 0.0003043 nmol termite−1 s−1 (se = ) for the measurements of October and December 2020 respectively. Given estimates in this paper will be based on the termite emission factor of 0.0002985 nmol CH4 termite−1 s−1. For CO2, an emission of 0.1316 nmol termite−1 s−1 was found (se = ) with an R2 of 0.68 (n=13). Excluding the outliers (32, 14.9 nmol s−1 and 313, 80.9 nmol s−1) gave an R2 of 0.88 (n=11) with a CO2 emission of 0.074 nmol termite−1 s−1 (se = ). Converting the emission rates from termite to termite mass (fresh weight) and from seconds to hourly rates gives a termite emission factor of 0.35 µmol g h−1 (se = 0.02) for CH4 and of 86.8 µmol g h−1 (se = 10.0) for CO2 (Table 2).
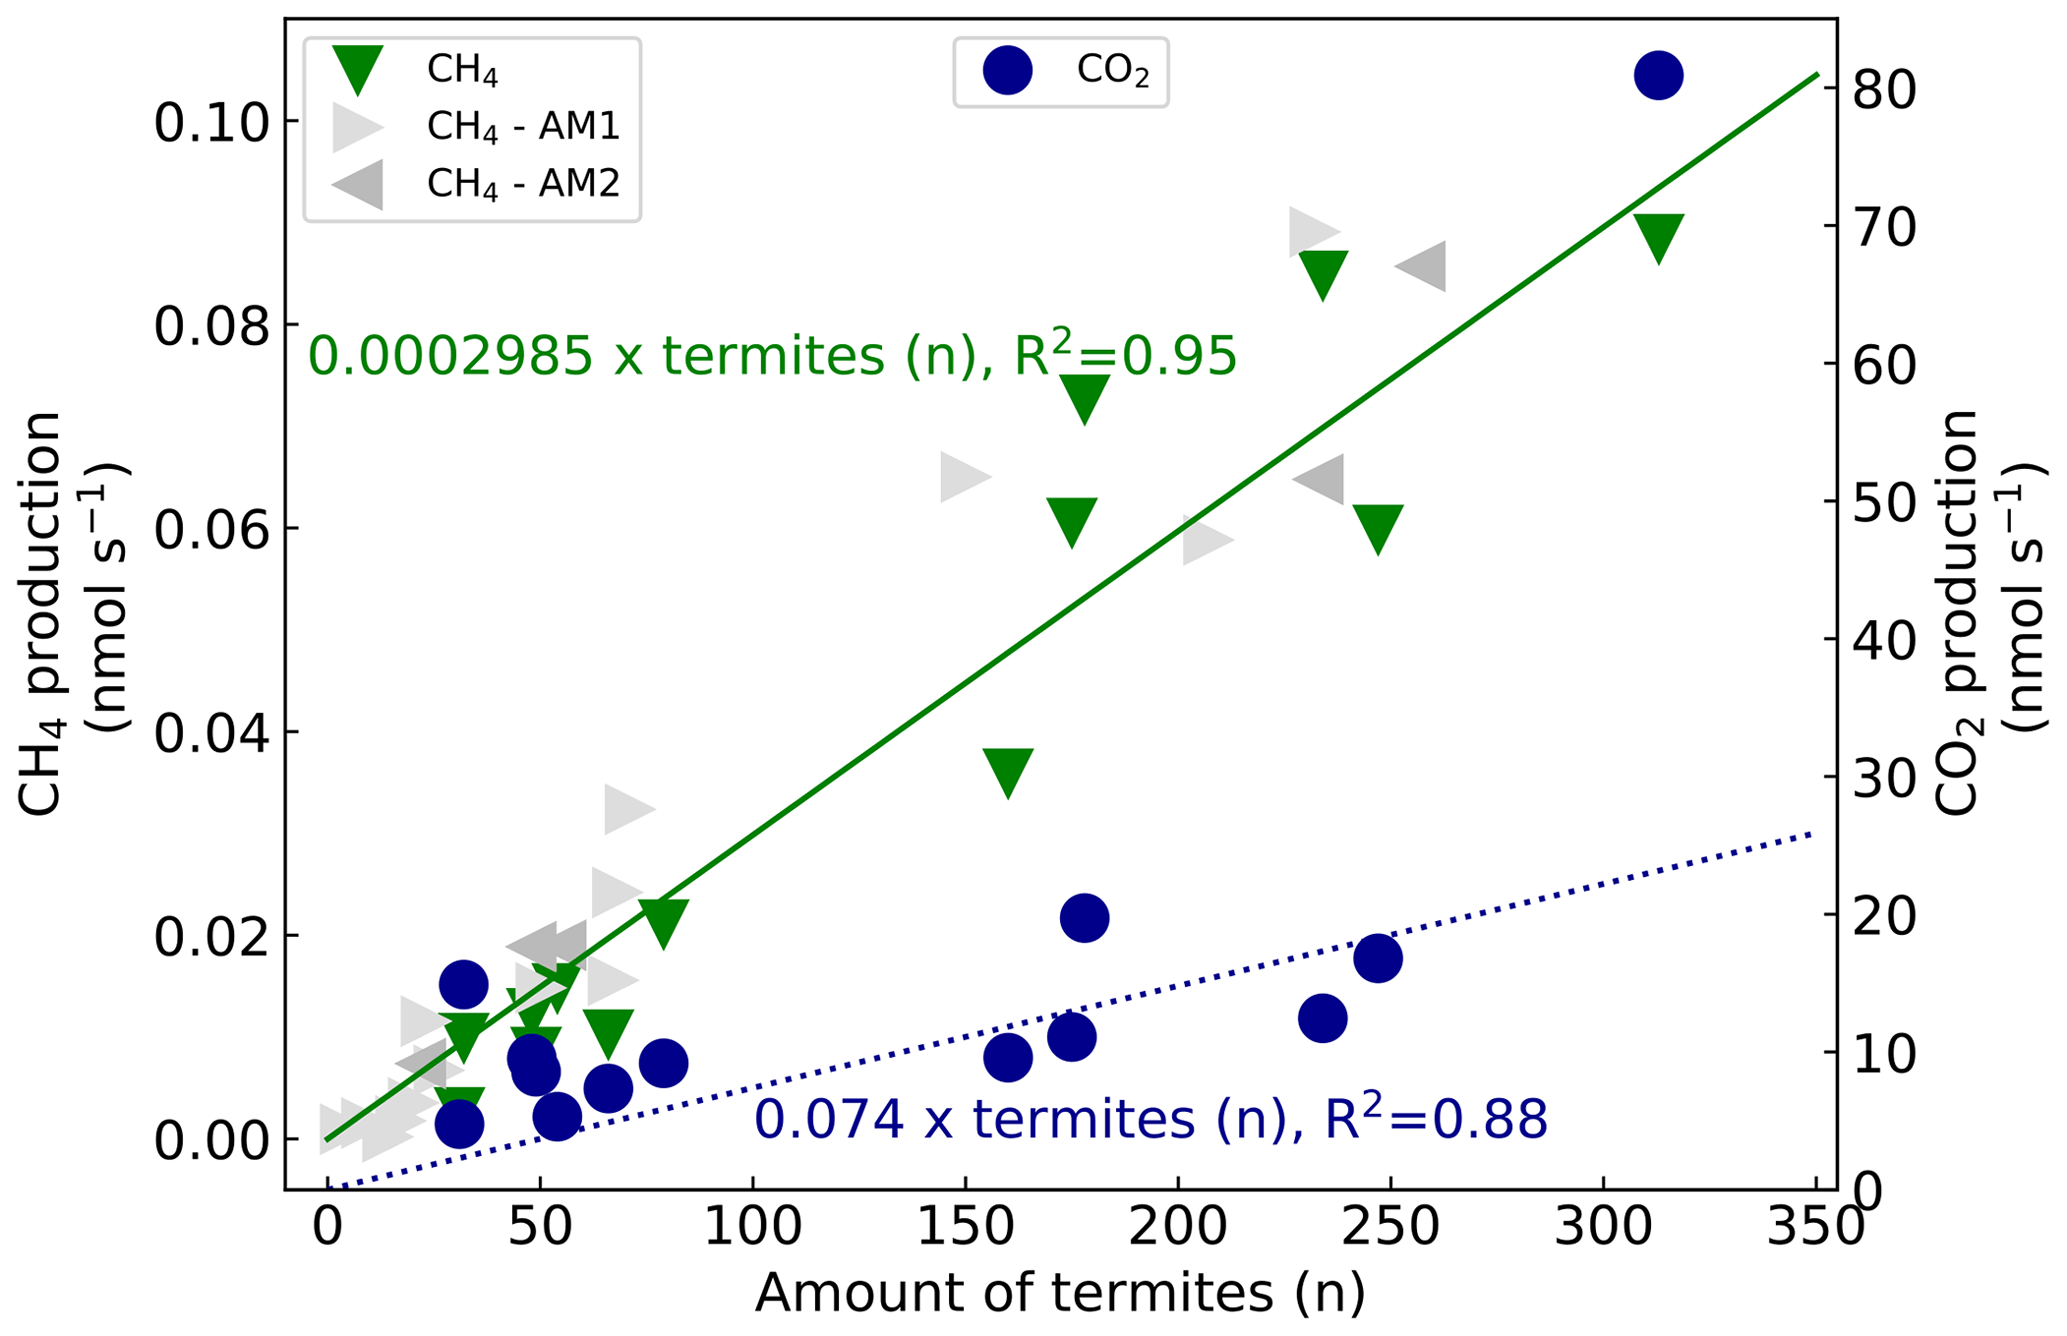
Figure 4CH4 production (left axis, green triangles) and CO2 production (right axis, blue circles) over counted termites. The lines (green solid for CH4, blue dashed for CO2) represent a linear regression fit with forced intercept at y=0. For CH4, a production of 0.0002985 nmol termite−1 s−1 (se = , R2=0.95) was found and, for CO2, a production of 0.1316 nmol termite−1 s−1 (se = , R2=0.68) was found. Excluding the outliers (32, 14.9 nmol s−1 & 313, 80.9 nmol s−1) gives an R2 of 0.88 (n=11) with a CO2 emission of 0.074 nmol termite−1 s−1 (se = ). For comparison, two sets of additional subsample CH4 emission measurements are shown. The first additional measurements (AM1, light grey triangles) resulted in a termite emission factor of 0.0002976 nmol termite−1 s−1 (se = ) (one measurement point (599 termites, 0.165 nmol s−1) is not shown in this figure). The second set (AM2, dark grey triangles) gave a termite emission factor of 0.0003043 nmol termite−1 s−1 (se = ).
By combining the termite CH4 emission factor with the termite mound CH4 emissions, colony sizes were estimated. Colony size estimates were based on the highest measured emissions and were found to range between 55–125 thousand individuals (Table 3). Colony size can also be estimated by use of mound volume or mound external surface. Table 3 shows the colony size estimates based on values as given by Lepage and Darlington (2000) for termites in general and also shows the estimates based the “mound volume–termite biomass” relation found by Pequeno et al. (2013), specifically for the species N. brasiliensis.
Brauman et al. (1992)Eggleton et al. (1999)Fraser et al. (1986)Konaté et al. (2003)Martius et al. (1993)Rouland et al. (1993)Sawadogo et al. (2011)Sugimoto et al. (1998a)Khalil et al. (1990)Macdonald et al. (1999)Martius et al. (1993)Seiler et al. (1984)Sugimoto et al. (1998a)Brümmer et al. (2009a)Jamali et al. (2013)Queiroz (2004)Table 2Overview of literature values for CH4 and CO2 emissions of termites per weight (upper part), emissions per termite mound (middle part), and emissions per area (lower part). Values from this study are indicated in bold. If reported, the average and SD are given, otherwise a range is indicated. If multiple values were found, measurements from higher soil-feeding termite species were selected. For each study, the graph or table where the data were found is given. The is given in molar ratio (10−3).

a Sawadogo et al. (2011) reported emissions per dry weight mass. To convert to fresh weight, a formula as reported by Pequeno et al. (2017) was used. With an assumed dry weight of 0.5 mg, a fresh weight of 1.57 mg is deducted. b Mound emissions are divided by a collar area of 0.25 m2. c Calculated based on average values in this table. d Neocapritermes brasiliensis. e Crenetermes albotarsalis, Cubitermes fungifaber, Cubitermes speciosus, Noditermes sp., Procubitermes sp., Thoracotermes macrothorax; f Dicuspiditermes santschii, Dicuspiditermes nemorosus, Pericapritermes semarangi, Procapritermes nr. sandakanensis, Homallotermes eleanorae, Proaciculitermes sp. A, Pericapritermes nitobei. g Coptotermes lacteus. h Ancistrotermes cavithorax, Odontotermes n. pauperans. i Nasutitermes macrocephalus, Nasutitermes corniger, Nasutitermes surinamensis, Nasutitermes sp., Nasutitermes ephratae, Nasutitermes araujoi. j Noditermes sp., Crenetermes albotarsalis, Cubitermes speciosus, Thoracotermes macrothorax, Astratotermes sp. k Macrotermes bellicosus. l Microcerotermes sp., Globitermes suplhureus, Termes sp., Dicuspiditermes sp. m Drepanotermes perniger, Nasutitermes magnus, Nasutitermes triodiae, Tumulitermes pastinator, Amitermes laurensis, Coptotermes lacteus. n Bulbitermes sp. C, Dicuspiditermes nemorosus, Dicuspiditermes santschii. o Macrotermes and Odontotermes (Macrotermitinae), Trinervitermes (Nasutitermitinae), Amitermes and Cubitermes (Termitinae), Hodotermes (lower termite). p Cubitermes fungifaber. q Microcerotermes nervosus, Turnulitermes pastinator, Turnulitermes hastilis, Amitermes meridionalis.
Table 3Colony size estimates (CSEs) based on different methods; values given per thousand (×103). “Mound volume” is the estimated mound volume as given in Table 1 and “Mound emission” is the highest measured emission per individual mound.

a CSE based on the highest measured mound CH4 emission and combined with an emission factor of 0.0002985 nmol CH4 termite−1 s−1 (se = ). b CSE based on mound volume by use of mound termite density values (0.2–5.6 termite cm−3; Lepage and Darlington, 2000). c CSE based on mound surface area (given in Table 1) by use of mound termite surface values (5.6–16.7 termite cm−2; Lepage and Darlington, 2000). d CSE based on mound volume by the species-specific volume–population equation (x is mound volume (L) and y is colony biomass (g)) as given by Pequeno et al. (2013); for termite weight, 3.07 mg (SD = 0.18) was used. Since mound no. 6 was of a different species, it is not included in this table.
4.1 CH4 and CO2 emissions
Measured mound CH4 emissions were of similar magnitude to emissions found by previous studies (Table 2, middle and lower part). The termite emission factor, determined for the soil-feeding species N. brasiliensis, was found to be 0.35 µmol g h−1 (SD = 0.02), which is similar to values found for other species (Table 2, upper part) but almost two times higher than the average value reported by Martius et al. (1993) for a wood-feeding species in the Amazon (0.19 µmol g h−1). Our emission rate is within the reported range of 0.1–0.4 µmol g h−1 for soil feeders (Sugimoto et al., 2000). Mound CO2 emissions and the termite CO2 emission factor were similar to or a little higher than the few values found in literature (Table 2). Nevertheless, since mound material and termites were measured together, the contribution of indirect termite emissions, i.e. mound respiration, cannot be quantified, so that the direct termite-produced CO2 emission is presumably lower.
There is a large variety in type of termite mounds (shape and size are dependent on, among other things, species, ecosystem, and climate; Noirot and Darlington, 2000), explaining the wide range of reported termite mound CH4 emissions (Table 2, middle and lower part). In situ measurement of termite mounds gives information about the net CH4 emission under natural conditions but is unable to distinguish sources and sinks inside the mound. One known CH4 sink in termite mounds is the uptake by methanotrophic bacteria, which are also responsible for the CH4 uptake in aerobic soils. The presence and magnitude of this process have been discussed and reviewed by different studies (Ho et al., 2013; Khalil et al., 1990; Macdonald et al., 1998; Nauer et al., 2018; Seiler et al., 1984; Sugimoto et al., 1998a; Pester et al., 2007; Reuß et al., 2015). The role of possible mound CH4 uptake should also be acknowledged for the measurement of individual termite emissions (Table 2, upper part); most literature values, including values from this study, are based on termite incubation in the presence of mound material, with ongoing CH4 uptake; therefore, actual termite CH4 emission values might be higher.
Small variation in mound emission magnitudes was observed between measurement days. This can be caused by a variation in colony size (due to foraging activities) or termite activity driven by fluctuations in temperature or radiation (Jamali et al., 2011a; Ohiagu and Wood, 1976; Sands, 1965; Seiler et al., 1984). However, as our termite mounds are in a tropical forest with relatively constant temperatures and only indirect daylight, strong diurnal temperature and radiation patterns are not expected. Small variation can also be caused by minimal air transport below the soil collar through the porous upper soil layer; during preliminary tests without a collar, we observed that even a light forest breeze can cause chamber headspace variations. In case our setup was subject to minor air transport below the collar, the given mound emission estimates will be slightly underestimated with respect to the actual mound emissions. Another possible underestimation is caused by the estimated corrected chamber volume CV, as used in Eq. (2). In this study, we considered the mound volume as a solid body. A previous study considered the solid nest volume as 10 % of the actual mound volume (Martius et al., 1993), leading to a larger corrected chamber volume and therefore to larger calculated mound emissions. By use of this approach, average calculated mound emissions would increase by almost 30 % to be 32.7 instead of 25.2 nmol CH4 mound−1 s−1.
The mound emission ratio was found to be relatively constant over four of the five mounds. While values in literature indicate a wide range of ratios (Table 2), both Seiler et al. (1984) and Jamali et al. (2013) found little variation between mounds of the same species and concluded that the ratio is species-specific. Our average variation of a factor of ∼4 between mounds of the same species is of the same magnitude as what was observed in earlier studies (Seiler et al., 1984; Jamali et al., 2013).
4.2 Colony size estimate
To estimate colony sizes of (epigeal) nest building termites, different methods exist. One method is by fumigation of the nest (to prevent colony evacuation) followed by excavation, after which termites can be removed from the nest debris by flotation in water. This process is labour intensive and can take five persons up to three weeks to finish one nest (Darlington, 1984; Jones et al., 2005). A faster method is by subsampling known volumes of the mound, counting the termites in the subsample, and extrapolating this to the total mound volume. Termite mounds can have irregular shapes; therefore, volume estimates strongly depend on which volume estimation approach is used (Jones et al., 2005).
The population estimation method we tested combined CH4 mound emissions with a termite emission factor measured in situ at the field site. We estimated colony sizes ranging between 57.6 and 124.0 thousand termites per mound. For all mounds, our population estimate was in the estimated range based on mound volume or external surface area, as taken from literature equations (Table 3). Comparison to estimates based on a N. brasiliensis species-specific equation shows an average difference of 20 % (Pequeno et al., 2013). It should be noted that the relation found between mound volume and colony biomass by Pequeno et al. (2013) was quite weak (R2=0.41), and our estimates would fit in the general spread they observed in their data. Interestingly, Pequeno et al. (2013) concluded that mound volume is a weak indicator for population size for nests of the species N. brasiliensis, as also indicated by the weak correlation we found between mound volume and mound CH4 emissions.
The influence of mound CH4 uptake on our population estimate method should be considered: mound methanotrophic CH4 uptake probably decreases the net mound CH4 emission, resulting in an underestimation of the colony size when linking it to termite emission factors, as also suggested by Nauer et al. (2018). However, our termite emission factor was determined inside small pieces of undisturbed mound material, so that the material's CH4 uptake rate was presumably only mildly affected. It is therefore likely that our termite emission factor is underestimated to the same degree as our mound emissions; therefore, both values can still be combined.
Overall, our colony size estimation approach can be considered as a test case for a quick population estimation method. The combination of one mound flux measurement (15 min) in combination with five subsample measurements (5×5 min) can be performed within 1 h, thereby being faster than the original methods. Also, the method is applicable to epigeal mounds of all species, independent of internal mound structure (Josens and Soki, 2010) or species characteristics (Pequeno et al., 2013). In addition, the method is not strongly dependent on a correct mound volume estimate, which remains a source of uncertainty (Jones et al., 2005) and which has been shown to be a weak indicator of population size for some species (Pequeno et al., 2013; Josens and Soki, 2010). Moreover, mounds can also be measured several times in a row before the subsample measurement, so that colony size dynamics over time can be studied non-invasively. A disadvantage of this method is that it is only applicable to freestanding epigeal mounds, at least with the current type of chamber setup. For a possible follow-up study, we propose a setup wherein the different methods are compared.
4.3 Role of termites on the ecosystem scale
Valley soil CH4 and CO2 fluxes were similar to what was found by earlier studies (Souza, 2005; Moura, 2012; Chambers et al., 2004; Zanchi et al., 2014). On average, mound-adjacent soil CH4 and CO2 fluxes were enhanced with respect to valley soils, although differences were small and no clear emission pattern with “distance to mound” was observed. While mound-adjacent soil fluxes are possibly enhanced, we preferred to avoid overestimation and decided to treat termite mounds as very local hot spots, with measured fluxes only representative for the collar area of 0.25 m2. On average, CH4 and CO2 fluxes per collar area were found to be a factor ∼630 and ∼16 higher when an active termite mound was present.
To estimate the role of termites on the ecosystem scale, one approach is to combine mound emission values with termite mound density numbers. A local study reported a density value of 21.6 mound ha−1 for the species N. brasiliensis specifically (Pequeno, 2014), which would lead to an average CH4 emission of 0.05 nmol m−2 s−1 caused by mounds of this species alone. Non-species-specific mound densities are known to vary strongly between and within ecosystems (Ackerman, 2006, Appendix B8). We found five local studies reporting mound (epigeal nest) density values, which were ∼ 100 mound ha−1 (Queiroz, 2004), 193 mound ha−1 (Oliveira, 2016), 250 mound ha−1 (Dambros et al., 2016), 60 and 280 mound ha−1 (de Souza and Brown, 1994), and even 760 mound ha−1 (Ackerman et al., 2007). When excluding the strong outlier of 760 mound ha−1, the emission of termite mounds on the ecosystem scale was estimated to range between 0.15–0.71 nmol m−2 s−1 for CH4 and between 0.05–0.23 µmol m−2 s−1 for CO2. Since (epigeal) mounds only represent a part of the total termite community, and not the termites located in the subsoil, in dead wood, or on trees (arboreal nests), this emission value underestimates the actual role of termites on the ecosystem scale. To our knowledge, only Bandeira and Torres (1985) (as given in Martius et al., 1996) assessed the ratio between nest-building vs. total termite biomass and estimated it to be ∼ 0.16. Considering the limited literature on this subject, we prefer to not further extrapolate our mound emission measurements.
A more comprehensive approach is to use termite biomass estimates and combine them with termite emission factors, a method which is commonly used for global CH4 budget studies (Kirschke et al., 2013; Saunois et al., 2020). For active tropical ecosystems, a termite biomass of ∼ 11 g termite m−2 is generally assumed (Bignell and Eggleton, 2000; Kirschke et al., 2013; Sanderson, 1996; Saunois et al., 2020). Considering the previously found value of 0.19 µmol CH4 g h−1 for wood-feeding termites in the Amazon (Martius et al., 1993) and our newly found termite emission factor of 0.35 µmol CH4 g h−1 for a soil-feeding termite, a termite-derived ecosystem CH4 emission range of 0.6–1.1 nmol m−2 s−1 can be calculated. For CO2, our termite emission factor of 86.8 µmol CO2 g h−1 leads to a termite-induced ecosystem CO2 emission of ∼ 0.27 µmol CO2 m−2 s−1.
An overview of the different estimates is given in Table 4. Each of these estimates are based on measurements from mounds and termites found in the valley, which were only measured during the wet season. Nevertheless, an exploratory measurement of a small mound of a different species on the plateau (mound no. 6) indicated CH4 fluxes of a similar magnitude in comparison to a similar-sized mound in the valley (mound no. 19). Furthermore, exploratory dry season measurements of the same mounds showed emissions of similar magnitude (not shown) and additional dry season mound subsample measurements revealed very consistent termite CH4 emission factors (Fig. 4). We therefore do not expect that mound CH4 emissions are only of importance in the valleys or only present in the wet season.
Table 4Overview of termite-induced CH4 and CO2 emissions based on two different approaches. For comparison, the lowest row shows the total (not termite-specific) ecosystem CH4 and CO2 flux values, measured at the same field site by previous studies.
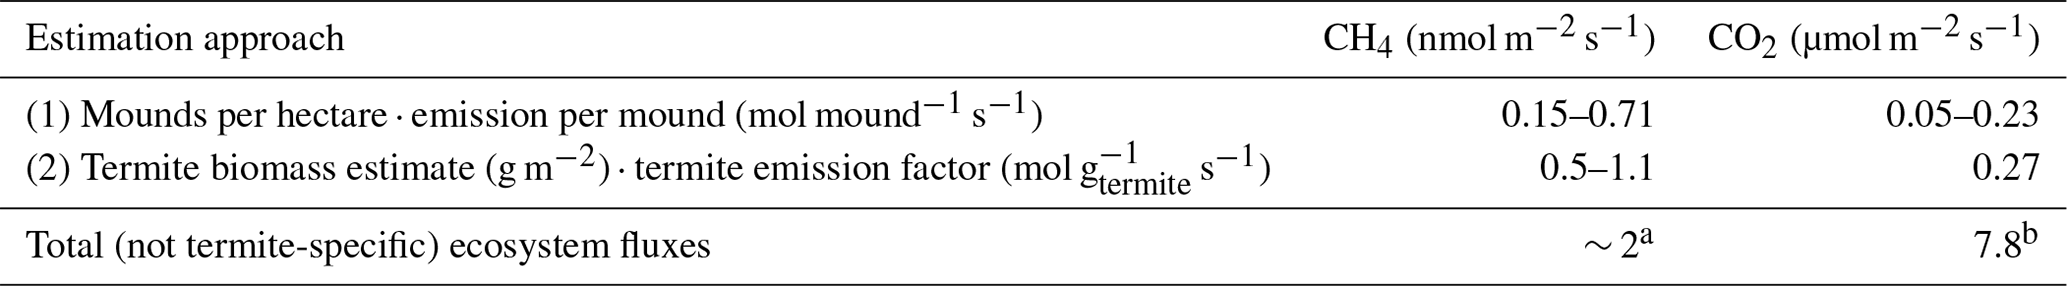
a Querino et al. (2011) performed above-canopy Eddy Covariance CH4 flux measurements and reported an average CH4 flux of ∼ 2 nmol m−2 s−1. b Chambers et al. (2004) quantified different respiratory CO2 sources in this ecosystem and estimated the total ecosystem respiration to be 7.8 µmol CO2 m−2 s−1.
To put the estimates in perspective, non-termite-specific ecosystem CH4 and CO2 fluxes measured at this field site during earlier studies are given. Ecosystem termite CO2 emissions were estimated to range between 0.05–0.27 µmol m−2 s−1, which is approximately ∼ 1 %–3 % of the estimated total ecosystem respiration (7.8 µmol m−2 s−1; Chambers et al., 2004). Nevertheless, since the “emission per mound” as well as the “termite emission factor” are both affected by indirect effects of termite activity (mound respiration), the contribution of direct termite-emitted CO2 into the ecosystem is presumably smaller. For CH4, we rather expect an underestimation than an overestimation of our termite and mound emission values, therefore we expect that these ecosystem estimates are lower bound. For CH4, it is difficult to judge the role on the ecosystem scale since the earlier measured CH4 flux (above canopy EC measurements, ∼ 2.0 nmol m−2 s−1; Querino et al., 2011) is a net flux of uptake and emission processes with relatively unknown individual magnitudes. Nevertheless, considering the magnitude of our estimated termite-emitted CH4 emissions (0.15–1.1 nmol m−2 s−1), it is expected that termites play a significant role in this terra firme ecosystem.
Termites contribution to tropical South America CH4 budget
In current CH4 budget studies, a termite emission factor of 2.8 µg CH4 g h−1 is used for “Tropical ecosystems and Mediterranean shrub lands” (Kirschke et al., 2013; Saunois et al., 2020),2 which is mainly based on field studies in Africa and Australia (Brümmer et al., 2009a; Jamali et al., 2011a, b; Macdonald et al., 1998, 1999; Sanderson, 1996). The only termite emission factor measured for the Amazon rainforest is by Martius et al. (1993) (3.0 µg g h−1) for a wood-feeding species, which are expected to emit less CH4 than soil-feeding species (Bignell and Eggleton, 2000; Brauman et al., 1992). As a back-of-the-envelope calculation based on Kirschke et al. (2013): 36 % of global termite emission (11 Tg) is expected to come from the region of “tropical South America” ( Tg). Substituting the emission factor of 2.8 with the newly found 5.6 µg CH4 g h−1 would increase this regions estimate to 7.92 Tg and thereby the global estimate to 14.96 Tg.
Our study points out that termite emissions are still an uncertain source in the CH4 budget and are especially poorly quantified for the Amazon rainforest. Measurement of CH4 emissions from different termite species, preferably covering species of different feeding or nesting habits in combination with more precise termite distribution and abundance data, would allow more precise estimates and a better understanding of the role of termites in the CH4 budget.
In situ measurement of termite mound CH4 and CO2 emissions confirmed that mounds are important local hot spots, playing a considerable role on the ecosystem scale. Measured mound emissions of the species N. brasiliensis were of similar magnitude to observed emissions for different soil- and wood-feeding species, and mounds showed a relatively constant emission ratio. By performing emission measurements on small groups of termites, we derived a termite CH4 emission factor, so far only the second value reported for the Amazon rainforest. The newly found termite emission factor, measured for a soil-feeding species, is almost twice as high as the previously reported average value for the Amazon, which was determined for a wood-feeding species. By combining mound emissions and termite emission factors, mound colony sizes were estimated and values were similar to estimates based on a literature review. Considering the quick, widely applicable, and non-destructive nature of this approach, we propose that it can be used as an alternative to the traditional methods that are intrusive and time-consuming.
Assessment of the magnitude of termite-emitted CH4 on the ecosystem scale was attempted by two approaches. Mound emission values were combined with mound density numbers, leading to an estimate of 0.15–0.71 nmol CH4 m−2 s−1 emitted by mounds, on average; since this estimate neglects emission from termite activity outside mounds, the number is likely an underestimation. The CH4 termite emission factor from this study and from the only other Amazon field study were combined with termite biomass numbers, resulting in an estimate of termite-emitted CH4 of 0.6–1.1 nmol m−2 s−1. Considering the relatively low CH4 emissions previously measured at this ecosystem, we expect that termites play an important role in the CH4 budget of this terra firme ecosystem.
A1 Methodology
In addition to the direct mound CH4 and CO2 emission measurements (performed with the Los Gatos instrument), mound N2O and CO fluxes and the δ13C of the mound CO2 flux were determined by the following method. Three bags (5 L inert foil, Sigma-Aldrich) were sampled consecutively during chamber closure. The bags were measured on the same or the consecutive day with a Spectronus FTIR analyser, which can quantify concentrations of CO2, CH4, N2O, and CO, and can determine the δ13C of CO2. The N2O and the δ13C of CO2 measurements of the FTIR analyser have a cross sensitivity for CO2 concentrations, which is well quantified for the CO2 range 380–800 ppm (Hammer et al., 2013). In order to sample air with CO2 concentrations <800 µmol mol−1, air samples were taken in the first minutes after chamber closure (2, 5, 8 min). Out of the 45 sample bags taken, two bag samples could not be used.
Before measurement of the bag sample, sample lines were flushed with bag sample air. Air samples were dried by a Nafion dryer and by a column of magnesium perchlorate. Measurements were corrected for pressure and temperature variations as well as for cross sensitivities (Hammer et al., 2013). For more information on this instrument, please refer to Griffith et al. (2012). For calibration of the instrument, two calibration gases were used: gas 1 with values 381.8 µmol CO2 mol−1, 2494.9 nmol CH4 mol−1, 336.6 nmol N2O mol−1, 431.0 nmol CO mol−1, and a δ13C of CO2 of −7.95 ‰, and gas 2 with values 501.6 µmol CO2 mol−1, 2127.0 nmol CH4 mol−1, 327.8 nmol N2O mol−1, 256.7 nmol CO mol−1, and a δ13C of CO2 of −14.41 ‰.
To calculate the fluxes of N2O and CO, FTIR-measured bag concentrations of N2O, CO and CO2 were used. For each chamber closure, the , , and were calculated so that the ratios , and could be derived. To calculate the fluxes of N2O and CO, the ratios were combined with the in situ determined mound CO2 flux, as measured by the Los Gatos instrument. This approach was chosen because the intended 3 min bag sampling interval was not always accomplished, so that an exact Δt could not be assumed with certainty. To determine the δ13C of the CO2 emitted by the termite mounds, Keeling plots were used (Pataki et al., 2003).
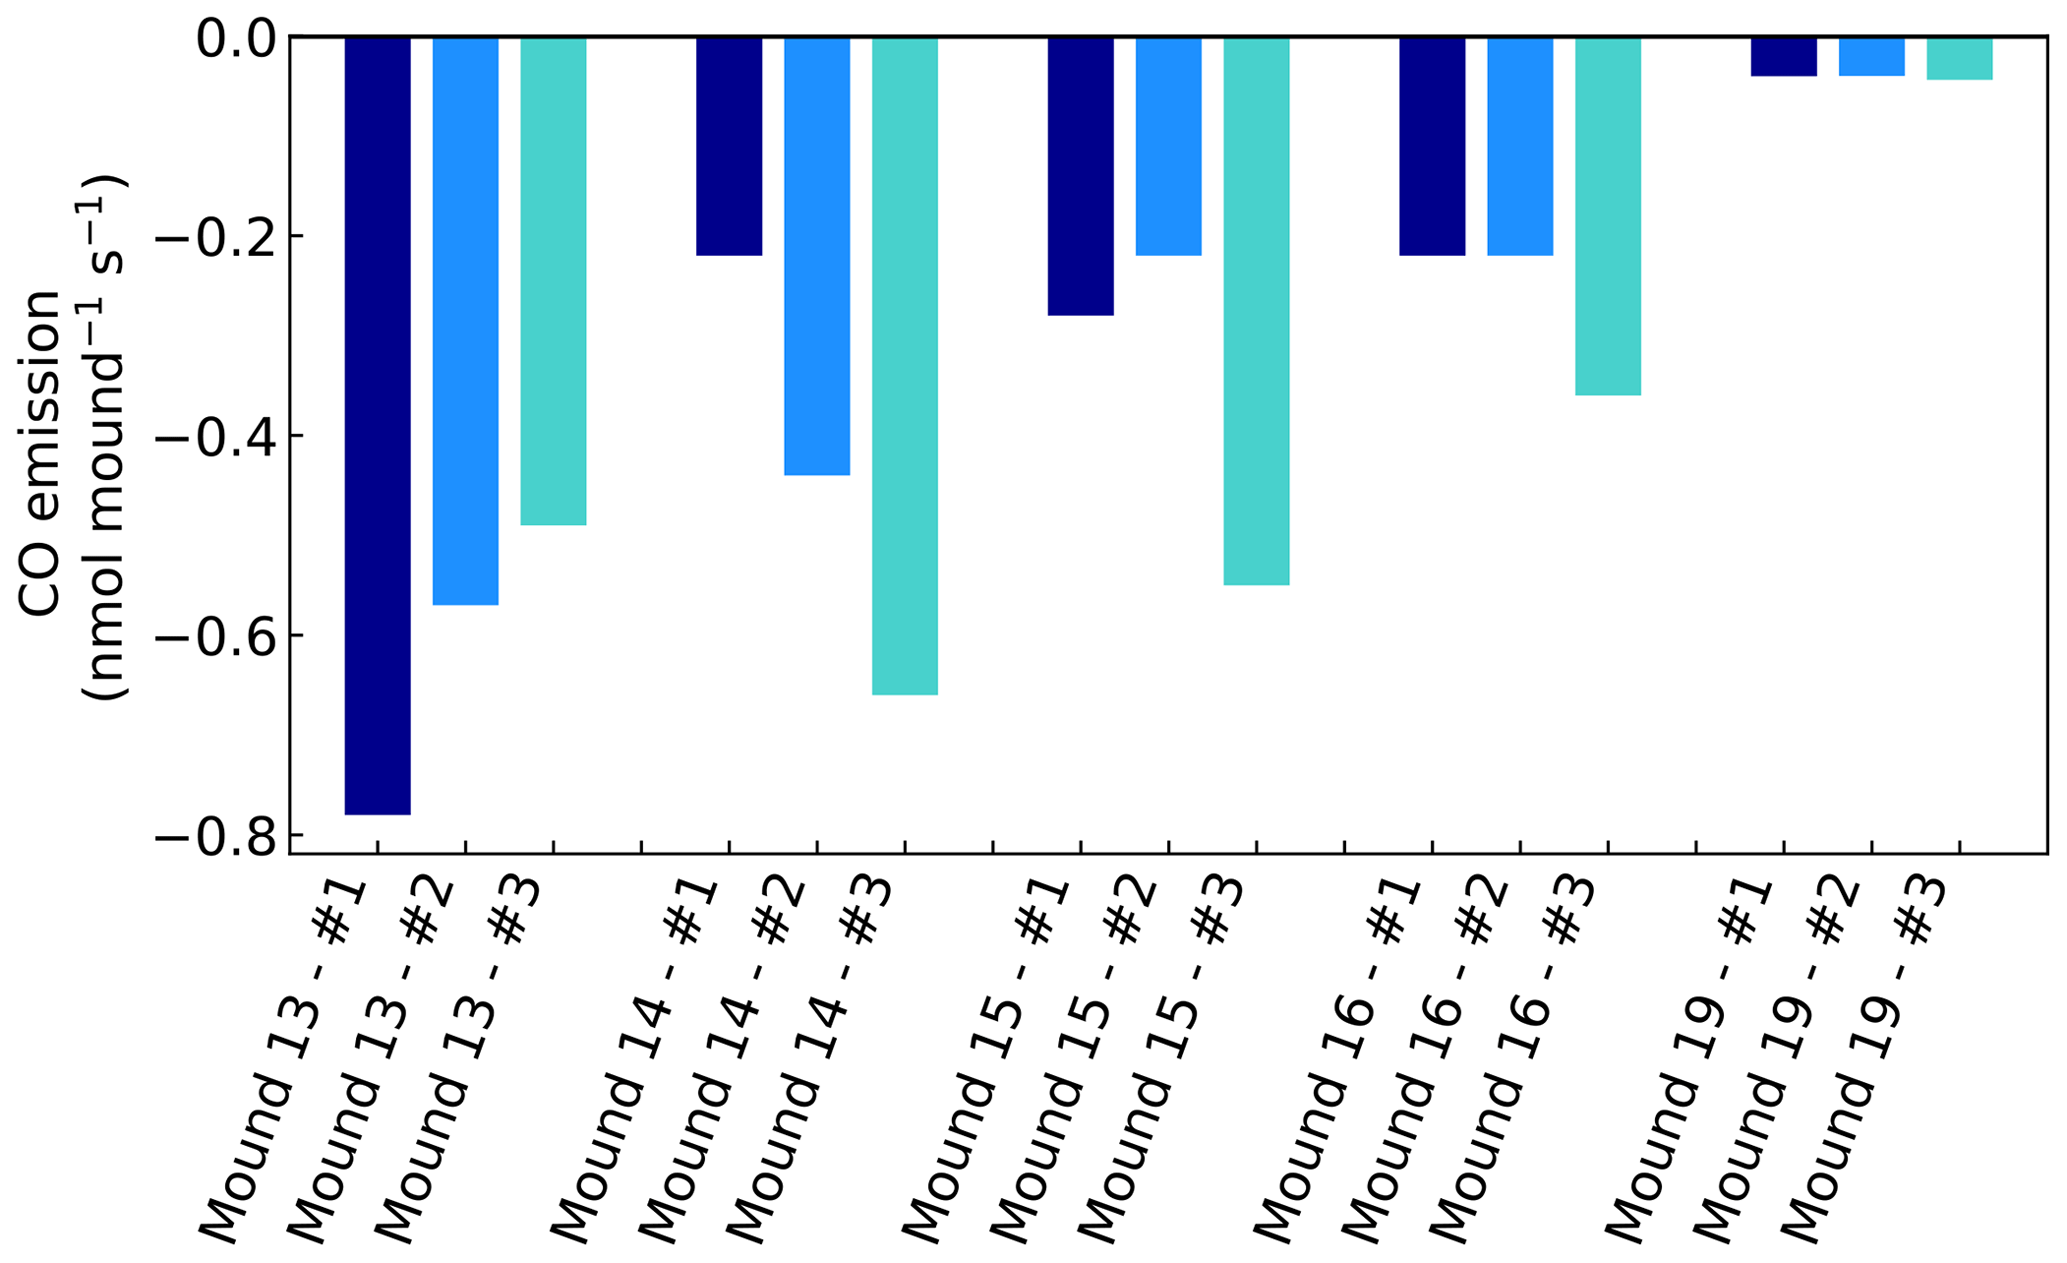
Figure A1CO emissions of valley mound nos. 13–19, expressed in nmol mound−1 s−1, which represents a collar area of 0.25 m2. All mounds were measured three times during one week and each series no. (#) was measured on the same day and in the same order.
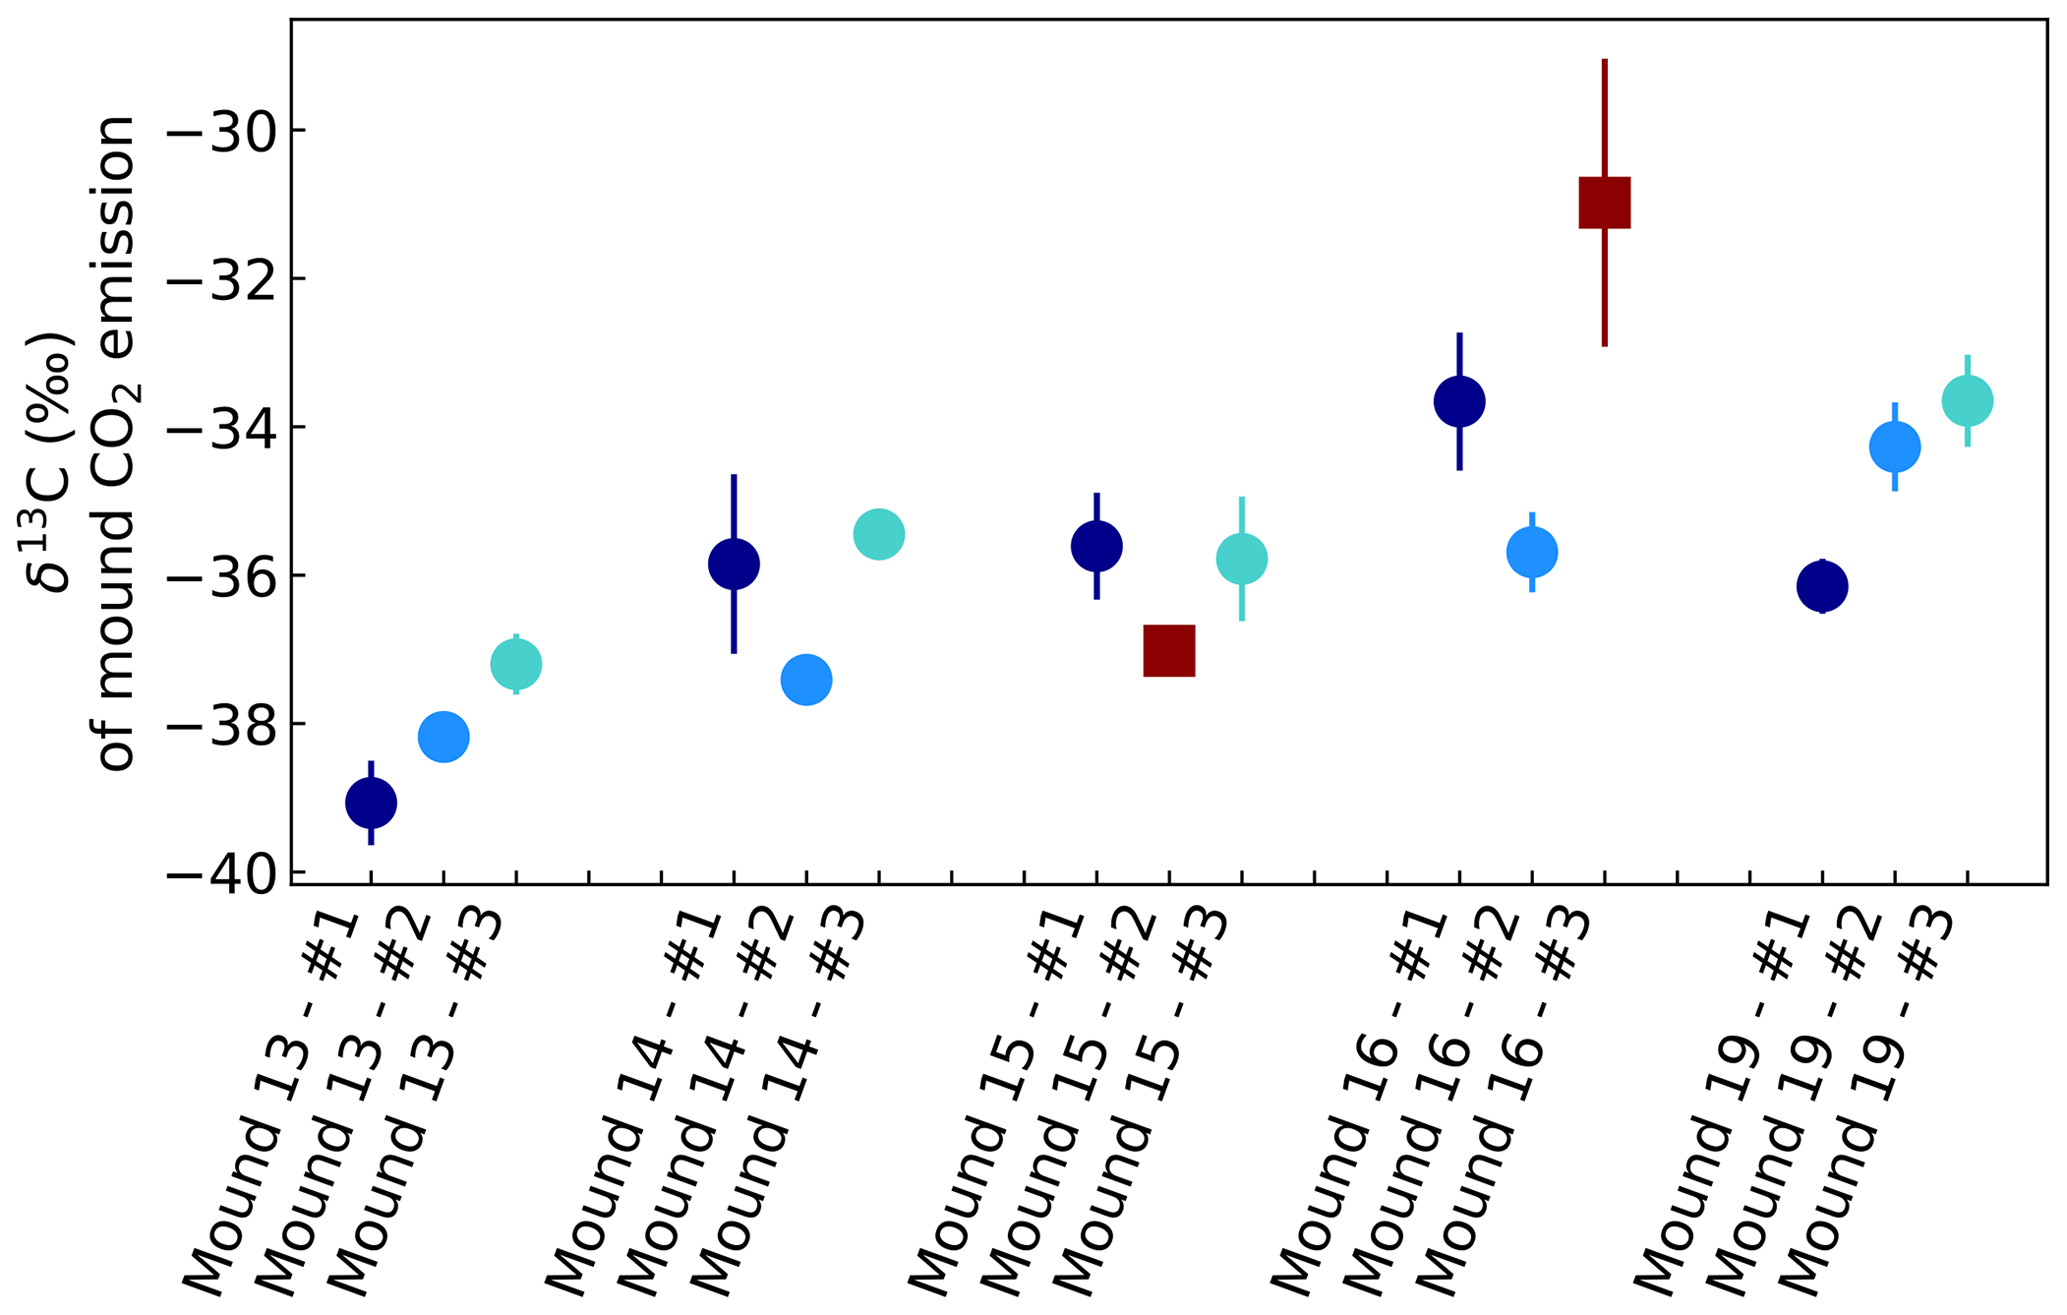
Figure A2δ13C of CO2 emitted by mounds nos. 13–19, derived by use of Keeling plots. Error bars represent the standard error of the linear regression intercept. Red squares indicate intercepts based on linear regression fits with R2<0.99 or based on linear regression with only two instead of three sample points. All mounds were measured three times during one week, and each series no. was measured on the same day and in the same order. Averages were calculated for each mound, which were −38.1 ‰ (mound no. 13, se = 0.9), −36.2 ‰ (mound no. 14, se = 1.0), −35.7 ‰ (mound no. 15, se = 0.1), −34.7 ‰ (mound no. 16, se = 1.4), and −34.7 ‰ (mound no. 19, se = 1.3). For calculation of these averages, values with a linear regression of R2<0.99 or values based on a linear regression of only two measurements (indicated as dark red squares) were excluded.
A2 Mound N2O and CO fluxes
Gas samples (three samples per chamber closure) revealed stable N2O concentrations and headspace concentrations ranged between 333.7 and 342.4 nmol mol−1 over the different chamber closures. Since headspace CO2 concentrations sometimes exceeded 800 µmol mol−1 and N2O–CO2 cross sensitivity becomes uncertain at higher CO2 concentrations (Hammer et al., 2013), not all three headspace samples per chamber closure could be used; therefore, qualitative N2O flux estimates cannot be reported. As a back-of-the-envelope calculation, N2O fluxes were calculated if two headspace samples were with CO2 <800 µmol mol−1 and if a minimum N2O concentration difference of 0.18 nmol mol−1 was found (FTIR precision (σ) for 5 min spectra is 0.09 nmol mol−1), which gave us three mound flux estimates ranging between 0.03 and 0.11 nmol N2O mound−1 s−1. Similarly low fluxes were found during additionally performed soil flux measurements, performed as part of a substudy, which showed valley soil fluxes ranging between 0.008–0.106 nmol m−2 s−1. The low mound fluxes are in agreement with a previous study suggesting that termite mound N2O emissions are dependent on the nitrogen content of the termites diet (Brauman et al., 2015), which is expected to be low in the valleys of this ecosystem (Quesada et al., 2010).
Chamber CO concentrations ranged between 120 and 220 nmol mol−1 and showed a clear uptake on all days and for all mounds, ranging between −0.04 to −0.78 nmol mound−1 s−1 (Fig. A1). Termite mound uptake has been observed before by Khalil et al. (1990). We expect that the observed uptake is caused by aerobic CO-oxidising bacteria in the mound, which are also responsible for the CO uptake in (tropical) soils (Conrad, 1996; Kisselle et al., 2002; Liu et al., 2018; Potter et al., 1996; Whalen and Reeburgh, 2001; Yonemura et al., 2000a). Soil CO uptake is dependent on atmospheric CO and therefore often limited by low soil diffusivity (Sun et al., 2018; Yonemura et al., 2000b). The dry porous mound material (Martius et al., 1993) is therefore a suitable place for CO uptake.
A3 δ13C of the mound-emitted CO2
For each chamber measurement, a mound-specific δ13C value of the CO2 flux was determined. Figure A2 shows the Keeling plot intercepts, wherein error bars represent the standard errors of the intercept. In general, the values were more depleted than values found by de Araújo et al. (2008), who found a δ13C of −30.1 ‰ for valley litter during the dry season (August 2004). However, for our measurements, at least one sample bag per chamber closure was with CO2 > 800 µmol mol−1, so that the CO2 cross sensitivity correction for these samples was less certain. Intercepts based on only the first two concentrations points, which were generally lower (or around) 800 µmol mol−1, resulted, on average, in less depleted (∼ 1 ‰) δ13C values. To investigate if these values are representative for other mounds and to investigate whether an isotopic difference exists between mound- and soil-emitted CO2, more measurements would be needed.
The data from this study have been uploaded to the open-access repository of Zenodo and can be found at https://doi.org/10.5281/zenodo.4697271 (van Asperen and Alves-Oliveira, 2021).
HvA designed and performed the field experiment and wrote the manuscript. JRAO was responsible for the determination of the termite species and gave input on the entomology part of the research. BF and ACdA provided access to the logistics and infrastructure of the field site. JRAO, TW, BF, ACdA, and JN reviewed and commented on the manuscript.
The authors declare that they have no conflict of interest.
We are thankful for the support of the crew of the experimental field site ZF2, the research station managed by the INPA-LBA (National Institute for Amazonian Research (INPA), The Large-Scale Biosphere-Atmosphere Research Program in Amazonia (LBA)). We would also like to express our gratitude to the staff of LBA for providing logistics, advice, and support during different phases of this research. In addition, we would like to thank Thiago de Lima Xavier and Leonardo Ramos de Oliveira for their advice in planning the technical parts of the experiment. Furthermore, we would like to acknowledge the “Department of Aquatic Biology and Limnology” (working group MAUA, INPA) for lending us an additional Los Gatos instrument. Last but not least, we would like to thank Sipko Bulthuis for his assistance and ongoing support during the challenging field measurements days.
This research has been supported by the Deutsche Forschungsgemeinschaft (grant no. 352322796).
The article processing charges for this open-access publication were covered by the University of Bremen.
This paper was edited by Tina Treude and reviewed by Lukas Kohl and two anonymous referees.
Ackerman, I. L.: Termites in ecosystems of central Amazonia: species composition, soil properties, and nutrient cycling, Cornell University, Aug., 2006. a
Ackerman, I. L., Teixeira, W. G., Riha, S. J., Lehmann, J., and Fernandes, E. C.: The impact of mound-building termites on surface soil properties in a secondary forest of Central Amazonia, Appl. Soil Ecol., 37, 267–276, 2007. a
Araújo, A. C., Nobre, A. D., Kruijt, B., Elbers, J. A., Dallarosa, R., Stefani, P., Von Randow, C., Manzi, A. O., Culf, A. D., Gash, J. H. C., and Valentini, R.: Comparative measurements of carbon dioxide fluxes from two nearby towers in a central Amazonian rainforest: The Manaus LBA site, J. Geophys. Res.-Atmos., 107, LBA 58-1–LBA 58-20, https://doi.org/10.1029/2001JD000676, 2002. a
Ashton, L., Griffiths, H., Parr, C., Evans, T., Didham, R., Hasan, F., Teh, Y., Tin, H., Vairappan, C., and Eggleton, P.: Termites mitigate the effects of drought in tropical rainforest, Science, 363, 174–177, 2019. a
Bandeira, F. and Torres, M.: Abundancia e distribuicao de invertebrados do solo em ecossistemas da Amazonia Central. O papel ecologico dos cupins, Boletim do Museu Paraense Emilio Goeldi Serie Zoologia, 2, 13–38, 1985. a
Bignell, D. E.: Termites as soil engineers and soil processors, in: Intestinal microorganisms of termites and other invertebrates, 183–220, Springer, Berlin, Heidelberg, 2006. a, b
Bignell, D. E.: Termite Ecology in the First Two Decades of the 21st Century: A Review of Reviews, Insects, 10, 60, https://doi.org/10.3390/insects10030060, 2019. a
Bignell, D. E. and Eggleton, P.: Termites in ecosystems, in: Termites: evolution, sociality, symbioses, Ecology, 363–387, Springer, Dordrecht, 2000. a, b, c, d
Bignell, D. E., Eggleton, P., Nunes, L., and Thomas, K. L.: Termites as mediators of carbon fluxes in tropical forest: budgets for carbon dioxide and methane emissions, Forests and insects, 1, 109–134, 1997. a
Bourguignon, T., ŠobotnÍk, J., Lepoint, G., MARTIN, J.-M., Hardy, O. J., Dejean, A., and Roisin, Y.: Feeding ecology and phylogenetic structure of a complex neotropical termite assemblage, revealed by nitrogen stable isotope ratios, Ecol. Entomol., 36, 261–269, 2011. a
Brauman, A., Kane, M. D., Labat, M., and Breznak, J. A.: Genesis of acetate and methane by gut bacteria of nutritionally diverse termites, Science, 257, 1384–1387, 1992. a, b, c, d
Brauman, A., Majeed, M. Z., Buatois, B., Robert, A., Pablo, A.-L., and Miambi, E.: Nitrous oxide (N2O) emissions by termites: does the feeding guild matter?, PloS one, 10, 1–13, https://doi.org/10.1371/journal.pone.0144340, 2015. a, b, c
Brian, M. V. and Brian, M.: Production ecology of ants and termites, Vol. 13, Cambridge University Press, Cambridge, 1978. a, b
Bruhn, D., Møller, I. M., Mikkelsen, T. N., and Ambus, P.: Terrestrial plant methane production and emission, Physiol. Plantarum, 144, 201–209, 2012. a
Brümmer, C., Papen, H., Wassmann, R., and Brüggemann, N.: Fluxes of CH4 and CO2 from soil and termite mounds in south Sudanian savanna of Burkina Faso (West Africa), Global Biogeochem. Cy., 23, GB1001, https://doi.org/10.1029/2008GB003237, 2009a. a, b, c
Brümmer, C., Papen, H., Wassmann, R., and Brüggemann, N.: Termite mounds as hot spots of nitrous oxide emissions in South-Sudanian savanna of Burkina Faso (West Africa), Geophys. Res. Lett., 36, L09814, https://doi.org/10.1029/2009GL037351, 2009b. a
Brune, A.: Methanogenesis in the digestive tracts of insects and other arthropods, Biogenesis of Hydrocarbons. Handbook of Hydrocarbon and Lipid Microbiology, Springer International Publishing, Cham, 1–32, 2018. a, b
Chambers, J. Q., Tribuzy, E. S., Toledo, L. C., Crispim, B. F., Higuchi, N., Santos, J. d., Araújo, A. C., Kruijt, B., Nobre, A. D., and Trumbore, S. E.: Respiration from a tropical forest ecosystem: partitioning of sources and low carbon use efficiency, Ecol. Appl., 14, 72–88, 2004. a, b, c, d
Ciais, P., Sabine, C., Bala, G., Bopp, L., Brovkin, V., Canadell, J., Chhabra, A., DeFries, R., Galloway, J., Heimann, M., Jones, C., Le Quéré, C., Myneni, R. B., Piao, S., and Thornton, P.: Carbon and other biogeochemical cycles, in: Climate change 2013: the physical science basis. Contribution of Working Group I to the Fifth Assessment Report of the Intergovernmental Panel on Climate Change, 465–570, Cambridge University Press, Cambridge, United Kingdom and New York, NY, USA, 2014. a
Clough, T. J., Rochette, P., Thomas, S. M., Pihlatie, M., Christiansen, J. R., and Thorman, R. E.: Global Research Alliance N2O chamber methodology guidelines: Design considerations, J. Environ. Qual., 49, 1081–1091, 2020. a
Conrad, R.: Soil microorganisms as controllers of atmospheric trace gases (H2, CO, CH4, OCS, N2O, and NO), Microbiol. Rev., 60, 609–640, 1996. a
Constantino, R.: Abundance and diversity of termites (Insecta: Isoptera) in two sites of primary rain forest in Brazilian Amazonia, Biotropica, 24, 420–430, 1992. a
Cook, S.: The respiratory gas exchange in Termopsis nevadensis, Biol. Bull., 63, 246–257, 1932. a, b
Dambros, C. S., Morais, J. W., Vasconcellos, A., Souza, J. L., Franklin, E., and Gotelli, N. J.: Association of ant predators and edaphic conditions with termite diversity in an Amazonian rain forest, Biotropica, 48, 237–245, 2016. a, b
Darlington, J. P.: A method for sampling the populations of large termite nests, Ann. Appl. Biol., 104, 427–436, 1984. a
de Araújo, A. C., Ometto, J. P. H. B., Dolman, A. J., Kruijt, B., Waterloo, M. J., and Ehleringer, J. R.: Implications of CO2 pooling on δ13C of ecosystem respiration and leaves in Amazonian forest, Biogeosciences, 5, 779–795, https://doi.org/10.5194/bg-5-779-2008, 2008. a
De Bruyn, L. and Conacher, A. J.: The role of termites and ants in soil modification-a review, Soil Res., 28, 55–93, 1990. a
de Souza, O. F. F. and Brown, V. K.: Effects of habitat fragmentation on Amazonian termite communities, J. Trop. Ecol., 10, 197–206, 1994. a
Eggleton, P.: Global patterns of termite diversity, in: Termites: evolution, sociality, symbioses, ecology, 25–51, Springer, Dordrecht, 2000. a
Eggleton, P. and Tayasu, I.: Feeding groups, lifetypes and the global ecology of termites, Ecol. Res., 16, 941–960, 2001. a
Eggleton, P., Homathevi, R., Jones, D., MacDonald, J., Jeeva, D., Bignell, D., Davies, R., and Maryati, M.: Termite assemblages, forest disturbance and greenhouse gas fluxes in Sabah, East Malaysia, Philos. T. Roy. Soc. B, 354, 1791–1802, 1999. a, b
Fraser, P., Rasmussen, R., Creffield, J., French, J., and Khalil, M.: Termites and global methane – another assessment, J. Atmos. Chem., 4, 295–310, 1986. a, b, c
Gomati, V., Ramasamy, K., Kumar, K., Sivaramaiah, N., and Mula, R.: Green house gas emissions from termite ecosystem, African Journal of Environmental Science and Technology, 5, 56–64, 2011. a
Griffith, D. W. T., Deutscher, N. M., Caldow, C., Kettlewell, G., Riggenbach, M., and Hammer, S.: A Fourier transform infrared trace gas and isotope analyser for atmospheric applications, Atmos. Meas. Tech., 5, 2481–2498, https://doi.org/10.5194/amt-5-2481-2012, 2012. a
Hammer, S., Griffith, D. W. T., Konrad, G., Vardag, S., Caldow, C., and Levin, I.: Assessment of a multi-species in situ FTIR for precise atmospheric greenhouse gas observations, Atmos. Meas. Tech., 6, 1153–1170, https://doi.org/10.5194/amt-6-1153-2013, 2013. a, b, c
Ho, A., Erens, H., Mujinya, B. B., Boeckx, P., Baert, G., Schneider, B., Frenzel, P., Boon, N., and Van Ranst, E.: Termites facilitate methane oxidation and shape the methanotrophic community, Appl. Environ. Microbiol., 79, 7234–7240, 2013. a
Jamali, H., Livesley, S. J., Dawes, T. Z., Cook, G. D., Hutley, L. B., and Arndt, S. K.: Diurnal and seasonal variations in CH4 flux from termite mounds in tropical savannas of the Northern Territory, Australia, Agr. Forest Meteorol., 151, 1471–1479, 2011a. a, b, c
Jamali, H., Livesley, S. J., Dawes, T. Z., Hutley, L. B., and Arndt, S. K.: Termite mound emissions of CH4 and CO2 are primarily determined by seasonal changes in termite biomass and behaviour, Oecologia, 167, 525–534, 2011b. a, b
Jamali, H., Livesley, S. J., Hutley, L. B., Fest, B., and Arndt, S. K.: The relationships between termite mound emissions and internal concentration ratios are species specific, Biogeosciences, 10, 2229–2240, https://doi.org/10.5194/bg-10-2229-2013, 2013. a, b, c, d, e
Jones, D. T. and Eggleton, P.: Global biogeography of termites: a compilation of sources, in: Biology of termites: a modern synthesis, 477–498, Springer, Dordrecht, 2010. a
Jones, D. T., Verkerk, R. H., and Eggleton, P.: Methods for sampling termites, Insect sampling in forest ecosystems, 221–253, Blackwell Science Ltd, Hoboken, New Jersey, 2005. a, b, c, d
Josens, G. and Soki, K.: Relation between termite numbers and the size of their mounds, Insect. Soc., 57, 303–316, 2010. a, b
Khalil, M., Rasmussen, R., French, J., and Holt, J.: The influence of termites on atmospheric trace gases: CH4, CO2, CHCl3, N2O, CO, H2, and light hydrocarbons, J. Geophys. Res.-Atmos., 95, 3619–3634, 1990. a, b, c, d, e, f, g, h, i
Kirschke, S., Bousquet, P., Ciais, P., Saunois, M., Canadell, J. G., Dlugokencky, E. J., Bergamaschi, P., Bergmann, D., Blake, D. R., Bruhwiler, L., and Cameron-Smith, P.: Three decades of global methane sources and sinks, Nat. Geosci., 6, 813–823, 2013. a, b, c, d, e, f, g
Kisselle, K. W., Zepp, R. G., Burke, R. A., de Siqueira Pinto, A., Bustamante, M. M., Opsahl, S., Varella, R. F., and Viana, L. T.: Seasonal soil fluxes of carbon monoxide in burned and unburned Brazilian savannas, J. Geophys. Res.-Atmos., 107, 8051, https://doi.org/10.1029/2001JD000638, 2002. a
Konaté, S., Roux, X. L., Verdier, B., and Lepage, M.: Effect of underground fungus-growing termites on carbon dioxide emission at the point-and landscape-scales in an African savanna, Funct. Ecol., 17, 305–314, 2003. a
Krishna, K. and Araujo, R.: A revision of the neotropical termite genus Neocapritermes (Isoptera, Termitidae, Termitinae), B. Am. Mus. Nat. Hist., 138, 3, 1968. a
Lee, H., Rahn, T., and Throop, H.: An accounting of C-based trace gas release during abiotic plant litter degradation, Glob. Change Biol., 18, 1185–1195, 2012. a
Lee, K. E. and Wood, T. G.: Termites and soils, in: Termites and soils, Academic Press, London, 1971. a
Lepage, M. and Darlington, J. P.: Population dynamics of termites, in: Termites: evolution, sociality, symbioses, Ecology, 333–361, Springer, Dordrecht, 2000. a, b, c
Liu, L., Zhuang, Q., Zhu, Q., Liu, S., van Asperen, H., and Pihlatie, M.: Global soil consumption of atmospheric carbon monoxide: an analysis using a process-based biogeochemistry model, Atmos. Chem. Phys., 18, 7913–7931, https://doi.org/10.5194/acp-18-7913-2018, 2018. a
Luizão, R. C., Luizão, F. J., Paiva, R. Q., Monteiro, T. F., Sousa, L. S., and Kruijt, B.: Variation of carbon and nitrogen cycling processes along a topographic gradient in a central Amazonian forest, Glob. Change Biol., 10, 592–600, 2004. a, b
Macdonald, J., Jeeva, D., Eggleton, P., Davies, R., Bignell, D., Fowler, D., Lawton, J., and Maryati, M.: The effect of termite biomass and anthropogenic disturbance on the CH4 budgets of tropical forests in Cameroon and Borneo, Glob. Change Biol., 5, 869–879, 1999. a, b
Macdonald, J. A., Eggleton, P., Bignell, D. E., Forzi, F., and Fowler, D.: Methane emission by termites and oxidation by soils, across a forest disturbance gradient in the Mbalmayo Forest Reserve, Cameroon, Glob. Change Biol., 4, 409–418, 1998. a, b, c, d
Martius, C., Waßmann, R., Thein, U., Bandeira, A., Rennenberg, H., Junk, W., and Seiler, W.: Methane emission from wood-feeding termites in Amazonia, Chemosphere, 26, 623–632, 1993. a, b, c, d, e, f, g, h, i, j, k
Martius, C., Fearnside, P. M., Bandeira, A. G., and Wassmann, R.: Deforestation and methane release from termites in Amazonia, Chemosphere, 33, 517–536, 1996. a
Mishra, S. and Sen-Sarma, P.: Humic acids in faecal matter, nest material and fungus comb of termites, B. Entomol., 21, 122–125, 1980. a
Moura, V. S. d.: Investigação da variação espacial dos fluxos de metano no solo em floresta de terra firme na Amazônia Central, MSc thesis, INPA/UEA, Manaus, Brazil, 2012. a
Nauer, P. A., Hutley, L. B., and Arndt, S. K.: Termite mounds mitigate half of termite methane emissions, P. Natl. Acad. Sci. USA, 115, 13306–13311, 2018. a, b
Noirot, C. and Darlington, J. P.: Termite nests: architecture, regulation and defence, in: Termites: evolution, sociality, symbioses, ecology, 121–139, Springer, Dordrecht, 2000. a, b
Ohiagu, C. and Wood, T.: A method for measuring rate of grass-harvesting by Trinervitermes geminatus (Wasmann)(Isoptera, Nasutitermitinae) and observation on its foraging behaviour in Southern Guinea Savanna, Nigeria, J. Appl. Ecol., 13, 705–713, 1976. a
Oliveira, J. R. A. d.: Padrões de distribuição e variação temporal de térmitas (Blattodea: Isoptera): uso como bioindicadores na amazônia central, thesis, INPA, Manaus, Brazil, 2016. a
Pangala, S. R., Hornibrook, E. R., Gowing, D. J., and Gauci, V.: The contribution of trees to ecosystem methane emissions in a temperate forested wetland, Glob. Change Biol., 21, 2642–2654, 2015. a
Pataki, D., Ehleringer, J., Flanagan, L., Yakir, D., Bowling, D., Still, C., Buchmann, N., Kaplan, J., and Berry, J.: The application and interpretation of Keeling plots in terrestrial carbon cycle research, Global Biogeochem. Cy., 17, 1022, https://doi.org/10.1029/2001GB001850, 2003. a
Pequeno, P. A., Baccaro, F. B., Souza, J. L., and Franklin, E.: Ecology shapes metabolic and life history scalings in termites, Ecol. Entomol., 42, 115–124, 2017. a
Pequeno, P. A. L.: Negative effects of Azteca ants on the distribution of the termite Neocapritermes braziliensis in central Amazonia, Sociobiology, 59, 893–902, 2014. a
Pequeno, P. A. L., Franklin, E., Venticinque, E. M., and Serrao Acioli, A. N.: The scaling of colony size with nest volume in termites: a role in population dynamics?, Ecol. Entomol., 38, 515–521, 2013. a, b, c, d, e, f, g, h, i, j
Pester, M., Tholen, A., Friedrich, M. W., and Brune, A.: Methane oxidation in termite hindguts: absence of evidence and evidence of absence, Appl. Environ. Microbiol., 73, 2024–2028, 2007. a
Potter, C. S., Klooster, S. A., and Chatfield, R. B.: Consumption and production of carbon monoxide in soils: a global model analysis of spatial and seasonal variation, Chemosphere, 33, 1175–1193, 1996. a
Queiroz, J. M. T. d.: Fluxo de metano em cupinzeiros epígeos em florestas e ambientes alterados na Amazônia Central, MSc thesis INPA/UFAM, 2004. a, b, c
Querino, C. A. S., Smeets, C. J. P. P., Vigano, I., Holzinger, R., Moura, V., Gatti, L. V., Martinewski, A., Manzi, A. O., de Araújo, A. C., and Röckmann, T.: Methane flux, vertical gradient and mixing ratio measurements in a tropical forest, Atmos. Chem. Phys., 11, 7943–7953, https://doi.org/10.5194/acp-11-7943-2011, 2011. a, b
Quesada, C. A., Lloyd, J., Schwarz, M., Patiño, S., Baker, T. R., Czimczik, C., Fyllas, N. M., Martinelli, L., Nardoto, G. B., Schmerler, J., Santos, A. J. B., Hodnett, M. G., Herrera, R., Luizão, F. J., Arneth, A., Lloyd, G., Dezzeo, N., Hilke, I., Kuhlmann, I., Raessler, M., Brand, W. A., Geilmann, H., Moraes Filho, J. O., Carvalho, F. P., Araujo Filho, R. N., Chaves, J. E., Cruz Junior, O. F., Pimentel, T. P., and Paiva, R.: Variations in chemical and physical properties of Amazon forest soils in relation to their genesis, Biogeosciences, 7, 1515–1541, https://doi.org/10.5194/bg-7-1515-2010, 2010. a, b
Reuß, J., Rachel, R., Kämpfer, P., Rabenstein, A., Küver, J., Dröge, S., and König, H.: Isolation of methanotrophic bacteria from termite gut, Microbiol. Res., 179, 29–37, 2015. a
Ribeiro, J.: Ecologia de Labiotermes labralis (Isoptera: Termitidae) em Floresta e Terra firme na Amazônia, PhD thesis, Dissertation, Manaus, INPA/FUA, 1997. a
Rice, A. L., Butenhoff, C. L., Shearer, M. J., Teama, D., Rosenstiel, T. N., and Khalil, M. A. K.: Emissions of anaerobically produced methane by trees, Geophys. Res. Lett., 37, L03807, https://doi.org/10.1029/2009GL041565, 2010. a
Rouland, C., Brauman, A., Labat, M., and Lepage, M.: Nutritional factors affecting methane emission from termites, Chemosphere, 26, 617–622, 1993. a, b
Sanderson, M.: Biomass of termites and their emissions of methane and carbon dioxide: A global database, Global Biogeochem. Cy., 10, 543–557, 1996. a, b, c, d, e, f
Sands, W.: Mound population movements and fluctuations inTrinervitermes ebenerianus Sjöstedt (Isoptera, termitidæ, nasutitermitinæ), Insectes Sociaux, 12, 49–58, 1965. a
Saunois, M., Stavert, A. R., Poulter, B., Bousquet, P., Canadell, J. G., Jackson, R. B., Raymond, P. A., Dlugokencky, E. J., Houweling, S., Patra, P. K., Ciais, P., Arora, V. K., Bastviken, D., Bergamaschi, P., Blake, D. R., Brailsford, G., Bruhwiler, L., Carlson, K. M., Carrol, M., Castaldi, S., Chandra, N., Crevoisier, C., Crill, P. M., Covey, K., Curry, C. L., Etiope, G., Frankenberg, C., Gedney, N., Hegglin, M. I., Höglund-Isaksson, L., Hugelius, G., Ishizawa, M., Ito, A., Janssens-Maenhout, G., Jensen, K. M., Joos, F., Kleinen, T., Krummel, P. B., Langenfelds, R. L., Laruelle, G. G., Liu, L., Machida, T., Maksyutov, S., McDonald, K. C., McNorton, J., Miller, P. A., Melton, J. R., Morino, I., Müller, J., Murguia-Flores, F., Naik, V., Niwa, Y., Noce, S., O'Doherty, S., Parker, R. J., Peng, C., Peng, S., Peters, G. P., Prigent, C., Prinn, R., Ramonet, M., Regnier, P., Riley, W. J., Rosentreter, J. A., Segers, A., Simpson, I. J., Shi, H., Smith, S. J., Steele, L. P., Thornton, B. F., Tian, H., Tohjima, Y., Tubiello, F. N., Tsuruta, A., Viovy, N., Voulgarakis, A., Weber, T. S., van Weele, M., van der Werf, G. R., Weiss, R. F., Worthy, D., Wunch, D., Yin, Y., Yoshida, Y., Zhang, W., Zhang, Z., Zhao, Y., Zheng, B., Zhu, Q., Zhu, Q., and Zhuang, Q.: The Global Methane Budget 2000–2017, Earth Syst. Sci. Data, 12, 1561–1623, https://doi.org/10.5194/essd-12-1561-2020, 2020. a, b, c, d, e, f, g, h
Sawadogo, J., Traoré, A., and Dianou, D.: Émissions de dioxyde de carbone et de méthane des termitières de Macrotermes bellicosus au Burkina Faso, Int. J. Biol. Chem. Sci., 6, 1223–1232, https://doi.org/10.4314/ijbcs.v6i3.26, 2012. a
Sawadogo, J. B., Dianou, D., and Traoré, A. S.: Effects of temperature and termite' substrate on methane and carbon dioxide emissions from Macrotermes bellicosus and Microcerotermes dubius cultures, Int. J. Biol. Chem. Sci., 9, 75–83, 2011. a, b, c
Seiler, W., Conrad, R., and Scharffe, D.: Field studies of methane emission from termite nests into the atmosphere and measurements of methane uptake by tropical soils, J. Atmos. Chem., 1, 171–186, 1984. a, b, c, d, e, f, g, h
Souza, J. S. d.: Dinâmica espacial e temporal do fluxo de CO2 do solo em floresta de terra firme na Amazônia Central, thesis, INPA, Manaus, Brazil, 2005. a
Sugimoto, A., Inoue, T., Kirtibutr, N., and Abe, T.: Methane oxidation by termite mounds estimated by the carbon isotopic composition of methane, Global Biogeochem. Cy., 12, 595–605, 1998a. a, b, c, d
Sugimoto, A., Inoue, T., Tayasu, I., Miller, L., Takeichi, S., and Abe, T.: Methane and hydrogen production in a termite-symbiont system, Ecol. Res., 13, 241–257, 1998b. a
Sugimoto, A., Bignell, D. E., and MacDonald, J. A.: Global impact of termites on the carbon cycle and atmospheric trace gases, in: Termites: evolution, sociality, symbioses, ecology, 409–435, Springer, Dordrecht, 2000. a
Sun, W., Kooijmans, L. M. J., Maseyk, K., Chen, H., Mammarella, I., Vesala, T., Levula, J., Keskinen, H., and Seibt, U.: Soil fluxes of carbonyl sulfide (COS), carbon monoxide, and carbon dioxide in a boreal forest in southern Finland, Atmos. Chem. Phys., 18, 1363–1378, https://doi.org/10.5194/acp-18-1363-2018, 2018. a
van Asperen, H. L. and Alves-Oliveira, J. R.: Termite methane emissions, measured in the Amazon rainforest [Data set], Zenodo, https://doi.org/10.5281/zenodo.4697271, 2021. a
Wang, Y., Chen, H., Zhu, Q., Peng, C., Wu, N., Yang, G., Zhu, D., Tian, J., Tian, L., Kang, X., Wang, Y., Chen, H., Zhu, Q., Peng, C., Wu, N., Yang, G., Zhu, D., Tian, J., Tian, L., Kang, X., and He, Y.: Soil methane uptake by grasslands and forests in China, Soil Biol. Biochem., 74, 70–81, 2014. a
Whalen, S. and Reeburgh, W.: Carbon monoxide consumption in upland boreal forest soils, Soil Biol. Biochem., 33, 1329–1338, 2001. a
Wood, T.: Termites and the soil environment, Biol. Fert. Soils, 6, 228–236, 1988. a, b, c, d
Yonemura, S., Kawashima, S., and Tsuruta, H.: Carbon monoxide, hydrogen, and methane uptake by soils in a temperate arable field and a forest, J. Geophys. Res.-Atmos., 105, 14347–14362, 2000a. a
Yonemura, S., Yokozawa, M., Kawashima, S., and Tsuruta, H.: Model analysis of the influence of gas diffusivity in soil on CO and H2 uptake, Tellus B, 52, 919–933, 2000b. a
Zanchi, F. B., Meesters, A. G., Kruijt, B., Kesselmeier, J., Luizão, F. J., and Dolman, A. J.: Soil CO2 exchange in seven pristine Amazonian rain forest sites in relation to soil temperature, Agr. Forest Meteorol., 192, 96–107, 2014. a, b, c
Zimmerman, P., Greenberg, J., Wandiga, S., and Crutzen, P.: Termites: a potentially large source of atmospheric methane, carbon dioxide, and molecular hydrogen, Science, 218, 563–565, 1982. a, b, c, d
The species Neocapritermes brasiliensis is a wood–soil interface feeding species. Species feeding on extremely decomposed wood are in the centre of the “wood–soil decomposition gradient” termite classification (Bourguignon et al., 2011), but are classified as soil feeders according to Eggleton and Tayasu (2001).
Kirschke et al. (2013) and Saunois et al. (2020) stated a termite emission factor of 2.8 (±1.0) mg CH4 (g). Correspondence with the authors clarified that a termite emission factor of 2.8 (±1.0) µg CH4 (g h−1) was meant.