the Creative Commons Attribution 4.0 License.
the Creative Commons Attribution 4.0 License.
 | 19 Sep 2023
Acquiring high-resolution wind measurements by modifying radiosonde sounding procedures
Michael Gerding
Torsten Köpnick
High-resolution wind measurements are crucial for the understanding of dynamic processes in the atmosphere. In the troposphere and lower stratosphere, radiosondes provide a good vertical resolution of a few metres, but the wind data are usually low-pass filtered by the manufacturer in order to suppress disturbances in the data caused by the spurious motions of the sonde. As an example, the filter within the standard processing of Vaisala radiosondes becomes effective at vertical scales below 300 m for an ascent rate of 5 m s−1.
We describe a method for increasing the usable resolution of radiosonde wind measurements. The main ideas are to avoid self-induced motions of the balloon by keeping it in the subcritical Reynolds number range, to avoid typical pendulum motions of a 15 s period by using a shorter string, and to use data from a descending balloon in order to avoid disturbances from the wake of the balloon affecting temperature and humidity measurements due to the decreased string length. We demonstrate that our changes in hardware and software allow for artefact-free wind data down to scales of 50 m, while the remaining disturbances on even smaller scales are removed. Accordingly, the usable resolution of the wind data has been increased by a factor of 6, compared to the standard data output, at relatively low cost.
- Article
(4748 KB) - Full-text XML
- BibTeX
- EndNote


Radiosondes play an important role in numerical weather prediction when collecting in the pool of assimilated wind measurements (e.g. Candy et al., 2021). Besides their use in everyday weather forecasting, they are also used for detailed process studies like the mountain wave case study by Bramberger et al. (2017). For these types of case studies, there is a measurement gap between standard radiosonde wind observations that are reliable on vertical scales larger than ∼300 m and ultra-fine-resolution, balloon-borne turbulence measurements (e.g. Söder et al., 2019; Theuerkauf et al., 2011). We propose modifications to standard radiosondes that allow this gap to be bridged, while keeping the relative flexibility of radiosonde operation compared to radars or research aircraft.
While small-scale three-dimensional turbulent motions will still need more specialized instrumentation to be measured, we aim to improve the measurement capabilities on typical scales of stratified turbulence and below (e.g. Lilly, 1983). This new method will be capable of measuring wind fluctuations at the outer scale of turbulence, i.e. on vertical scales larger than 50 m.
In our study, we concentrate on horizontal wind measurements. Vertical winds can be derived from the ascent rate measurement of the balloon. However, these retrievals are subject to comparatively large measurement uncertainties and exceed the scope of this study (Söder et al., 2019; Wang et al., 2009).
The general approach for horizontal wind measurements from radiosondes is to use an ascending sounding balloon as a passive tracer. These measurements are affected by several kinds of disturbances. In the past, wind-finding accuracy was often limited by the angular measurement that used radio theodolites on the ground to track the radiosonde or its radar reflector (e.g. Houchi et al., 2015). Modern radiosondes, however, are equipped with accurate differential GPS sensors to measure their position. They allow tracking of the horizontal velocity of the radiosonde, resulting in a typical wind speed uncertainty of 0.15 m s−1 (Vaisala, 2013). With this low uncertainty, other influences on the wind finding become more important.
The shape of a sounding balloon in flight is similar to a sphere. This allows the assessment of the flow conditions around the balloon from the Reynolds number (Re), based on laboratory experiments such as those performed by Norman and McKeon (2011), Taneda (1978), and Achenbach (1974). Generally, it is assumed that the radiosonde follows the horizontal wind at each height. However, for critical and supercritical flow conditions around the balloon, it is subject to lateral motions. This is the case because, under these conditions, the flow will not follow the spherical shape of the balloon but will detach from the balloon downstream of its largest circumference. This detachment is usually not perfectly symmetrical, leading to so-called self-induced horizontal motions of the balloon. They distort the wind measurements and were therefore extensively studied in the 1960s, when the interest in precise stratospheric wind measurements emerged within the USA's Apollo program (e.g. Scoggins, 1967; MacCready, 1965; Scoggins, 1965).
Furthermore, movements of the radiosonde below the balloon reduce the wind measurement accuracy because the radiosonde is in a coupled system with its carrier balloon. This coupled system acts like a pendulum with a moving pivot. The pendulum motions can be conical or planar, depending on the excitation (Ingleby et al., 2022). They are driven by the above-mentioned self-induced motions and by strong vertical wind shears. The frequency of these pendulum motions can be approximated using the length of the string between the balloon and the radiosonde. A shorter string increases the pendulum frequency, thereby allowing for a higher-resolution evaluation of the wind data. On the other hand, temperature and humidity measurements are affected by the balloon's wake (e.g. Luers and Eskridge, 1998; Tiefenau and Gebbeken, 1989), which can be counteracted by lengthening the balloon–radiosonde distance (Söder et al., 2019).
These different disturbances inhibit the use of radiosonde wind data at spatial resolutions higher than a few hundred metres. Temporal averaging or spectral smoothing of the data are often applied by modern radiosonde sounding software in order to mitigate the effects for standard data products. Dirksen et al. (2014), for example, use low-pass filtering with a cut-off period of 40 s for the Global Climate Observing System (GCOS) Reference Upper-Air Network (GRUAN) data processing. According to Ingleby et al. (2022), this is similar to the standard RS92 and RS41 data processing by Vaisala. By using this low-pass filtering, the wind speed uncertainty is down to 0.15 m s−1, as specified for the Vaisala RS41 radiosonde (Vaisala, 2017).
Accordingly, the research questions of our study are as follows: how can we mitigate the above-mentioned instrumental effects on radiosonde wind measurements without removing the small scales with a filter? What are the smallest scales at which reliable wind measurements are possible?
To answer these questions, we identify three main factors that limit the accuracy of radiosonde wind measurements on small spatial scales in Sect. 2. Each of these instrumental effects will be presented alongside countermeasures that reduce the impact on the measurement. This is followed by a presentation of the technical changes to the sounding set-up in Sect. 3 and a discussion of the measures and results in Sect. 4. In closing, we present the conclusions from our findings.
As stated above, we present the three main factors that limit the accuracy of radiosonde wind data on small scales along with countermeasures that reduce their impact. They will be demonstrated using two radiosonde launches performed on 28 February 2022 from the Leibniz Institute of Atmospheric Physics in Kühlungsborn, Germany (54.12∘ N, 11.77∘ E). The first launch features all of the improvements to the sounding set-up described in this paper (launched at 11:55 UT). The second is a standard radiosonde Vaisala RS41-SG launched at 15:21 UT. Both launches were conducted using standard radiosonde balloons with a weight of 500 g (Totex TX500). Two other soundings of the advanced set-up show essentially the same results. Their results are presented in Dusch et al. (2023) but will be omitted here for clarity. We use Vaisala sondes because it is the standard system at our institute, and they are commonly used by weather services worldwide. However, the effects shown in this study also apply to radiosondes from other manufacturers (e.g. Sippican, Graw, and Meisei).
The measured profile from the standard radiosonde reaches from the ground up to 30.7 km. However, the enhanced radiosonde set-up only covers altitudes between 7.7 and 14.9 km. This was the case because it has been measured on a descending balloon that is harder to operate, and it did not reach the intended top altitude of 20 km. Furthermore, we lost radio communication at an altitude of 7.7 km due to obstacles in the line of sight. Nevertheless, we experienced all relevant flow conditions and are able to demonstrate the improvements of the enhanced set-up.
In Fig. 1, we present zonal and meridional winds from both soundings that were introduced above in the standard resolution as output by the Vaisala DigiCORA radiosonde receiving station (software MW41 version 2.11.0). Temperature and humidity measurements are omitted because they are not relevant here. Both profiles show calm geophysical conditions, with no sharp changes in wind speed, except in the planetary boundary layer. The maximum horizontal wind speed does not exceed 13 m s−1 in the troposphere and is below 26 m s−1 above.
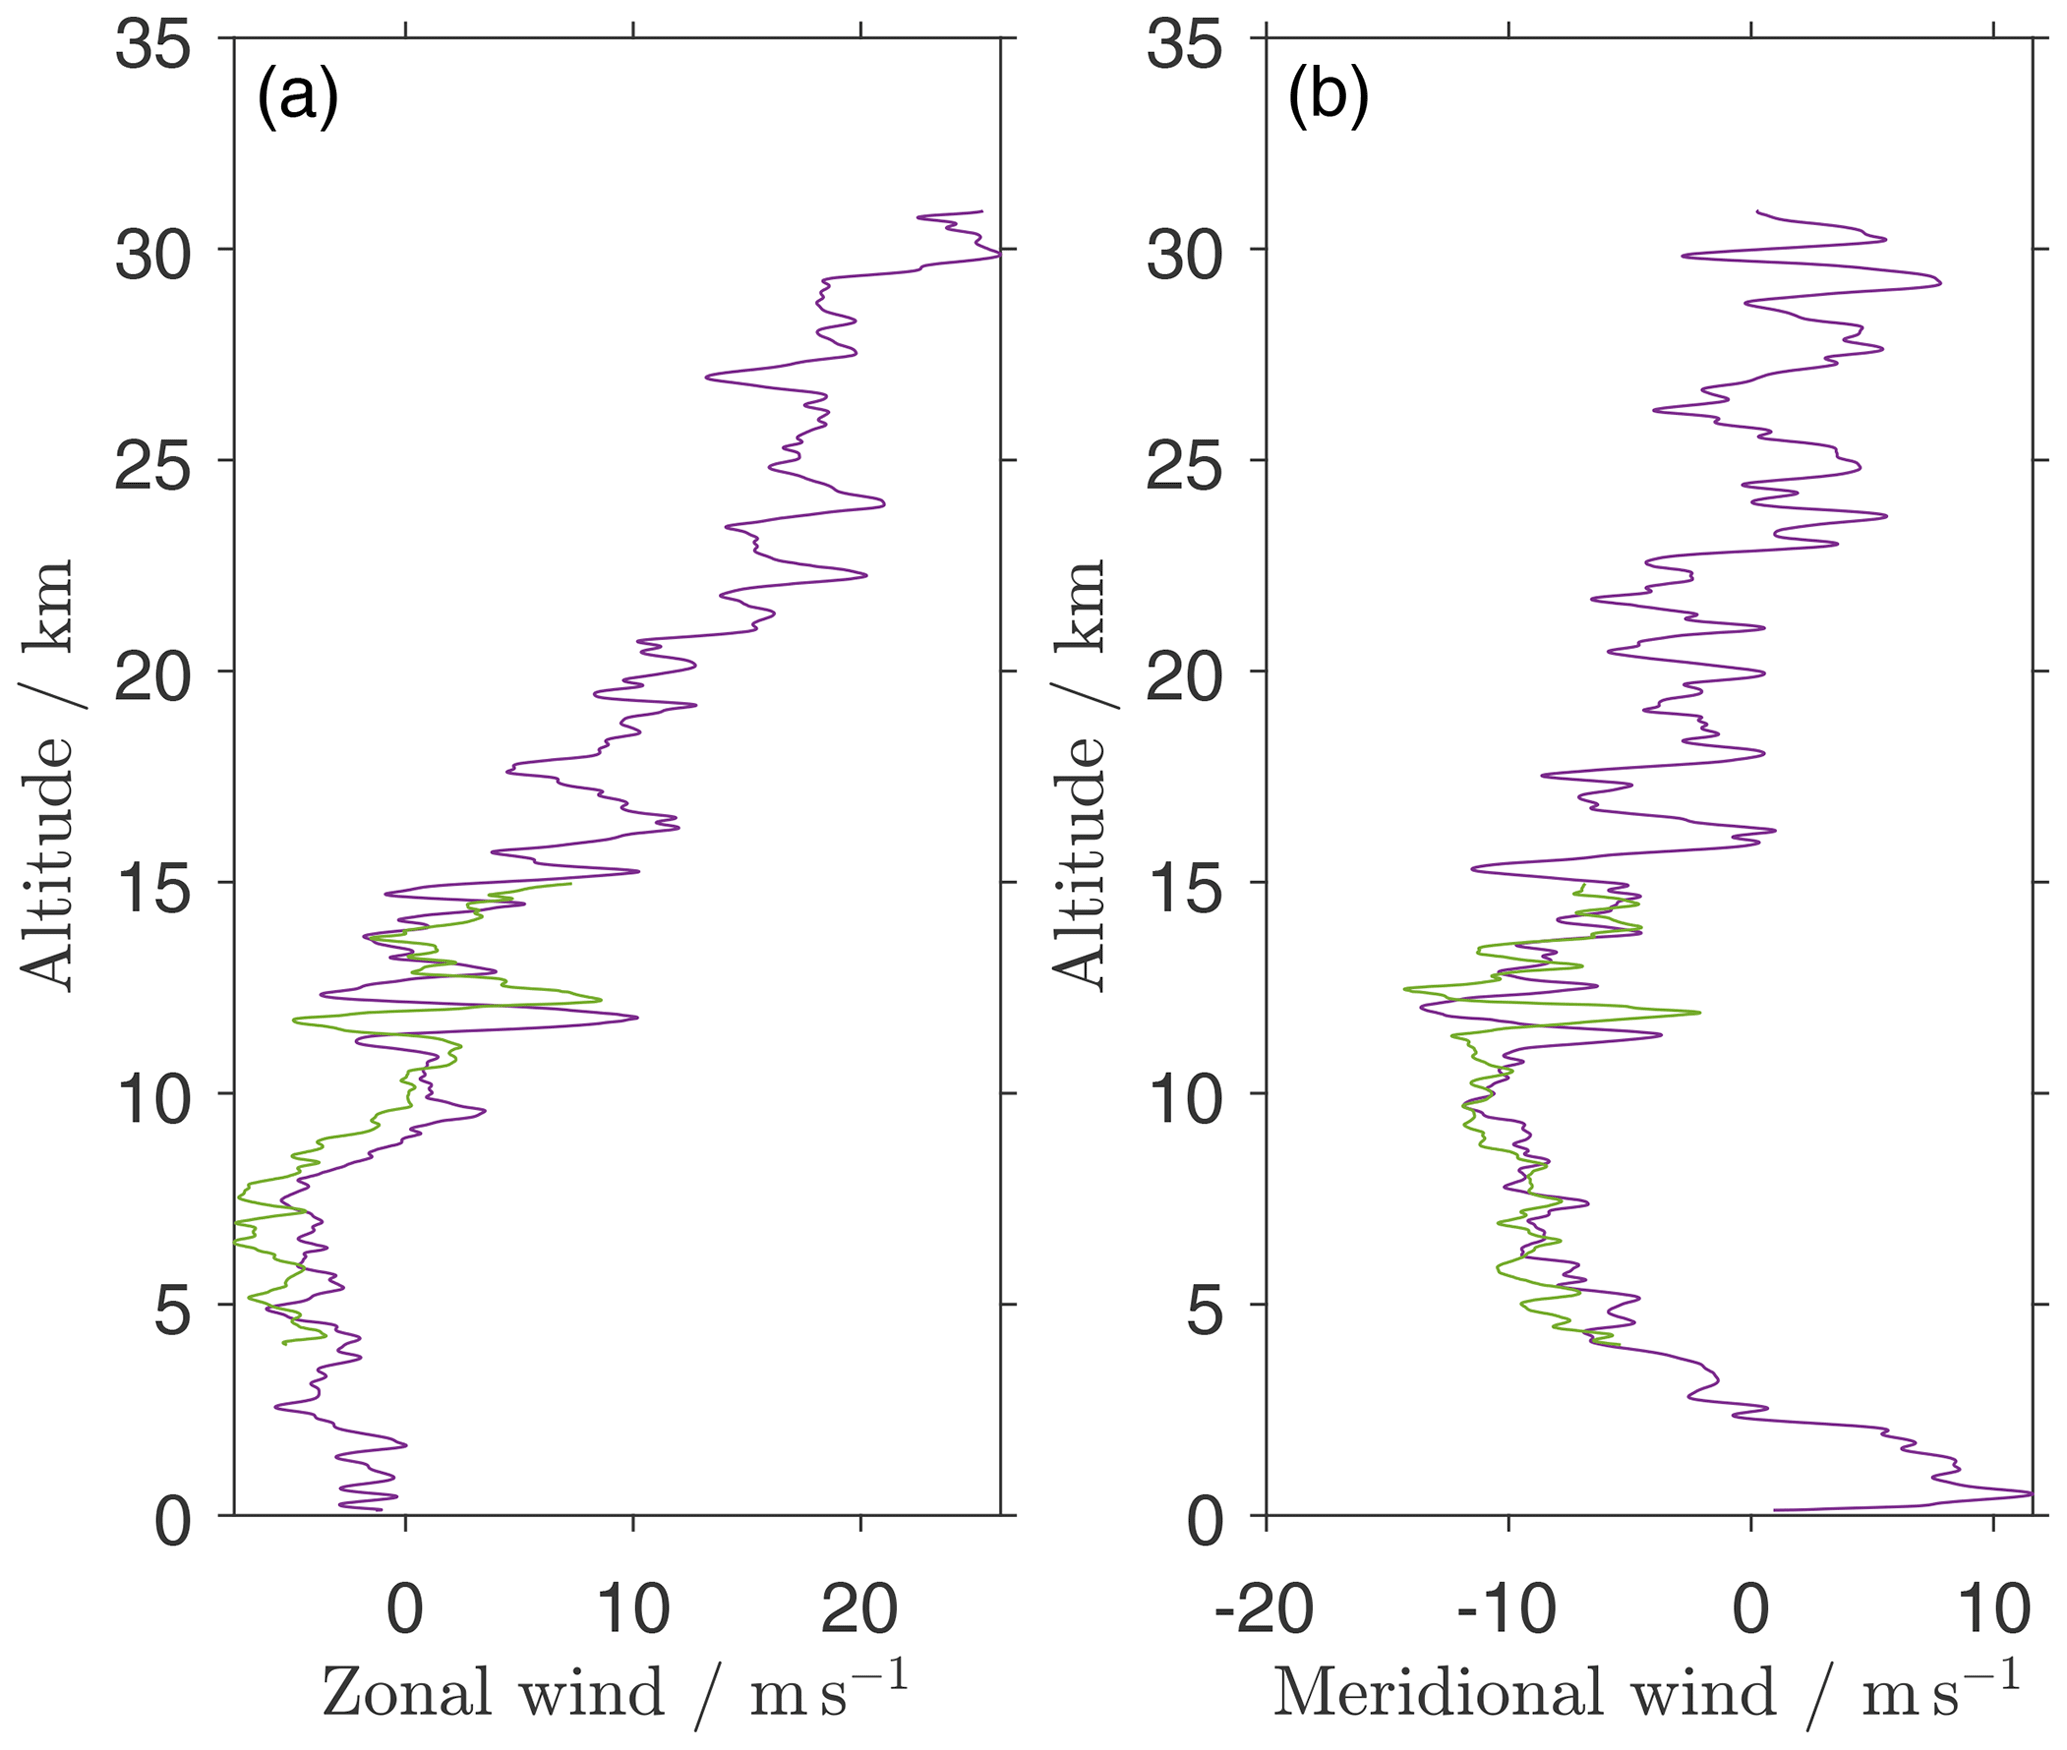
Figure 1Zonal (a) and meridional (b) wind profiles. The purple lines show data from a standard Vaisala RS41-SG radiosonde, and the green lines are from the enhanced sounding set-up presented in this paper. Both profiles show the standard output of the Vaisala sounding system.
These calm conditions are ideal for our comparison of the two sounding set-ups. Due to the lack of jets, fronts, and other mesoscale features, we can expect the differences in the small-scales wind spectra between both soundings to be overwhelmingly caused by the technical differences between both sounding set-ups.
For a technical description of the new radiosonde payload design, please see Sect. 3.
2.1 Create an unfiltered data output
Horizontal wind measurements with radiosondes are done using the sounding balloon as a passive tracer, which measures its horizontal displacement by differential GPS. In Fig. 2, we demonstrate the effect of the low-pass filtering, as presented in the Introduction, using the conventional ascent of a Vaisala RS41-SG. In this figure, we show the zonal wind fluctuations and the power spectral densities (PSDs) of these data. The power spectrum has been calculated using the Lomb–Scargle method. This allows the data-processing routine to deal with missing data points. The power spectral densities have been Hann-filtered in the log space in order to enhance the visibility of certain features.
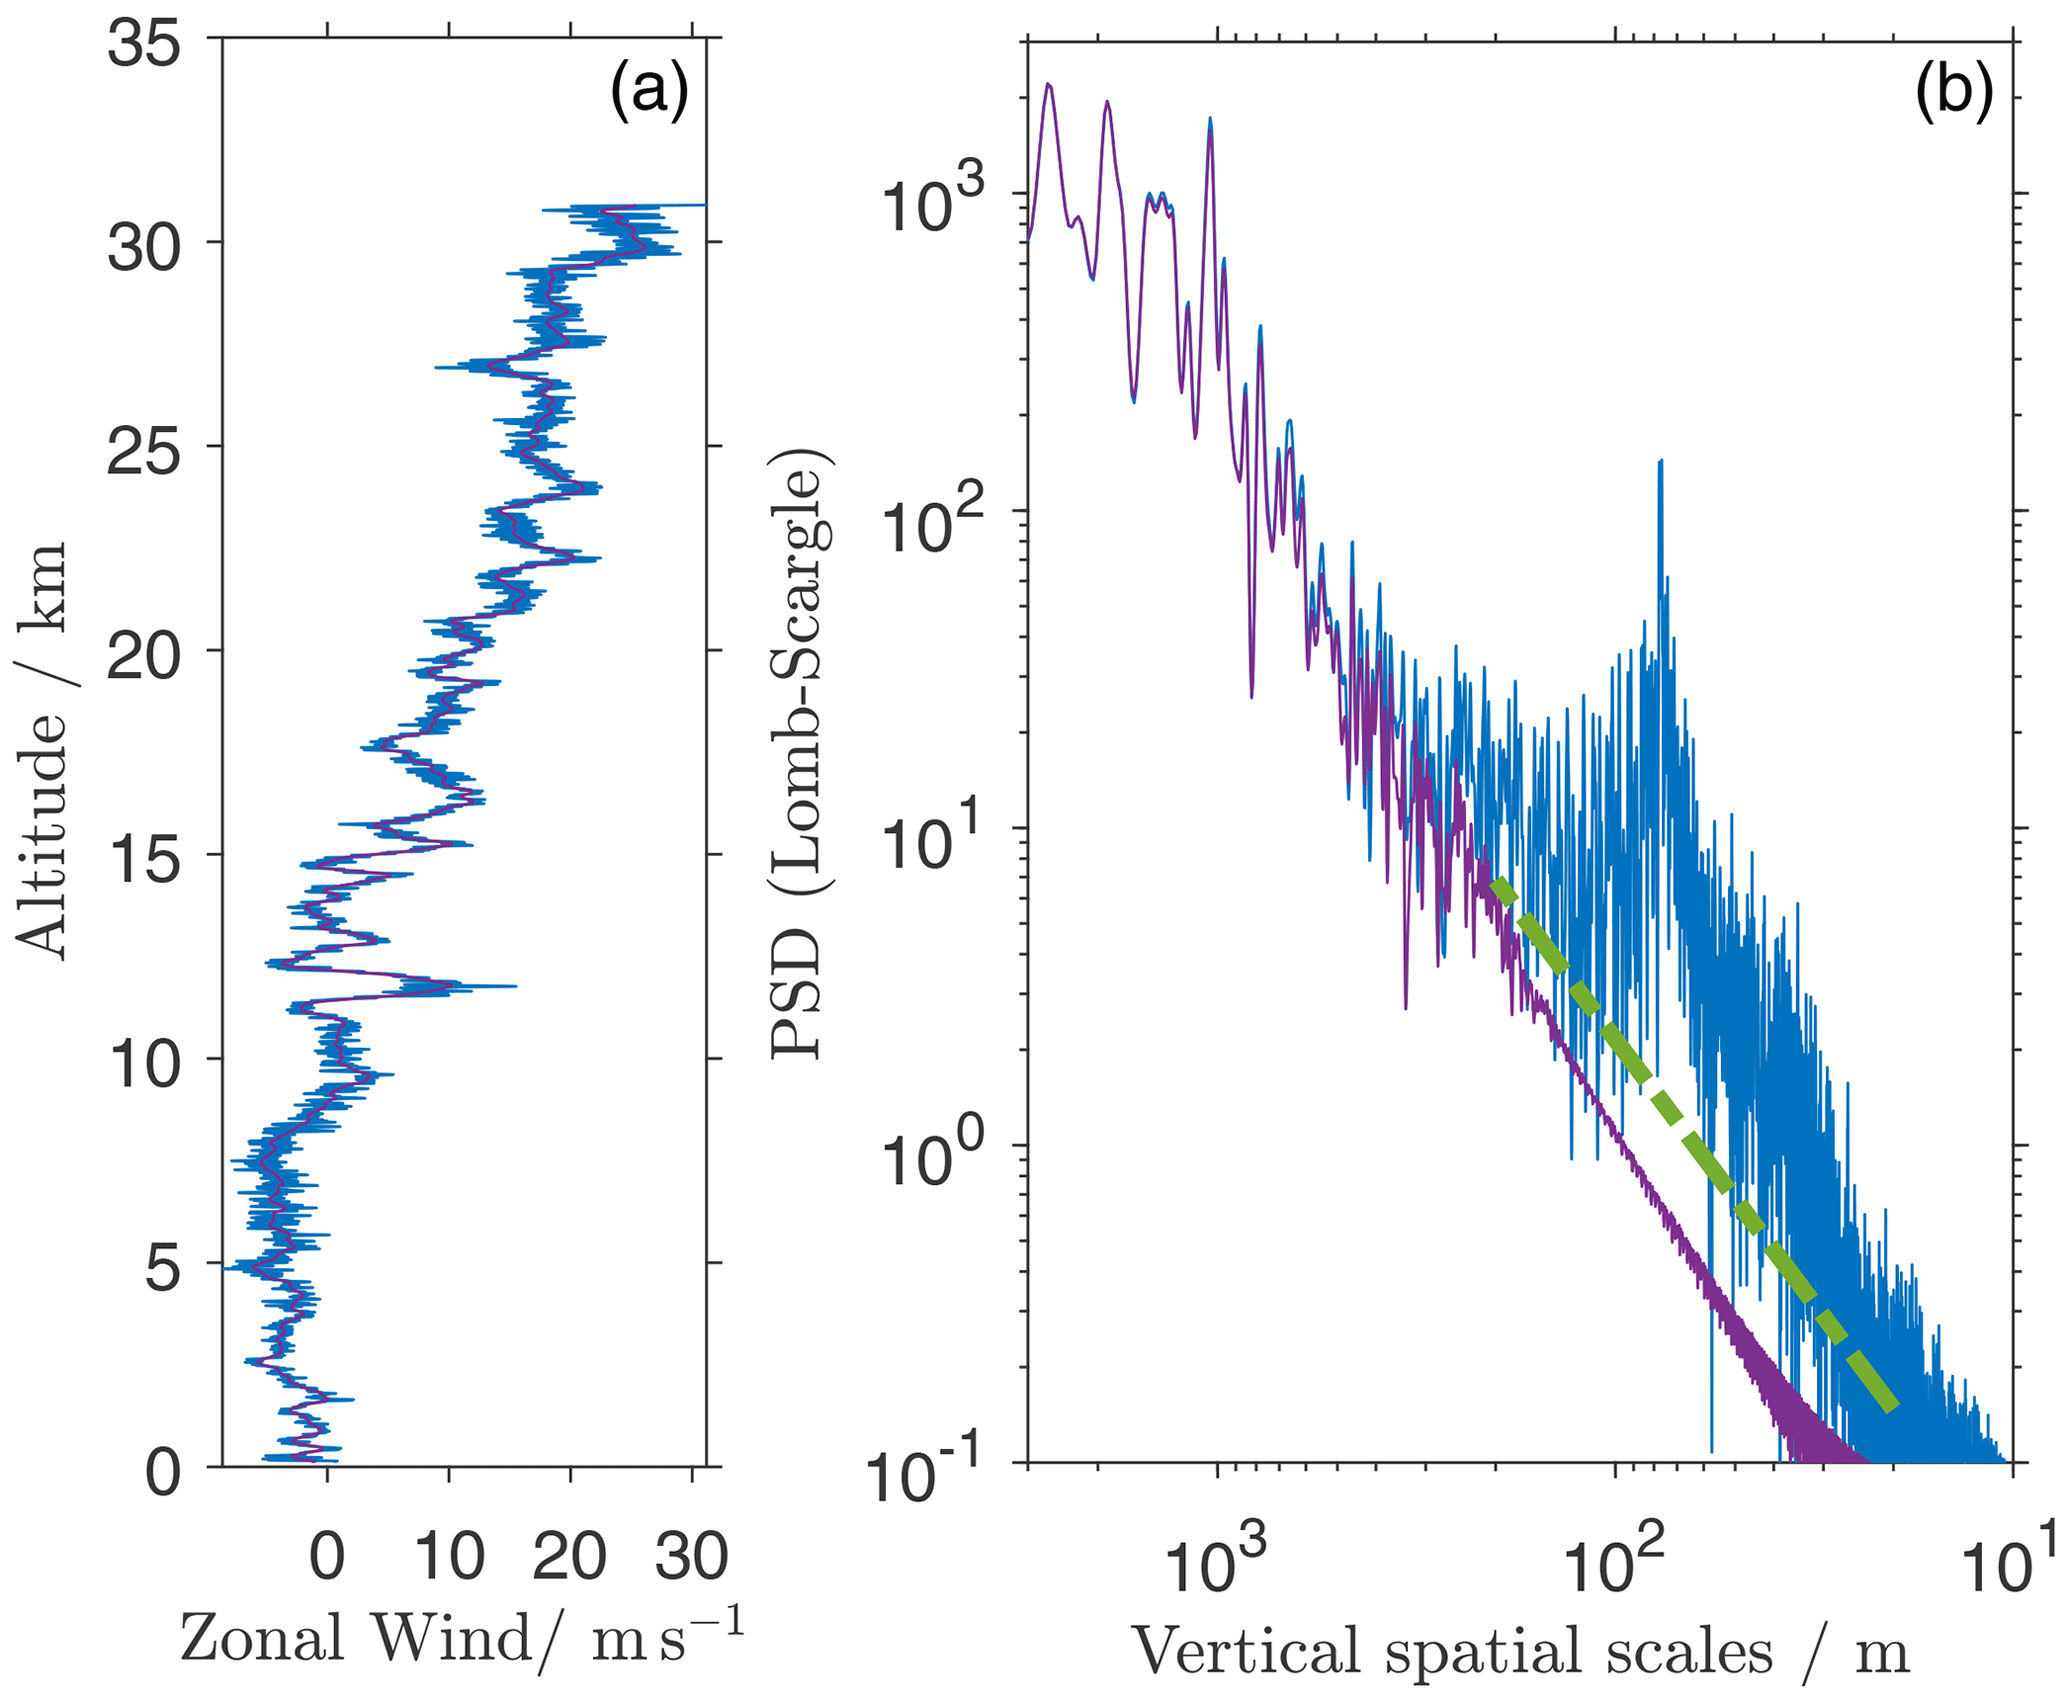
Figure 2Zonal wind measured using the standard radiosonde configuration. (a) Raw data. (b) Lomb–Scargle power spectral density. Purple lines show the standard wind output as given by Vaisala, and blue lines show the unfiltered output calculated according to Appendix A. The green line denotes the power law relationship.
The altitude plot of the wind data in Fig. 2 clearly shows that the standard output lacks higher-frequency variations. From the PSD data, it is evident that the standard output is increasingly damped at vertical spatial scales smaller than ∼ 300 m (corresponding to timescales smaller than ∼ 67 s).
Therefore, an unsmoothed wind data output is needed for higher-resolution evaluation of the data. We created this by calculating the horizontal drift of the sounding balloon from the raw GPS positions of the radiosonde. A more detailed description for the Vaisala MW41 sounding system is given in Appendix A and shown by a blue line in Fig. 2. Please note that even though we call this the high-resolution data due to the lack of low-pass filtering, both data sets have an output rate of 1 s−1. The unfiltered data in Fig. 2b clearly show that there is a lot of power in these higher frequencies that are usually damped by the radiosonde receiving system.
For atmospheric fluctuations, a slope in the power spectrum is expected at these scales smaller than the outer scale of turbulence L0 (up to 200 m, depending on atmospheric conditions; MacCready, 1965). At larger scales, slopes between −2.5 and −3 are expected, with some transition in between (e.g. Nastrom et al., 1997). We show the slope in the PSD plots to guide the eye because we want to highlight the positive slopes at smaller frequencies due to instrumental effects. They will be discussed in the following.
2.2 Avoiding self-induced balloon motions
One of the aforementioned effects is the so-called self-induced balloon motions. They are random lateral motions of the balloon that occur only if the flow around the balloon is in the critical or supercritical flow regime (e.g. Murrow and Henry, 1965).
The flow regime around the balloon is best characterized by the Reynolds number, as follows:
where U describes the characteristic velocity, l is the characteristic length scale, and ν is the kinematic viscosity of the fluid. In our case, the characteristic length scale is given by the balloon diameter that increases during ascent.
The balloon's shape during ascent resembles that of a sphere. Therefore, we can rely on extensive studies on smooth and roughened spheres in a uniform flow done by Achenbach (1972, 1974), who describes how the drag coefficient cd of a sphere depends on the Reynolds number Re of the flow around the sphere. For spheres like an ascending balloon, cd slightly decreases in the subcritical Re range () with increasing Re. For , however, cd decreases sharply with increasing Re (critical Re range).
Consequently, the critical and supercritical Reynolds number range is not only characterized by self-induced lateral motions but also by an unstable ascent rate of the balloon. An increasing ascent rate results in an increase of Re and therefore of the cd. The increasing drag slows the balloon down, which reduces the Re and cd, thus accelerating the balloon again. This effect is sometimes called the drag crisis of a balloon.
Figure 3 shows the ascent rate and corresponding Reynolds number of our two test launches. Focusing on the conventional ascending radiosonde (purple line), we find critical and supercritical flow conditions for altitudes below 12.5 km and subcritical conditions above. As expected from the flow conditions, we find stronger variations in the ascent rate due to the drag crisis in the lower-altitude range. Furthermore, we find a rather sharp reduction in the ascent rate from 10 to 15 km altitude (5.7 m s−1 vs. 4.3 m s−1), due to the increased cd in the subcritical flow regime. The tropopause height for this launch was 11.1 km. For radiosonde-type balloon launches at 5 m s−1 ascent rate, the flow condition change usually happens slightly above the tropopause. This is because the density declines quicker with height above the troposphere, leading to a sharper decline in the Reynolds number (see Fig. 3). In our case, these changes in the vertical balloon velocity are merely used as an indicator to show that the change in the flow regime is happening as expected from the Reynolds number. For technical information on both soundings, please see Sect. 3. For a discussion of the parameters influencing the height of the flow regime change, please see Appendix B.
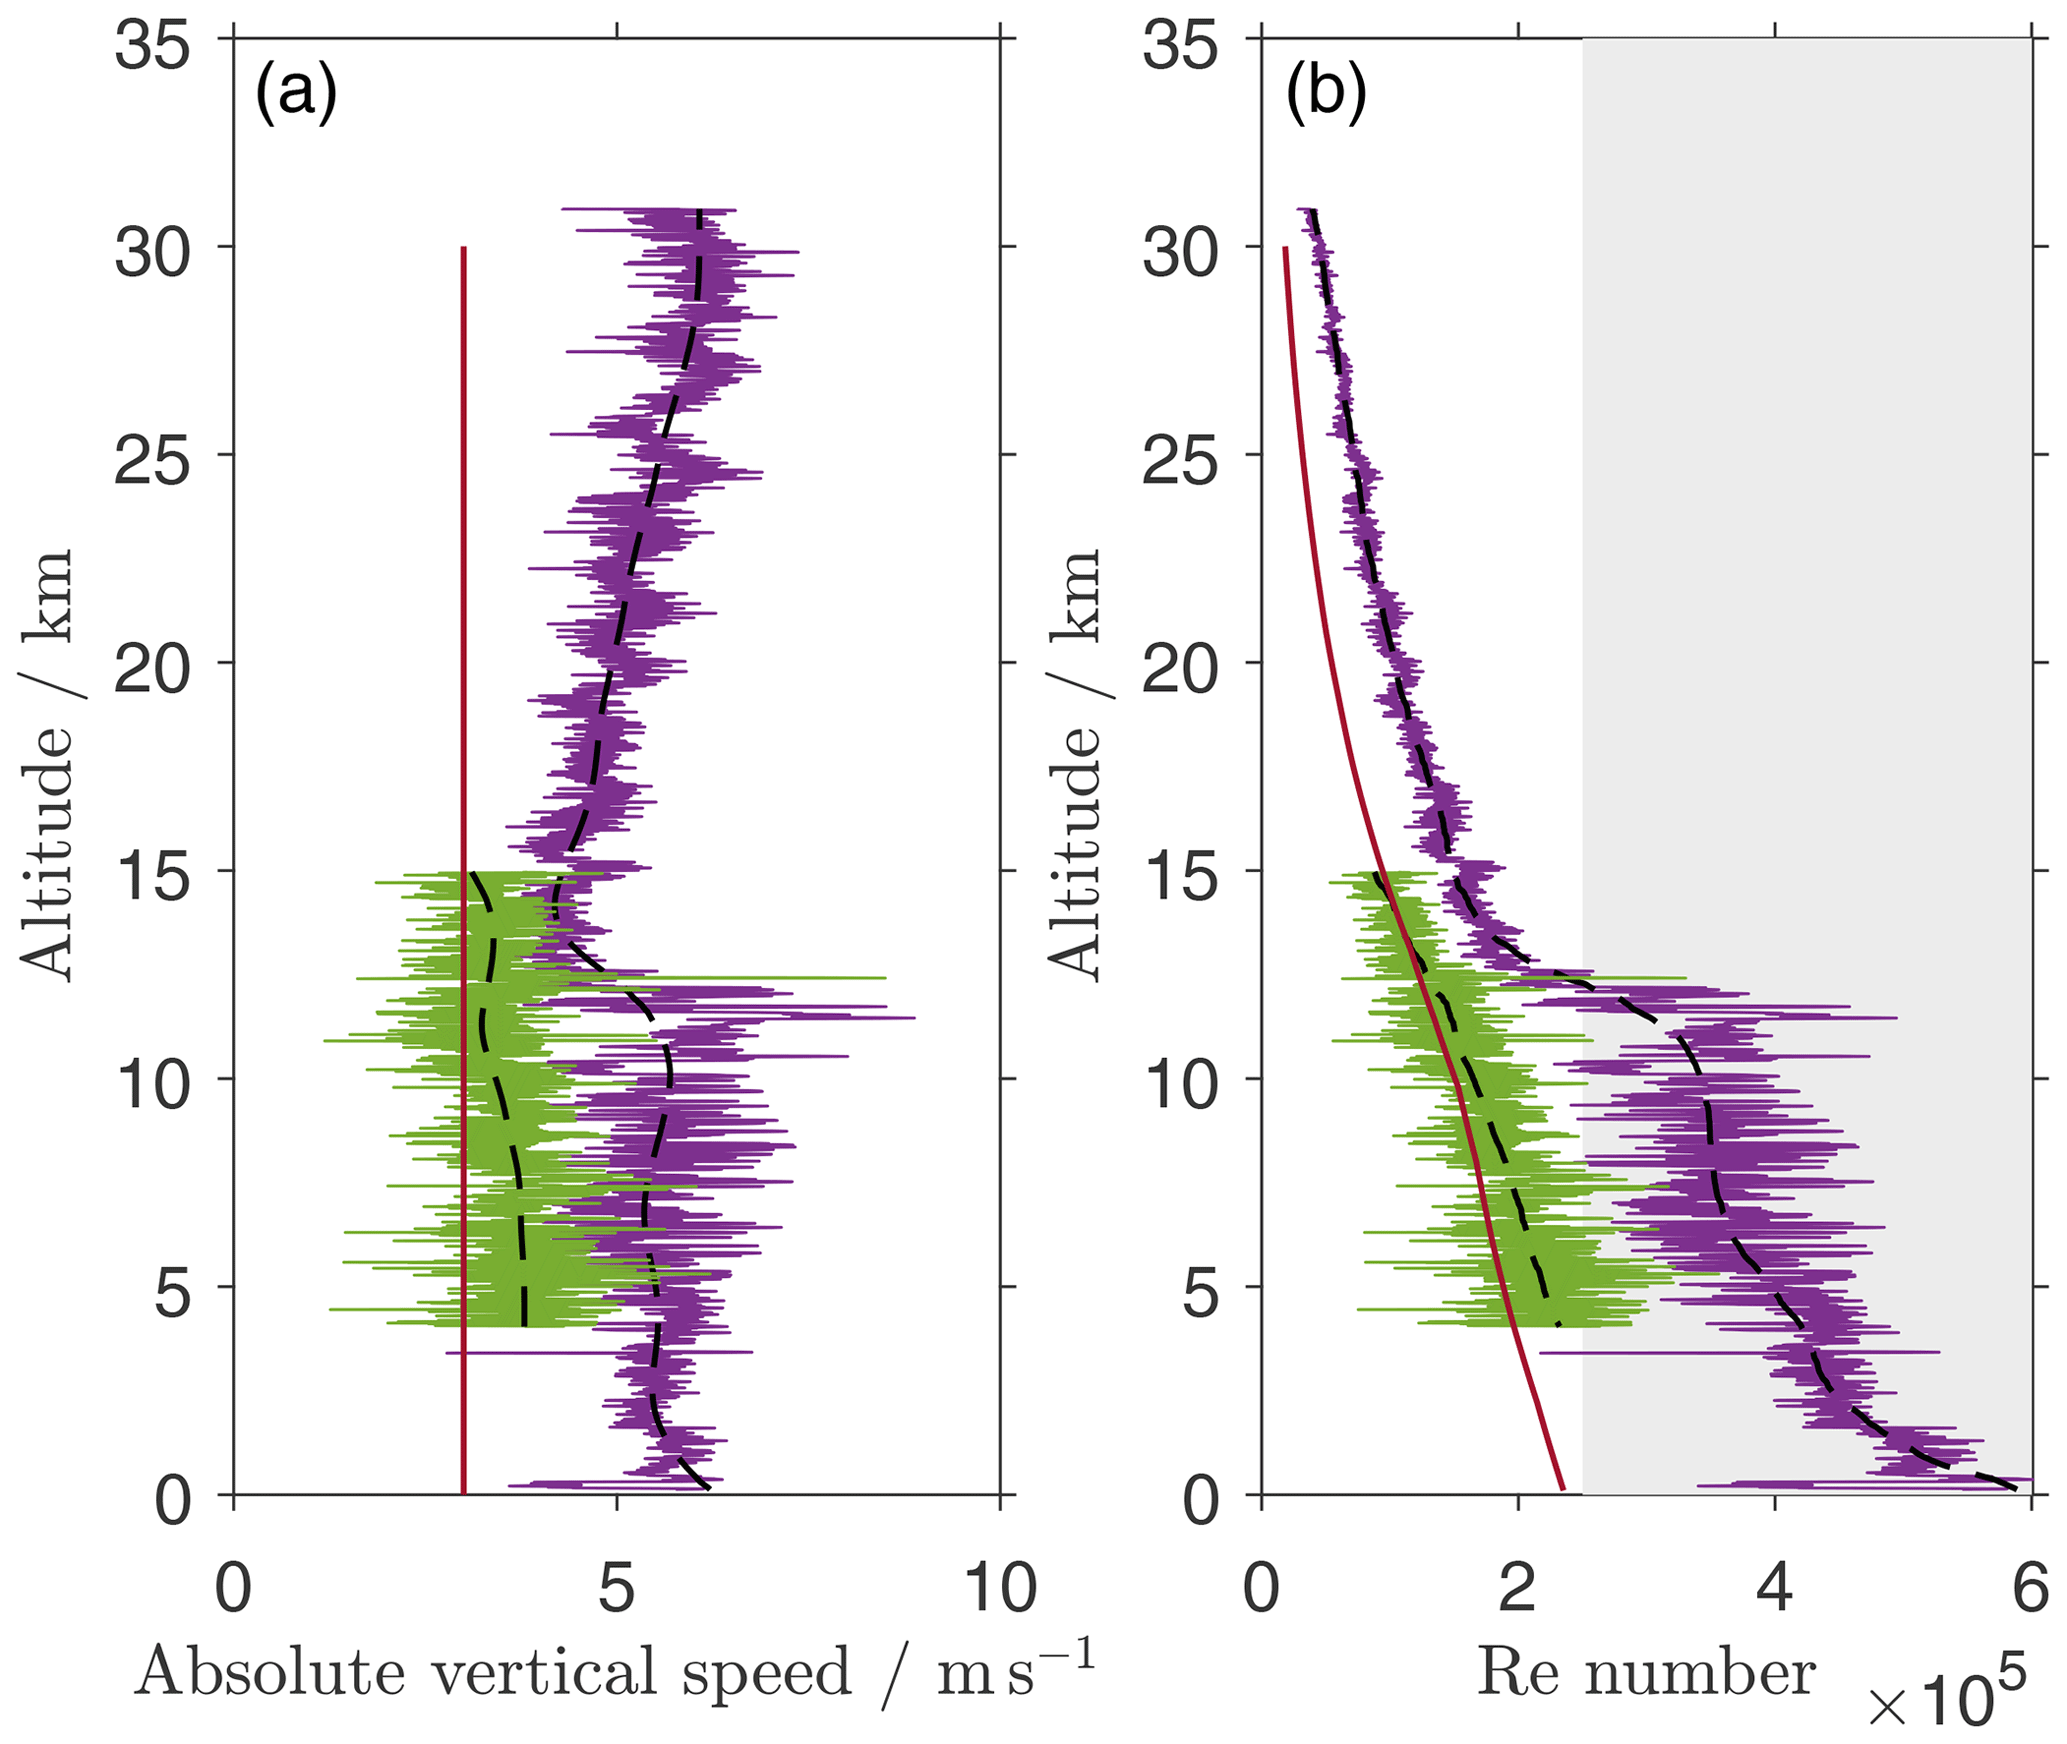
Figure 3Ascent rate (a) and Reynolds number (b) of the flow around the balloon for the standard radiosonde configuration (purple) and the enhanced sounding set-up (green), as described in Sect. 2. The red line shows a simulated ascent of a 500 g balloon at 3 m s−1. Dashed lines show low-pass filtered data, and the shaded grey area marks the critical and supercritical Reynolds number, range according to Achenbach (1974).
Here, we will focus on the aforementioned lateral self-induced motions. They occur because the ring of the flow separation on the balloon surface typically deviates from perfect rotational symmetry (e.g. shown for spheres by Taneda, 1978). This induces lateral drag forces on the balloon. Murrow and Henry (1965) visualized this effect by launching a balloon inside a large hangar. Scoggins (1965) showed that the peak in the spectral power of this motion is expected for vertical scales of 200 m, with a sharp decline towards smaller scales and a smoother one towards larger scales.
This effect is perfectly visible on the PSDs of the unfiltered data from the normal radiosonde configuration in Fig. 4 (blue curve). The figure shows the power spectrum of wind data derived from the standard Vaisala output and the unfiltered data that have been calculated, as described in Appendix A. The spectrum is calculated independently for the supercritical Re range (Fig. 4a; below 12.3 km altitude) and the subcritical height range (Fig. 4b; above 12.3 km altitude).
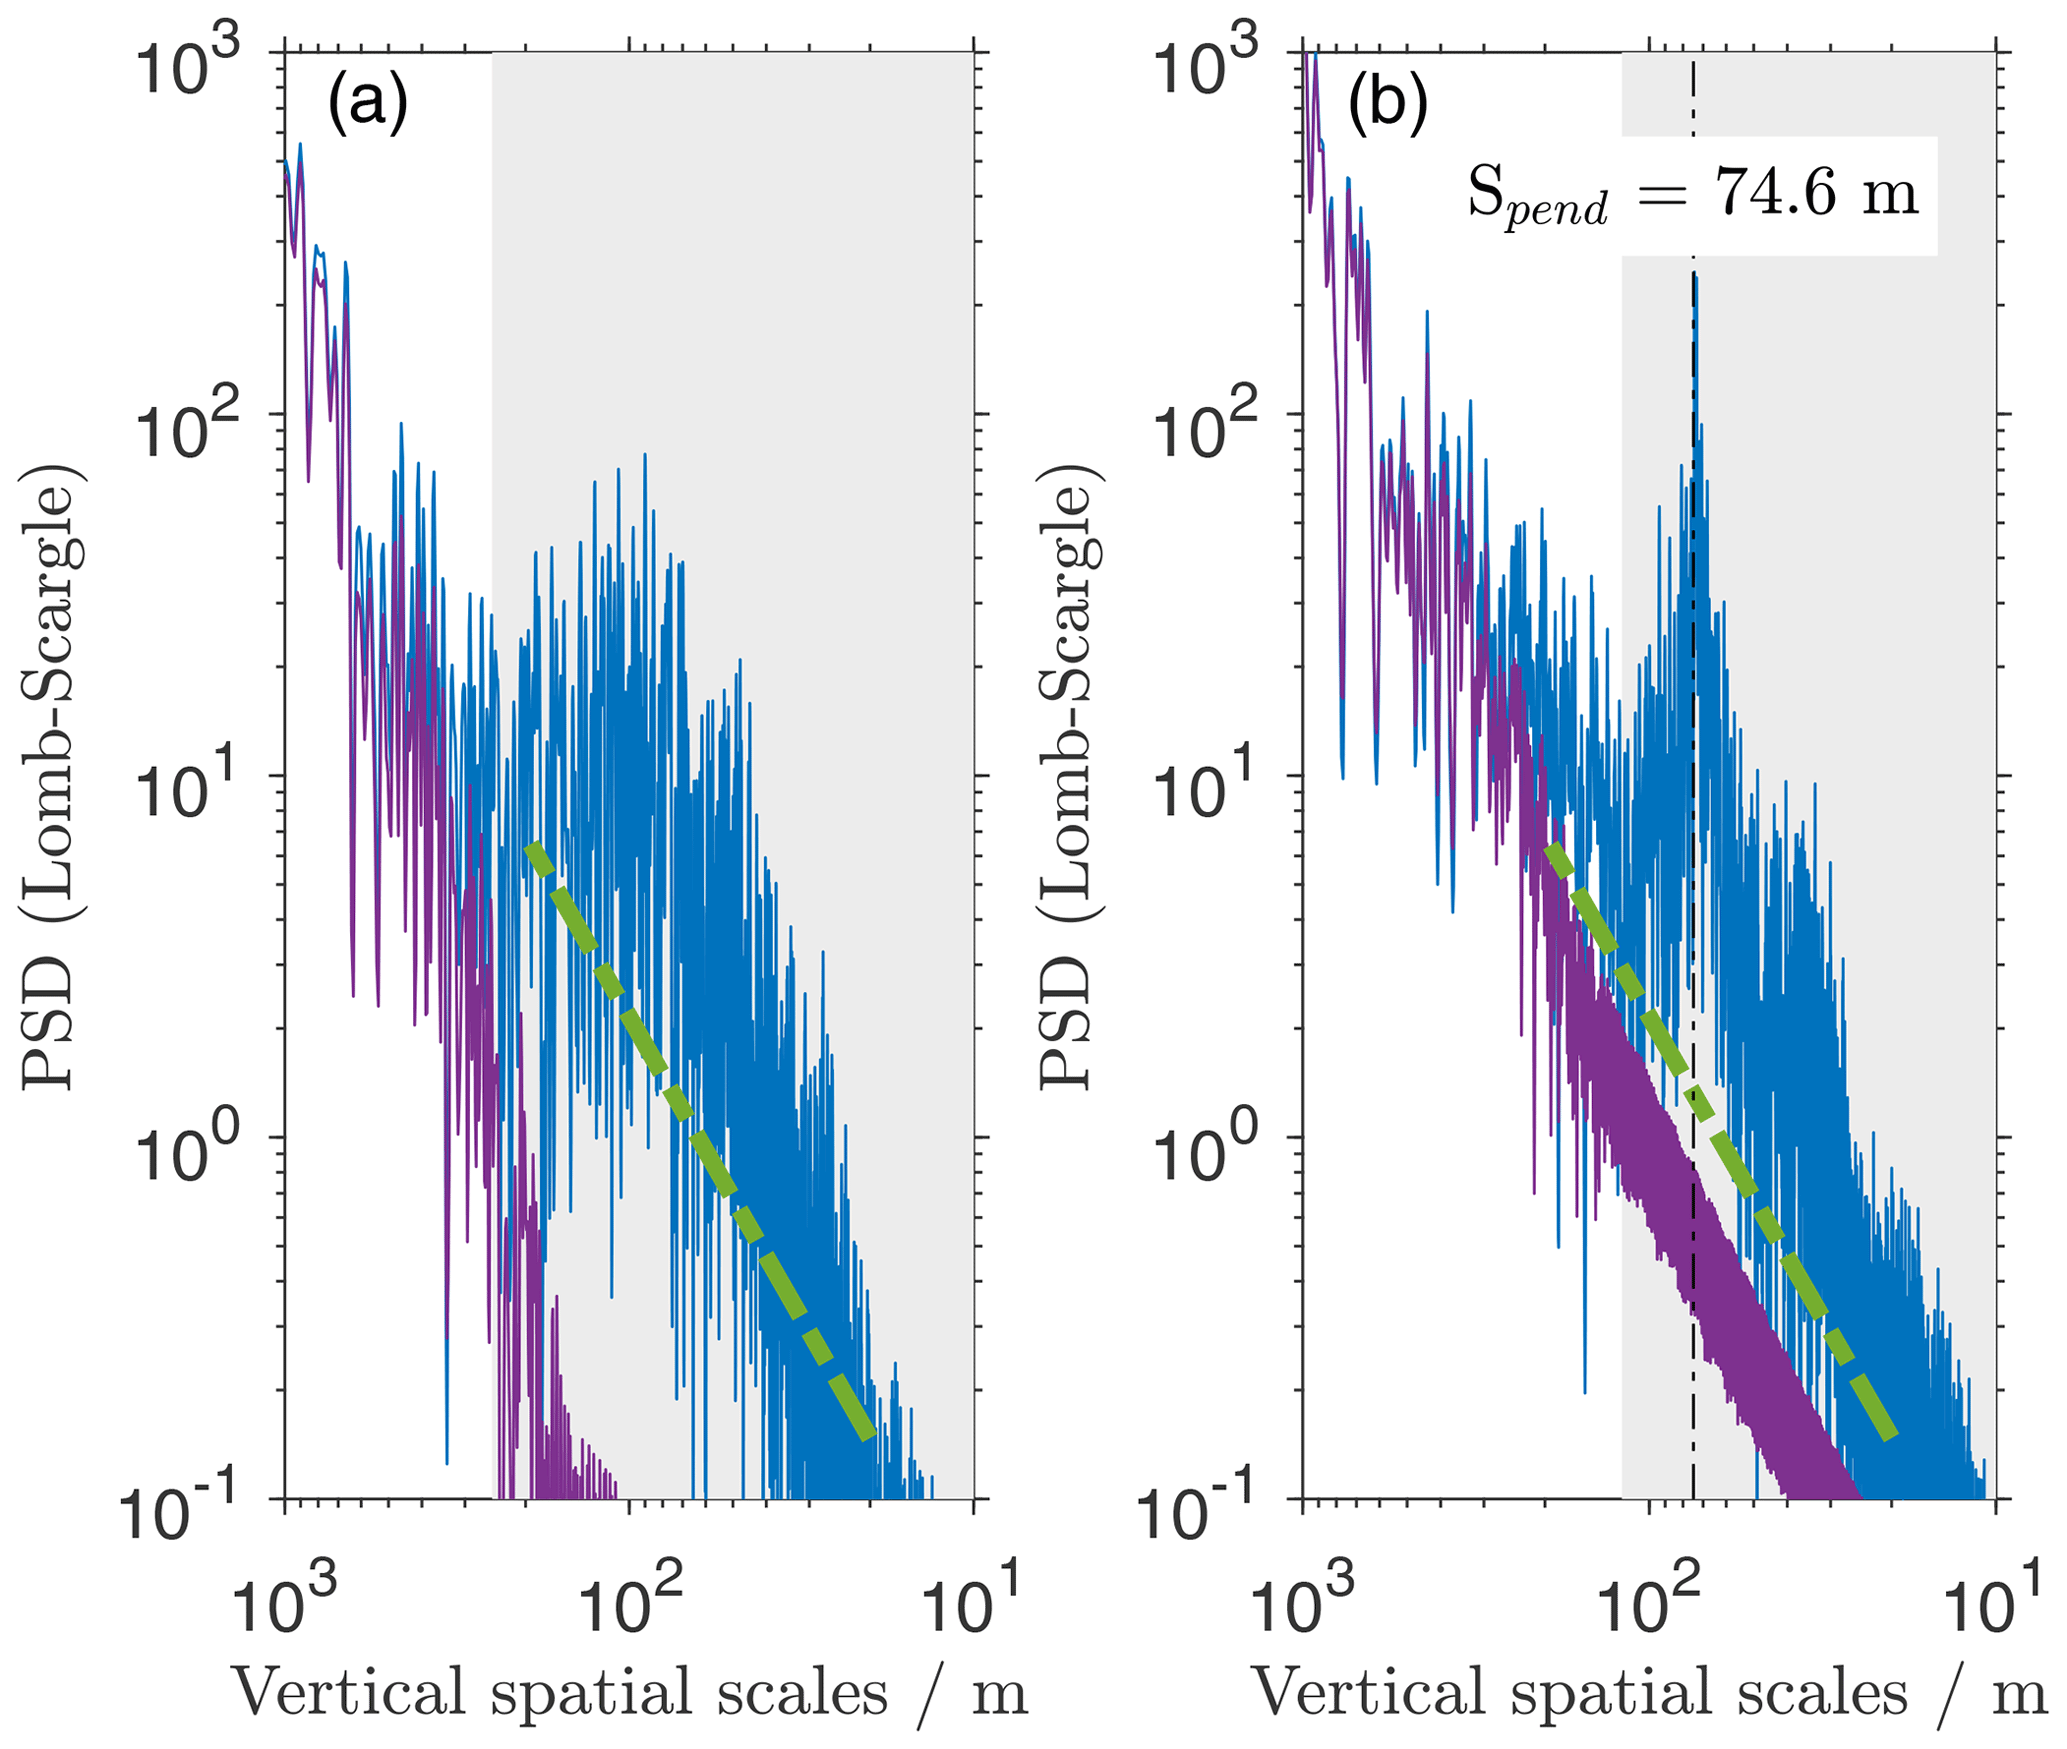
Figure 4PSDs for the zonal wind fluctuations in the normal radiosonde configuration from 28 February 2022. (a) Supercritical flow around the balloon (, z<12.5 km). (b) Subcritical flow around the balloon (, z>12.5 km). The dashed black line denotes the expected pendulum scale, given the string length of 55 m. The blue spectrum is calculated from the unfiltered output, as described in Appendix A. The purple spectrum is calculated from the standard Vaisala output. Shaded grey areas denote spatial scales where the unfiltered data are impacted by instrumental effects.
For the unfiltered data, Fig. 4a shows clear deviations from the expected slope for atmospheric fluctuations in the inertial subrange on spatial scales smaller than 250 m, with a broad peak around 100 m. This peak is caused by the self-induced motions of the balloon, which is evident due to its spectral shape being a good match to the results found by Scoggins (1965, their Fig. 9).
The right panel shows the same data from the same flight, except that the data are taken in the subcritical Re range. We note in the first place that only data on scales smaller than 120 m show clear deviations from the slope. A narrow peak at ∼ 75 m vertical scale can be observed instead of the broad peak in Fig. 4a. Our interpretation of this spectral peak is two-fold. First, the self-induced balloon motions are not visible anymore, as expected for the subcritical Re range. Second, a pendulum motion of the radiosonde becomes dominant here, which will be discussed in Sect. 2.3.
We conclude that keeping the balloon in the subcritical Reynolds number range is a very effective method to avoid self-induced motions. In our case, the spatial scales at which instrumental effects play a significant role have been roughly halved from 250 to 120 m.
The simplest way to achieve this is to reduce the vertical balloon speed. Figure 3 shows a simulation of the Reynolds number of the flow around a 500 g balloon at a constant vertical speed of 3 m s−1. It has been calculated using annual averages of temperature and pressure data for 50∘ N from the COSPAR International Reference Atmosphere (CIRA-86; Fleming et al., 1990). We find that, even at ground level, the balloon is expected to be in subcritical flow conditions, thus eliminating self-induced horizontal motions.
2.3 Diminish effects from pendulum motions of the radiosonde
As described in the Introduction, a radiosonde below a balloon is subject to pendulum motions. Idealized, these motions can be described by a simple gravity pendulum with a frequency of
where l is the length of the string between the balloon and the radiosonde, and g is the gravitational constant. For the Vaisala RS41 with a string length of 55 m, we expect a pendulum period of 14.9 s. Based on the average ascent rate of our standard configuration test launch, this matches a vertical spatial scale of 75 m (dashed black line in Fig. 4b). This corresponds well to the high-resolution spectrum in the same figure; the narrow peak in Fig. 4b has a central scale of 73 m.
This peak is not clearly visible in the supercritical Re range, even though the flow conditions around the balloon should not suppress the pendulum motions of the radiosonde. We assume that this is due to the interactions with the self-induced balloon motions that change the simple gravitational pendulum into one with a moving pivot, thereby shifting its frequency.
These pendulum motions of the radiosonde are forced by vertical shears of the horizontal wind, among other factors. Therefore, they cannot be completely avoided. However, their influence on the wind measurements can be mitigated by increasing their frequency. This is done by shortening the string between the balloon and the radiosonde. For our improved payload, we shortened this string to 9 m, corresponding to a pendulum period of 6.0 s. As noted in Sect. 2.2, we also aim for vertical balloon speeds of 3 m s−1 instead of 5 m s−1 for aerodynamic reasons. The positive side effect of this measure is a further decrease in the central scale of the pendulum peak to vertical scales of 18 m, compared to 75 m for the standard configuration. Furthermore, we attached small wind vanes with a total area of 0.039 m2 to the radiosonde (please see Sect. 3 for technical details). They dampen the pendulum motions, which, in our experience, become very vigorous when shortening the radiosonde string.
The orange line in Fig. 5 shows a PSD of unfiltered data from a flight using the improved payload configuration as it is described in Sect. 3. We find a good agreement between the measured power spectrum with the expected slope on scales down to 50 m. Assuming a simple gravitational pendulum, the peak is expected at spatial scales of 21 m from the given string length and ascent rate (dashed black line). There is a well-pronounced narrow peak centred at spatial scales of 17.3 m. As for the subcritical Re range of the standard configuration (Fig. 4b), we therefore conclude that this peak is caused by the pendulum motions of the radiosonde. Compared to the standard configuration in the subcritical Re range (Fig. 4b), we have been able to further shift the spatial scales of the instrumental influences from 120 m down to 50 m.
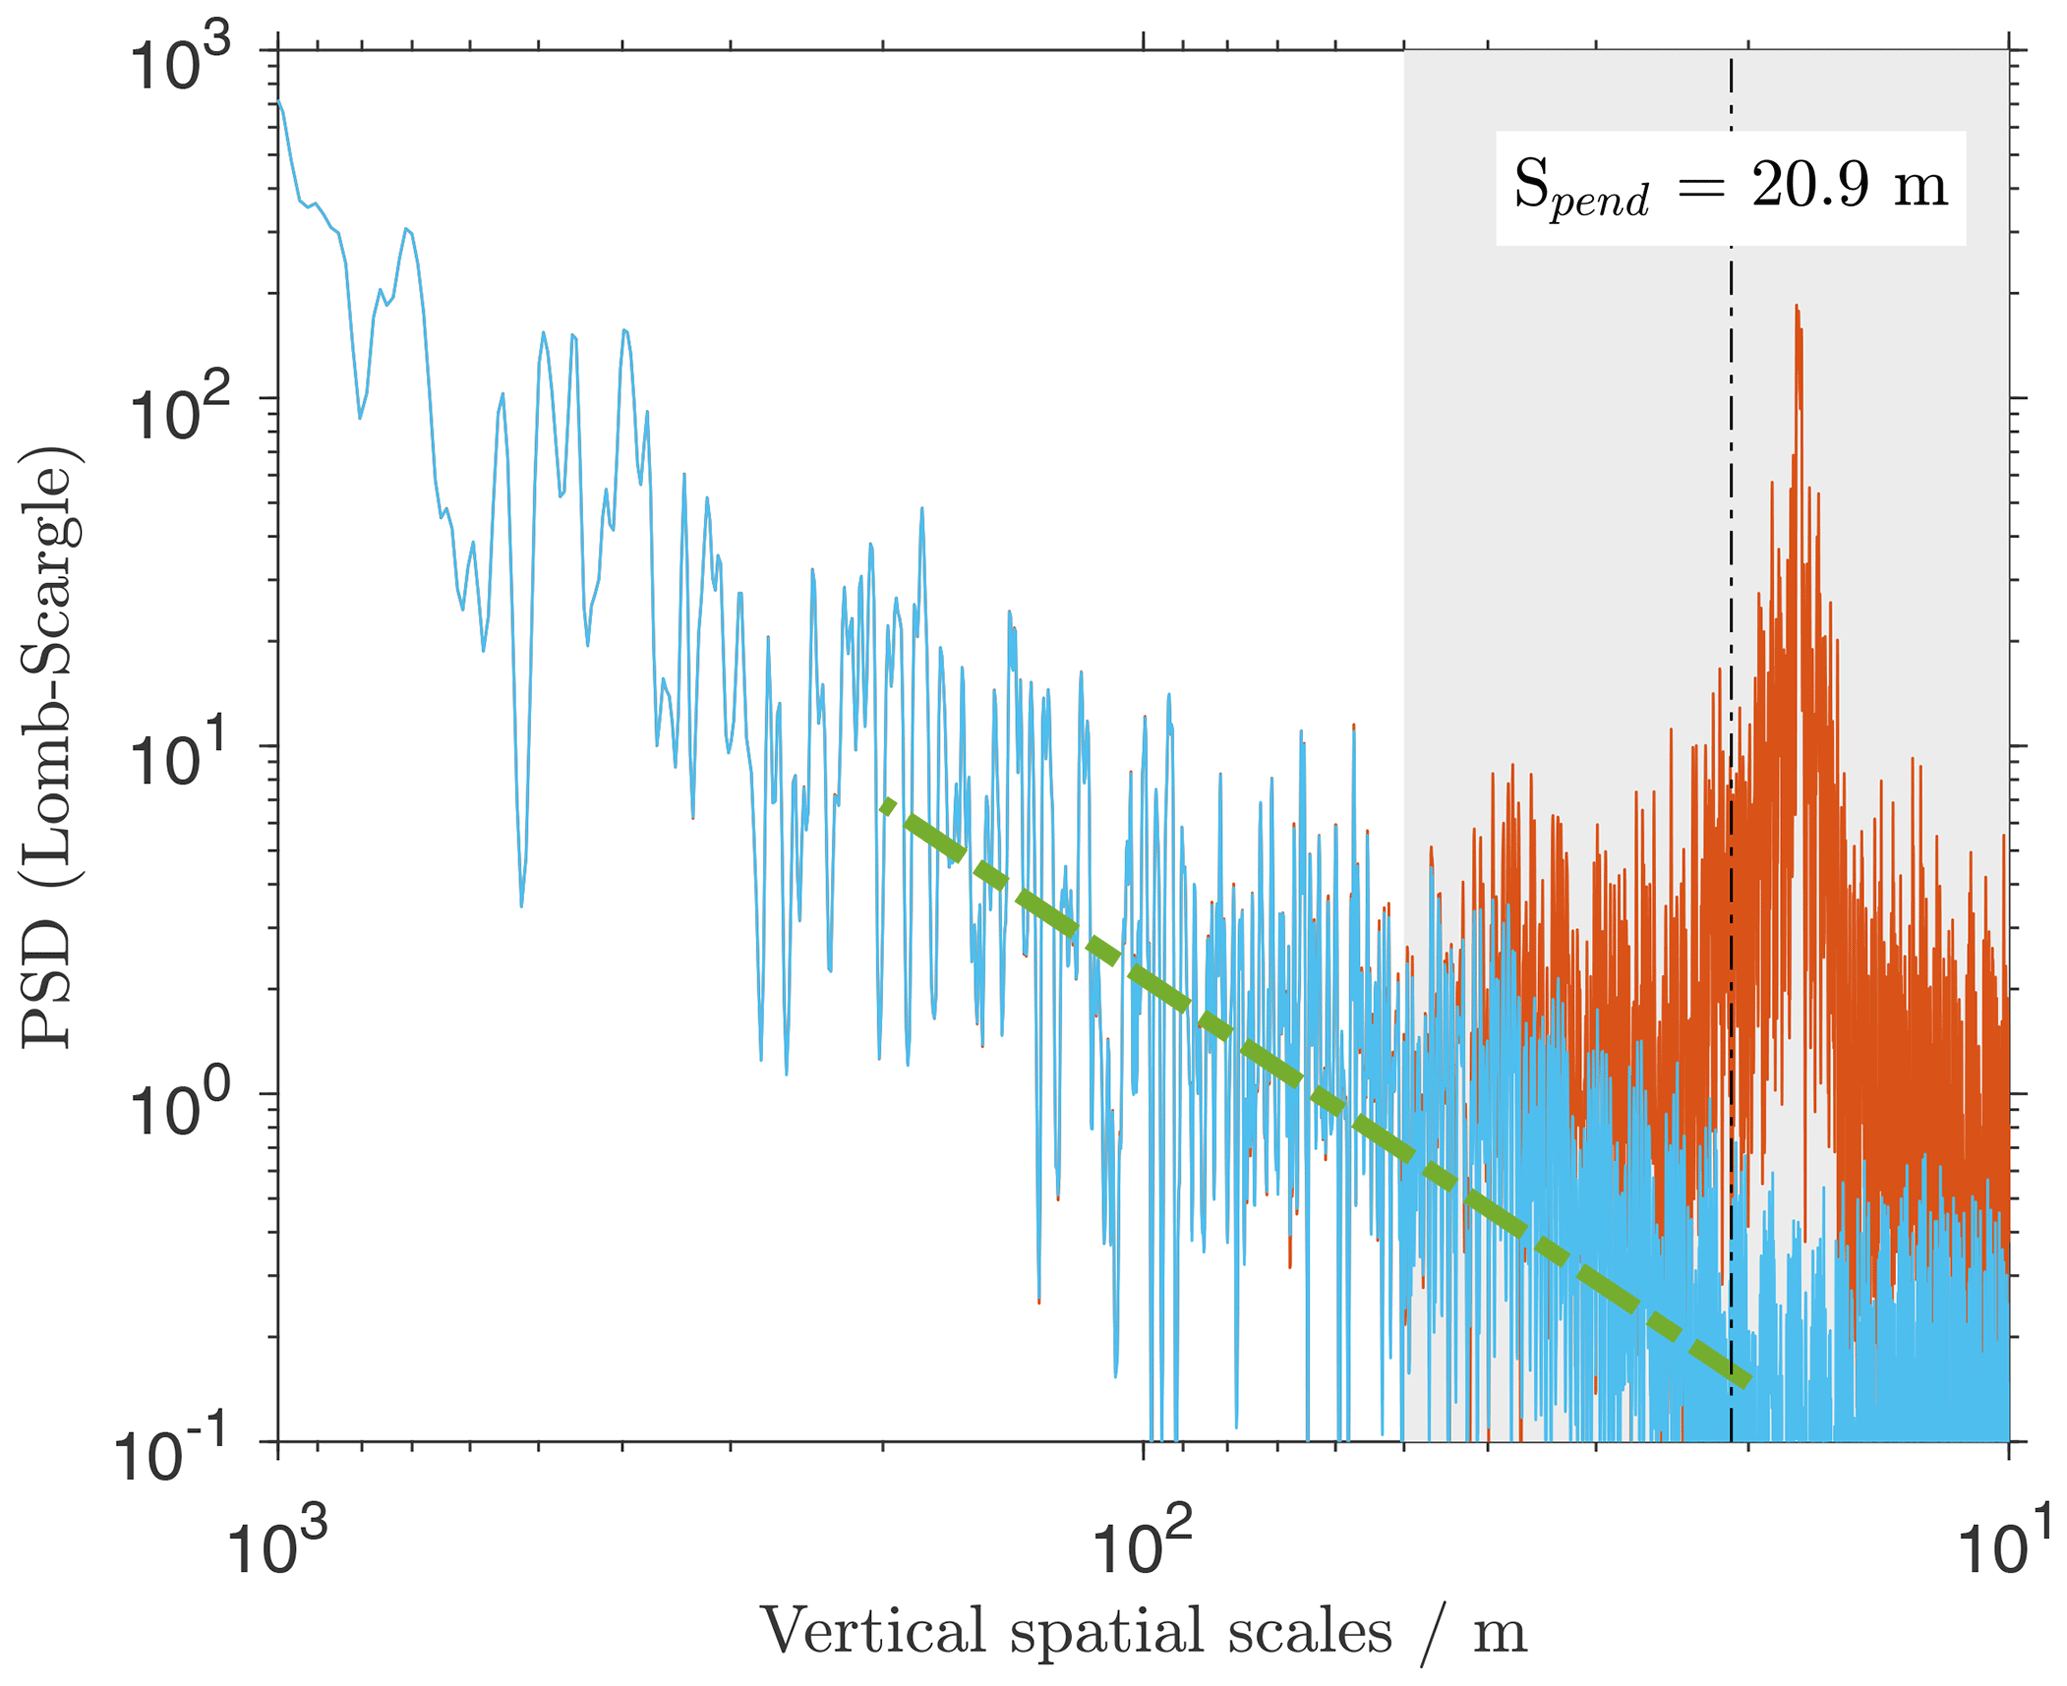
Figure 5PSDs calculated from unfiltered zonal wind data on the improved payload, as described in Sect. 3 (orange). The light blue line depicts ready-to-use wind data from the same payload, with the remaining disturbances removed. A slope is shown for comparison (dashed green). The dashed black line denotes the expected pendulum scale. Shaded grey areas denote the spatial scales at which the data are impacted by instrumental artefacts.
The light blue line of Fig. 5 shows the same data as the orange line but with remaining disturbances from pendulum motions removed by a low-pass filter with a cut-off scale of 40 m. We used a fifth-order zero-phase digital Butterworth filter. Like the standard Vaisala output, this data set is ready for further geophysical evaluation, with all artefacts removed. In contrast, data can be reliably used down to scales of 50 m instead of 300 m.
Compared to a standard radiosonde configuration (e.g. Vaisala, 2017), some distinctive changes have been made for our high-resolution wind soundings. For example, we decrease the balloon–radiosonde distance to shift the pendulum motions to higher frequencies. This requires measuring on a descending balloon to avoid distortions in the temperature and humidity measurements.
The descent speed of the balloon needs to be controlled by an under-filled balloon instead of a parachute. This is because a parachute cannot provide a constant descent rate. Second, the radiosonde is placed upside down in order to ensure proper flow around the sensor without flow distortions from the payload. We describe both topics in the following.
We decided to use a two-balloon configuration for the high-resolution wind sounder, which is similar to the set-up used by Kräuchi et al. (2016). Both balloons together (called the carrier balloon and descent balloon here) provide sufficient uplift for a ascent rate of ∼ 5 m s−1. The carrier balloon is separated at the top altitude by a pyro cutter that is controlled using custom-made electronics. The pyro cutter in use for our study is model no. 77003198, type B, from TRW Airbag Systems GmbH. The uplift of the descent balloon does not suffice for further ascent but limits the speed of descent to ∼ 3 m s−1, depending on the amount of lifting gas. Shortly before touchdown, the descending balloon is detached by a second pyro cutter. This prevents the payload from having uncontrolled ground drifts after landing. During our test, the cutter additionally opened a piece of cloth in order to slow down the remaining descent and prevent any damage on the ground. Figure 6 shows this part of the hardware set-up.
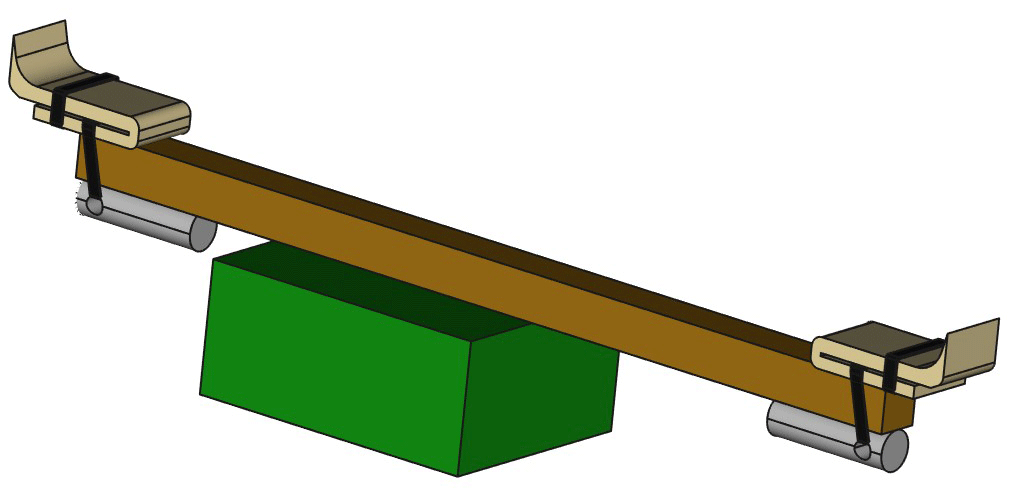
Figure 6Schematic drawing of the balloon-mounting and separation devices. This includes the wooden boom (brown), the necks of the balloons (sand), pyro cutters (grey) with cable ties (black), and the electronics box (green). Cables and cloth for slowing the final descent are removed for clarity.
The electronics has been developed by the authors. The first cutter (terminating the ascent) is released with a timer function. This is preferred to a pressure sensor because cost-effective pressure sensors do not have a sufficient resolution at the top altitude of the balloon. The second cutter (ending the measurement phase) is triggered closely above ground, using an air pressure sensor. The electronics is shielded by a lightweight 3D-printed box designed to protect against ambient water and low temperatures. Both cutters with their respective balloons and the electronics box are mounted on a ∼ 30 cm wooden stick. This stick avoids uncontrolled touching of both balloons with solid parts of the payload that may damage the balloon hull. The overall weight of this part is 195 g (without balloons).
The radiosonde is mounted in a 3D-printed frame 9 m below the balloons, as shown in Fig. 7. The short string allows the omission of any de-reelers. The mount firmly fixes the Vaisala RS41 radiosonde, with the sensor boom protruding downward. Small wings reduce the rotation and pendulum motion of the sonde, enhancing the wind data quality at small scales.
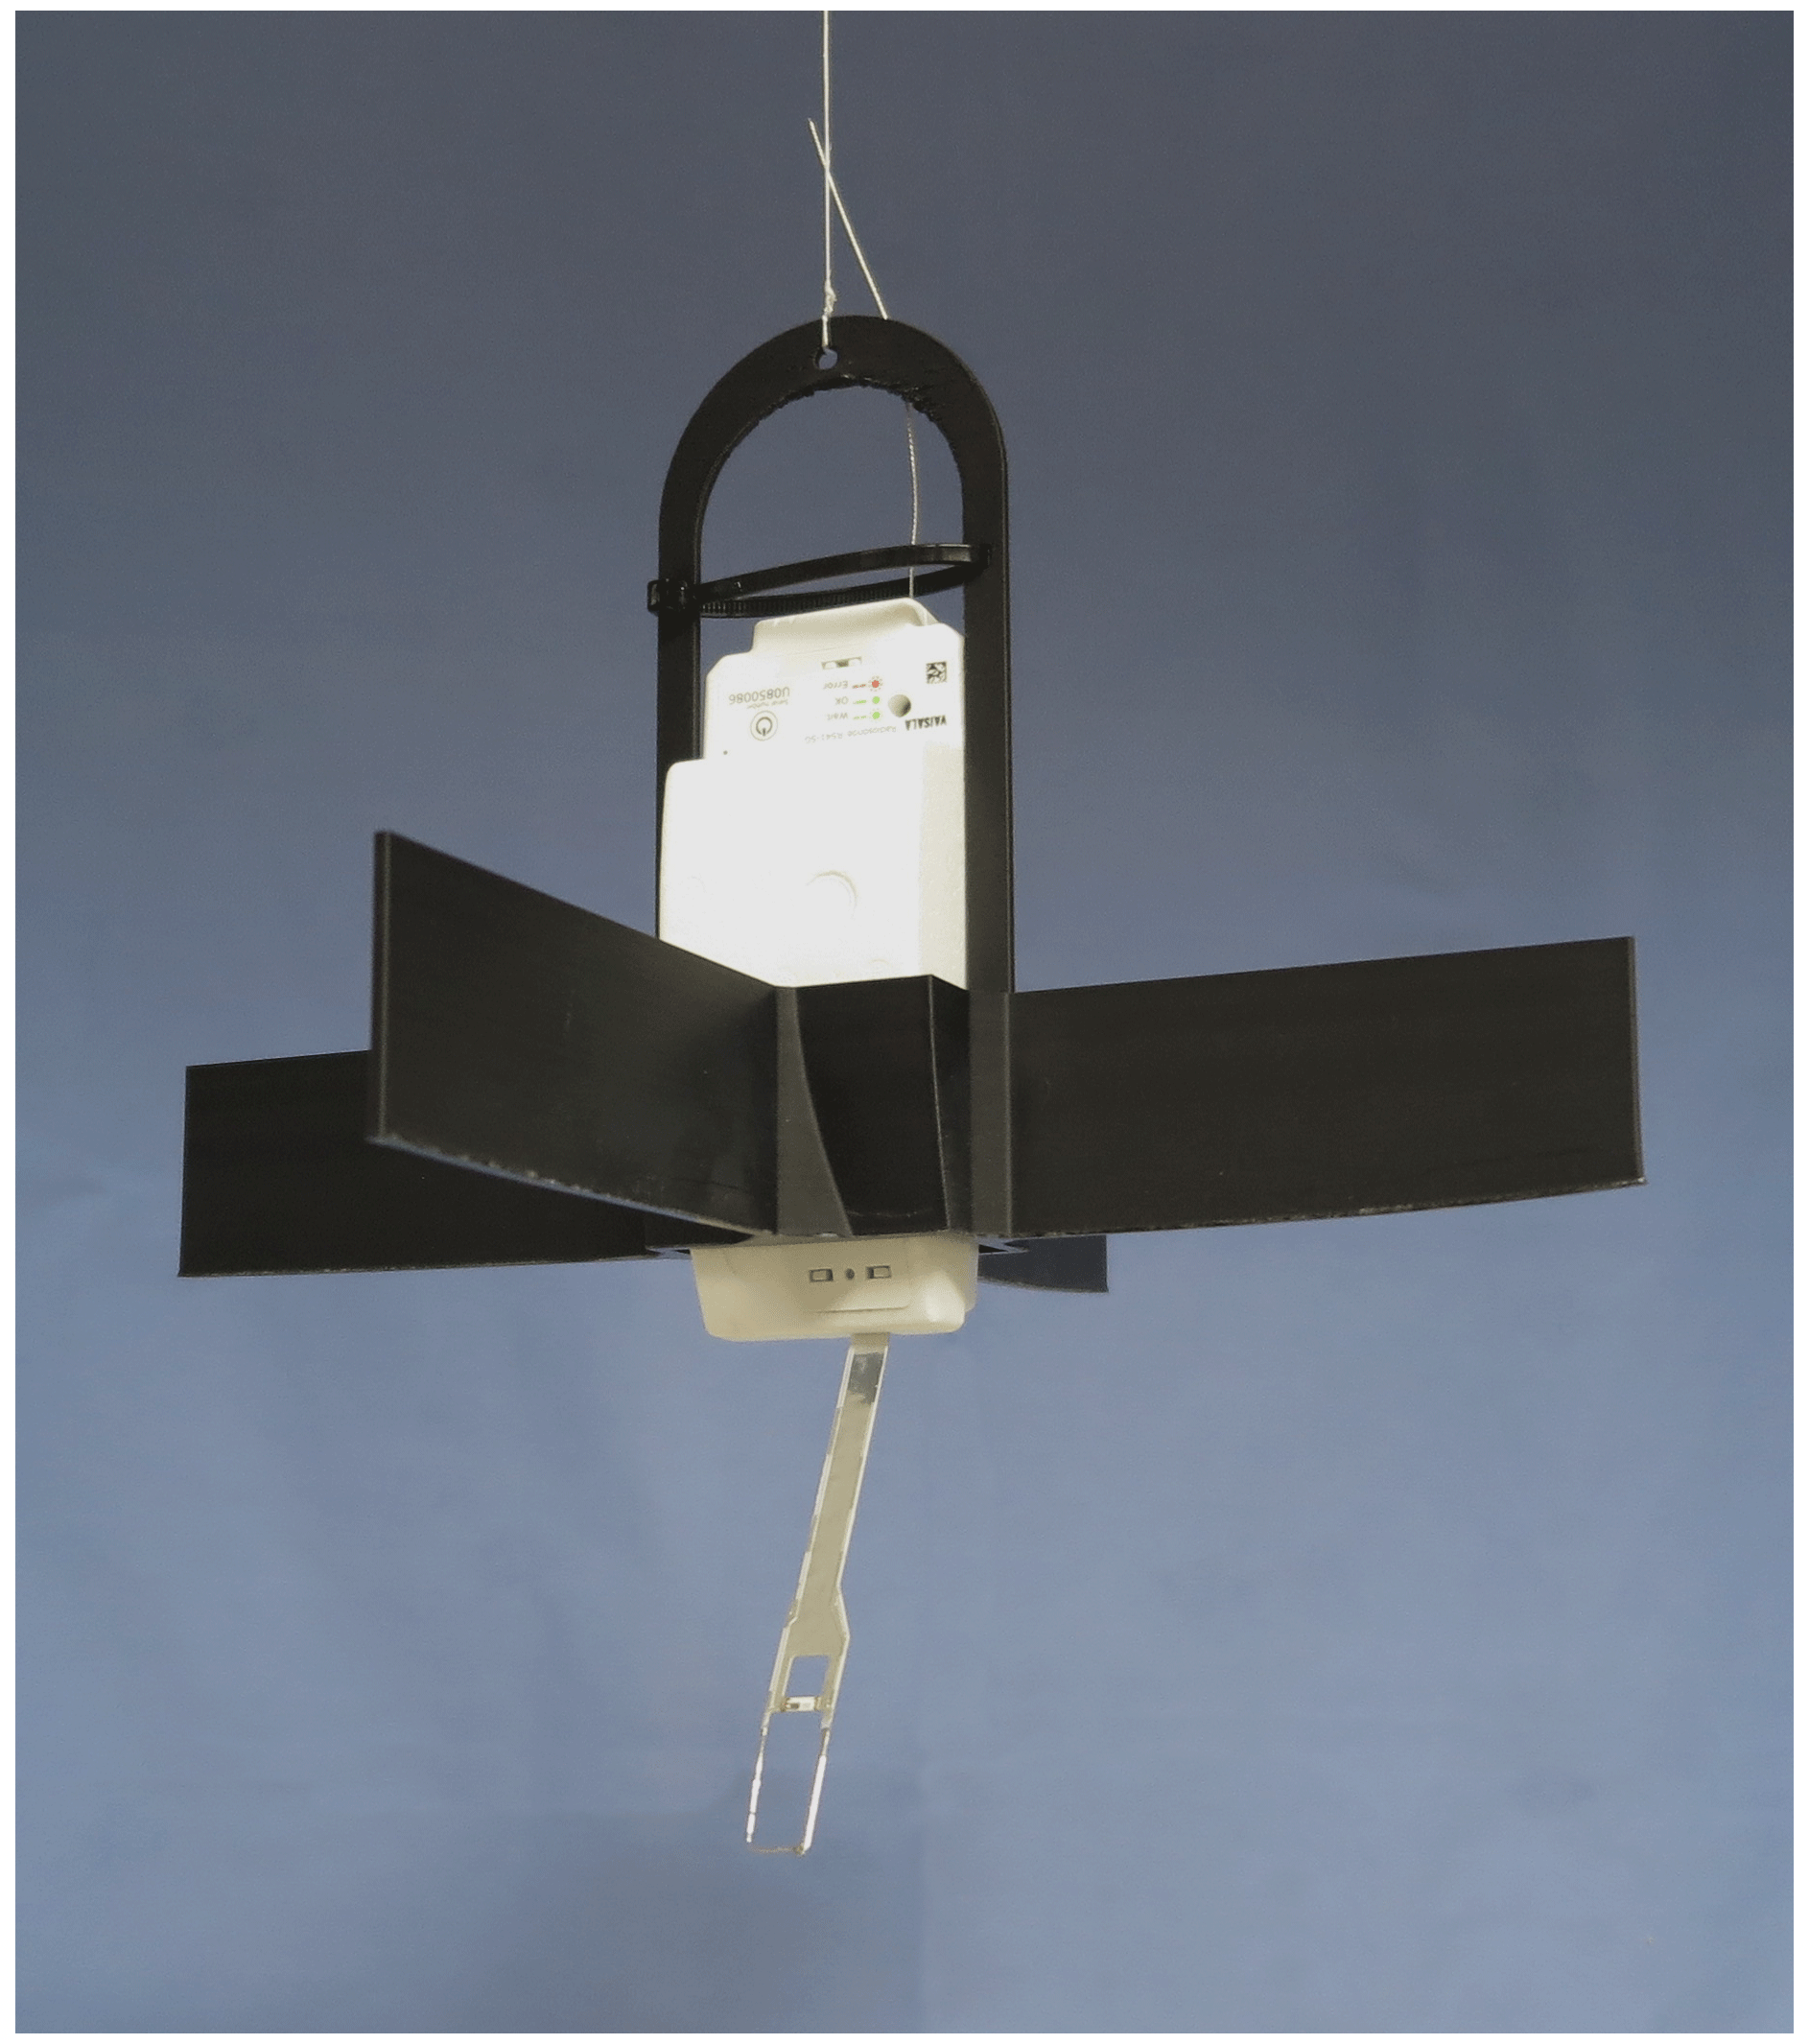
Figure 7Picture of the radiosonde mount for the improved payload design, which fixes the sonde upside down 9 m below the balloon. Photograph credit: Michael Priester.
For the high-resolution data set, we have calculated the horizontal wind directly from the unfiltered GPS data provided by the Vaisala software. The method for wind calculation is described in Appendix A.
As described in Sect. 2, we have been able to increase the usable altitude resolution of radiosonde wind measurements from 300 to 50 m. However, our measures cause higher operational costs and increased complexity. Therefore, we start this section by discussing the cost–benefit ratio of the individual actions.
The retrieval of unfiltered wind data is paramount for any high-resolution wind sounding aiming at vertical scales smaller than 300 m. Furthermore, it does not complicate the operation once it is implemented. Reducing the vertical balloon speed to 3 m s−1 is a powerful tool without additional costs or complexity; the altitude resolution is more than doubled to less than 120 m, due to the avoidance of self-induced motions that occur in the supercritical Re range (Fig. 4). Presumably, this is further enhanced as the distortions from the pendulum motions are shifted to even smaller scales by the reduced vertical speed. This, however, cannot be shown from this data set because it does not feature a standard radiosonde ascending at 3 m s−1.
In our study, we describe general properties of balloon soundings that originate from fundamental concepts in fluid dynamics and the pendulum motions of the sonde. Accordingly, we are confident that the results are more widely representative because the effects shown in this study are mainly properties of the flow around the balloon and not of the geophysical conditions. In Appendix B, we show the dependence of the height of the flow regime change on the sounding set-up parameters like balloon size and ascent rate. Furthermore, we briefly discuss the remaining geophysical influences on this.
Further advances in resolution have been made possible by reducing the length of the radiosonde string from 55 to 9 m in our case. This further doubles the altitude resolution to 50 m by shifting the pendulum motions to higher frequencies. However, this measure does significantly increase the complexity of the balloon operation, and vigorous motions of the radiosonde below the balloon need to be damped by small wind vanes. On an ascending balloon, the radiosonde will almost always be in the wake of the balloon (e.g. Söder et al., 2019). Therefore, a warm bias during daytime and a cold bias during nighttime, as well as a wet bias under all conditions, would be expected (Kräuchi et al., 2016; Tiefenau and Gebbeken, 1989). These temperature biases in the wake are below 1 K around the tropopause level and reach above 2 K in the stratosphere (Tiefenau and Gebbeken, 1989). Accordingly, combining radiosonde wind measurements with a vertical resolution of 50 m with the humidity and temperature output of the radiosonde is solely meaningful on descent. However, this is only successful if the descent is slowed by a balloon as, for example, suggested by Kräuchi et al. (2016). On a free-falling descent, the altitude resolution becomes too low, and the high descent rate leads to a warm bias due to frictional heating of the radiosonde (Ingleby et al., 2022; Venkat Ratnam et al., 2014). Using a parachute to slow the descent does not create a sufficiently stable descent rate because of its dependence on air density and the delayed opening of the parachute (e.g. Ingleby et al., 2022).
If only high-resolution wind measurements are required for a certain research question, then we would suggest using ascending sondes in the subcritical Reynolds number range with a short string and additional wind vanes. Compared to a descending set-up, this simplifies the operation without degrading wind data quality.
We chose to use two balloons and custom-made electronics in order to implement the measurement on descent. Another option would be to release lifting gas at the highest point of the flight using a valve (e.g. Hurst et al., 2011; Mastenbrook, 1966). However, these ventilated balloons are much larger than the descent balloon used in our study. This necessitates even lower rates of descent to keep them in the subcritical Re range.
In our study, we used comparatively small balloons and a low ascent rate to keep the balloon in the subcritical Re range (500 g balloon weight; ∼ 3 m s−1 ascent rate). Another option would be to considerably increase the roughness of the balloon and therefore decrease the critical Re number (Achenbach, 1974). This has been achieved with the so-called “Jimspheres”, which are small super-pressure balloons with cones on their surface (Scoggins, 1967). However, we do not use this concept because the Jimspheres are not commercially available any more, and they cannot achieve a constant vertical speed.
Within this study, we identified and removed several distortions to the high-resolution evaluations of balloon-borne wind soundings. We are able to identify them by their typical deviation in the PSDs of the wind fluctuations under calm conditions. Nevertheless, it would be desirable to compare our high-resolution data to an independent measurement. Unfortunately, we are not aware of any technology to achieve this. Radars can achieve high-resolution wind measurements (e.g. Wilson et al., 2014). However, their measurements cannot be compared to balloon-borne soundings, due to the spatial inhomogeneity in small-scale wind fluctuations and the horizontal drift of the balloon. Other techniques like gliders allow for high horizontal resolutions (e.g. Wildmann et al., 2021), but they cannot follow the path of a balloon because they need horizontal airspeed to generate lift.
The description and technical realization of our study is based on Vaisala RS41 radiosondes that are often used by weather services and research stations. Nevertheless, our method can also be applied to radiosondes of other manufacturers, as most modern radiosondes measure horizontal winds from the drift of the balloon by GPS.
There are three other effects on the balloon wind measurement accuracy that have not been discussed in this study. One of them is internal oscillations of an ascending balloon. They occur on timescales of approximately 2 s (Söder, 2019). They could be avoided through using a complicated ballooning scheme suggested by Isom (1949), but they are not relevant at the resolution of 50 m that we achieve with the current set-up. Inaccuracies in the differential GPS system used on the radiosonde are another effect leading to the degradation of balloon wind measurements. Findings from a stationary test by Vaisala (2013) show that the GPS errors in the wind estimate are below 0.05 m s−1, which is below the 0.1 m s−1 resolution used on our data. The third is that the balloon and the radiosonde form a coupled system, with the aerodynamic centre of pressure located somewhere between the centre of the balloon and the radiosonde (e.g. Marlton et al., 2015). Accordingly, the sounding balloon will neither measure the wind at the height of the balloon nor at the height of the radiosonde but somewhere in between. We cannot assess the uncertainty caused by this affect, but we expect it to be smaller than on a standard radiosonde because the balloon–radiosonde distance is reduced from 55 to 9 m.
In this study, we find the standard radiosonde wind output to be increasingly damped on spatial scales smaller than 300 m. Dirksen et al. (2014) used an effective temporal resolution of the wind data of 40 s in their GRUAN data processing, corresponding to a vertical scale of 200 m for a standard ascent. Ingleby et al. (2022) state that the standard radiosonde data-processing schemes use similar, but not identical, cut-off values to the ones in Dirksen et al. (2014). Therefore, our findings correspond to the literature. Unfortunately, the remaining difference cannot be further investigated, as there is no official statement by Vaisala on this matter.
Recently, some very lightweight, free-falling sondes appeared on the market. They avoid pendulum motions by design, and their small size decreases the Reynolds number of the flow around them. However, their descent rate decreases with decreasing altitude due to its pressure dependence. These systems were not available for our study, but it might be worthwhile to compare their results to our approach in another survey.
In summary, spatial scales between 50 and 300 m are accurately resolved by our high-resolution wind measuring method but are not covered by the standard data products or by the standard hardware configuration. Nevertheless, our new system is affordable, with launch costs of the same order of magnitude as for a standard radiosonde. Furthermore, digital low-pass filtering with a cut-off scale of 40 m removes the remaining artefacts, thus producing a data set as easy to use as the standard Vaisala output but with a usable resolution of 50 m. This can help to bridge the gap between standard radiosondes and highest-resolution turbulence measurements from research aircraft or balloons (e.g. Söder et al., 2021; Bramberger et al., 2020; Barat et al., 1984). Therefore, our method allows the improvement of the outcome of research soundings that are dedicated to dynamical phenomena that involve small-scale processes. This includes, for example, gravity wave propagation, dynamical instabilities, and tropopause folds. In a first step, our data have been used for a study that examines the kinetic helicity and kinetic energy spectra in flows of stratified turbulence (Dusch et al., 2023). Their comparison between the analytical theory and atmospheric measurements would not have been possible if a standard radiosonde configuration were used because the processes under investigation mainly occur on scales smaller than 300 m.
Coming back to our question on the achievable altitude resolution from the beginning, we found that through using our altered radiosonde operation scheme with the revised payload, we can accurately measure wind fluctuations down to vertical spatial scales of 50 m and not impact the temperature or humidity measurements. This means an increase in the usable-altitude resolution by a factor of 6 because the standard output data are sampled at ∼5 m but filtered below 300 m. Still, our new data set has all of the remaining distortions on scales smaller than 50 m removed and is therefore easy to use for further evaluation.
To achieve this result, we retrieved unfiltered position data from the sounding system and mitigated self-induced motions of the balloon and pendulum motions of the gondola. The self-induced motions were avoided by keeping the balloon in the subcritical Re range (i.e. using a comparatively small balloon with a low ascent rate of ∼3 m s−1). Pendulum motions were limited by using small wind vanes on the radiosonde mount and by reducing the balloon–gondola distance from 55 to 9 m. This required measuring on a descending balloon in order to retain the data quality of the wind and temperature measurements by avoiding the wake of the balloon.
These changes allow for the modified radiosonde to be used in process studies on stratified turbulence. The advantage of our new payload is that it can resolve the outer scale of turbulence and thereby bridge the gap between conventional radiosondes and more specialized turbulence-measuring instruments. Nevertheless, it retains the relatively easy and low-cost operation and is applicable to all research-type radiosonde launches, regardless of the sonde's manufacturer.
The wind calculations are based on the unfiltered (original) GPS data as received by the sounding station. Access to this data stream depends on the system in use. For the Vaisala MW41 sounding system, one can activate a script delivered by Vaisala. The script, RadiosondeLocation.py, continuously records the UTC time, latitude, longitude, and geometric height. It can be found in the folder of MW41\ScriptLibrary in the MW41 installation device (e.g. CD or USB). Please copy the script into the SoundingScripts folder of the PC's hard drive.
To obtain the GPS position with sufficient precision, we made a small change to the script. In the function handle_GPSResults, the line
is changed to
The same is applied to the variable longitude; i.e. the data are recorded with six decimals instead of four. The script is activated in the Administration / Report Templates and Scripts section of the MW41 software. The recording during descent needs to be activated in the Administration / Advanced / Sounding section, which should normally be the case for, e.g., RS41. Please refer to the MW41 documents for details.
The unfiltered position data from the radiosonde are then used to calculate zonal (u) and meridional (v) wind speeds as follows:
where λ and ϕ are the high-resolution longitude and latitude data in degrees, respectively. re denotes the Earth's radius, and δ is the central difference operator. From u and v, we then calculate the wind speed and direction, as well as the power spectra shown above, using MATLAB software.
In this study, we identified the self-induced balloon motions and pendulum motions of the radiosonde as being the most important distortions in balloon-borne wind measurements that prevent an evaluation on vertical scales below 300 m. As described in the main text, self-induced motions can be avoided by keeping the flow around the balloon in the subcritical Reynolds number range. The Reynolds number depends on the velocity, density, and the diameter of the balloon (Eq. 1). We want to give further guidance to the reader who would like to make sure that their sounding balloon stays in the subcritical Reynolds number range. Accordingly, we show the transition altitude from laminar to turbulent flow in relation to the balloon weight (as a measure for its size) and the ascent velocity in Fig. B1.
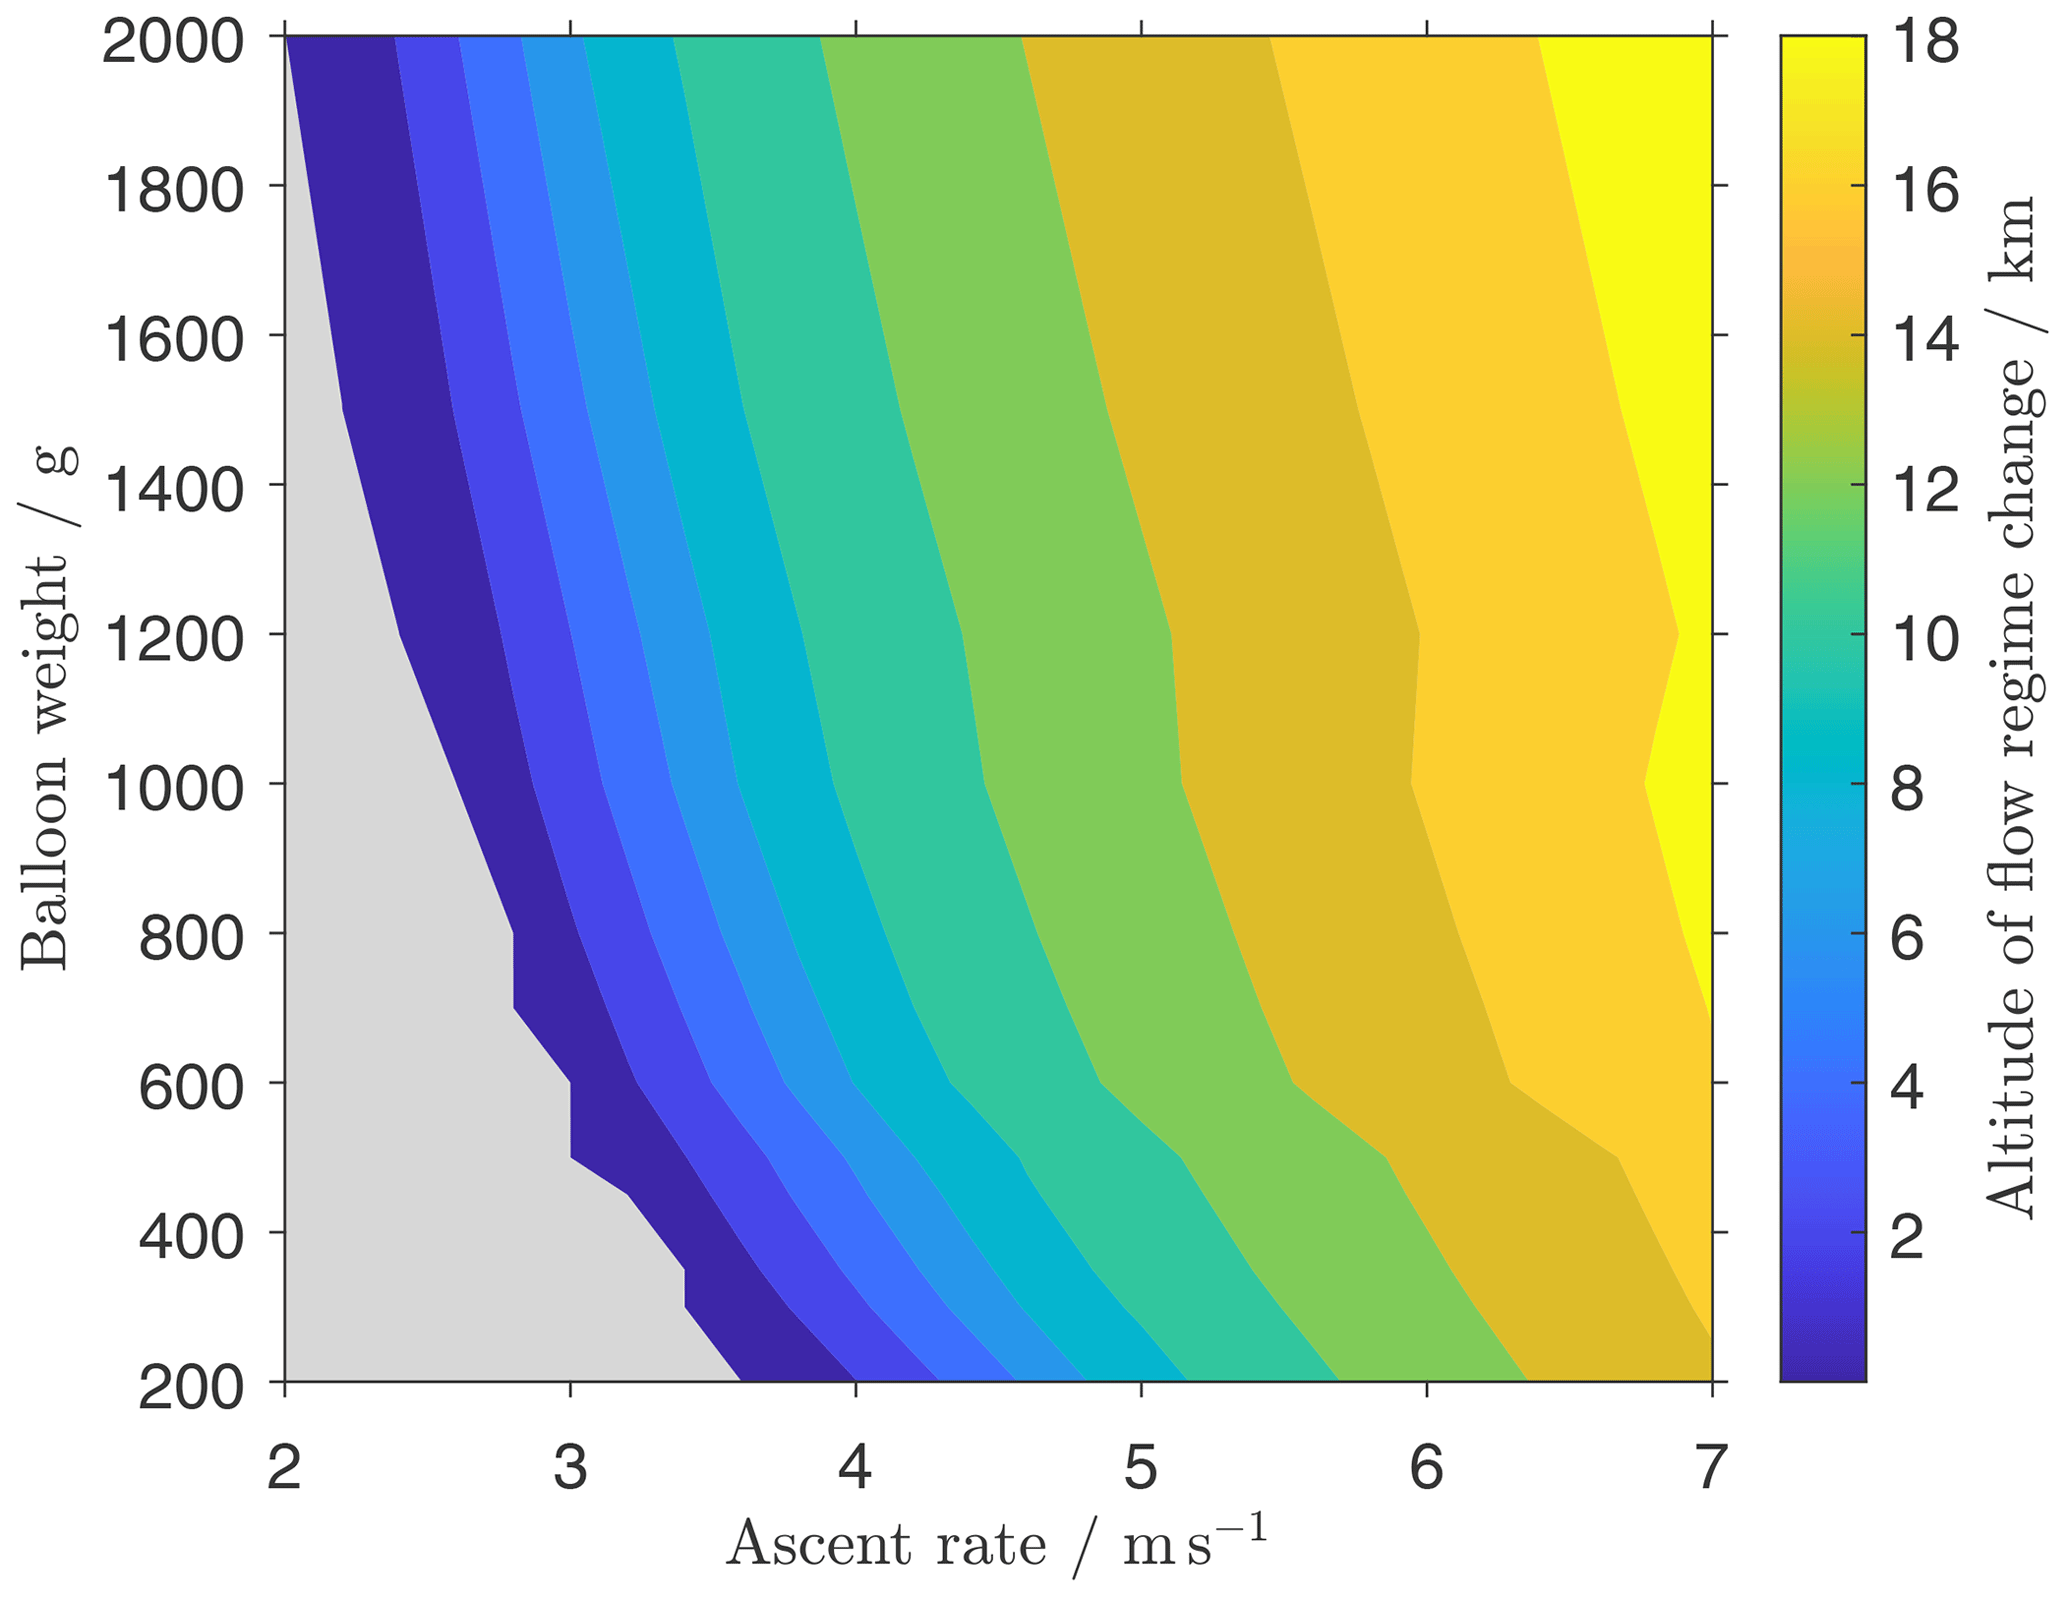
Figure B1Altitude of critical to subcritical flow regime change around the balloon as a function of ascent rate and balloon size (given by balloon weight). Grey areas mark ascent rate and weight combinations at which flow conditions are subcritical throughout the whole flight.
The balloon diameter has been calculated using information from the balloon manufacturer Totex on the drag coefficient of their balloons. This is used to calculate the required lift at the ground level. By assuming no pressure difference between the inside and the outside of the balloon, we then compute the changing diameter of the balloon for all altitudes from the amount of helium needed for the respective amount of lift at the ground level. We assume a payload weight of 100 g, which is typical of a modern radiosonde. Air densities are calculated as annual averages from the CIRA-86 data set for 50∘ N (Fleming et al., 1990).
This gives the reader a guide that shows which combinations of balloon size and ascent rate avoid the self-induced motions of a balloon. These motions are completely circumvented across all altitudes for the ascent rate and weight combinations marked by the grey colour shading in Fig. B1. Furthermore, we checked the dependence of our results on the latitude and season for standard radiosonde ascents performed at 5 m s−1. The height of the flow regime change around the balloon is increased by ∼ 900 m at the Equator, compared to mid-latitude soundings at 50∘ N. Regarding intra-annual variations, we find, for 50∘ N, that the height of flow transition is ∼ 500 m larger in July compared to January. All in all, we conclude that even though seasonal and latitudinal variations exist, their influence on the results presented in Fig. B1 is small.
The code and data provided in this work can be found at https://doi.org/10.12754/data-2023-0004 (Faber et al., 2023). We provide the following tools for readers who would like to implement our suggestions to their sounding set-up:
-
“Data samples” with standard Vaisala output and unfiltered position data for both balloon launches described in the paper.
-
The “balloon_filling” MATLAB function with which to calculate the required balloon lifts, depending on desired ascent rate, descent rate, and payload.
-
“Electronics” that include the board design and firmware.
-
“Mechanics” with 3D models of the housing for the electronics and the radiosonde mount.
The calculations done for the power spectra are well known to the scientific community, but the implementation in software very much depends on the user's needs. At our institute, it is embedded in a software solution that is beyond the scope of this study because it covers all ballooning operations carried out at the institute. Therefore, the code will be made available on request to the corresponding author.
JF developed the modifications to the sounding set-up, implemented the code for data evaluation and plotting, designed the mechanical parts of the altered payload, and wrote parts of the paper. MG contributed to the discussion of the new sounding set-up, oversaw the ballooning operations, and wrote parts of the paper. TK designed, tested, and built the custom-made electronics. All co-authors contributed to the discussion of the paper.
The contact author has declared that none of the authors has any competing interests.
Publisher’s note: Copernicus Publications remains neutral with regard to jurisdictional claims in published maps and institutional affiliations.
The authors would like to thank Michael Priester, for his help in preparing and launching the radiosondes, and an amateur radiosonde hunter, who found our modified payload and sent it back to us for further evaluation. Furthermore, we are thankful to Victor Avsarkisov and Niklas Dusch for their genuine interest in the enhanced capabilities and technical limitations of the new data sets. Additionally, we are grateful to the Multi-Scale Dynamics of Gravity Waves (MS-GWaves) community for countless helpful discussions on high-resolution and mesoscale measurements. Last, but not least, we are thankful to editor Ad Stoffelen and to Bruce Ingleby and one anonymous referee for their helpful comments that improved the paper and led to the creation of Appendix B.
The publication of this article has been funded by the Open Access Fund of the Leibniz Association.
This paper was edited by Ad Stoffelen and reviewed by Bruce Ingleby and one anonymous referee.
Achenbach, E.: Experiments on the flow past spheres at very high Reynolds numbers, J. Fluid Mech., 54, 565–575, https://doi.org/10.1017/S0022112072000874, 1972. a
Achenbach, E.: The effects of surface roughness and tunnel blockage on the flow past spheres, J. Fluid Mech., 65, 113–125, https://doi.org/10.1017/S0022112074001285, 1974. a, b, c, d
Barat, J., Cot, C., and Sidi, C.: On the Measurement of the Turbulence Dissipation Rate from Rising Balloons, J. Atmos. Ocean. Tech., 1, 270–275, https://doi.org/10.1175/1520-0426(1984)001<0270:OTMOTT>2.0.CO;2, 1984. a
Bramberger, M., Dörnbrack, A., Bossert, K., Ehard, B., Fritts, D. C., Kaifler, B., Mallaun, C., Orr, A., Pautet, P.-D., Rapp, M., Taylor, M. J., Vosper, S., Williams, B. P., and Witschas, B.: Does Strong Tropospheric Forcing Cause Large-Amplitude Mesospheric Gravity Waves? A DEEPWAVE Case Study, J. Geophys. Res.-Atmos., 122, 11422–11443, https://doi.org/10.1002/2017JD027371, 2017. a
Bramberger, M., Dörnbrack, A., Wilms, H., Ewald, F., and Sharman, R.: Mountain-Wave Turbulence Encounter of the Research Aircraft HALO above Iceland, J. Appl. Meteorol. Clim., 59, 567–588, https://doi.org/10.1175/JAMC-D-19-0079.1, 2020. a
Candy, B., Cotton, J., and Eyre, J.: Recent results of observation data denial experiments, Tech. rep., Met Office, United Kingdom, https://www.metoffice.gov.uk/binaries/content/assets/metofficegovuk/pdf/research/weather-science/frtr_641_2021p.pdf (last access: 24 August 2023), 2021. a
Dirksen, R. J., Sommer, M., Immler, F. J., Hurst, D. F., Kivi, R., and Vömel, H.: Reference quality upper-air measurements: GRUAN data processing for the Vaisala RS92 radiosonde, Atmos. Meas. Tech., 7, 4463–4490, https://doi.org/10.5194/amt-7-4463-2014, 2014. a, b, c
Dusch, N., Avsarkisov, V., Gerding, M., Söder, J., and Stolle, C.: Kinetic Heilcity: A Novel Tool to Study Turbulent Stratified Flows, Physical Review Fluids, in review, 2023. a, b
Faber, J., Gerding, M., and Köpnick, T.: Data sets, software and CAD drawings related to the following research article: Acquiring high-resolution wind measurements by modifying radiosonde sounding procedures, Leibniz Institute for Baltic Sea Research Warnemünde (IOW) [data set/code], https://doi.org/10.12754/data-2023-0004, 2023. a
Fleming, E. L., Chandra, S., Barnett, J., and Corney, M.: Zonal mean temperature, pressure, zonal wind and geopotential height as functions of latitude, Adv. Space Res., 10, 11–59, https://doi.org/10.1016/0273-1177(90)90386-E, 1990. a, b
Houchi, K., Stoffelen, A., Marseille, G.-J., and Kloe, J. D.: Statistical Quality Control of High-Resolution Winds of Different Radiosonde Types for Climatology Analysis, J. Atmos. Ocean. Tech., 32, 1796–1812, https://doi.org/10.1175/JTECH-D-14-00160.1, 2015. a
Hurst, D. F., Oltmans, S. J., Vömel, H., Rosenlof, K. H., Davis, S. M., Ray, E. A., Hall, E. G., and Jordan, A. F.: Stratospheric water vapor trends over Boulder, Colorado: Analysis of the 30 year Boulder record, J. Geophys. Res.-Atmos., 116, D02306, https://doi.org/10.1029/2010JD015065, 2011. a
Ingleby, B., Motl, M., Marlton, G., Edwards, D., Sommer, M., von Rohden, C., Vömel, H., and Jauhiainen, H.: On the quality of RS41 radiosonde descent data, Atmos. Meas. Tech., 15, 165–183, https://doi.org/10.5194/amt-15-165-2022, 2022. a, b, c, d, e
Isom, L. W.: Fast Rising Sounding Balloon, US Patent 2,492,800, Dewey and Amy Chemical Company, North Cambridge, Massachusetts, USA, https://patents.google.com/patent/US2492800A/en (last access: 24 August 2023), 1949. a
Kräuchi, A., Philipona, R., Romanens, G., Hurst, D. F., Hall, E. G., and Jordan, A. F.: Controlled weather balloon ascents and descents for atmospheric research and climate monitoring, Atmos. Meas. Tech., 9, 929–938, https://doi.org/10.5194/amt-9-929-2016, 2016. a, b, c
Lilly, D. K.: Stratified Turbulence and the Mesoscale Variability of the Atmosphere, J. Atmos. Sci., 40, 749–761, https://doi.org/10.1175/1520-0469(1983)040<0749:STATMV>2.0.CO;2, 1983. a
Luers, J. K. and Eskridge, R. E.: Use of Radiosonde Temperature Data in Climate Studies, J. Climate, 11, 1002–1019, https://doi.org/10.1175/1520-0442(1998)011<1002:UORTDI>2.0.CO;2, 1998. a
MacCready, P. B.: Comparison of Some Balloon Techniques, J. Appl. Meteorol., 4, 504–508, https://doi.org/10.1175/1520-0450(1965)004<0504:COSBT>2.0.CO;2, 1965. a, b
Marlton, G. J., Giles Harrison, R., Nicoll, K. A., and Williams, P. D.: Note: A balloon-borne accelerometer technique for measuring atmospheric turbulence, Rev. Sci. Instrum., 86, 016109, https://doi.org/10.1063/1.4905529, 2015. a
Mastenbrook, H. J.: A Control System for Ascent-Descent Balloon Soundings of the Atmosphere, J. Appl. Meteorol. Clim., 5, 737–740, https://doi.org/10.1175/1520-0450(1966)005<0737:ACSFAD>2.0.CO;2, 1966. a
Murrow, H. N. and Henry, R. M.: Self-Induced Balloon Motions, J. Appl. Meteorol., 4, 131–138, https://doi.org/10.1175/1520-0450(1965)004<0131:SIBM>2.0.CO;2, 1965. a, b
Nastrom, G. D., Van Zandt, T. E., and Warnock, J. M.: Vertical wavenumber spectra of wind and temperature from high-resolution balloon soundings over Illinois, J. Geophys. Res.-Atmos., 102, 6685–6701, https://doi.org/10.1029/96JD03784, 1997. a
Norman, A. K. and McKeon, B. J.: Unsteady force measurements in sphere flow from subcritical to supercritical Reynolds numbers, Exp. Fluids, 51, 1439, https://doi.org/10.1007/s00348-011-1161-8, 2011. a
Scoggins, J. R.: Spherical Balloon Wind Sensor Behavior, J. Appl. Meteorol., 4, 139–145, https://doi.org/10.1175/1520-0450(1965)004<0139:SBWSB>2.0.CO;2, 1965. a, b, c
Scoggins, J. R.: Sphere behavior and the measurement of wind profiles, Tech. rep., NASA, Washington, D.C., https://ntrs.nasa.gov/archive/nasa/casi.ntrs.nasa.gov/19670017960.pdf (last access: 24 August 2023), 1967. a, b
Söder, J.: Turbulence Observations on Soundings Balloons: Geophysical Interpretations based on Instrumental Revisions, PhD thesis, Rostock University, https://doi.org/10.18453/rosdok_id00002707, 2019. a
Söder, J., Gerding, M., Schneider, A., Dörnbrack, A., Wilms, H., Wagner, J., and Lübken, F.-J.: Evaluation of wake influence on high-resolution balloon-sonde measurements, Atmos. Meas. Tech., 12, 4191–4210, https://doi.org/10.5194/amt-12-4191-2019, 2019. a, b, c, d
Söder, J., Zülicke, C., Gerding, M., and Lübken, F.-J.: High-Resolution Observations of Turbulence Distributions Across Tropopause Folds, J. Geophys. Res.-Atmos., 126, e2020JD033857, https://doi.org/10.1029/2020JD033857, 2021. a
Taneda, S.: Visual observations of the flow past a sphere at Reynolds numbers between 104 and 106, J. Fluid Mech., 85, 187–192, https://doi.org/10.1017/S0022112078000580, 1978. a, b
Theuerkauf, A., Gerding, M., and Lübken, F.-J.: LITOS – a new balloon-borne instrument for fine-scale turbulence soundings in the stratosphere, Atmos. Meas. Tech., 4, 55–66, https://doi.org/10.5194/amt-4-55-2011, 2011. a
Tiefenau, H. K. E. and Gebbeken, A.: Influence of Meteorological Balloons on Temperature Measurements with Radiosondes: Nighttime Cooling and Daylight Heating, J. Atmos. Ocean. Tech., 6, 36–42, https://doi.org/10.1175/1520-0426(1989)006<0036:IOMBOT>2.0.CO;2, 1989. a, b, c
Vaisala: Vaisala Radiosonde RS41 Measurement Performance, https://www.vaisala.com/sites/default/files/documents/White%20paper%20RS41%20Performance%20B211356EN-A.pdf (last access: 24 August 2023), 2013. a, b
Vaisala: Vaisala Radiosonde RS41-SG accuracy and reliability, Vaisala Corporation, https://www.vaisala.com/sites/default/files/documents/WEA-MET-RS41-Datasheet-B211321EN.pdf (last access:24 August 2023), 2017. a, b
Venkat Ratnam, M., Pravallika, N., Ravindra Babu, S., Basha, G., Pramitha, M., and Krishna Murthy, B. V.: Assessment of GPS radiosonde descent data, Atmos. Meas. Tech., 7, 1011–1025, https://doi.org/10.5194/amt-7-1011-2014, 2014. a
Wang, J., Bian, J., Brown, W. O., Cole, H., Grubišić, V., and Young, K.: Vertical Air Motion from T-REX Radiosonde and Dropsonde Data, J. Atmos. Ocean. Tech., 26, 928–942, https://doi.org/10.1175/2008JTECHA1240.1, 2009. a
Wildmann, N., Eckert, R., Dörnbrack, A., Gisinger, S., Rapp, M., Ohlmann, K., and van Niekerk, A.: In Situ Measurements of Wind and Turbulence by a Motor Glider in the Andes, J. Atmos. Ocean. Tech., 38, 921–935, https://doi.org/10.1175/JTECH-D-20-0137.1, 2021. a
Wilson, R., Luce, H., Hashiguchi, H., Nishi, N., and Yabuki, Y.: Energetics of persistent turbulent layers underneath mid-level clouds estimated from concurrent radar and radiosonde data, J. Atmos. Sol.-Terr. Phy., 118, 78–89, https://doi.org/10.1016/j.jastp.2014.01.005, 2014. a
- Abstract
- Introduction
- How to enhance the accuracy of small-scale horizontal wind measurements on radiosondes
- New payload design for high-resolution wind soundings
- Discussion
- Conclusions
- Appendix A: Wind calculation from unfiltered position data
- Appendix B: Parameter range for subcritical flow conditions around the balloon
- Code and data availability
- Author contributions
- Competing interests
- Disclaimer
- Acknowledgements
- Financial support
- Review statement
- References