the Creative Commons Attribution 4.0 License.
the Creative Commons Attribution 4.0 License.
 | 07 Apr 2022
Retrieval of solar-induced chlorophyll fluorescence (SIF) from satellite measurements: comparison of SIF between TanSat and OCO-2
Lu Yao
Dongxu Yang
Zhaonan Cai
Jing Wang
Chao Lin
Naimeng Lu
Daren Lyu
Longfei Tian
Maohua Wang
Zengshan Yin
Yuquan Zheng
Sisi Wang
Solar-induced chlorophyll fluorescence (SIF) is emitted during photosynthesis in plant leaves. It constitutes a small additional offset to reflected radiance and can be observed by sensitive instruments with high signal-to-noise ratio and spectral resolution. The Chinese global carbon dioxide monitoring satellite (TanSat) acquires measurements of greenhouse gas column densities. The advanced technical characteristics of the Atmospheric Carbon-dioxide Grating Spectrometer (ACGS) onboard TanSat enable SIF retrievals from observations in the O2-A band. In this study, 1-year of SIF data was retrieved from Orbiting Carbon Observatory-2 (OCO-2) and TanSat measurements using the Institute of Atmospheric Physics Carbon Dioxide Retrieval Algorithm for Satellite Remote Sensing (IAPCAS)/SIF algorithm. A comparison between the IAPCAS/SIF results retrieved from OCO-2 spectra and the official OCO-2 SIF product (OCO2_Level 2_Lite_SIF.8r) shows a strong linear relationship (R2 > 0.85) and suggests good reliability of the IAPCAS/SIF retrieval algorithm. Comparing global distributions of SIF retrieved by the IAPCAS/SIF from TanSat and OCO-2 shows the same spatial pattern for all seasons with a gridded SIF difference of less than 0.3 W m−2 µm−1 sr−1. The global distributions also agree well with the official OCO-2 SIF product with a difference of less than 0.2 W m−2 µm−1 sr−1. The retrieval uncertainty of seasonally gridded TanSat IAPCAS/SIF is less than 0.03 W m−2 µm−1 sr−1, whereas the uncertainty of each sounding ranges from 0.1 to 0.6 W m−2 µm−1 sr−1. The relationship between annually averaged SIF products and FLUXCOM gross primary productivity (GPP) was also estimated for six vegetation types in a 1∘ × 1∘ grid over the globe, indicating that the SIF data from the two satellites have the same potential in quantitatively characterizing ecosystem productivity. The spatiotemporal consistency between TanSat and OCO-2 and their comparable data quality enable joint usage of the two mission products. Data supplemented by TanSat observations are expected to contribute to the development of global SIF maps with more spatiotemporal detail, which will advance global research on vegetation photosynthesis.


Terrestrial vegetation ecosystems play a large role in the global carbon cycle through the processes of photosynthesis and respiration. Incoming radiation is absorbed, reflected, and/or transmitted by plant leaves. A portion of the absorbed radiation is used by the chlorophyll in plant leaves for carbon fixation, while the rest is either dissipated as heat or re-emitted as solar-induced chlorophyll fluorescence (SIF) at longer wavelengths (Frankenberg et al., 2011a, 2014). In contrast to the traditional remotely sensed vegetation indices obtained from some studies (Frankenberg et al., 2011b; Guanter et al., 2014; Li et al., 2018; Y. Sun et al., 2017; X. Yang et al., 2015; Zhang et al., 2014), SIF offers the potential to measure photosynthetic activity and gross primary production (GPP), due to the strong correlation between these measures (Frankenberg et al., 2011b; Guanter et al., 2012, 2014). The fluorescence emission adds a low-intensity radiance of less than 10 W m−2 µm−1 sr−1 and fills in the solar absorption features of the reflected spectrum (Frankenberg et al., 2011a). The filling-in effect of the solar lines (Fraunhofer lines) is the basic principle applied to measure SIF from space using the capabilities of hyperspectral observation (Frankenberg et al., 2011b; Guanter et al., 2012).
The first attempt of observing SIF from space was performed using images acquired by the Medium Resolution Imaging Spectrometer (MERIS) onboard the ENVIronmental SATellite (ENVISAT; Guanter et al., 2007). This led to a new idea for conducting SIF studies on a global scale. The first global SIF map was retrieved from high-resolution spectra of the Greenhouse-gases Observing SATellite (GOSAT; Joiner et al., 2011; Frankenberg et al., 2011b). After that, SIF retrievals were implemented for a variety of satellite measurements, such as those from the Global Ozone Monitoring Experiment-2 (GOME-2) instruments onboard meteorological operational satellites, SCIAMACHY onboard ENVISAT, and the Orbiting Carbon Observatory-2 (OCO-2; Joiner et al., 2016; Köhler et al., 2015). The TROPOspheric Monitoring Instrument (TROPOMI) onboard Sentinel 5 Precursor (S-5P) provides more efficient SIF observations in terms of global coverage and new opportunities for exploring the application potential of SIF data in the terrestrial biosphere as well as in climate research (Doughty et al., 2019; Köhler et al., 2018b). Furthermore, an upcoming European Space Agency mission called FLuorescence EXplorer (FLEX), the first satellite dedicated to SIF observation, will launch in the middle of 2024 (Drusch et al., 2017). Many studies on SIF applications have been initiated with the accumulation of SIF products in recent years. The responses of satellite-measured SIF to environmental conditions have been applied to drought dynamics monitoring and regional vegetation water stress estimation (Lee et al., 2013; Sun et al., 2015; Yoshida et al., 2015). As a proxy of photosynthesis, SIF acts as a powerful constraint parameter in estimating carbon exchange between the ecosystem and the atmosphere, ocean, and soil; as such, the analysis of the relationship between SIF and GPP has become an important research topic (Li et al., 2018; Köhler et al., 2018a; Y. Sun et al., 2017; Zhang et al., 2018). The strong linear relationship between them paves the way for improving terrestrial ecosystem model simulations of GPP, along with consequent improvement of global carbon flux estimation (MacBean et al., 2018; Yin et al., 2020). GPP estimations based on satellite-measured SIF have proven to be an effective method validated by in situ flux observations (Joiner et al., 2018; Qiu et al., 2020). However, uncertainty in the factors that determine the relationship between SIF and GPP still exists and is a key limitation in the application of SIF to flux estimation. Based on multi-satellite SIF products, eddy covariance flux tower observations, and ecological models, the relationship between SIF and GPP under different environmental conditions has been discussed in a number of studies to analyze the dominant factors for the growing status of different biomes, such as temperature, soil moisture, and vegetation types (Chen et al., 2021; Doughty et al., 2019; Li et al., 2020; Qiu et al., 2020; Yin et al., 2020).
The Chinese global carbon dioxide monitoring satellite (TanSat) was launched in December 2016. Aiming at acquiring CO2 concentrations similar to OCO-2, TanSat flies in a sun-synchronous orbit at approximately 700 km height with a 16 d repeat cycle and an Equator crossing time of ∼ 13:30 local time (Cai et al., 2014; Liu et al., 2018; Yang et al., 2018). Onboard TanSat, the hyperspectral Atmospheric Carbon-dioxide Grating Spectrometer (ACGS) is designed to separately record solar backscatter spectra in three channels centered at 0.76 µm (O2-A band), 1.61 µm (weak CO2 absorption band), and 2.06 µm (strong CO2 absorption band). Many optimal estimation method (OEM) full physics retrieval algorithms have been developed and applied for the total column-averaged dry air CO2 mole fraction (XCO2) retrievals (Bösch et al., 2006; O'Dell et al., 2012; Reuter et al., 2010; D. Yang et al., 2015; Yoshida et al., 2011, 2013). The Institute of Atmospheric Physics Carbon Dioxide Retrieval Algorithm for Satellite Remote Sensing (IAPCAS) algorithm has been applied for TanSat XCO2 retrievals (Yang et al., 2018, 2021) and was also previously tested on spectra from the GOSAT and OCO-2 missions (D. Yang et al., 2015). However, the fluorescence feature causes substantial biases when retrieving surface pressure and scattering parameters from the O2-A band, and the associated errors propagate into the XCO2 retrievals. In previous XCO2 retrievals, the surface emissions were well modeled as a continuum offset of the O2-A band to reduce errors (Frankenberg et al., 2011a, 2012; Joiner et al., 2012). For TanSat, its high spectral resolution of ∼ 0.044 nm and a signal-to-noise ratio of ∼ 360 in the O2-A band makes it possible to obtain SIF, with a spatial resolution of 2 km × 2 km in nadir mode (Liu et al., 2018).
Various approaches have been used to infer SIF from satellite measurements (Frankenberg et al., 2011b, 2014, Frankenberg, 2014; Guanter et al., 2007, 2012, 2015; Joiner et al., 2011, 2013, 2016; Köhler et al., 2015, 2018b). The SIF signal induces a filling-in effect of solar lines, which can be used for SIF retrieval, as the fractional depth of solar Fraunhofer lines does not change during radiation transmission in the atmosphere. To be able to measure the filling-in features from SIF, high-resolution spectra are required to describe subtle changes in the spectral absorption lines. Given highly resolved spectral features, a method was developed based on solar line fitting and the Beer–Lambert law. This method is robust and accurate when the spectrum is out of the influence of telluric absorptions, even in the presence of aerosols (Frankenberg et al., 2011a; Joiner et al., 2011); in the current study, this method was applied to develop the IAPCAS/SIF algorithm. Another SIF retrieval method is the data-driven algorithm based on the singular value decomposition (SVD) technique (Joiner et al., 2011; Guanter et al., 2012), which has been broadly applied to GOSAT, OCO-2, TanSat and TROPOMI (Joiner et al., 2011; Guanter et al., 2012, 2015; Frankenberg et al., 2014; Du et al., 2018; Köhler et al., 2018b). In the data-driven method, the spectrum is represented as a linear combination of the SIF signal and several singular vectors that are trained from non-fluorescent scenes by SVD; thus, the SIF signal can be obtained with linear least-squares fitting (Du et al., 2018; Guanter et al., 2012). The first TanSat SIF map was obtained by the SVD method (Du et al., 2018). In a previous study, a new TanSat SIF product retrieved by the IAPCAS/SIF algorithm was introduced and the two kinds of TanSat SIF products of the IAPCAS/SIF and the SVD methods were compared (Yao et al., 2021). The preliminary comparison between the two TanSat SIF products showed that they share similar global patterns and signal magnitudes for all seasons, while different biases still exist for the four seasons (Yao et al., 2021). The different biases in the four seasons may be caused by the different training samples of the SVD method, which indicates that the training samples have a significant impact on the retrieval results. In order to obtain stable SIF data products from TanSat and other subsequent satellite missions, it is particularly important to establish a stable and high-precision SIF inversion algorithm. To further validate the IAPCAS/SIF algorithm and to test the potential for synergistic, multi-satellite SIF analysis, in this study, we detail the IAPCAS/SIF algorithm for TanSat and we compare the SIF products from TanSat and OCO-2 for a range of spatiotemporal scales.
2.1 Retrieval principle and method
We used TanSat version 2 Level 1B (L1B) nadir-mode Earth observation data in the retrieval process. The measurements covered the period from March 2017 to February 2018. Polarized radiance in the O2-A band with a spectral resolution of 0.044 nm was provided in the L1B data, and two micro-windows near 757 nm (758.3–759.2 nm) and 771 nm (769.6–770.3 nm) were chosen to retrieve top-of-atmosphere (TOA) SIF while avoiding the contamination from strong lines of atmospheric gas absorption. The retrieval was independent for each micro-window as shown in Fig. 1. To avoid duplication of information, we use the SIF product at 757 nm as the example in the analysis.

Figure 1The fitted spectra and residuals for the (a) 757 nm and (b) 771 nm micro-windows of TanSat measurement. The error bar of the measured spectra depicts the estimated precision of each TanSat sounding.
Filling-in on solar lines by chlorophyll fluorescence in the O2-A band can be detected in the hyperspectral measurements from TanSat. This effect on spectral radiance is different from the impact of atmospheric and surface processes, e.g., scattering and absorption. For example, scattering by aerosols and clouds does not change the relative depth of clear solar lines, unlike the SIF emission signal. We applied the differential optical absorption spectroscopy (DOAS) technique to IAPCAS/SIF algorithm for TanSat measurement (Frankenberg, 2014; Sun et al., 2018).
The TOA spectral radiance at wavelength λ can be represented as follows:
where is the incident solar irradiance at the TOA, μ0 is the cosine of the solar zenith angle (SZA), is atmospheric path reflectance, is surface reflectance, and and are the total atmospheric transmittances along the light path in the downstream and upstream directions, respectively. is the SIF radiance at TOA.
The first term on the right of Eq. (1) represents the transmission process of solar radiance. In the micro-windows used in SIF retrieval, gas absorption is very weak and smooth, and hence, the atmosphere term can be simplified to a low-order polynomial that varies with λ (Joiner et al., 2013; Sun et al., 2018); this is always valid as long as the spectrum fitting range is out of sharp atmospheric absorptions. Then Eq. (1) could be represented as
where 〈〉 denote the convolution with the instrumental spectral response function (ISRF) from the line-by-line spectra, and the coefficient vector a determines the wavelength dependence polynomial for the atmosphere term.
To facilitate the extraction of SIF signals, the radiance is normalized to the continuum level radiance and the relative contribution of SIF to the continuum level radiance is defined. In the micro-window, SIF was regarded as a constant signal due to its small changes. When the spectral radiance measurement was converted to logarithmic space, the forward model was expressed as
where It is a normalized disk-integrated solar transmission model. The vector b consists of the polynomial coefficients bi and we used a second-order polynomial (i=0, 1, 2) in the retrieval.
Although the atmospheric gas absorption was very weak in the micro-window, the weak absorption and the far-wing effects (O2 lines) can still change spectral features, which induces errors in spectrum fitting. In other physics-based retrievals, the surface pressure data of the European Centre for Medium-Range Weather Forecasts (ECMWF) together with topographic data are usually used as the true surface pressure to simulate the atmospheric transmission in the range of the O2-A band. However, there is still a difference between the true surface pressure and the model surface pressure, so we introduced a factor here to reduce the influence of the inaccurate surface pressure. In the IAPCAS/SIF algorithm, we use the ECMWF interim surface pressure (0.75∘ × 0.75∘) to estimate O2 absorption first and then modify the absorption feature by a scale factor. The scale factor is obtained simultaneously in SIF retrieval to reduce the error induced by the uncertainty in surface pressure. As described by Yang et al. (2020), there is also a continuum feature in TanSat L1B data that needs to be considered for the high-quality fitting of the O2-A band. However, in this study, this continuum feature was not corrected, as the impact of such a smooth continuum variation in the micro-window is weak and the polynomial continuum model is capable of compensating for most of this effect.
The state vector includes the relative SIF signal , a wavenumber shift, the scale factor for the O2 column absorption, and coefficients of the polynomial. The continuum level radiance Icont within the fitting window is calculated using the radiance outside the absorption features in the micro-window and is then used for the actual SIF signal calculation thus, .
In the IAPCAS/SIF algorithm, we used an OEM for state vector optimization in the retrieval process. Compared to the IAPCAS XCO2 retrieval, the IAPCAS/SIF retrieval employs a state vector with fewer elements and a much simpler forward model, so there is no need to perform complex radiative transfer calculations. Considering the low complexity of SIF retrieval, the Gauss–Newton method was applied to find the optimal solution.
2.2 Bias corrections
A systematic error remains in the raw SIF retrieval output if no bias correction is performed; similar results have been reported in GOSAT and OCO-2 SIF retrieval studies (Frankenberg et al., 2011a, b; Sun et al., 2018). This is because the SIF signal is weak (e.g., typically 1 %–2 % of the continuum level radiance), which means that even a small issue in the measurement, such as a zero-offset caused by radiometric calibration error, could induce significant bias. Unfortunately, the lack of knowledge on in-flight instrument performance makes it difficult to perform a direct systematic bias correction in the measured spectrum.
The bias was considered to be related to the continuum level radiance in the previous works. To get the relationship between the continuum level radiance and the bias, we calculated the mean bias for continuum level radiance at the interval of 5 W m−2 µm−1 sr−1 from all non-fluorescence measurements, and then a piecewise linear function fit was applied to describe the relationship between the continuum level radiance and the biases.
The non-fluorescence soundings that were used in the bias estimation were based on the dataset “sounding_landCover” in TanSat L1B data. This dataset depends on the MODIS land cover product and provides a scheme consisting of 17 land cover classifications defined by the International Geosphere-Biosphere Programme. The measurements marked as “snow and ice,” “barren,” and “sparsely vegetated” were chosen to estimate the bias. Calibrations compensated for most of the instrument degradations, but this alone was not perfect. To reduce the impact of the remaining minor discrepancies, we built the bias correction function daily to obtain bias for each sounding via interpolation of the continuum level radiance (K. Sun et al., 2017; Sun et al., 2018).
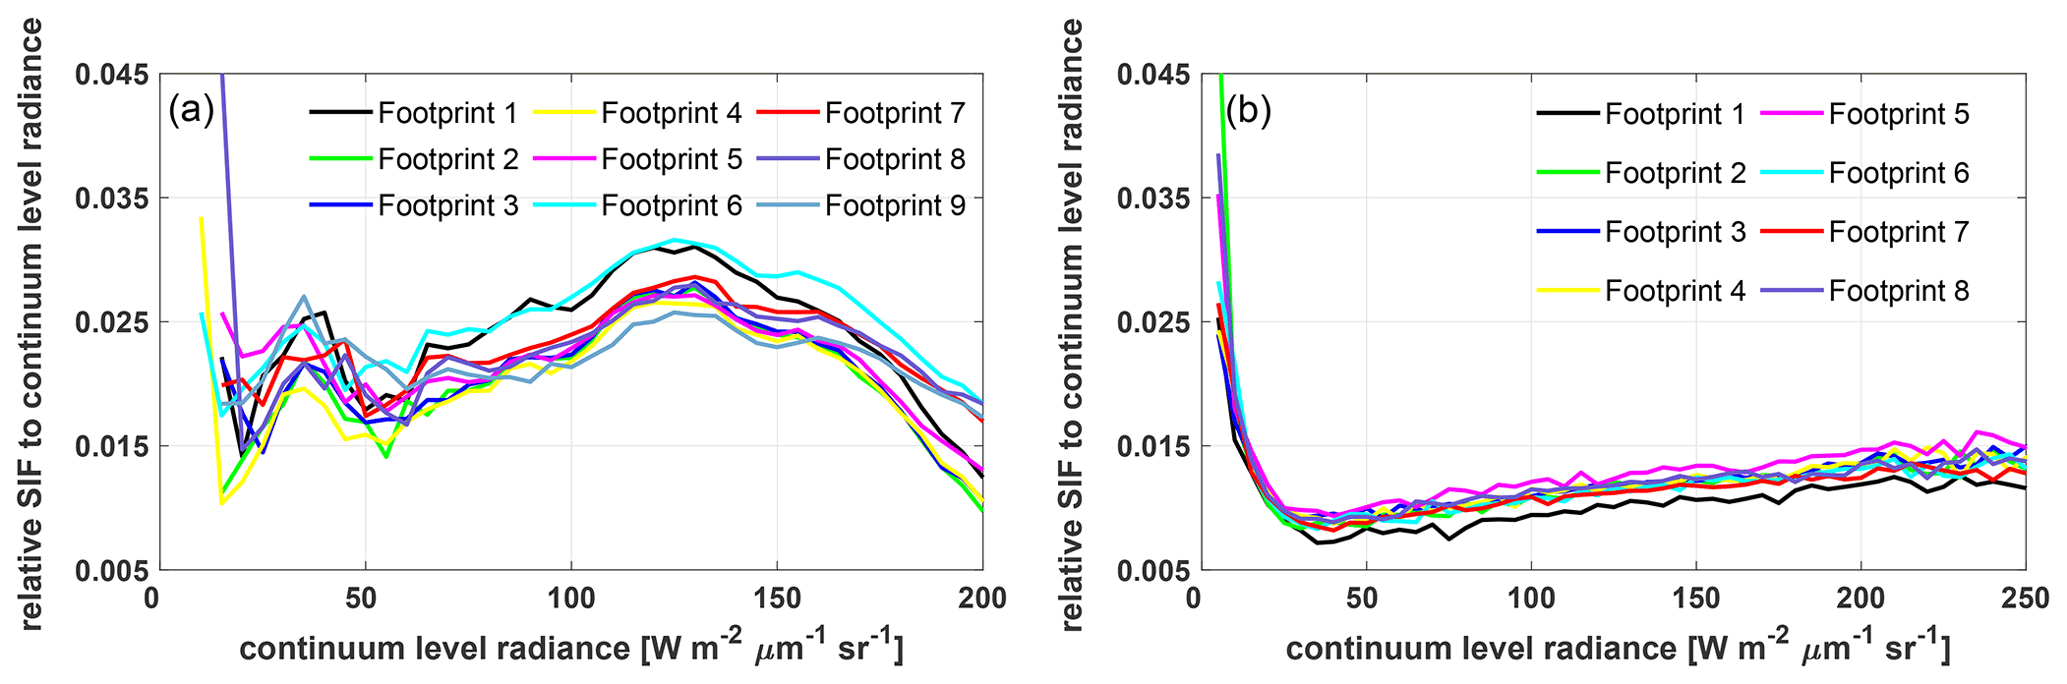
Figure 2Variations in the bias correction curves of continuum level radiance from (a) TanSat on 7 July 2017 and (b) Orbiting Carbon Observatory-2 (OCO-2) on 16 June 2017. The different colors in the legend present different footprints of the satellite frame.
The bias curves shown in Fig. 2 differ significantly between TanSat and OCO-2. This is mostly due to the differences in instrument performance and radiometric calibration. In general, the TanSat bias curves exhibited two peaks at radiance levels of approximately 40 and 125 W m−2 µm−1 sr−1, separately, and most biases were larger than 0.015. For OCO-2, the curves dropped sharply at low radiance levels, reaching a valley at a radiance level of approximately 40 W m−2 µm−1 sr−1, and then increased slowly with the radiance level.
2.3 Data quality control
Only data that passed quality control were used in further applications. There were two data quality control processes for the SIF products: pre-screening and post-screening. Pre-screening focused mainly on cloud screening; only cloud-free measurements were used in SIF retrieval. A surface pressure difference (SPD), defined as
was used to evaluate cloud contamination along with a χ2 test:
where ysim, yobs, and ynoise represent the model fitting spectrum, observation spectrum, and spectrum noise, respectively. Pretrieval is the apparent surface pressure obtained from O2-A band surface pressure retrieval, assuming a Rayleigh scattering atmosphere. PECMWF is the surface pressure data from the ECMWF interim (0.75∘ × 0.75∘) reanalysis data product (Dee et al., 2011), which is interpolated to the sounding location and corrected for elevation differences with the Shuttle Radar Topography Mission Global 30 Arc-Second Elevation digital elevation model (https://doi.org/10.5067/MEaSUREs/SRTM/SRTMGL30.002, NASA JPL, 2013). A “cloud-free” measurement was required to simultaneously satisfy an SPD of less than 20 hPa and a χ2 value of less than 80. Here, post-screening was applied to filter out “bad” retrievals; this screening process involved the following steps: (1) SIF retrievals with reduced values ranging from 0.7 to 1.3 were considered “good” fitting, (2) continuum level radiance outside the range of 15–200 W m−2 µm−1 sr−1 was screened out to avoid scenes too bright or too dark, and (3) soundings with the SZA higher than 60∘ were also filtered out.
2.4 IAPCAS versus IMAP-DOAS OCO-2 SIF retrieval
Before applied to TanSat retrievals, we tested the IAPCAS/SIF algorithm on the OCO-2 L1B data first (OCO2_L1B_Science.8r) and then compared the retrieval results with the OCO-2 L2 Lite SIF product (OCO2_Level 2_Lite_SIF.8r) retrieved by the Iterative Maximum A Posteriori-Differential Optical Absorption Spectroscopy (IMAP-DOAS) algorithm (Frankenberg, 2014). The Lite product provides the SIF value for each sounding and hence the SIF comparison could be performed on the sounding scale for each month.
Table 1Summary of the relationship between the IAPCAS OCO-2 and IMAP-DOAS OCO-2 SIF products in the 757 nm micro-window.
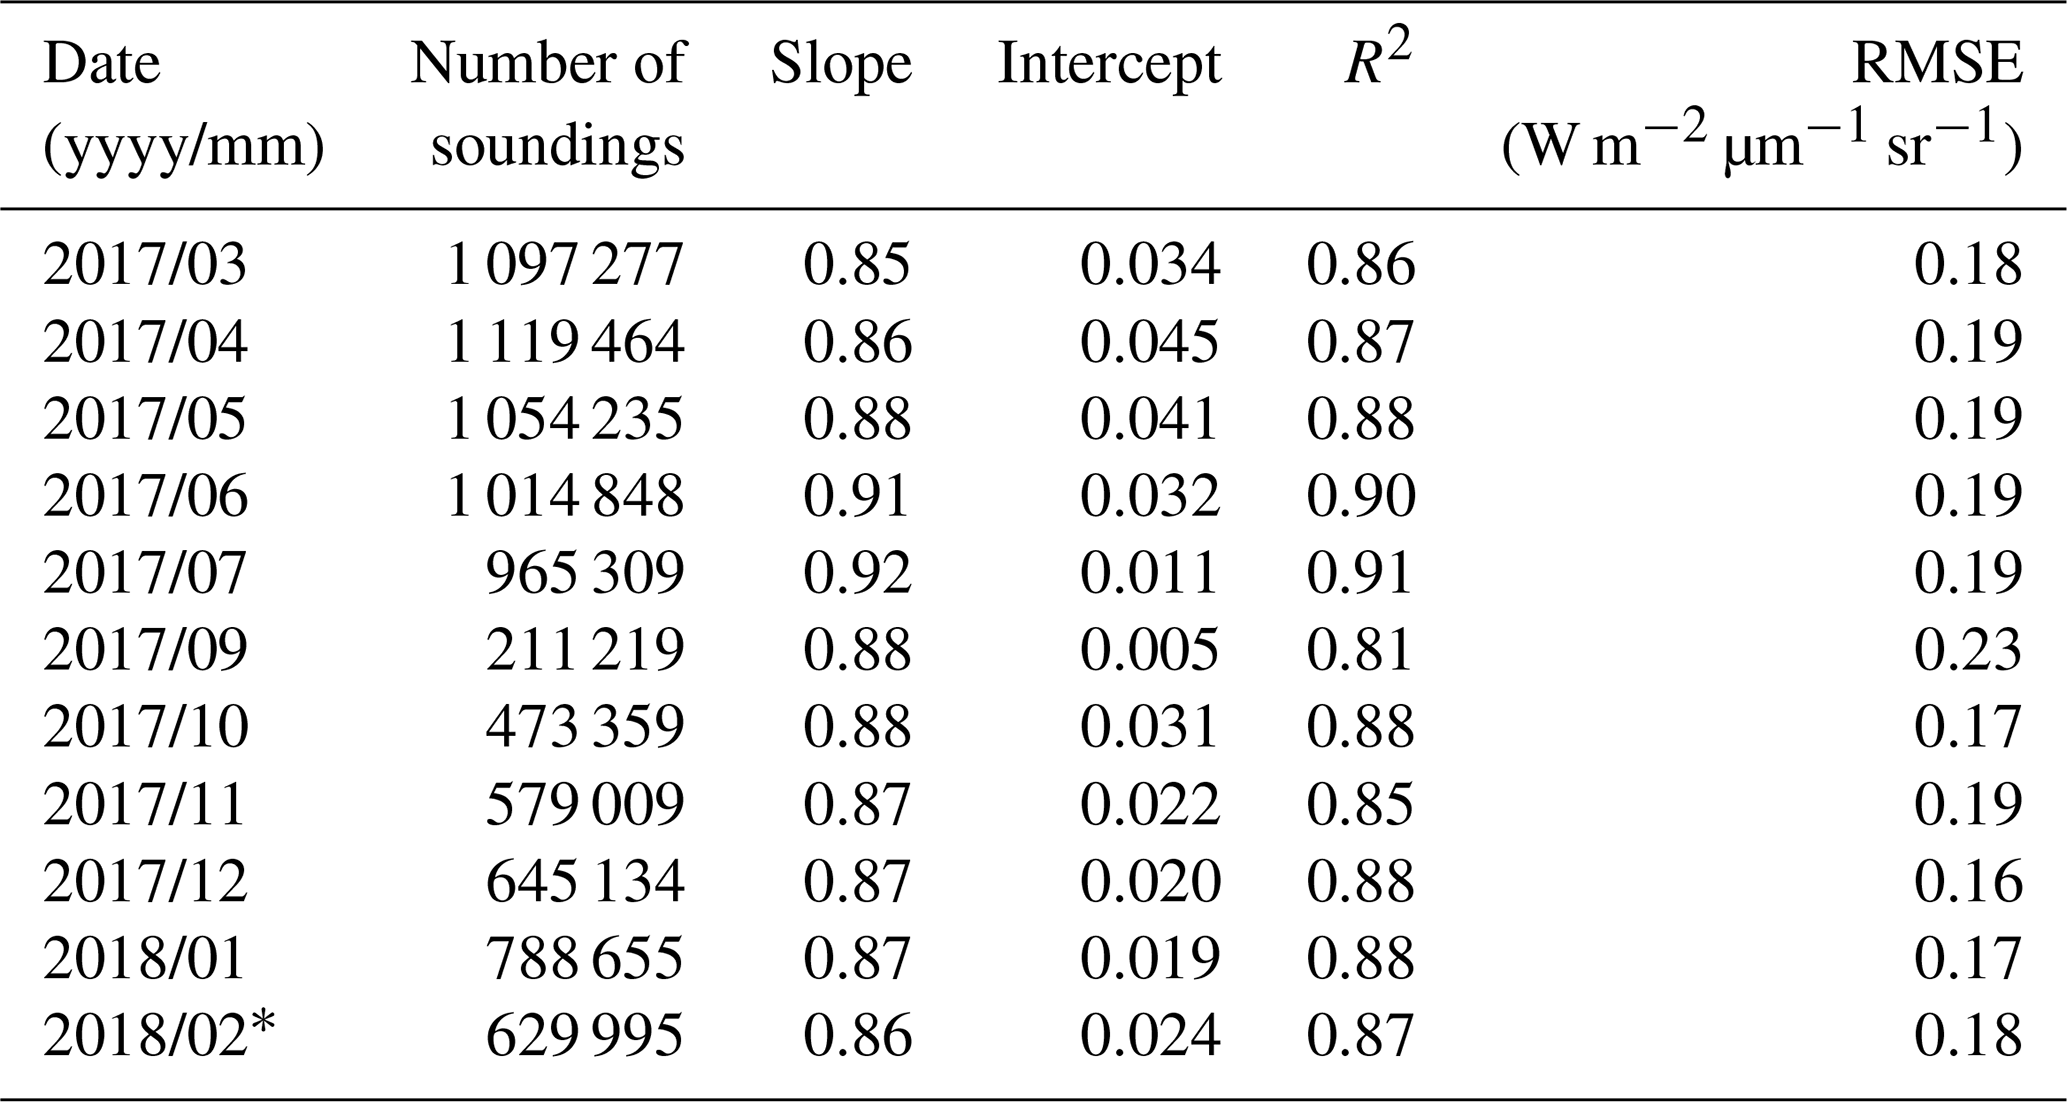
∗ Due to the lack of OCO-2 measurements in August 2017, the comparison is only performed for 11 months.
Table 1 displays the relationship of OCO-2 SIF values between the IAPCAS/SIF and IMAP-DOAS in a 757 nm micro-window for each month. Overall, the two SIF products were in good agreement. The linear fitting of the two SIF products suggests that they are highly correlated, as indicated by the strong linear relationship with R2 mostly larger than 0.85 and the root mean square error (RMSE) of about 0.2 W m−2 µm−1 sr−1. Good consistency between the two SIF products implies the reliability of the IAPCAS/SIF algorithm; thus, it was further applied to TanSat SIF retrieval. However, there was still a small bias in the comparisons, which was due, most likely, to the impact of differences in the bias correction method, retrieval algorithm, and fitting window.
3.1 Comparison between TanSat and OCO-2 SIF measurements
The comparison between TanSat and OCO-2 SIF measurements is a useful and powerful method for further verification of the IAPCAS/SIF algorithm. The reason for adopting OCO-2 data is that OCO-2 and TanSat have similar observation modes, including scanning method, transit time, spatial resolution, spectral resolution, and spectral range. The similarities mean that the SIF product from the two satellite missions can be directly compared. Directly comparing OCO-2 and TanSat SIF measurements could provide information on joint data application at the sounding scale for further studies. However, an identical sounding overlap only slightly exists because the two satellites often have different nadir tracks on the ground, which is induced by the different temporal and spatial intervals of the two satellite missions. Fortunately, the ground tracks of the two satellites were relatively close from 17 to 23 April 2017. A couple of overlapping orbits were found in the measurements obtained from Africa with the orbit number of 1733 from TanSat and 14890a from OCO-2 (Fig. 3). In the comparison, the OCO2_Level 2_Lite_SIF.8r product was used to present the SIF emission over the study area. These overlapping measurements encompassed multiple land cover types, in which the SIF varied within an acceptable time difference (< 5 min).
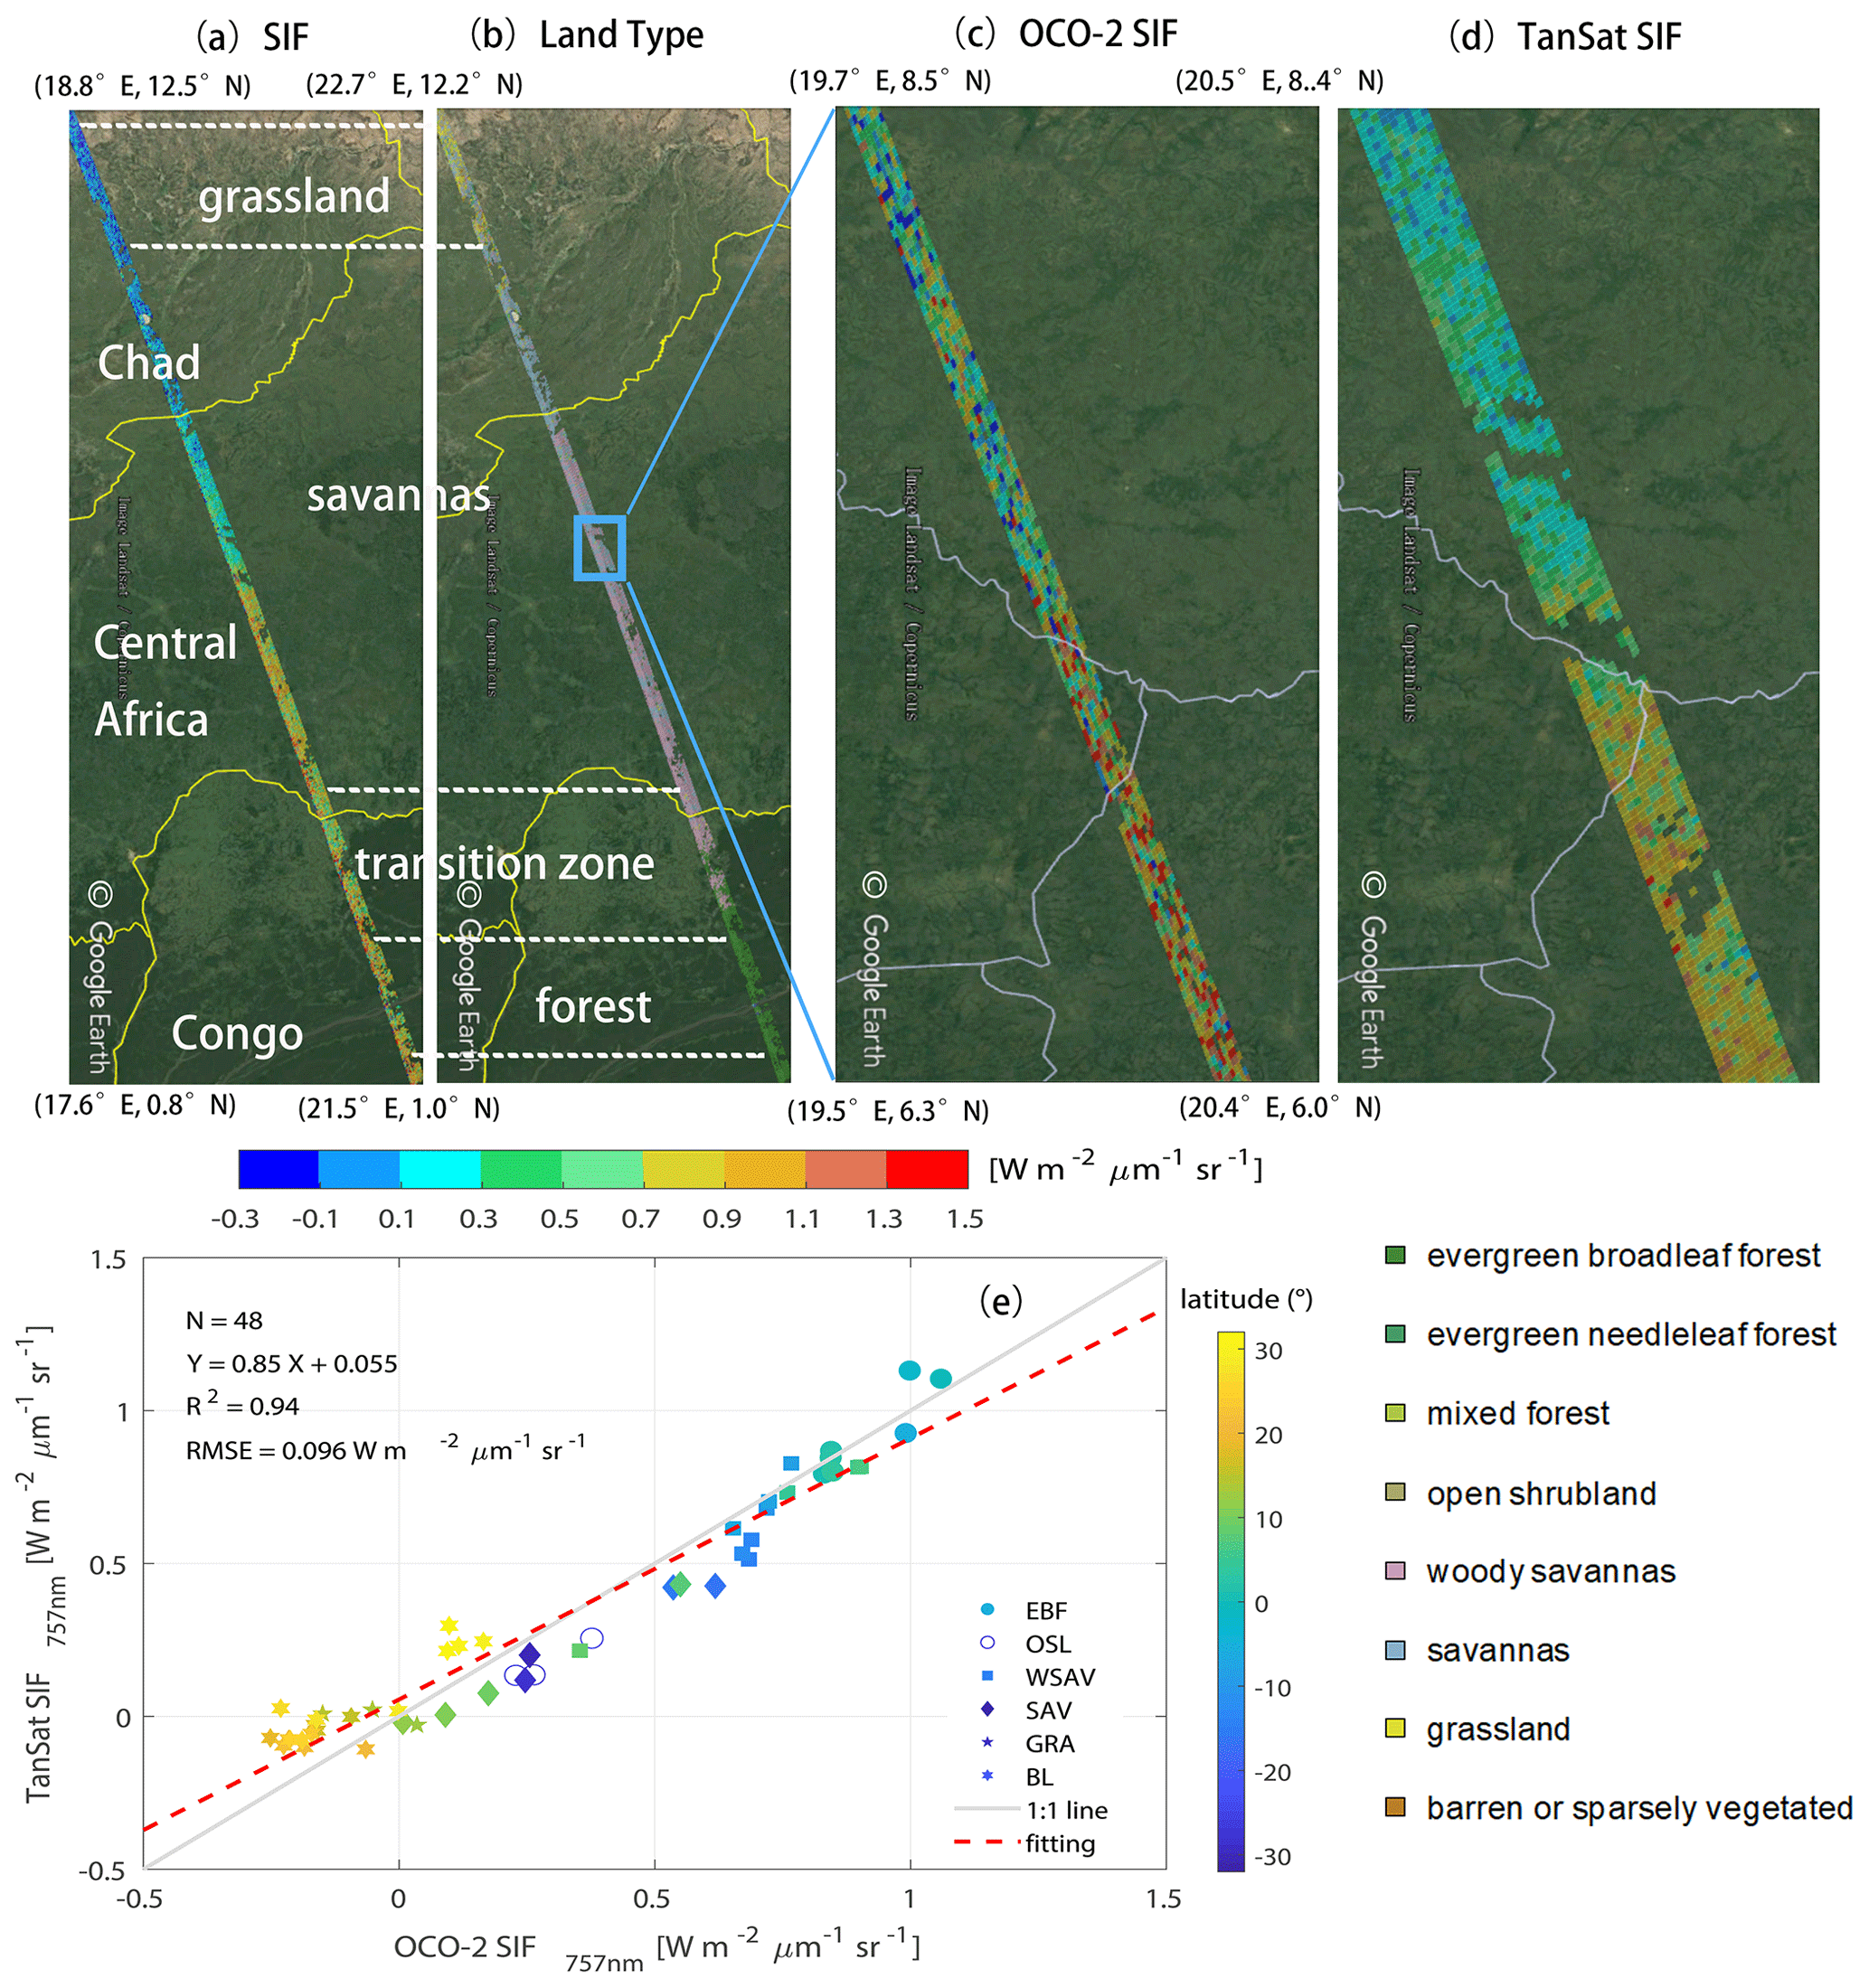
Figure 3Overlapping orbits of TanSat and OCO-2 on 19 April 2017 over Africa displayed in © Google Earth: (a) the SIF measurements from both satellites and (b) the footprint land cover type were compared. Compared to OCO-2, TanSat has a wider swath width. A zoomed-in view of the savannas shows variations in the SIF signal measured by (c) OCO-2 and (d) TanSat. The land surface image shown in Google Earth is provided by Landsat/Copernicus team. Following the International Geosphere-Biosphere Programme classification scheme, the vertical legend on the bottom right corner depicts the land cover type that occurs in the study area. The middle horizontal color bar represents the intensity of the SIF radiance. (e) Small-area SIF comparison between OCO-2 and TanSat; each data point represents the mean SIF of a degree in latitude (colors) along the track. The marker legend that is shown on the bottom right of the plot indicates the dominant land cover (defined as the majority land cover type of each sounding) in each small area. There are six land cover types including evergreen broadleaf forest (EBF), open shrubland (OSL), woody savanna (WSAV), savanna (SAV), grassland (GRA), and barren land (BL). The red dashed line represents the linear fit between the two SIF products with statistics shown in the upper left of the plot. The gray line indicates a 1 : 1 relationship for reference.
Overall, measurements from the two satellites indicated SIF variation with land cover type. The SIF emission over evergreen broadleaf forests was larger than that over savannas, and grasslands exhibited the lowest SIF emission in April (Fig. 3a, b). The mean SIF emission over evergreen broadleaf forests was approximately 0.9–1.1 W m−2 µm−1 sr−1, whereas those over savannas and grasslands were 0.5–0.7 W m−2 µm−1 sr−1 and less than 0.1 W m−2 µm−1 sr−1, respectively (Fig. 3c, d). Furthermore, we also found a significant difference in the SIF emission intensity over tropical savannas, which was observed by both satellites (Fig. 3c, d).
Because the footprint sizes of the two satellites are different, it is difficult to make a direct footprint-to-footprint comparison. Therefore, we made the comparison between the two satellite measurements based on a small-area average. Each small area spans a degree in latitude and continues along the track. The small-area-averaged SIF comparison is shown in Fig. 3e. The results indicate good agreement, with an R2 of 0.94 and an RMSE of 0.096 W m−2 µm−1 sr−1. Additional ground-based SIF measurement setups (Guanter et al., 2007; Liu et al., 2019; van der Tol et al., 2016; X. Yang et al., 2015; Yu et al., 2019) should allow for direct evaluation of satellite retrieval accuracy in the future.
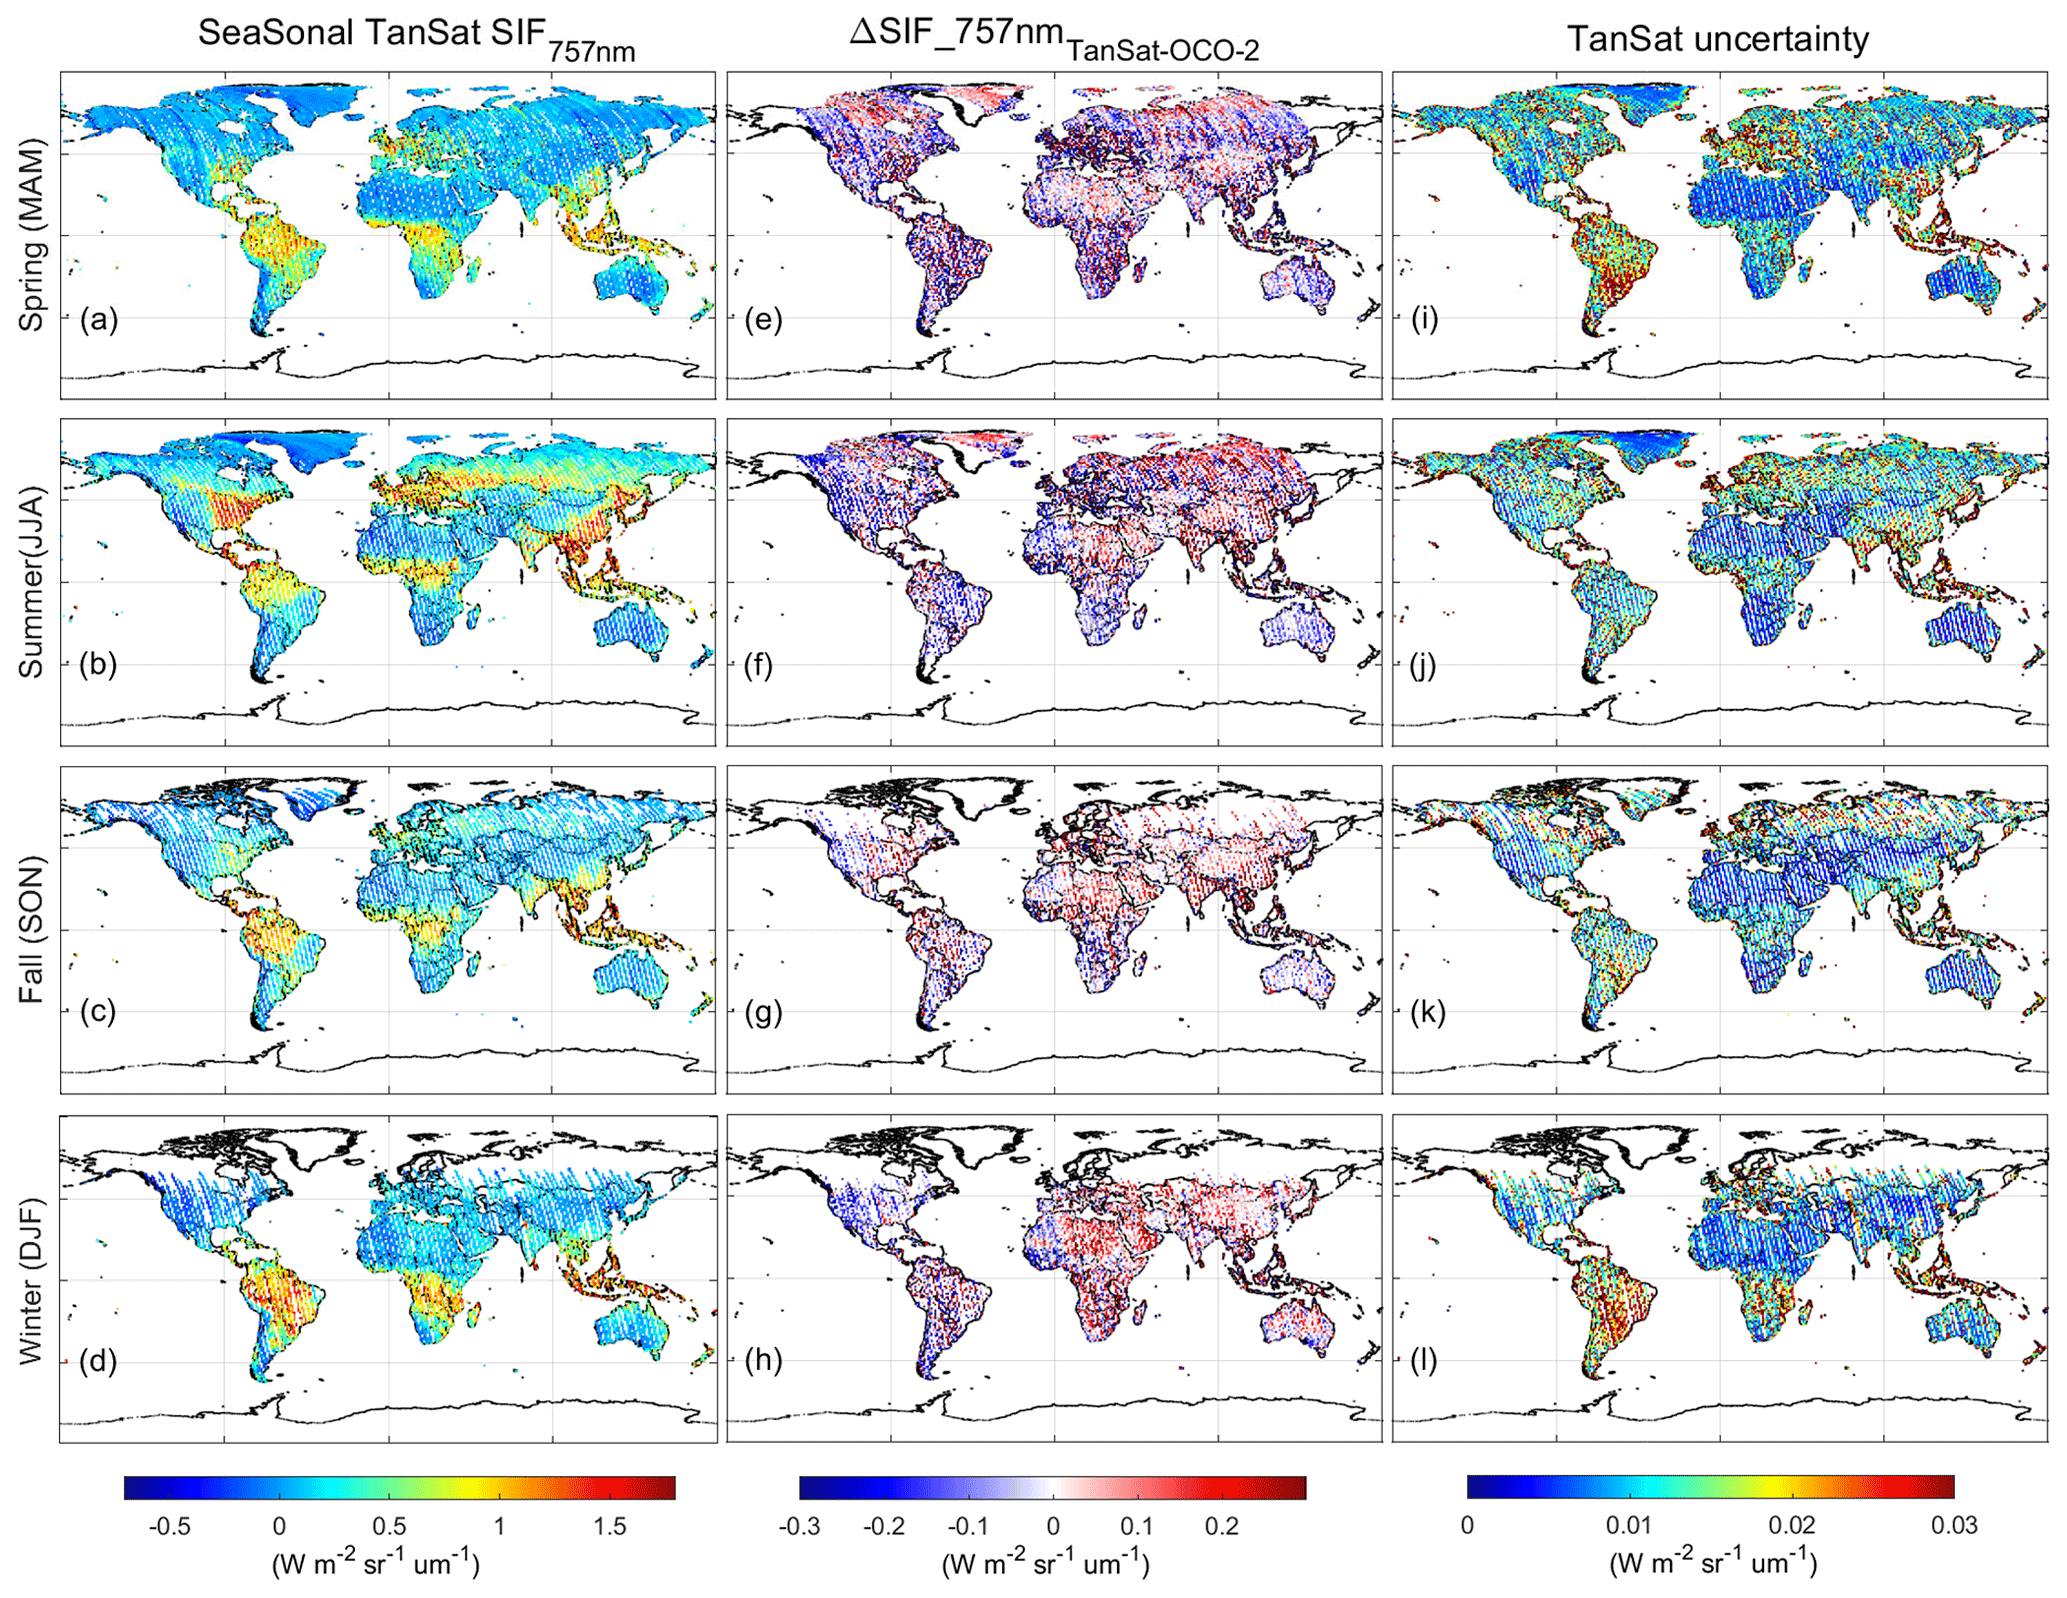
Figure 4Global TanSat SIF (left, a–d), differences between TanSat and IAPCAS OCO-2 SIF values (middle, e–h), and the grid-cell retrieval uncertainty estimated from TanSat (right, i–l) at 1∘ × 1∘ spatial resolution. The maps in each row represent a Northern Hemisphere season, i.e., spring (MAM), summer (JJA), fall (SON), and winter (DJF).
Figure 4 shows the global SIF comparison between IAPCAS/SIF retrieved from OCO-2 and TanSat; this comparison is only performed at 1∘ × 1∘ spatial resolution. In general, the difference in SIF globally is mostly less than 0.3 W m−2 µm−1 sr−1 for all seasons, and on average, the smallest difference appears in fall. There are regional biases observed in North Africa, southern Africa, South America, and Europe in all seasons except fall. This is mainly caused by the differences in instrument performance between TanSat and OCO-2, such as the instrument spectral response and the signal-to-noise ratio. The instrument performance difference is represented by the different structural characteristics of the bias curves. The bias correction compensates for most of the bias caused by instrument performance; however, small biases could remain. Furthermore, the hundreds of kilometers of distance between the OCO-2 and TanSat footprints, for example, over different vegetation regions, will also cause some measurement discrepancies. The global distribution of the two satellites was also compared with the official OCO-2 SIF data on the global scale; the results show that the difference between the retrieved SIF maps and the official map is less than 0.2 W m−2 µm−1 sr−1, indicating that the retrieved SIF data from OCO-2 and TanSat both have good SIF characterization capabilities on a global scale. The uncertainty σ of each sounding was estimated to validate SIF reliability and is provided in the product. σ is derived from the retrieval error covariance matrix, , where K is the Jacobian matrix from the forward model fitting and S0 is the measurement error covariance matrix that is calculated from the instrument spectrum noise. In general, σ ranges from 0.1 to 0.6 W m−2 µm−1 sr−1 for both TanSat and OCO-2 measurements in the 757 nm fitting window, which is of a similar magnitude and data range as those of previous studies (Du et al., 2018; Frankenberg et al., 2014). Meanwhile, the standard error of the mean SIF in each grid σmeas was estimated to represent the gridded retrieval error and natural variability, which is calculated from TanSat SIF values with and , where SD represents the standard deviation of the grid cell with n soundings, SIFi is the retrieved SIF values of each sounding, and is the mean SIF value for all measurements in the grid. As depicted in the right column of Fig. 4, the σmeas of each grid cell is much lower than the precision of a single sounding. The σmeas for South America is larger than that for any other region on the globe (Fig. 4i–l). This is similar to that of OCO-2 SIF retrieval and caused by fewer effective measurements due to the South Atlantic Anomaly (Sun et al., 2018). The difference in SIF emission values between the two satellites indicates that the synergistic use of two satellite SIF products still requires analysis of the impact of instrument differences, although the two satellite SIF products share the same spatiotemporal pattern on a global scale.
3.2 SIF global distribution and temporal variation
The SIF emission intensity reflects the growth status of vegetation, and hence the overall global vegetation status can be represented by global SIF maps for each season. TanSat SIF over a whole year's cycle, from March 2017 to February 2018, is represented seasonally as a 1∘ × 1∘ grid spatially. The seasonal variation in SIF emission is clear in the Northern Hemisphere, i.e., it increases from spring to summer and then decreases (Sun et al., 2018).
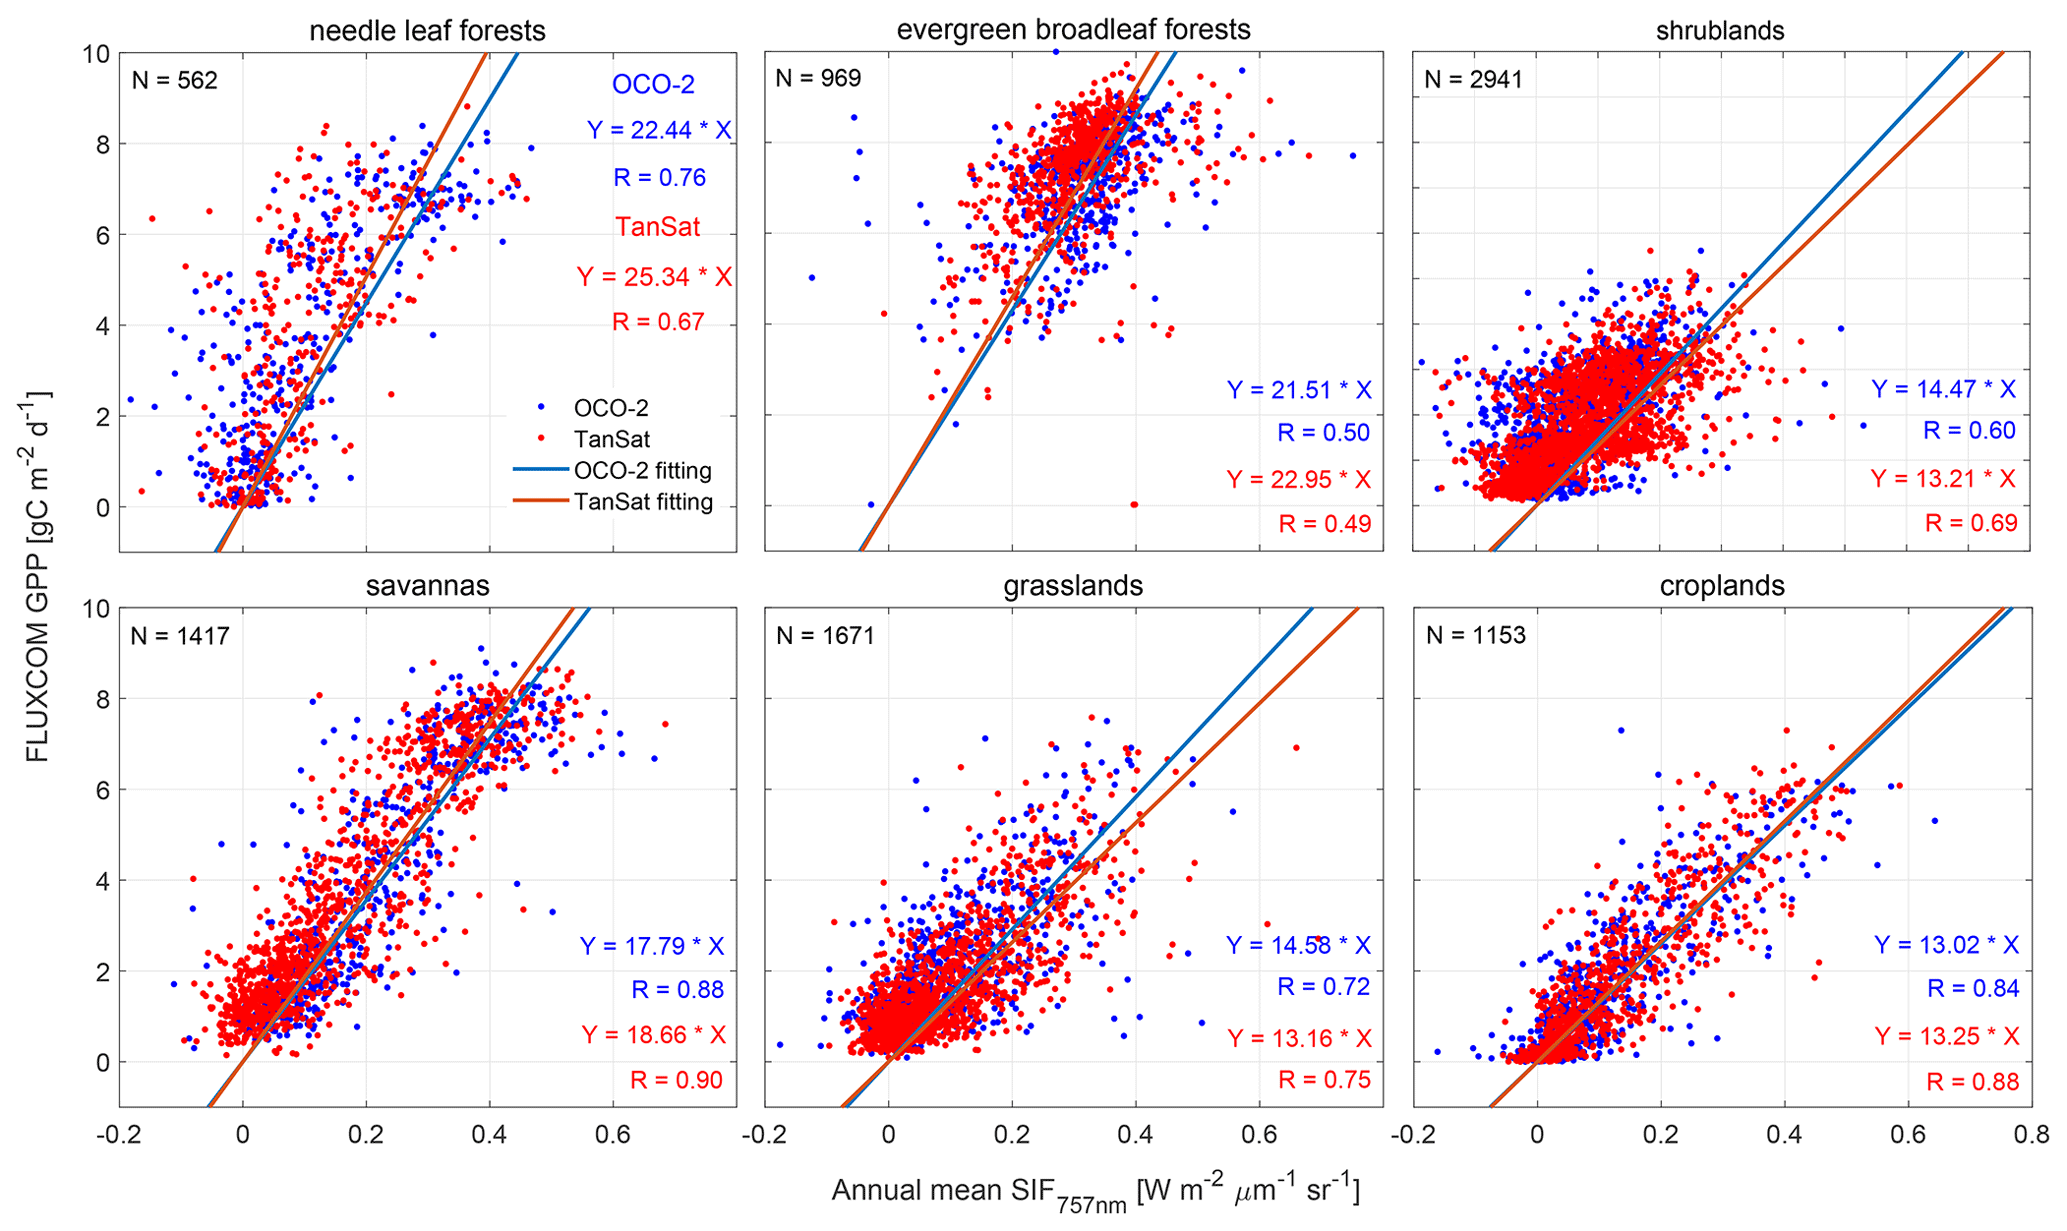
Figure 5Relationship between annual mean SIF and FLUXCOM gross primary production (GPP) from March 2017 to February 2018. Blue and red dots represent OCO-2 and TanSat SIF grids, respectively. Fitted lines and statistics for OCO-2 and TanSat are shown in each plot.
In general, the SIF emission varied with latitude and the vegetation-covered areas near the Equator maintained a continuous SIF emission throughout the year. Large SIF emissions in the Northern Hemisphere, above 1.5 W m−2 µm−1 sr−1, mostly from the eastern USA, southeast China, and southern Asia in summer, were due to the large areas of cropland. There was also an obvious SIF emission of 1–1.2 W m−2 µm−1 sr−1 observed over central Europe and northeastern China during the summer. In these regions, croplands and deciduous forests contribute to SIF emissions. In the Southern Hemisphere, the strongest SIF emission occurred in the Amazon, with a level of approximately 1–2 W m−2 µm−1 sr−1 in DJF (Northern Hemisphere winter), where there is an evergreen broadleaf rainforest. Africa, which is covered by evergreen broadleaf rainforests and woody savannas, had an average SIF value of 0.7–1.5 W m−2 µm−1 sr−1 during the year.
The SIF–GPP relationship over different vegetation types was also investigated by comparing the annual mean satellite SIF measurements with the FLUXCOM GPP (Jung et al., 2020; Tramontana et al., 2016) dataset in a 1∘ × 1∘ grid over the globe. The FLUXCOM GPP dataset used in the study comprises monthly global gridded flux products with remote sensing and meteorological/climate forcing (RS+METEO) setups, which are derived from mean seasonal cycles according to MODIS data and daily meteorological information (Jung et al., 2020; Tramontana et al., 2016). In the correlation analysis, the high spatial resolution (0.5∘ × 0.5∘ ) of the FLUXCOM GPP was first resampled to 1∘ × 1∘ to keep the same spatiotemporal scale of SIF and GPP data. The satellite-measured SIF is an instantaneous emission signal that varies with incident solar radiance within the day. To reduce the differences caused by the observation time and SZA at different latitudes, we applied a daily adjustment factor to convert the instantaneous SIF emission into a daily mean SIF (Du et al., 2018; Frankenberg et al., 2011b; Sun et al., 2018). The daily adjustment factor d is calculated as follows:
where t0 is the observation time in fractional days and SZA(t) is a function of latitude, longitude, and time for calculating the SZA of the measurements. The annually averaged SIF is calculated from the daily mean SIF. To evaluate the relationship between SIF and GPP on the periodic scale of vegetation growth status, annually averaged data were used in the regression fitting analysis.
Figure 5 shows the linear fits for six vegetation types, including needle leaf forest, evergreen broadleaf forest, shrubland, savanna, grassland, and cropland. Recent studies have shown a strong linear correlation between SIF and GPP. The TanSat SIF and the OCO-2 official SIF data were used to estimate the SIF–GPP correlation. To make a direct comparison of the relationship between SIF and GPP among various vegetation types, we used non-offset linear fitting to indicate the correlation between satellite SIF and FLUXCOM GPP. For savanna and cropland, there were strong relationships between the mean SIF and GPP with an R value above 0.84. The fitting results show that the SIF products of the two satellites have similar capabilities in characterizing GPP, especially for the evergreen broadleaf forest, savanna, and cropland, with slopes of approximately 21, 18, and 13, respectively. For shrubland and grassland, the slope of OCO-2 SIF with GPP is higher than that of TanSat and has a worse correlation. For forests, OCO-2 SIF presents a better correlation with GPP, especially in the needle leaf forest. As a whole, for the same vegetation type, the SIF–GPP correlations for the two satellites are rather similar, indicating that the two satellite SIF products have similar capabilities in characterizing GPP. This shows the strong feasibility of the comprehensive application of different satellite SIF products. For different vegetation types, the SIF–GPP correlations were significantly different, indicating the different ability of SIF to characterize GPP of different vegetation. This represents that vegetation type is a key factor in determining the SIF–GPP relationship. The markedly different fitting slopes across various biomes suggest that the application of SIF in GPP estimation needs more detailed analysis despite the evidence of the strong linear relationship between them.
In this paper, we introduced the retrieval algorithm IAPCAS/SIF and its application in TanSat and OCO-2 measurements. One-year (March 2017–February 2018) of TanSat SIF data was introduced and compared with OCO-2 measurements in this study. The TanSat and OCO-2 SIF products based on the IAPCAS/SIF algorithm are available on the Cooperation on the Analysis of carbon SAtellites data (CASA) website: http://www.chinageoss.cn/tansat/index.html (last access: 2 April 2022). Comparing TanSat and OCO-2 measurements directly, using a case study, and indirectly, with global 1∘ × 1∘ grid data, showed consistency between the two satellite missions, indicating that the coordinated usage of the two data products is possible in future studies. The correlation analysis between SIF and GPP further verified the feasibility of the synergistic application of SIF products from different satellite missions. Meanwhile, it should be noticed that the difference in the ability of satellite SIF products to characterize different vegetation types in data applications. With more satellites becoming available for SIF observations, space-based SIF observations have recently expanded in range to provide broad spatiotemporal coverage. The next-generation Chinese carbon monitoring satellite (TanSat-2) is now in the preliminary design phase, which is designed to be a constellation of six satellites to measure different kinds of greenhouse gases and trace gases in a more efficient way, including CO2, CH4, CO, NOx, and SIF. SIF measurements from TanSat-2 will provide global data products over broader coverage areas with less noise. The improvement in the spatiotemporal resolution of SIF data will benefit GPP predictions based on the numerous studies of the linear relationship between SIF and GPP. In future work, the measurement accuracy should be validated directly using ground-based measurements to ensure data quality.
The SIF products of TanSat and OCO-2 by the IAPCAS/SIF algorithm are available on the Cooperation on the Analysis of carbon SAtellites data (CASA) website (http://www.chinageoss.cn/tansat/index.html; Yao et al., 2022) or from the authors upon request.
LY and DY developed the retrieval algorithm, designed the study, and wrote the paper. YL led the SIF data process and analysis. YL, DY, ZC, and JW contributed to manuscript organization and revision. CL and YZ provided information on the TanSat instrument performance. LT provided TanSat in-flight information. MW and SW provided information on the scientific requirement for data further application. NL and DL led the TanSat data application. ZY led the TanSat in-flight operation.
The contact author has declared that neither they nor their co-authors have any competing interests.
Publisher's note: Copernicus Publications remains neutral with regard to jurisdictional claims in published maps and institutional affiliations.
The TanSat L1B data service was provided by the International Reanalysis Cooperation on Carbon Satellites Data (IRCSD) and the Cooperation on the Analysis of carbon SAtellites data (CASA). The authors thank the OCO-2 Team for providing Level-1B data and Level-2 SIF data products. The authors thank the FLUXCOM team for providing global GPP data. The authors thank Google for allowing free use of Google Earth and for the reproduction of maps for publication. The authors also thank the Landsat/Copernicus team for providing land surface images for Google Earth.
This research has been supported by the National Key R&D Program of China (grant no. 2021YFB3901000), the Key Research Program of the Chinese Academy of Sciences (grant no. ZDRW-ZS-2019-1), and the Youth Program of the National Natural Science Foundation of China (grant nos. 41905029 and 42105113).
This paper was edited by Andre Butz and reviewed by two anonymous referees.
Bösch, H., Toon, G. C., Sen, B., Washenfelder, R. A., Wennberg, P. O., Buchwitz, M., de Beek, R., Burrows, J. P., Crisp, D., Christi, M., Connor, B. J., Natraj, V., and Yung, Y. L.: Space-based near-infrared CO2 measurements: Testing the Orbiting Carbon Observatory retrieval algorithm and validation concept using SCIAMACHY observations over Park Falls, Wisconsin, J. Geophys. Res.-Atmos., 111, 1–17, https://doi.org/10.1029/2006JD007080, 2006.
Cai, Z. N., Liu, Y., and Yang, D. X.: Analysis of XCO2 retrieval sensitivity using simulated Chinese Carbon Satellite (TanSat) measurements, Sci. China Earth Sci., 57, 1919–1928, https://doi.org/10.1007/s11430-013-4707-1, 2014.
Chen, A., Mao, J., Ricciuto, D., Xiao, J., Frankenberg, C., Li, X., Thornton, P. E., Gu, L., and Knapp, A. K.: Moisture availability mediates the relationship between terrestrial gross primary production and solar-induced chlorophyll fluorescence: Insights from global-scale variations, Glob. Chang. Biol., 27, 1144–1156, https://doi.org/10.1111/gcb.15373, 2021.
Dee, D. P., Uppala, S. M., Simmons, A. J., Berrisford, P., Poli, P., Kobayashi, S.: The ERA-interim reanalysis: Configuration and performance of the data assimilation system. Q. J. R. Meteorol. Soc., 137, 553–597, https://doi.org/10.1002/qj.828, 2011.
Doughty, R., Köhler, P., Frankenberg, C., Magney, T. S., Xiao, X., Qin, Y., Wu, X., and Moore, B.: TROPOMI reveals dry-season increase of solar-induced chlorophyll fluorescence in the Amazon forest, P. Natl. Acad. Sci. USA, 116, 22393–22398, https://doi.org/10.1073/pnas.1908157116, 2019.
Drusch, M., Moreno, J., del Bello, U., Franco, R., Goulas, Y., Huth, A., Kraft, S., Middleton, E. M., Miglietta, F., and Mohammed, G.: The FLuorescence EXplorer Mission Concept – ESA's Earth Explorer 8, IEEE T. Geosci. Remote, 55, 1273–1284, https://doi.org/10.1109/TGRS.2016.2621820, 2017.
Du, S., Liu, L., Liu, X., Zhang, X., Zhang, X., Bi, Y., and Zhang, L.: Retrieval of global terrestrial solar-induced chlorophyll fluorescence from TanSat satellite, Sci. Bull., 63, 1502–1512, https://doi.org/10.1016/j.scib.2018.10.003, 2018.
Frankenberg, C.: OCO-2 Algorithm Theoretical Basis Document: IMAP-DOAS pre-processor, 2014.
Frankenberg, C., Butz, A., and Toon, G. C.: Disentangling chlorophyll fluorescence from atmospheric scattering effects in O2 A-band spectra of reflected sunlight, Geophys. Res. Lett., 38, 1–5, https://doi.org/10.1029/2010GL045896, 2011a.
Frankenberg, C., Fisher, J. B., Worden, J., Badgley, G., Saatchi, S. S., Lee, J. E., Toon, G. C., Butz, A., Jung, M., Kuze, A., and Yokota, T.: New global observations of the terrestrial carbon cycle from GOSAT: Patterns of plant fluorescence with gross primary productivity, Geophys. Res. Lett., 38, 1–6, https://doi.org/10.1029/2011GL048738, 2011b.
Frankenberg, C., O'Dell, C., Guanter, L., and McDuffie, J.: Remote sensing of near-infrared chlorophyll fluorescence from space in scattering atmospheres: implications for its retrieval and interferences with atmospheric CO2 retrievals, Atmos. Meas. Tech., 5, 2081–2094, https://doi.org/10.5194/amt-5-2081-2012, 2012.
Frankenberg, C., O'Dell, C., Berry, J., Guanter, L., Joiner, J., Köhler, P., Pollock, R., and Taylor, T. E.: Prospects for chlorophyll fluorescence remote sensing from the Orbiting Carbon Observatory-2, Remote Sens. Environ., 147, 1–12, https://doi.org/10.1016/j.rse.2014.02.007, 2014.
Guanter, L., Alonso, L., Gómez-Chova, L., Amorós-López, J., Vila, J., and Moreno, J.: Estimation of solar-induced vegetation fluorescence from space measurements, Geophys. Res. Lett., 34, 1–5, https://doi.org/10.1029/2007GL029289, 2007.
Guanter, L., Frankenberg, C., Dudhia, A., Lewis, P. E., Gómez-Dans, J., Kuze, A., Suto, H., and Grainger, R. G.: Retrieval and global assessment of terrestrial chlorophyll fluorescence from GOSAT space measurements, Remote Sens. Environ., 121, 236–251, https://doi.org/10.1016/j.rse.2012.02.006, 2012.
Guanter, L., Zhang, Y., Jung, M., Joiner, J., Voigt, M., Berry, J. A., Frankenberg, C., Huete, A. R., Zarco-Tejada, P., Lee, J. E., Moran, M. S., Ponce-Campos, G., Beer, C., Camps-Valls, G., Buchmann, N., Gianelle, D., Klumpp, K., Cescatti, A., Baker, J. M., and Griffis, T. J.: Global and time-resolved monitoring of crop photosynthesis with chlorophyll fluorescence, P. Natl. Acad. Sci. USA, 111, E1327–E1333, https://doi.org/10.1073/pnas.1320008111, 2014.
Guanter, L., Aben, I., Tol, P., Krijger, J. M., Hollstein, A., Köhler, P., Damm, A., Joiner, J., Frankenberg, C., and Landgraf, J.: Potential of the TROPOspheric Monitoring Instrument (TROPOMI) onboard the Sentinel-5 Precursor for the monitoring of terrestrial chlorophyll fluorescence, Atmos. Meas. Tech., 8, 1337–1352, https://doi.org/10.5194/amt-8-1337-2015, 2015.
Joiner, J., Yoshida, Y., Vasilkov, A. P., Yoshida, Y., Corp, L. A., and Middleton, E. M.: First observations of global and seasonal terrestrial chlorophyll fluorescence from space, Biogeosciences, 8, 637–651, https://doi.org/10.5194/bg-8-637-2011, 2011.
Joiner, J., Yoshida, Y., Vasilkov, A. P., Middleton, E. M., Campbell, P. K. E., Yoshida, Y., Kuze, A., and Corp, L. A.: Filling-in of near-infrared solar lines by terrestrial fluorescence and other geophysical effects: simulations and space-based observations from SCIAMACHY and GOSAT, Atmos. Meas. Tech., 5, 809–829, https://doi.org/10.5194/amt-5-809-2012, 2012.
Joiner, J., Guanter, L., Lindstrot, R., Voigt, M., Vasilkov, A. P., Middleton, E. M., Huemmrich, K. F., Yoshida, Y., and Frankenberg, C.: Global monitoring of terrestrial chlorophyll fluorescence from moderate-spectral-resolution near-infrared satellite measurements: methodology, simulations, and application to GOME-2, Atmos. Meas. Tech., 6, 2803–2823, https://doi.org/10.5194/amt-6-2803-2013, 2013.
Joiner, J., Yoshida, Y., Guanter, L., and Middleton, E. M.: New methods for the retrieval of chlorophyll red fluorescence from hyperspectral satellite instruments: simulations and application to GOME-2 and SCIAMACHY, Atmos. Meas. Tech., 9, 3939–3967, https://doi.org/10.5194/amt-9-3939-2016, 2016.
Joiner, J., Yoshida, Y., Zhang, Y., Duveiller, G., Jung, M., Lyapustin, A., Wang, Y., and Tucker, C. J.: Estimation of terrestrial global gross primary production (GPP) with satellite data-driven models and eddy covariance flux data, Remote Sens., 10, 1–38, https://doi.org/10.3390/rs10091346, 2018.
Jung, M., Schwalm, C., Migliavacca, M., Walther, S., Camps-Valls, G., Koirala, S., Anthoni, P., Besnard, S., Bodesheim, P., Carvalhais, N., Chevallier, F., Gans, F., Goll, D. S., Haverd, V., Köhler, P., Ichii, K., Jain, A. K., Liu, J., Lombardozzi, D., Nabel, J. E. M. S., Nelson, J. A., O'Sullivan, M., Pallandt, M., Papale, D., Peters, W., Pongratz, J., Rödenbeck, C., Sitch, S., Tramontana, G., Walker, A., Weber, U., and Reichstein, M.: Scaling carbon fluxes from eddy covariance sites to globe: synthesis and evaluation of the FLUXCOM approach, Biogeosciences, 17, 1343–1365, https://doi.org/10.5194/bg-17-1343-2020, 2020.
Köhler, P., Guanter, L., and Joiner, J.: A linear method for the retrieval of sun-induced chlorophyll fluorescence from GOME-2 and SCIAMACHY data, Atmos. Meas. Tech., 8, 2589–2608, https://doi.org/10.5194/amt-8-2589-2015, 2015.
Köhler, P., Guanter, L., Kobayashi, H., Walther, S., and Yang, W.: Assessing the potential of sun-induced fluorescence and the canopy scattering coefficient to track large-scale vegetation dynamics in Amazon forests, Remote Sens. Environ., 204, 769–785, https://doi.org/10.1016/j.rse.2017.09.025, 2018a.
Köhler, P., Frankenberg, C., Magney, T. S., Guanter, L., Joiner, J., and Landgraf, J.: Global Retrievals of Solar-Induced Chlorophyll Fluorescence With TROPOMI: First Results and Intersensor Comparison to OCO-2, Geophys. Res. Lett., 45, 10456–10463, https://doi.org/10.1029/2018GL079031, 2018b.
Lee, J. E., Frankenberg, C., Van Der Tol, C., Berry, J. A., Guanter, L., Boyce, C. K., Fisher, J. B., Morrow, E., Worden, J. R., Asefi, S., Badgley, G., and Saatchi, S.: Forest productivity and water stress in Amazonia: Observations from GOSAT chlorophyll fluorescence, Tohoku J. Exp. Med., 280, 20130171, https://doi.org/10.1098/rspb.2013.0171, 2013.
Li, X., Xiao, J., and He, B.: Chlorophyll fluorescence observed by OCO-2 is strongly related to gross primary productivity estimated from flux towers in temperate forests, Remote Sens. Environ., 204, 659–671, https://doi.org/10.1016/j.rse.2017.09.034, 2018.
Li, X., Xiao, J., Kimball, J. S., Reichle, R. H., Scott, R. L., Litvak, M. E., Bohrer, G., and Frankenberg, C.: Synergistic use of SMAP and OCO-2 data in assessing the responses of ecosystem productivity to the 2018 U.S. drought, Remote Sens. Environ., 251, 112062, https://doi.org/10.1016/j.rse.2020.112062, 2020.
Liu, X., Guanter, L., Liu, L., Damm, A., Malenovský, Z., Rascher, U., Peng, D., Du, S., and Gastellu-Etchegorry, J. P.: Downscaling of solar-induced chlorophyll fluorescence from canopy level to photosystem level using a random forest model, Remote Sens. Environ., 231, 110772, https://doi.org/10.1016/j.rse.2018.05.035, 2019.
Liu, Y., Wang, J., Yao, L., Chen, X., Cai, Z., Yang, D., Yin, Z., Gu, S., Tian, L., Lu, N., and Lyu, D.: The TanSat mission: preliminary global observations, Sci. Bull., 63, 1200–1207, https://doi.org/10.1016/j.scib.2018.08.004, 2018.
MacBean, N., Maignan, F., Bacour, C., Lewis, P., Peylin, P., Guanter, L., Köhler, P., Gómez-Dans, J., and Disney, M.: Strong constraint on modelled global carbon uptake using solar-induced chlorophyll fluorescence data, Sci. Rep., 8, 1–12, https://doi.org/10.1038/s41598-018-20024-w, 2018.
NASA JPL: NASA Shuttle Radar Topography Mission Global 30 arc second, NASA EOSDIS Land Processes DAAC [data set], https://doi.org/10.5067/MEaSUREs/SRTM/SRTMGL30.002, 2013.
O'Dell, C. W., Connor, B., Bösch, H., O'Brien, D., Frankenberg, C., Castano, R., Christi, M., Eldering, D., Fisher, B., Gunson, M., McDuffie, J., Miller, C. E., Natraj, V., Oyafuso, F., Polonsky, I., Smyth, M., Taylor, T., Toon, G. C., Wennberg, P. O., and Wunch, D.: The ACOS CO2 retrieval algorithm – Part 1: Description and validation against synthetic observations, Atmos. Meas. Tech., 5, 99–121, https://doi.org/10.5194/amt-5-99-2012, 2012.
Qiu, R., Han, G., Ma, X., Xu, H., Shi, T., and Zhang, M.: A comparison of OCO-2 SIF, MODIS GPP, and GOSIF data from gross primary production (GPP) estimation and seasonal cycles in North America, Remote Sens., 12, 258, https://doi.org/10.3390/rs12020258, 2020.
Reuter, M., Buchwitz, M., Schneising, O., Heymann, J., Bovensmann, H., and Burrows, J. P.: A method for improved SCIAMACHY CO2 retrieval in the presence of optically thin clouds, Atmos. Meas. Tech., 3, 209–232, https://doi.org/10.5194/amt-3-209-2010, 2010.
Sun, K., Liu, X., Nowlan, C. R., Cai, Z., Chance, K., Frankenberg, C., Lee, R. A. M., Pollock, R., Rosenberg, R., and Crisp, D.: Characterization of the OCO-2 instrument line shape functions using on-orbit solar measurements, Atmos. Meas. Tech., 10, 939–953, https://doi.org/10.5194/amt-10-939-2017, 2017.
Sun, Y., Fu, R., Dickinson, R., Joiner, J., Frankenberg, C., Gu, L., Xia, Y., and Fernando, N.: Drought onset mechanisms revealed by satellite solar-induced chlorophyll fluorescence: Insights from two contrasting extreme events, J. Geophys. Res.-Biogeo., 120, 2427–2440, https://doi.org/10.1002/2015JG003150, 2015.
Sun, Y., Frankenberg, C., Wood, J. D., Schimel, D. S., Jung, M., Guanter, L., Drewry, D. T., Verma, M., Porcar-Castell, A., Griffis, T. J., Gu, L., Magney, T. S., Köhler, P., Evans, B., and Yuen, K.: OCO-2 advances photosynthesis observation from space via solar-induced chlorophyll fluorescence, Science, 358, 6360, https://doi.org/10.1126/science.aam5747, 2017.
Sun, Y., Frankenberg, C., Jung, M., Joiner, J., Guanter, L., Köhler, P., and Magney, T.: Overview of Solar-Induced chlorophyll Fluorescence (SIF) from the Orbiting Carbon Observatory-2: Retrieval, cross-mission comparison, and global monitoring for GPP, Remote Sens. Environ., 209, 808–823, https://doi.org/10.1016/j.rse.2018.02.016, 2018.
Tramontana, G., Jung, M., Schwalm, C. R., Ichii, K., Camps-Valls, G., Ráduly, B., Reichstein, M., Arain, M. A., Cescatti, A., Kiely, G., Merbold, L., Serrano-Ortiz, P., Sickert, S., Wolf, S., and Papale, D.: Predicting carbon dioxide and energy fluxes across global FLUXNET sites with regression algorithms, Biogeosciences, 13, 4291–4313, https://doi.org/10.5194/bg-13-4291-2016, 2016.
van der Tol, C., Rossini, M., Cogliati, S., Verhoef, W., Colombo, R., Rascher, U., and Mohammed, G.: A model and measurement comparison of diurnal cycles of sun-induced chlorophyll fluorescence of crops, Remote Sens. Environ., 186, 663–677, https://doi.org/10.1016/j.rse.2016.09.021, 2016.
Yang, D., Liu, Y., Cai, Z., Deng, J., Wang, J., and Chen, X.: An advanced carbon dioxide retrieval algorithm for satellite measurements and its application to GOSAT observations, Sci. Bull., 60, 2063–2066, https://doi.org/10.1007/s11434-015-0953-2, 2015.
Yang, D., Liu, Y., Cai, Z., Chen, X., Yao, L., and Lu, D.: First Global Carbon Dioxide Maps Produced from TanSat Measurements, Adv. Atmos. Sci., 35, 621–623, https://doi.org/10.1007/s00376-018-7312-6, 2018.
Yang, D., Boesch, H., Liu, Y., Somkuti, P., Cai, Z., Chen, X., Di Noia, A., Lin, C., Lu, N., Lyu, D., Parker, R. J., Tian, L., Wang, M., Webb, A., Yao, L., Yin, Z., Zheng, Y., Deutscher, N. M., Griffith, D. W. T., Hase, F., Kivi, R., Morino, I., Notholt, J., Ohyama, H., Pollard, D. F., Shiomi, K., Sussmann, R., Té, Y., Velazco, V. A., Warneke, T., and Wunch, D.: Toward High Precision XCO2 Retrievals From TanSat Observations: Retrieval Improvement and Validation Against TCCON Measurements, J. Geophys. Res.-Atmos., 125, 1–26, https://doi.org/10.1029/2020JD032794, 2020.
Yang, D., Liu, Y., Boesch, H., Yao, L., Di Noia, A., Cai, Z., Lu, N., Lyu, D., Wang, M., Wang, J., Yin, Z., and Zheng, Y.: A New TanSat XCO2 Global Product towards Climate Studies, Adv. Atmos. Sci., 38, 8–11, https://doi.org/10.1007/s00376-020-0297-y, 2021.
Yang, X., Tang, J., Mustard, J. F., Lee, J. E., Rossini, M., Joiner, J., Munger, J. W., Kornfeld, A., and Richardson, A. D.: Solar-induced chlorophyll fluorescence that correlates with canopy photosynthesis on diurnal and seasonal scales in a temperate deciduous forest, Geophys. Res. Lett., 42, 2977–2987, https://doi.org/10.1002/2015GL063201, 2015.
Yao, L., Yang, D., Liu, Y., Wang, J., Liu, L., Du, S., Cai, Z., Lu, N., Lyu, D., Wang, M., Yin, Z., and Zheng, Y.: A New Global Solar-induced Chlorophyll Fluorescence (SIF) Data Product from TanSat Measurements, Adv. Atmos. Sci., 38, 341–345, https://doi.org/10.1007/s00376-020-0204-6, 2021.
Yao, L., Liu, Y., and Yang, D.: TanSat and OCO-2 SIF dataset by IAPCAS/SIF algorithm from March 2017 to February 2018, China GEOSS Data Sharing Network, http://www.chinageoss.cn/tansat/index.html, last access: 2 April 2022.
Yin, Y., Byrne, B., Liu, J., Wennberg, P. O., Davis, K. J., Magney, T., Köhler, P., He, L., Jeyaram, R., Humphrey, V., Gerken, T., Feng, S., Digangi, J. P., and Frankenberg, C.: Cropland Carbon Uptake Delayed and Reduced by 2019 Midwest Floods, AGU Adv., 1, 1–15, https://doi.org/10.1029/2019av000140, 2020.
Yoshida, Y., Ota, Y., Eguchi, N., Kikuchi, N., Nobuta, K., Tran, H., Morino, I., and Yokota, T.: Retrieval algorithm for CO2 and CH4 column abundances from short-wavelength infrared spectral observations by the Greenhouse gases observing satellite, Atmos. Meas. Tech., 4, 717–734, https://doi.org/10.5194/amt-4-717-2011, 2011.
Yoshida, Y., Kikuchi, N., Morino, I., Uchino, O., Oshchepkov, S., Bril, A., Saeki, T., Schutgens, N., Toon, G. C., Wunch, D., Roehl, C. M., Wennberg, P. O., Griffith, D. W. T., Deutscher, N. M., Warneke, T., Notholt, J., Robinson, J., Sherlock, V., Connor, B., Rettinger, M., Sussmann, R., Ahonen, P., Heikkinen, P., Kyrö, E., Mendonca, J., Strong, K., Hase, F., Dohe, S., and Yokota, T.: Improvement of the retrieval algorithm for GOSAT SWIR XCO2 and XCH4 and their validation using TCCON data, Atmos. Meas. Tech., 6, 1533–1547, https://doi.org/10.5194/amt-6-1533-2013, 2013.
Yoshida, Y., Joiner, J., Tucker, C., Berry, J., Lee, J. E., Walker, G., Reichle, R., Koster, R., Lyapustin, A., and Wang, Y.: The 2010 Russian drought impact on satellite measurements of solar-induced chlorophyll fluorescence: Insights from modeling and comparisons with parameters derived from satellite reflectances, Remote Sens. Environ., 166, 163–177, https://doi.org/10.1016/j.rse.2015.06.008, 2015.
Yu, L., Wen, J., Chang, C. Y., Frankenberg, C., and Sun, Y.: High-Resolution Global Contiguous SIF of OCO-2, Geophys. Res. Lett., 46, 1449–1458, https://doi.org/10.1029/2018GL081109, 2019.
Zhang, Y., Guanter, L., Berry, J. A., Joiner, J., van der Tol, C., Huete, A., Gitelson, A., Voigt, M., and Köhler, P.: Estimation of vegetation photosynthetic capacity from space-based measurements of chlorophyll fluorescence for terrestrial biosphere models, Glob. Chang. Biol., 20, 3727–3742, https://doi.org/10.1111/gcb.12664, 2014.
Zhang, Y., Xiao, X., Zhang, Y., Wolf, S., Zhou, S., Joiner, J., Guanter, L., Verma, M., Sun, Y., Yang, X., Paul-Limoges, E., Gough, C. M., Wohlfahrt, G., Gioli, B., van der Tol, C., Yann, N., Lund, M., and de Grandcourt, A.: On the relationship between sub-daily instantaneous and daily total gross primary production: Implications for interpreting satellite-based SIF retrievals, Remote Sens. Environ., 205, 276–289, https://doi.org/10.1016/j.rse.2017.12.009, 2018.