the Creative Commons Attribution 4.0 License.
the Creative Commons Attribution 4.0 License.
 | 15 Apr 2021
Chemical composition of PM2.5 in October 2017 Northern California wildfire plumes
Coty N. Jen
Robert J. Weber
Pawel K. Misztal
Allen H. Goldstein
Wildfires have become more common and intense in the western US over recent decades due to a combination of historical land management practices and warming climate. Emissions from large-scale fires now frequently affect populated regions such as the San Francisco Bay Area during the fall wildfire season, with documented impacts of the resulting particulate matter on human health. Health impacts of exposure to wildfire emissions depend on the chemical composition of particulate matter, but the molecular composition of the real biomass burning organic aerosol (BBOA) that reaches large population centers remains insufficiently characterized. We took PM2.5 (particles having aerodynamic diameters less than or equal to 2.5 µm) samples at the University of California, Berkeley campus (∼ 60 km downwind of the fires) during the October 2017 Northern California wildfires period and analyzed molecular composition of OA using a two-dimensional gas chromatography coupled with high-resolution time-of-flight mass spectrometry (GC×GC HR-ToF-MS). Sugar-like compounds were the most abundant component of BBOA, followed by mono-carboxylic acids, aromatic compounds, other oxygenated compounds, and terpenoids. The vast majority of compounds detected in smoke have unknown health impacts.
Regression models were trained to predict the saturation vapor pressure and averaged carbon oxidation state () of detected compounds. The compounds speciated have a wide volatility distribution and most of them are highly oxygenated. In addition, time series of primary BBOA tracers observed in Berkeley were found to be indicative of the types of plants in the ecosystems burned in Napa and Sonoma, and could be used to differentiate the regions from which the smoke must have originated. Commonly used secondary BBOA markers like 4-nitrocatechol were enhanced when plumes aged, but their very fast formation caused them to have similar temporal variation as primary BBOA tracers. Using hierarchical clustering analysis, we classified compounds into seven factors indicative of their sources and transformation processes, identifying a unique daytime secondary BBOA factor. Chemicals associated with this factor include multifunctional acids and oxygenated aromatic compounds. These compounds have high , and they are also semi-volatile. We observed no net particle-phase organic carbon formation, which indicates an approximate balance between the mass of evaporated organic carbonaceous compounds and the addition of secondary organic carbonaceous compounds.
- Article
(5925 KB) -
Supplement
(3677 KB) - BibTeX
- EndNote


Biomass burning (BB) is the largest source of carbonaceous aerosols and the second largest source of non-methane organic gases in Earth's atmosphere (Akagi et al., 2011; Bond et al., 2004). Driven by forest management practices (such as fire suppression) and climate change, the size and frequency of wildfires in the western United States have been steadily increasing over the past 20 years (Abatzoglou and Williams, 2016; Dennison et al., 2014; Westerling et al., 2006), which results in worsening air quality in this region (McClure and Jaffe, 2018).
Organic aerosol (OA) particles are the main component of particulate matter (PM) emitted in biomass burning (Fine et al., 2004; Nolte et al., 2001). Many gas phase volatile organic compounds (VOCs), intermediate-volatile and semi-volatile organic compounds (IVOCs, SVOCs) are also emitted in biomass fires (Grieshop et al., 2009a, b; May et al., 2013). The oxidation and condensation of gas phase organics, in addition to the evaporation of particulate organics, all affect the mass and composition of biomass burning organic aerosol (BBOA) (Hodshire et al., 2019a). Numerous studies have connected human health outcomes with exposure to wildfire smoke (Reid et al., 2016; Sigsgaard et al., 2015). BBOA was shown to be the most toxic component of water-soluble PM2.5 (particles having aerodynamic diameters less than or equal to 2.5 µm) in the southeastern United States, in terms of the ability to generate reactive oxygen species (which can cause cell damage) per unit mass (Verma et al., 2015). The chemical composition of BBOA, which is related to the fuel, combustion condition, and atmospheric aging, affects the potential toxicity of BBOA. On a per-mass-of-PM2.5 basis, aerosols generated in flaming combustion have stronger mutagenicity and lung toxicity potencies than smoldering BBOA (Kim et al., 2018). A recent study shows atmospheric aging for 2 d can increase the oxidative potential (the ability of particles to generate reactive oxygen species) of BBOA by a factor of 2.1 ± 0.9 (Wong et al., 2019).
The chemical composition of particle-phase BBOA emissions has been comprehensively characterized in laboratory burning experiments, e.g., Hays et al. (2002), Jen et al. (2019), and Simoneit et al. (1993). These studies provide extensive inventories of BBOA emissions and discovered many chemical tracer compounds for different vegetation types. However, there is evidence showing the emissions of BBOA in wildfires are different from those in the laboratory settings. BBOA emissions from natural fires depend on the moisture of the fuels and many environmental factors such as wind and temperature, which is hard to simulate in laboratory fires (Andreae, 2019). The aging processes of BBOA have also been studied in many laboratory oxidation experiments, such as Bertrand et al. (2018), Fortenberry et al. (2018), and Sengupta et al. (2020). These studies provided substantial information on oxidation mechanisms and identified many potential marker compounds for biomass burning secondary organic aerosol (BB SOA). However, the oxidation environments in chambers or flow reactors are also different from those in the wildfires. Variabilities in dilution and levels of background aerosols, in addition to the variabilities in emission and chemistry, all affect OA evaporation and BB SOA formation (Hodshire et al., 2019b). In laboratory studies, aging was often shown to increase the mass of BBOA. However, the increase of BBOA mass within aging plumes was only observed in a few field studies (Hodshire et al., 2019a). Speciated measurements enable us to examine whether primary BBOA marker compounds emitted in fires that differ in fuel type, intensity, or other factors are suitable for use in source apportionment, and to identify useful marker compounds (and formation pathways) for BB SOA. Speciation of aged wildfire BBOA also informs us about which compounds people were exposed to during the fires.
Traditional speciated measurements of BBOA typically rely on gas-chromatography mass spectrometric (GC-MS) analyses of filter samples. Due to the limited capability of conventional GC-MS in separating compounds, a high fraction of BBOA is typically treated as unresolved complex mixture (UCM) (Fine et al., 2004; Hays et al., 2004). For ambient BBOA measurements, low sampling frequency (e.g., one or two samples per day) typically makes it challenging to distinguish BBOA from other pollution sources and to capture short-timescale variability indicative of changing emissions, transport, and atmospheric processing. Advances in analytical instruments, such as the two-dimensional GC coupled with high-resolution mass spectrometry (GC×GC HR-ToF-MS), significantly expand the ability to separate, identify, and quantify organic compounds in aerosols (Alam and Harrison, 2016; Laskin et al., 2018; Liu and Phillips, 1991; Worton et al., 2017). Using this approach, an unprecedented number of compounds in OA can be now speciated and quantified, and traced back to sources (Zhang et al., 2018). Here, we apply GC×GC HR-MS to the analysis of 3–4 h time-resolution samples of extreme levels of ambient particulate matter generated by distant wildfires affecting a populated region.
In October 2017, a series of wildfires took place in Napa and Sonoma counties in Northern California. The emissions caused extreme air pollution conditions with poor visibility throughout the highly populated San Francisco Bay Area for more than 10 d. According to the US EPA's measurement data (EPA AirNow), the hourly average concentrations of PM2.5 exceeded 100 µg m−3 several times at multiple measurement sites within the Bay Area. A recent epidemiological study showed that exposure to wildfire smoke in California during 2015–2017, including the 2017 fires measured here, significantly increased the risk of out-of-hospital cardiac arrest (odds ratio of 1.70, 95 % confidence interval 1.18–2.13) (Jones et al., 2020). These dense smoke periods provide a unique chance to study the speciated chemical composition and transformations of BBOA occurring during the same time that adverse health effects from smoke have been documented. When these fires first began, we set up a comprehensive set of online measurements at the University of California, Berkeley (UCB) campus, and collected particulate filter samples for offline analysis. This article focuses on the organic aerosols collected on the filters. The main objectives for this study include (1) measuring the chemical composition of BBOA after several hours of atmospheric aging and estimating the volatility and the average carbon oxidation state distribution of BBOA; (2) testing whether marker compounds can be used to distinguish the fuels burned in the fires; (3) testing whether traditional BB SOA tracers are indicative of aging processes; (4) using a statistical approach to cluster all the compounds by their temporal behavior to examine their sources and transformation processes; and (5) identifying BB SOA marker compounds and exploring the temporal trend of BB SOA based on the clustering analysis.
2.1 Fires, measurement site, characterization of backward trajectory calculations
The 2017 Northern California wildfires started in Napa and Sonoma counties on 8 October under the influence of the hot, dry, and strong Diablo winds (coming from the east of the San Francisco Bay Area over the Diablo Range), and continued for more than 2 weeks. The northeasterly wind carried the smoke to the San Francisco Bay Area creating multiple separate events of high particulate matter concentrations and human exposure. Major fires include the Atlas Fire (size: 209 km2) in Napa County and the Tubbs Fire (149 km2), Nuns Fire (220 km2), and Pocket Fire (70 km2) in Sonoma County. Emissions from such large wildfires have rarely been extensively measured in previous field campaigns (Hodshire et al., 2019a). Descriptions of these fires can be found on the Cal Fire website: https://www.fire.ca.gov/incidents/2017 (last access: 11 April 2021). A post-fire survey by the Sonoma County Agricultural Preservation and Open Space District comprehensively measured the vegetation burned in the Sonoma County fires (http://sonomavegmap.org/data-downloads/, last access: 11 April 2021). The canopy damage data obtained in that survey were used to estimate the quantity of fuels burned in the Sonoma County fires. For the Atlas Fire, we overlaid Cal Fire's fire perimeter map and compared it with a vegetation map in 2004 to estimate the vegetation burned (Thorne et al., 2004). The NASA near-real-time VNP14IMGTDL_NRT Visible Infrared Imaging Radiometer Suite (VIIRS) 375 m active fire detection product (https://earthdata.nasa.gov/active-fire-data, last access: 11 April 2021) was used to confirm the daily fire points during the sampling period (Schroeder et al., 2014). Geospatial calculations were performed with the geoprocessing tools in ArcGIS Pro.
Our measurements started on 9 October, on a balcony on the second floor of a three-story building on the UCB campus (37.873∘ N, 122.263∘ W), in an urban area approximately 55–65 km downwind of those fires. The Hybrid Single-Particle Lagrangian Integrated Trajectory (HYSPLIT) model was used to calculate 24 h backward trajectories from our campus at a height of 50 m above the ground every hour within the sampling period, using Global Data Assimilation System's 0.5∘ × 0.5∘ resolution product as the meteorological input (Stein et al., 2015). Backward trajectories were grouped using the clustering function in the HYSPLIT software. We classified the air masses that arrived in Berkeley during the fire period into three clusters based on their origins, as shown in Fig. 1a and discussed in Sect. 3.1.
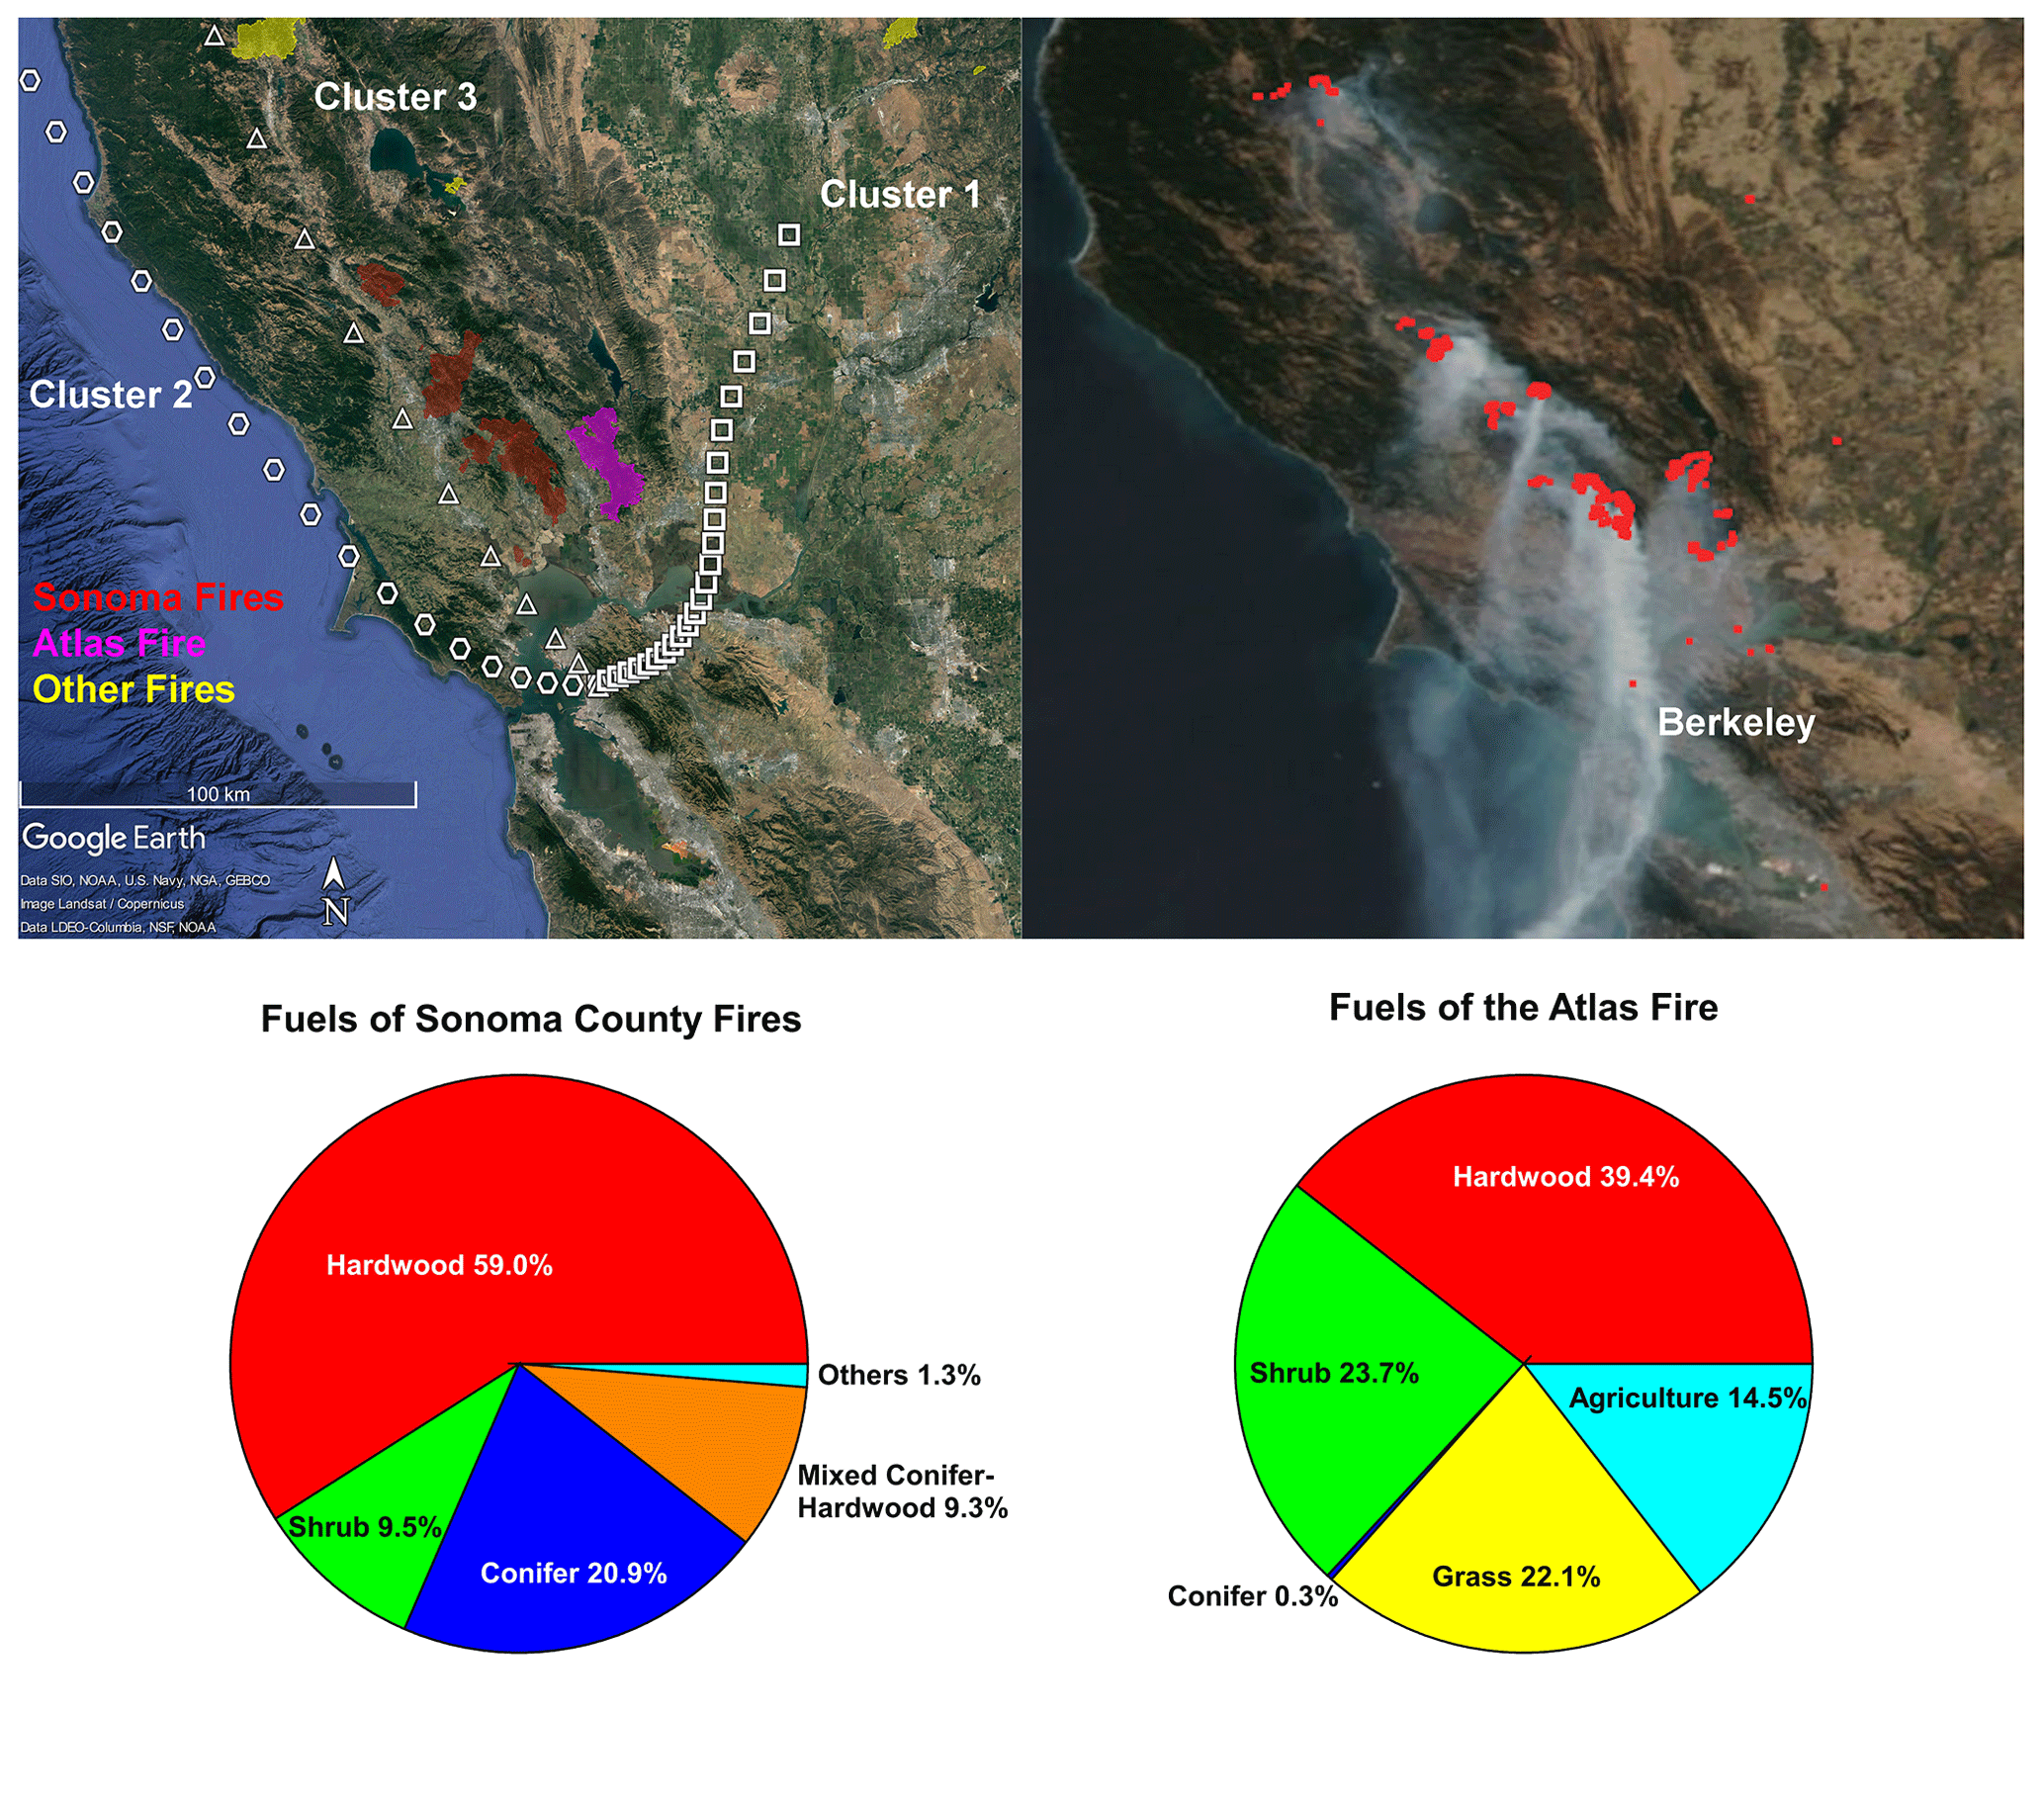
Figure 1(a) Perimeters of fires and the mean backward trajectory of each cluster with one symbol per hour; (b) satellite image of this area on 12 October 2017, with fire points detected by VIIRS labeled by red dots; (c) fuel composition of the fires in the Sonoma County; (d) fuel composition of the Atlas Fire in Napa County. Map © Google Earth 2020.
2.2 PM2.5 sampling and filter analysis by GC×GC
A total of 74 time-resolved (3–4 h resolution) particulate matter samples were collected using our custom-made sequential filter sampler. Ambient air passed through a sharp-cut 2.5 µm cyclone at 21 L min−1, and the particulate matter was collected on 102 mm diameter quartz-fiber filters (Pallflex Tissuquartz). The filters were stored in a −20 ∘C freezer before analysis. One or two 0.41 cm2 punches of sample were taken from each 102 mm sampled filter. Isotopically labeled internal standards were added to the filter punches prior to analysis to correct for any drift in system response (Jen et al., 2019). The samples were thermally desorbed in helium at 320 ∘C in a thermal-desorption autosampler (Gerstel) with online derivatization by MSTFA (N-methyl-N-(trimethylsilyl)trifluoroacetamide, Sigma Aldrich) before being focused on the Gerstel glass wool cooled injection system (30 ∘C). The derivatization step converted hydroxy groups into trimethylsilyl (TMS) esters, making the compounds easier to elute from columns. The analytes were then routed into the GC system (Agilent 7890). The first column in the GC×GC system is a semi-polar capillary 60 m × 0.25 mm × 0.25 µm column (Rxi-5Sil, Restek), which mainly separates compounds by volatility. The temperature of the first GC column was programmed to ramp from 40 to 320 ∘C at 3.5 ∘C min−1, then held for 5 min at 320 ∘C with helium carrier gas flowing at 2 mL min−1. Analytes eluted from the first column were focused on a guard column (Restek, 1.5 m × 0.25 mm, Siltek) in a dual-stage thermal modulator (Zoex) and then loaded onto the second column (Restek, Rtx-200MS, 1 m × 0.25 mm × 250 µm), where the analytes were separated mainly by polarity. A Tofwerk high-resolution () time-of-flight mass spectrometer (HR-ToF-MS) was used as the detector. All samples were analyzed under electron impact ionization (70 eV). Selected samples were analyzed by vacuum ultra-violet (VUV) ionization (10.5 eV) provided by Beamline 9.0.2 at the Advanced Light Source, Lawrence Berkeley National Laboratory. The VUV analyses were for identification only. To minimize fragmentation in VUV, the temperature in the ionization chamber was maintained at 170 ∘C, instead of the 270 ∘C typically used for election ionization (EI) analysis (Isaacman et al., 2012). The GC chromatograms were analyzed using GC Image software (GC Image, LLC).
2.3 Compound identification, classification, and quantification
We first identified compounds in the samples by matching with authentic standards. A custom-made biomass burning standard mixture of 99 compounds including alkanes, acids, sugars, aromatic compounds, and polycyclic aromatic hydrocarbons (PAHs) was applied to blank filters and analyzed by the same instrument. The standard compound list has been published in Table S4 in Jen et al. (2019). For compounds not in this standard mixture, we used the NIST MSSEARCH software to compare them with entries in NIST-14, MassBank, Golm Metabolome Database (GMD), Adams Essential Oil, MANE2010 flavor and fragrance mass spectral databases, and the GoAmazon, SOAS, and FIREX mass spectral libraries created at UC Berkeley in previous studies using the same instrument as this study (Jen et al., 2019; Yee et al., 2018; Zhang et al., 2018). A linear retention index (RI) on the first dimension describes the elution order of compounds from the first column (Yee et al., 2018). For compounds analyzed using the same type of column, the elution order is expected to be the same. The RI match is considered in the matching process. The parent ions of the compounds were confirmed with the VUV mass spectra. Positive identifications were achieved for 43 % of the speciated compounds. Details of compound identification are discussed in the Supplement.
A total of 572 compounds separated by the GC×GC were classified based on functionality, into mono-carboxylic acid (acid hereafter), alcohol, alkane, aromatic (monocyclic only), nitrogen-containing, other oxygenated (with two or more -OH or -COOH groups), (substituted and/or oxygenated) PAH, sugar (and sugar derivatives including anhydrosugars and sugar alcohols), (di- and/or tri-)terpenoids, and unknown groups. Detailed procedures for classifying unidentified compounds are provided in the Supplement.
The compound quantification procedure applied has been documented in detail in the main text and supplement of Jen et al. (2019). In brief, we applied multiple known levels of the 99-compound standard mix along with the internal standard mix to blank filters and obtained a response curve (based on total ion count) for each compound. Sample compounds within this list were quantified using these curves. Compounds not in this standard mix were quantified using the response curve of the nearest standard compound (preferably in the same class with the compound being quantified) on the GC×GC space. As estimated by Jen et al. (2019), compounds exactly matched with a standard compound have an uncertainty ∼ ±10 %. Compounds quantified by the nearest compound in the same class have an uncertainty of ∼ ±30 %. Compounds with unknown functionality have a systematic uncertainty of 200 %. We expect compounds with second column retention time > 1.6 s to also have such high uncertainty because there were no standard compounds with such high polarity, and a surrogate standard with lower polarity was used for quantification. However, only seven reported compounds were in that chromatographic region with extremely high quantitative uncertainty. Calibration was performed down to 2–10 ng for most compounds, and to 20 ng for very polar compounds such as 2,4-dinitrophenol, 5-nitrovanillin, and 4-nitrocatechol. In such concentrations, these analytes were observed at 10–10 000 times the chromatographic signal-to-noise ratio. We can very conservatively assume the detection limit to be 1 ng. When we took a 3 h sample at 21 L min−1, the limit of detection was equivalent to ∼ 0.26 ng m−3. That is far below the concentrations of most compounds measured.
2.4 Supporting measurements
Organic carbon (OC) and elemental carbon (EC) of punched samples from the filters were analyzed on a Sunset Laboratory Model 5 OCEC aerosol analyzer at the Air Quality Research Center at the University of California, Davis, using the NIOSH870 thermal protocol. A proton transfer reaction time-of-flight mass spectrometer (PTR-ToF-MS, PTR-ToF 8000, IONICON Analytik GmbH) was used to measure time-resolved concentrations of acetonitrile (a stable tracer for biomass burning) and other VOCs at a 1 Hz sampling frequency. The instrument was calibrated with an authentic VOC gas standard mixture (Apel Riemer Environmental Inc., Miami, FL) containing 23 compounds spanning a wide range of values. For compounds not directly calibrated, sensitivity factors derived from known proton transfer rates (Cappellin et al., 2012; Pagonis et al., 2019) and detector transmission curves were used to convert the response (normalized count rates) to concentration (ppb). Details of the PTR-ToF-MS operation and data processing have been documented elsewhere (Liu et al., 2019; Tang et al., 2016). Hourly concentrations of carbon monoxide (CO) and PM2.5 were continuously measured by the Bay Area Air Quality Management District (BAAQMD) at various sites in the region. Solar radiation data measured at Bethel Island (between the fire sites and Berkeley) were also provided by BAAQMD.
2.5 Estimation of a compound's volatility and average carbon oxidation state () from GC×GC measurement
Volatility (effective saturation concentration) and average carbon oxidation state distribution are important parameters for predicting the chemistry of OA (Donahue et al., 2011, 2012; Kroll et al., 2011). Isaacman et al. (2011) showed that the effective saturation concentrations (C*) and oxygen-to-carbon ratios of compounds can be estimated by their two-dimensional retention times. However, that model does not work as well when the sample contains a mixture of aliphatic and aromatic compounds. Also, derivatization can affect the saturation vapor pressure of compounds. We therefore trained two regression models using the MATLAB (version 2019b) Regression Learner to predict the saturation vapor pressure vP of every compound, and the for compounds with unknown formulae. Compound class, first column retention index, and second column retention time were chosen as the inputs. The compound class is related to the number of derivatized groups and thus corrects for the effect of derivatization on the retention times. We first found the standard compounds and a few positively identified oxygenated aliphatic compounds (such as malic acid, 2-hydroxyglutaric acid, and pinic acid) on the 2-D chromatogram and classified them using the same method for classifying compounds in the samples. The MPBPWIN v1.44 component (modified Grain method) in the EPI Suite and the EVAPORATION model were used to retrieve or calculate the saturation vapor pressure of these compounds at 298 K (Compernolle et al., 2011; US EPA, 2012). The average carbon oxidation state of each compound was calculated by , where O, C, H, and N are the numbers of oxygen, carbon, hydrogen, and nitrogen (+V oxidation state) atoms in this compound, respectively. Then we trained the models using the retention times or indices, classes of the known compounds as the inputs, and their saturation vapor pressure from databases or as responses with 5-fold cross validation. The saturation vapor pressure model and the model achieved an R2 of 0.93 and 0.96 between the modeled responses and the true responses, respectively (Fig. S2). The uncertainties for the predictions of compounds in different chemical classes were also shown in Fig. S2. More details about the models can be found in the Supplement. The saturation vapor pressure vP of each compound was then converted to C* (in µg m−3) by
where MWi is the molecular weight of compound i in g mol−1 (assume MW is 200 g mol−1 for compounds with unknown formulae), ξi is the unitless activity coefficient of compound i (assumed to be 1), vP,i is the saturation vapor pressure of compound i (Torr), R is the gas constant (8.21 × 10⁻⁵ m3 atm mol−1 K−1), and T is the temperature (assume 298 K) (Isaacman et al., 2011; Pankow, 1994).
2.6 Hierarchical clustering analysis
Agglomerative hierarchical clustering analysis (HCA) was performed to group the compounds into factors based on their temporal behaviors using the MATLAB Statistics and Machine Learning Toolbox. It has been demonstrated that HCA can identify major groups of compounds (ions) from timelines and patterns of behaviors from chamber measurement data (Koss et al., 2020). A major advantage of the hierarchical clustering analysis over the positive matrix factorization (PMF) method is each compound will only end up in one factor. Ubiquitous biomass burning tracers like levoglucosan will not be split into multiple biomass burning factors.
The concentration timelines were first normalized to prevent all of the high (or low) concentration compounds from being clustered into the same factor. Then the Euclidean distance between each pair of normalized timelines (e.g., compound concentration vectors u and v) was calculated by
where ui and vi are the normalized concentrations of compound u and v at time step i, n is the number of data points (n=74 in this case), respectively. The Ward method was used to cluster the normalized timeline according to the distance (Ward, 1963). This algorithm starts with one compound as a cluster of its own and then finds the nearest compound and merges them (for example, compounds u and v were merged into cluster A). When two clusters (A and B) are merged, the increase of the within-cluster sum of squares is calculated by
where nA and nB are the number of compounds in clusters A and B, is the Euclidean distance between the center of cluster A and cluster B. The goal is to find the B that minimizes d(A,B). The number of clusters were set at four to eight, and the seven-cluster solution was chosen mainly because of interpretability. The cost of merging (increase in d) was also considered by making sure there was not a jump in d when an extra merge was performed.
3.1 Fires and fuels, backward trajectories, and spread of the fire plumes
Figure 1a displays the perimeters of the wildfires in Napa and Sonoma counties. Figure 1b shows the satellite image and the fire points detected by VIIRS on 12 October as an example. The UCB campus site and many regions in the Bay Area were directly affected by the smoke transported to the Bay Area from these fires. Fuels burned in the Atlas Fire (Fig. 1c) were dominated by hardwood (including grapevines, various oaks, and eucalyptus) and shrubs (chamise and whiteleaf manzanita). Conifer vegetation accounted for less than 1 % of the area within the perimeter of the Atlas Fire. Hardwood forest (various oaks) also dominated the canopies burned in fires in Sonoma County. However, conifers (Douglas fir, knobcone pine, redwood, ponderosa pine, etc.) contributed 20.9 % of the canopy burned. The shrubs (shrubby oaks, chamise, manzanita) constitute 8.9 % of canopy burned in Sonoma County (Fig. 1d).
The mean backward trajectory of each cluster is also shown in Fig. 1a. Plumes in cluster 1 arrived from the northeast at relatively low speed. Their plume ages were quite variable, ranging from around 5 to 12 h. They mainly picked up smoke from the Atlas Fire. Plumes in cluster 2 originated from the west coast. They picked up smoke from the wildfires (mainly Sonoma County fires) and then transported it to the Bay Area. The plume ages were estimated to be between 6 to 10 h. Smoke in cluster 2 is expected to be more aged than smoke in cluster 3. Plumes in cluster 3 traveled 3–5 h from the fires to the UCB campus, as estimated from HYSPLIT. They mainly transported smoke from the Sonoma County fires to the Bay Area.
Figure 2 shows the impact of three representative wildfires on the air quality in the Bay Area. In the 11 October daytime plume, hourly PM2.5 concentration in Napa and Vallejo exceeded 350 µg m−3. PM2.5 levels in other BAAQMD monitoring stations (with locations shown in Fig. S3) reached their peaks of above 100 µg m−3 successively, roughly following the distances from the fires. Even the San Jose Jackson Street site (around 120 km downwind of the fires) recorded an hourly averaged PM2.5 of ∼ 120 µg m−3. The plume on the night of 11 October to the early morning of 12 October and the daytime plume on 17 October were less dense in terms of PM2.5. The temporal profiles of PM2.5 at different measurement sites clearly show that they were all affected by the same plumes. In October 2017, when there was no influence from the wildfires, the PM2.5 at these BAAQMD sites typically stayed below 15 µg m−3. Therefore, when the smoke came, BBOA was the dominant component of particulate matter.
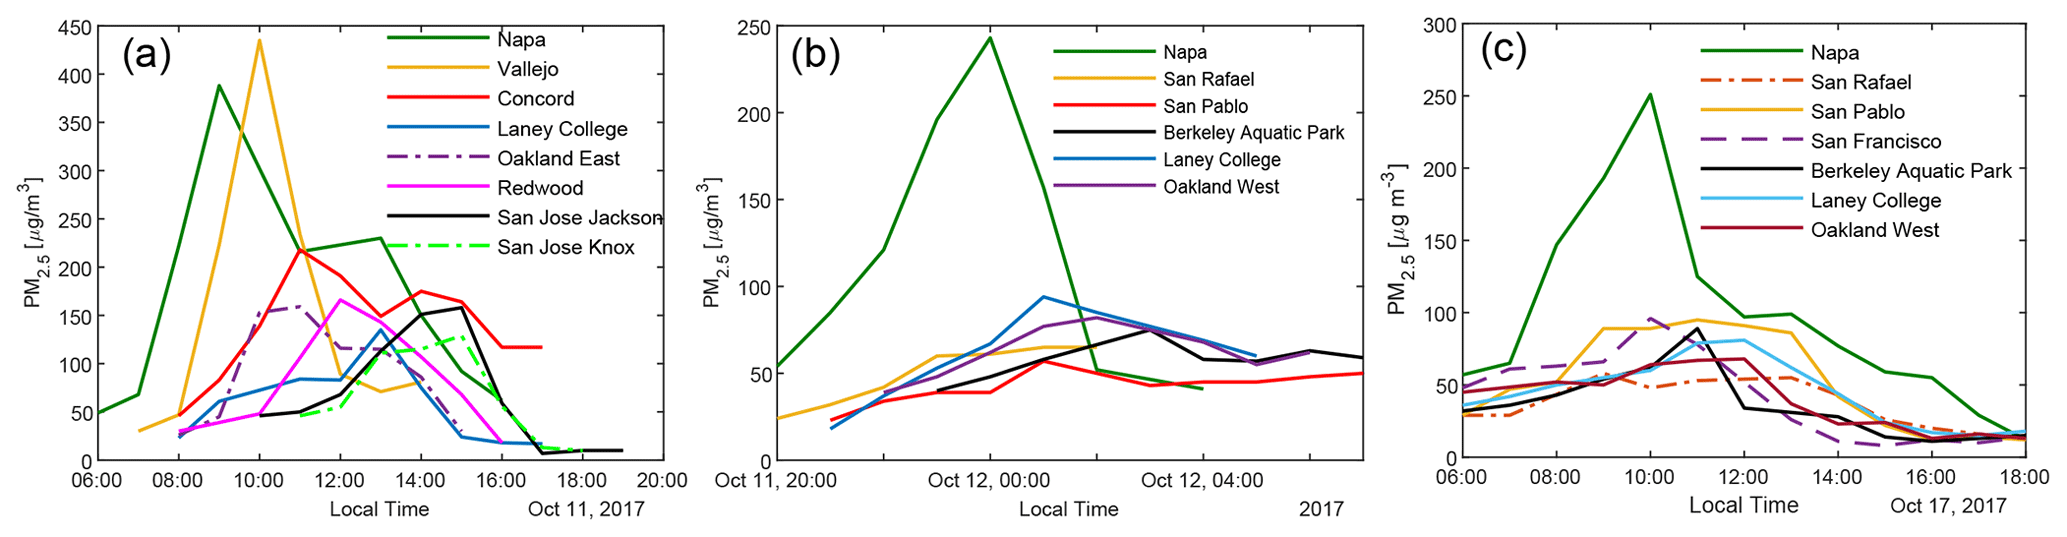
Figure 2Hourly PM2.5 concentration measured at BAAQMD sites affected by the fires plumes on (a) 11 October 2017, (b) the night of 11 October to the early morning of 12 October 2017, and (c) 17 October 2017.
3.2 Chemical composition of particle-phase organic aerosols
The concentrations of different classes of compounds in each sample measured by the GC×GC are displayed in Fig. 3. In the three samples with highest total quantified mass (all from cluster 3 plumes), the compounds quantified can explain 15 %–20 % of total OC by mass. However, in samples with minimal biomass burning influence, only 5 %–10 % of OC can be explained. We define periods with total quantified OA above 4 µg m−3 as plume periods (17 samples), total quantified OA < 0.8 µg m−3 as background periods (30 samples), and samples with quantified OA between 0.8 and 4 µg m−3 as BB influence periods (27 samples). The background periods were not totally unaffected by BBOA. The mean and standard deviation of concentrations for each group of compounds, the sum of all measured compounds (total quantified OA), and the total OC in the three kinds of periods are shown in Table 1. Sugars, dominated by levoglucosan, account for more than a third of total quantified OA in plume periods. Based on the structures, most of these sugars (if underivatized) can fragment into C2H4O ( 60) under electron ionization, which can contribute to the signal of C2H4O when measured by aerosol mass spectrometers (Fabbri et al., 2002). Terpenoids (especially resin acids) and nitrogen-containing compounds (dominated by nitrocatechols) were also specific to BBOA, while other families of compounds had other sources. For instance, the acids were enriched when smoke was affecting Berkeley, but their fractions in OA are lower than in background plumes because of dilution by the BB-specific compounds.
Table 1Concentration of each chemical family, total quantified OA by GC×GC, and OC [µg m−3] of the three regimes. Standard deviation is indicated as “SD”.
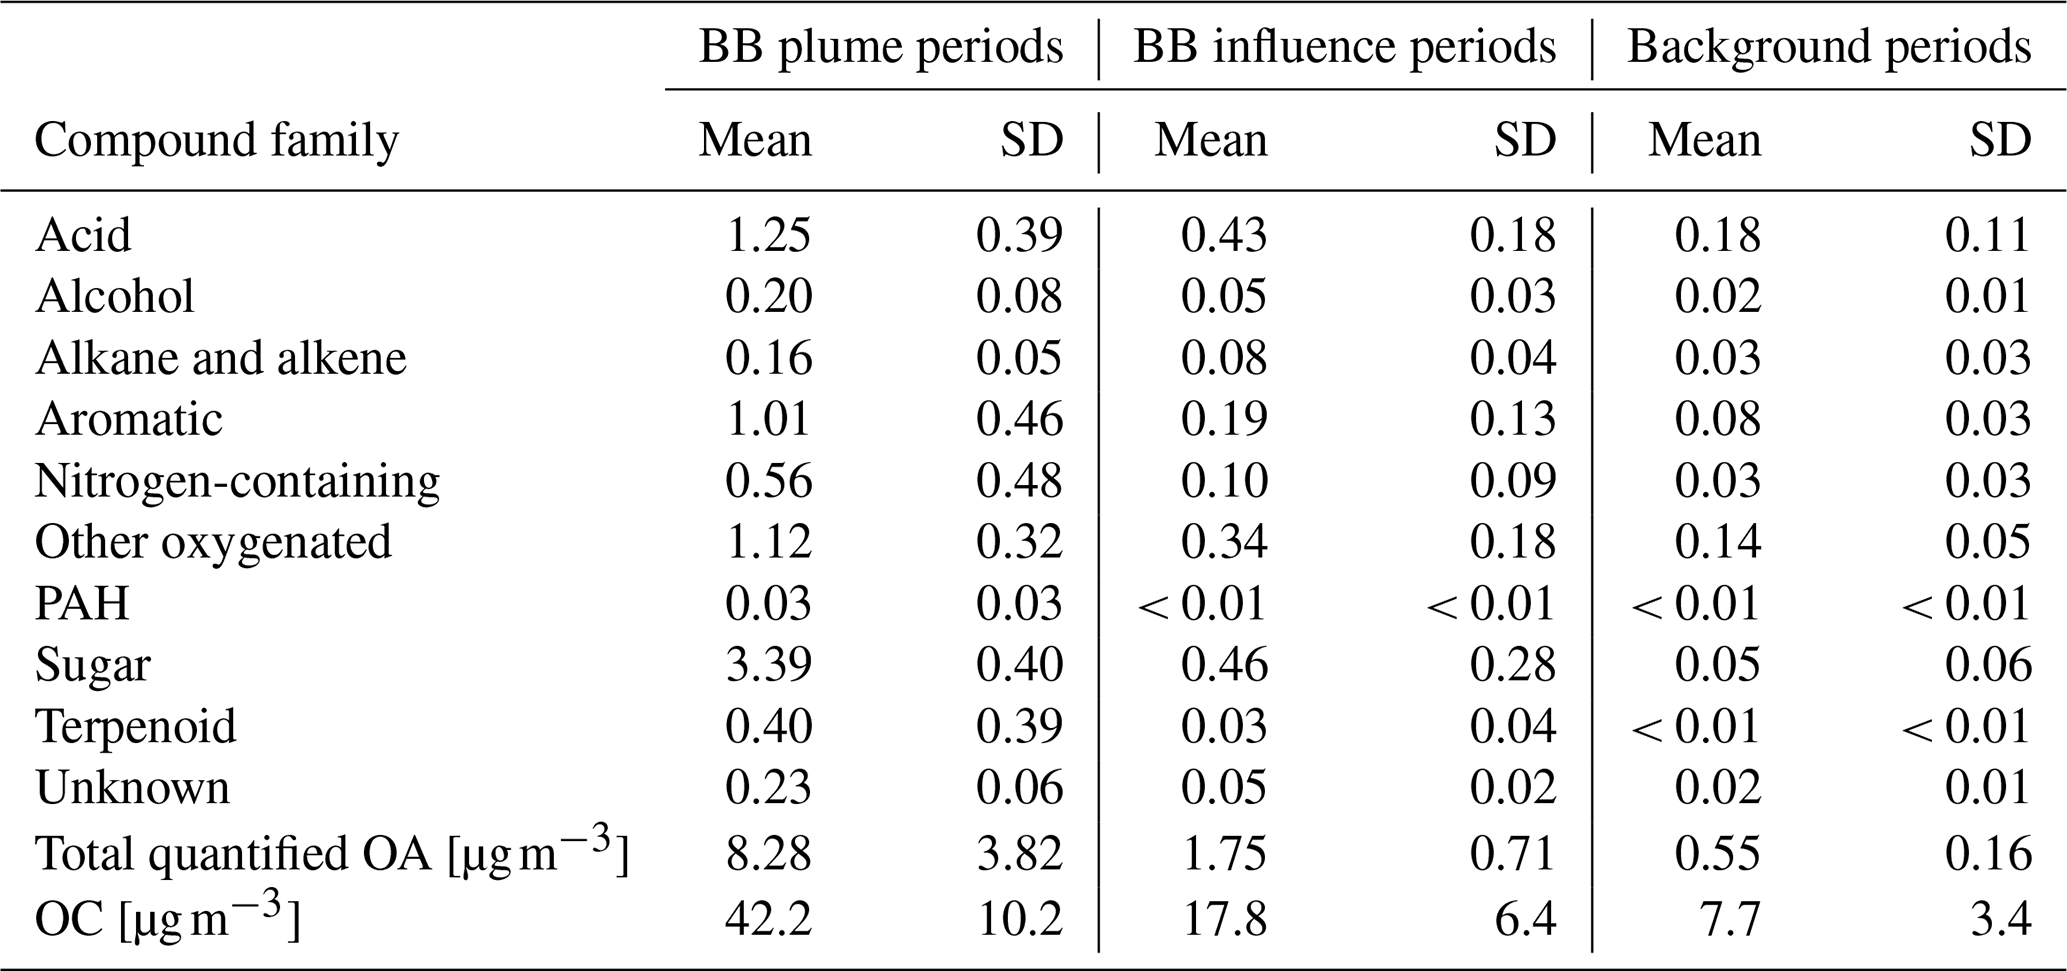
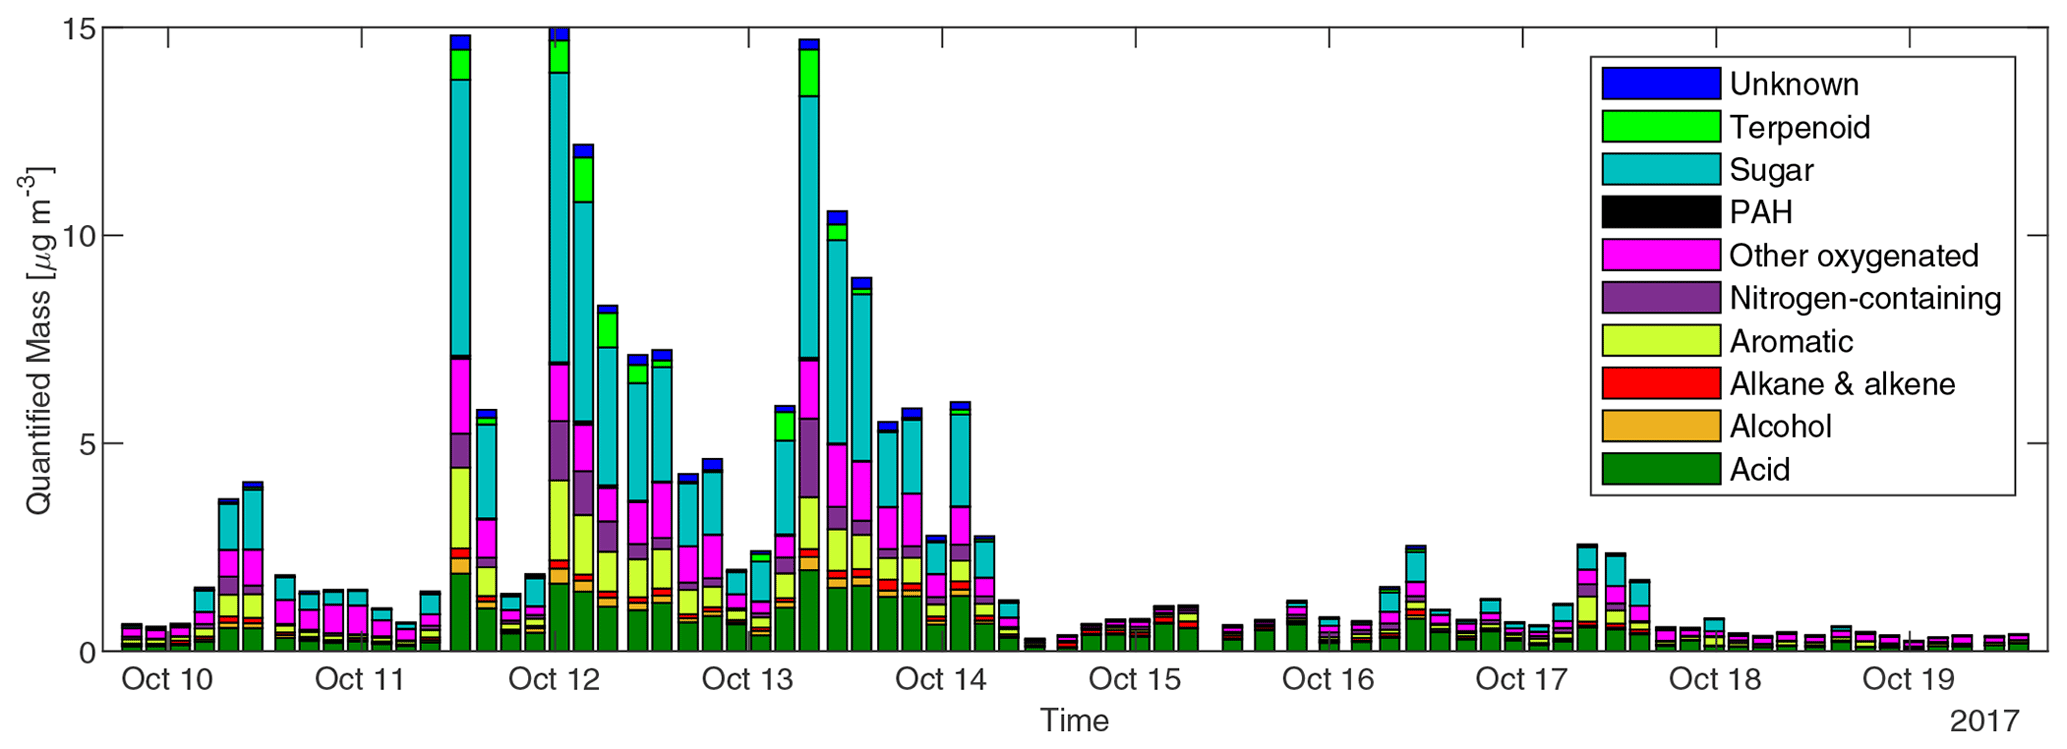
Figure 3Concentrations of speciated compounds classified by chemical family in each sample. Each stacked bar shows the sum of concentrations of compounds in each class in a 3 or 4 h sample.
In all samples, the fraction of PAHs remained below 0.3 % of total quantified OA. The low PAH fraction in OA measured at UCB could be a result of both low PAH emission and photochemical loss. The emission, exposure, and health impacts of PAHs in biomass burning have received a great deal of attention in previous studies (Shen et al., 2013; Sun et al., 2018; Tuet et al., 2019). However, other groups of compounds, such as monocyclic aromatic compounds including hydroquinone, catechol, and cinnamaldehyde (Leanderson and Tagesson, 1990; Muthumalage et al., 2018), may also make substantial contributions to the toxicity of biomass burning smoke. The effect of compounds other than PAHs may be worthy of attention in future toxicological studies of BBOA. The maximum concentrations of the most abundant positively identified compounds and most abundant PAHs observed at Berkeley and their possible hazards are listed in Table S1. Knowledge of the health impacts of inhaling compounds in this list is still lacking. For example, many nitroaromatic compounds were found to be mutagenic (Purohit and Basu, 2000). The nitro compounds were found to be the main contributor to the mutagenicity of PM2.5 in northern Italy (Traversi et al., 2009). The sum of concentrations of (methyl-)nitrocatechols observed at Berkeley exceeded 1.2 µg m−3. However, no toxicological research on these compounds was found in PubChem.
Figure 4 displays the volatility and distribution of speciated compounds in two relatively fresh samples (with 3–4 h aging). The two samples have almost equal total quantified OA by mass. In the two samples, the volatility distribution and the distribution were almost identical. The volatility distribution obtained is similar to particle-phase primary BBOA reported by Hatch et al. (2018) in the way that most compounds reside in 10 µg m−3 bins. But the standard deviation of log10C* in our study is higher than that in Hatch et al. (2018), which could be related to fuel differences and aging. Compounds in the 10−2 µg m−3 µg m−3 bin were mainly aliphatics and triterpenoids, while 1 to 102 µg m−3 bins consist of sugars, aromatic compounds, and other oxygenated compounds. The distributions measured at UCB differ remarkably from that inferred from thermodenuder plus AMS measurements of primary BBOA from wood combustion (Donahue et al., 2012; Grieshop et al., 2009c). In that measurement, most of compounds had near −1.5. However, our measurement shows that sugars and oxygenated species cause a larger peak of between −0.5 and 0.5, although there is a peak of OA with between −2 and −1.5 contributed mainly by mono-carboxylic acids. The fragmentation probability is an important parameter for simulating SVOCs in fire plumes (Alvarado et al., 2015). The probability of an SVOC compound to fragment when reacting with OH can be estimated by (Donahue et al., 2013). Assuming , for compounds with between −0.5 and 0.5, the probability for them to fragment and form more volatile compounds is roughly 0.84–0.96. Stronger fragmentation could reduce net growth of mass of particle-phase BBOA in aging processes.
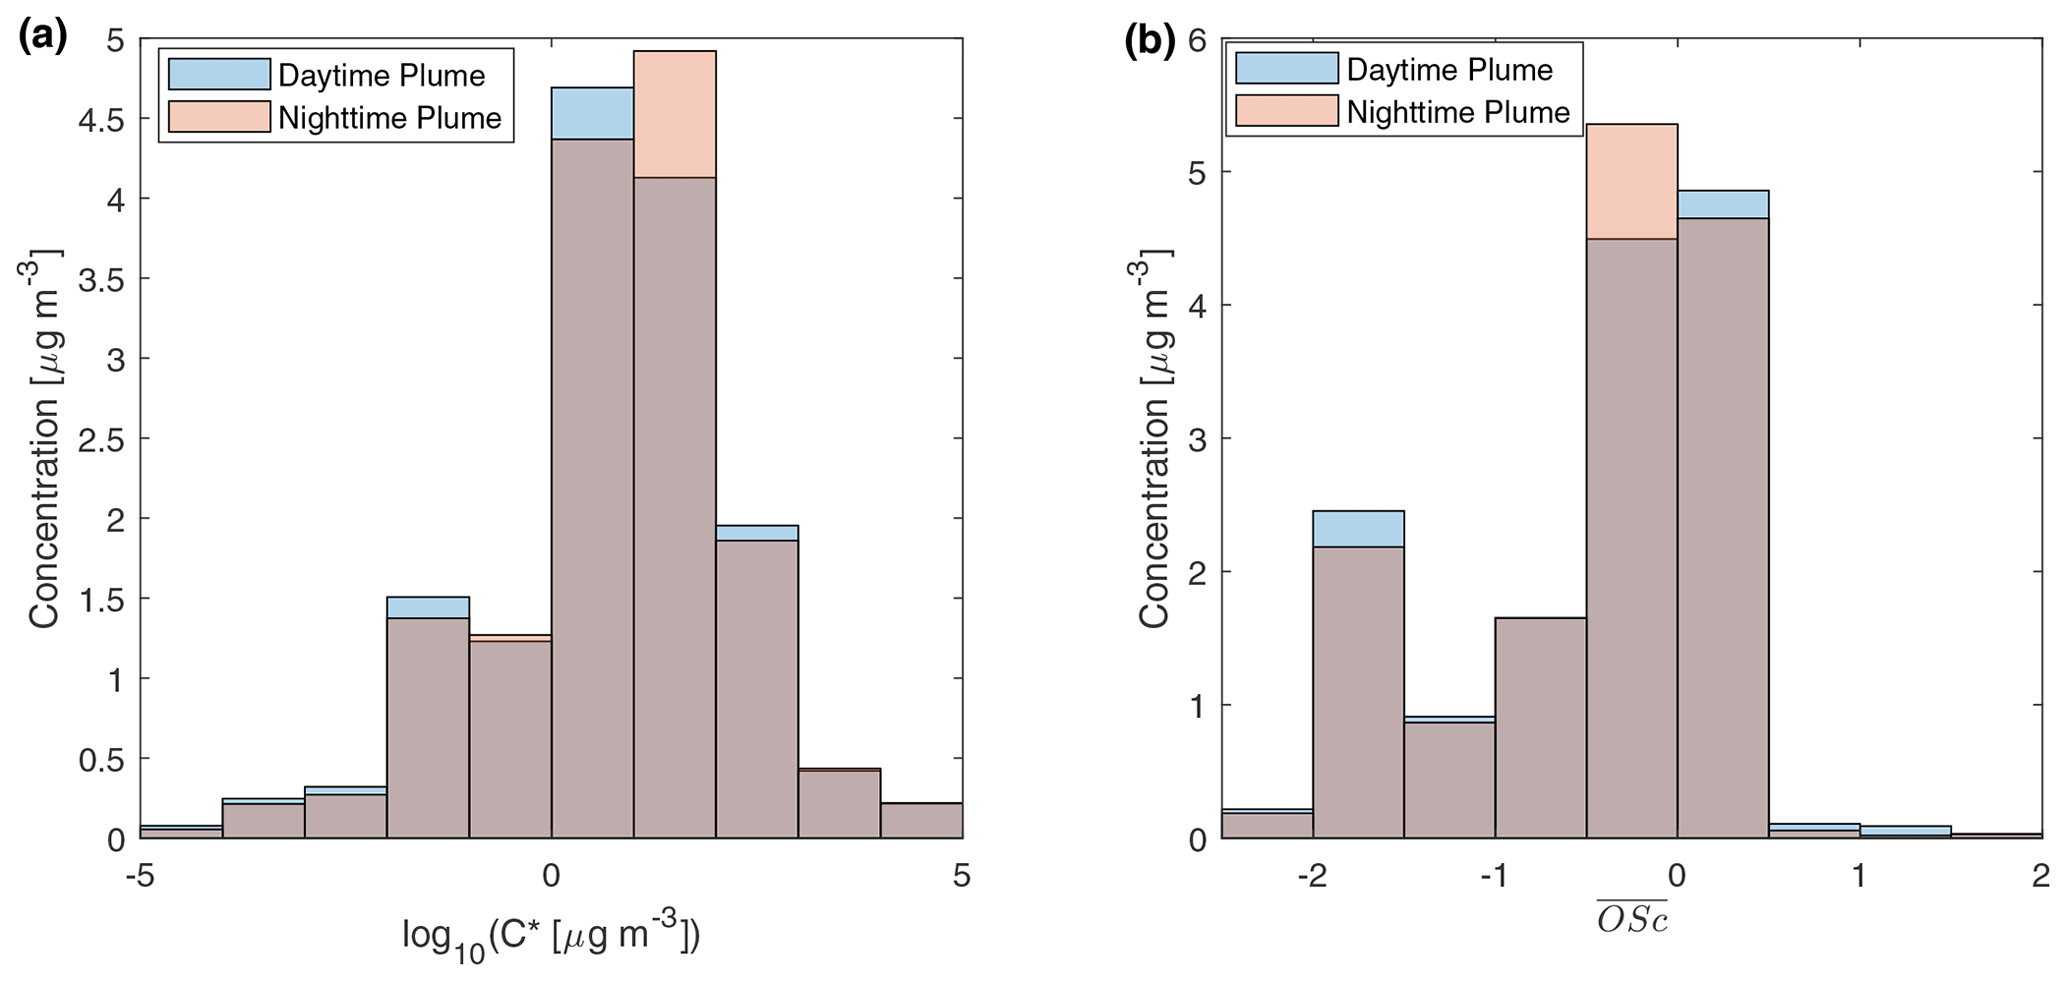
Figure 4Mass distribution of speciated compounds in different (a) effective saturation concentration and (b) average carbon oxidation state bins. The daytime plume is from a sample in the 11 October plume described in Fig. 2a. The nighttime sample is from a sample in the 11–12 October plume in Fig. 2b. The gray parts of the bar show the overlaps of the daytime plume and the nighttime plume samples.
3.2.1 Primary BBOA markers can indicate vegetation burned
Figure 5 shows the timelines of OC, commonly used BB marker compounds and the backward trajectory clusters throughout the campaign. Levoglucosan and mannosan, being the decomposition products of cellulose and hemicellulose, respectively, are emitted in the combustion of most plants (Jen et al., 2019; Nolte et al., 2001; Simoneit, 2002). Levoglucosan is the most abundant BBOA species measured in this campaign. Its abundance reached around 20 % of total quantified OA in the plume periods. Comparing Fig. 5d and e, when there was a peak of OC, there were usually peaks of levoglucosan as well. The levoglucosan mannosan mass ratio can be used to differentiate hardwood and softwood (conifer) fires. Hardwood fires usually have emission ratios of levoglucosan mannosan of around 20, while for softwood fires this ratio is usually less than 5 (Cheng et al., 2013). The levoglucosan mannosan ratio stayed above 20 in most samples, which confirms the dominance of hardwood as fuel in the October 2017 Northern California wildfires as shown in Fig. 1c and d.
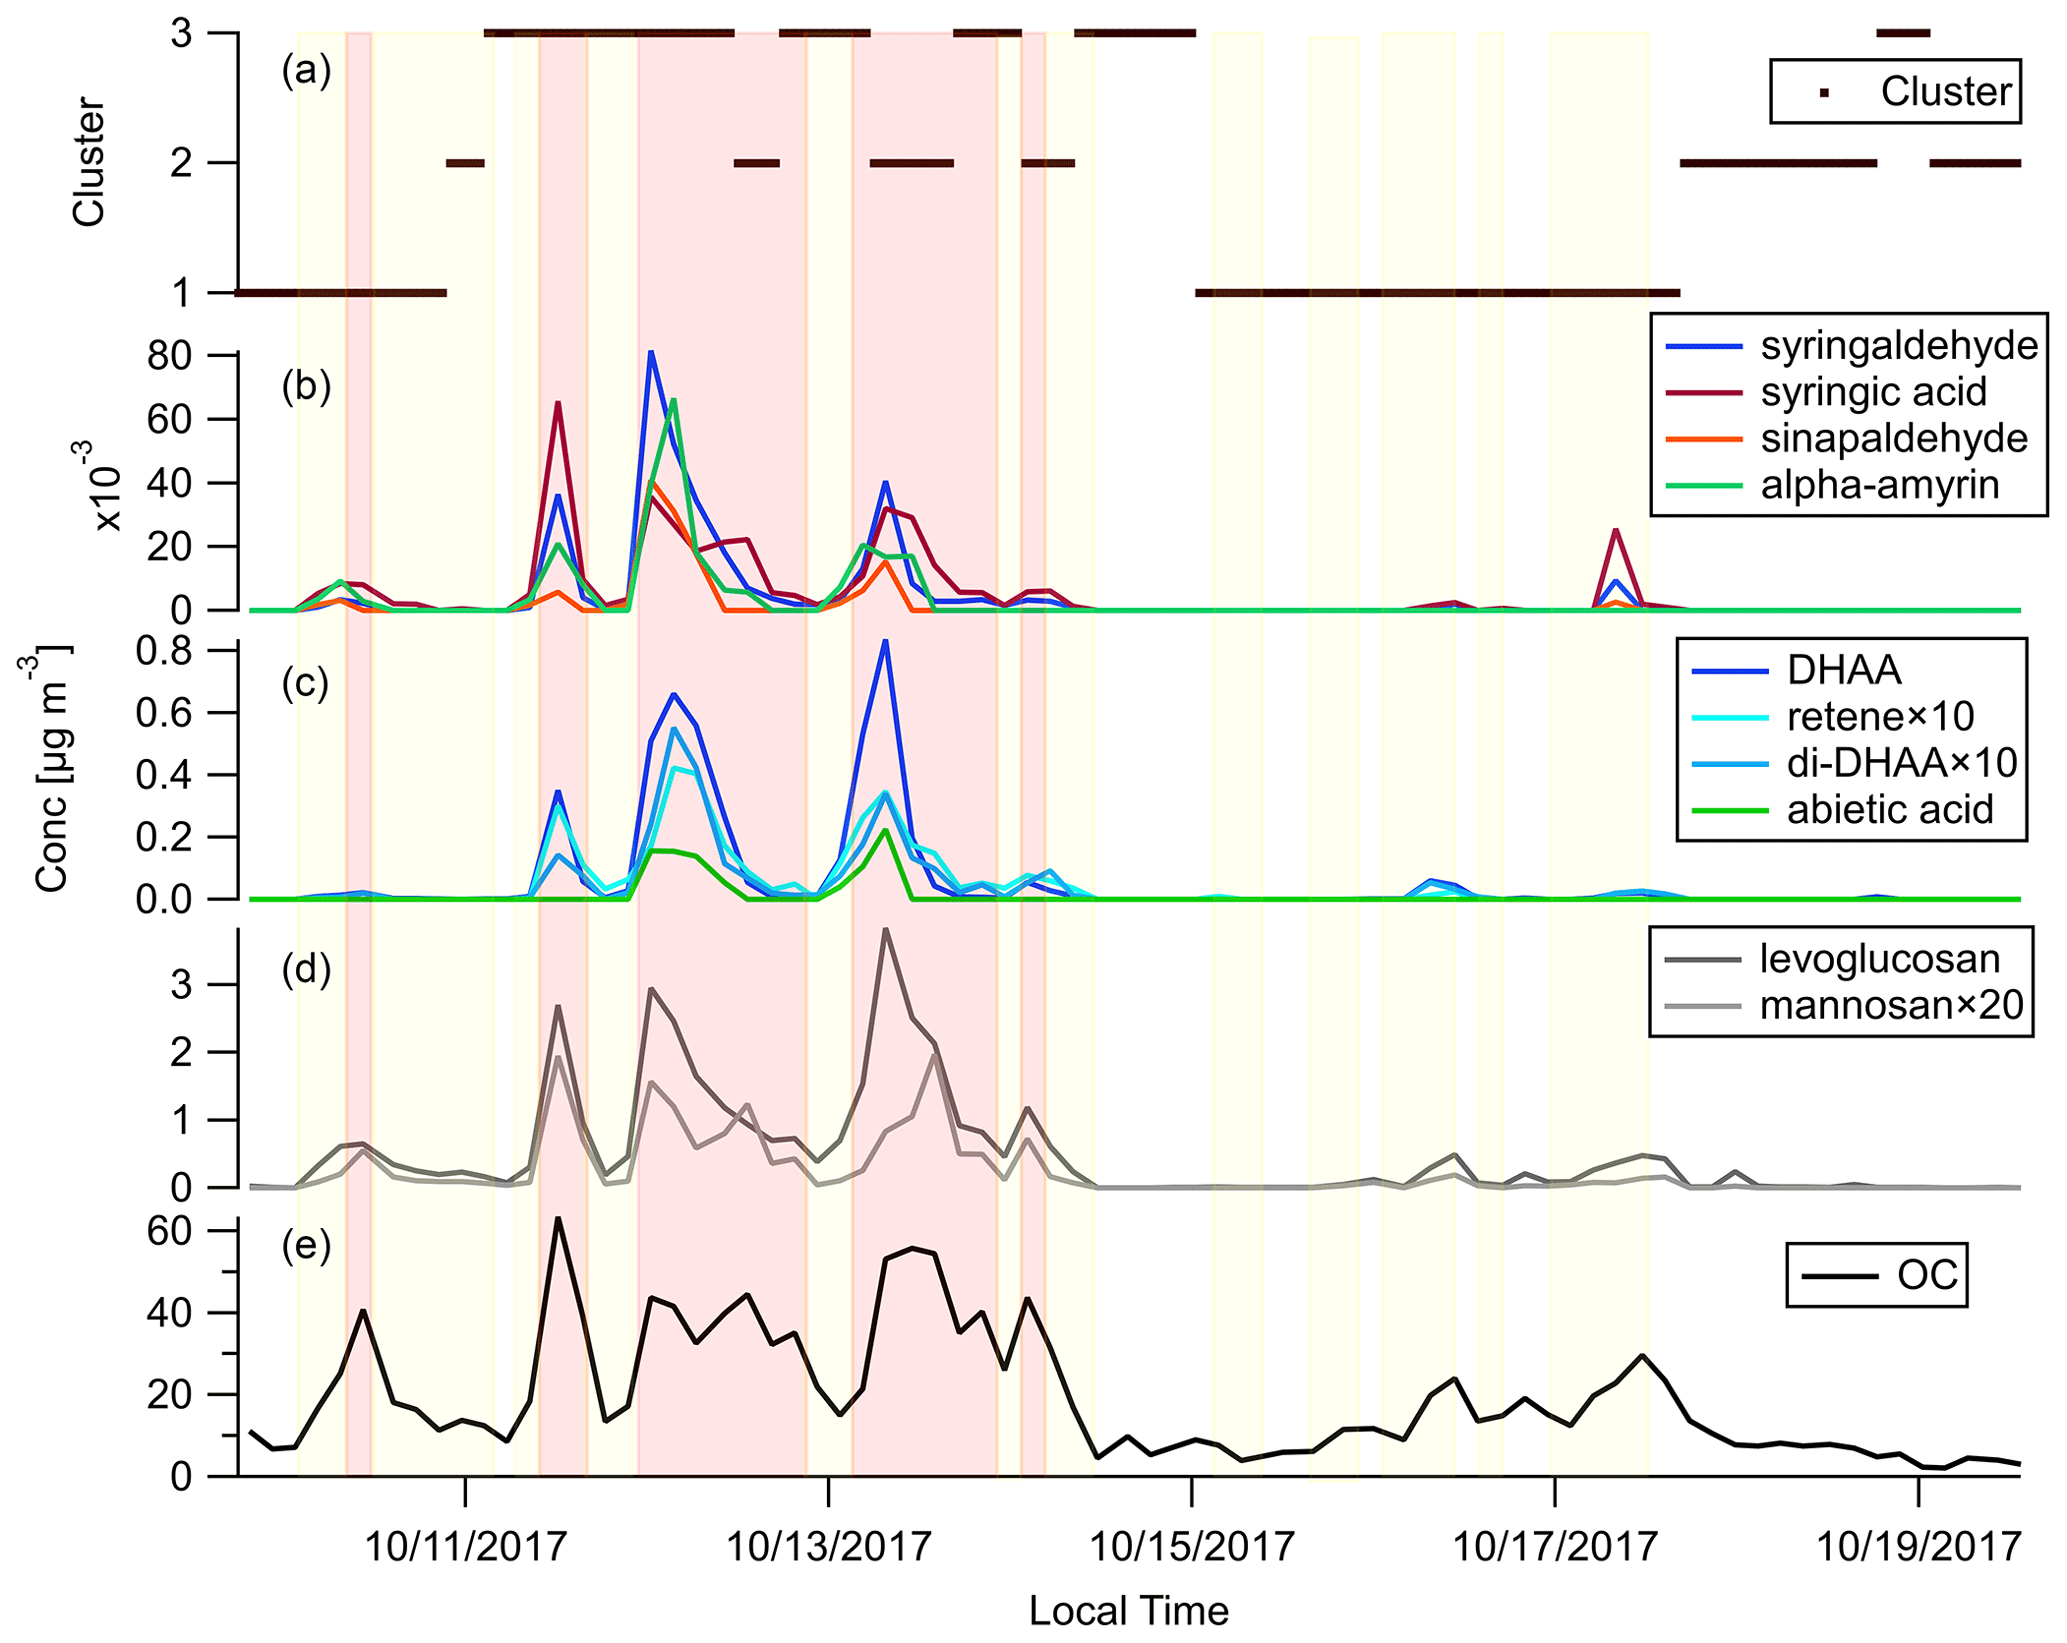
Figure 5Time series of (a) backward trajectory clusters, (b) hardwood primary BBOA markers, (c) softwood primary BBOA markers, (d) general primary BBOA markers, and (e) OC. Light red shading shows the plume periods, and light yellow shading shows the BB influence periods as described in Sect. 3.2.
Diterpenoids including resin acids are unique markers in biomass burning emissions for conifer combustion (Hays et al., 2002). Figure 5c shows the time series of dehydroabietic acid (DHAA), di-dehydroabietic acid (di-DHAA), abietic acid, and retene. The concentration of the most abundant resin acid, dehydroabietic acid, reached over 0.8 µg m−3 in a plume. These conifer tracers mainly showed up in three plumes on 11, 12, and 13 October. Figure 5a shows that those plumes were associated with backward trajectories in clusters 2 and 3 which mainly transported smoke from the fires in Sonoma County, in which more than 20 % of the vegetation burned was conifer. In contrast, the BB plumes on 10 and 17 October were not accompanied by peaks of these conifer fire makers. That agrees with the fact that those plumes originated in the northeast (Fig. 5a), which mainly transported smoke from the Atlas Fire with little conifer combustion. Dimethoxyphenols and amyrins are markers of hardwood. They were enriched in the plumes on 10 and 17 October, as well as the plumes on 11–13 October, which further confirms the ubiquity of hardwood fuels in all the fires affecting Berkeley. Hydroquinone and two other compounds were also shown to be good tracers for manzanita burning in our previous work (Jen et al., 2018). They were present in most of the plumes, which is in line with our finding that manzanita is widely distributed in that region.
3.2.2 Traditional specific secondary BBOA markers
We focus on the behaviors of two groups of BB-specific SOA compounds here. 7-Oxo-dehydroabietic acid (7-oxo-DHAA) was proposed to be an aging product of resin acids (Yan et al., 2008). However, other studies have suggested that DHAA can thermally degrade to 7-oxo-DHAA and finally retene in fires, and the differences in the abundance of these compounds can be attributed to the combustion temperature (Ramdahl, 1983; Simoneit et al., 1993; Standley and Simoneit, 1994). To figure out whether this process mainly occurs in the fires or in the atmosphere, a comparison between source and receptor profiles of these compounds is needed. The ratios and concentration timelines of DHAA, 7-oxo-DHAA, and retene are shown in Fig. 6a and b. Both the 7-oxo-DHAA DHAA ratio and the retene DHAA ratio peaked after the peak of DHAA. In addition, as shown in Fig. S4, the 7-oxo-DHAA DHAA ratio and the retene DHAA ratio in the primary BBOA were far below the ratios detected in the ambient samples at Berkeley. Therefore, it is likely that the conversion to 7-oxo-DHAA (and retene) mainly happened through oxidation during transport in the atmosphere. Our observations were consistent with the hypothesis that 7-oxo-DHAA DHAA ratio is a useful indicator for the formation of BB SOA.
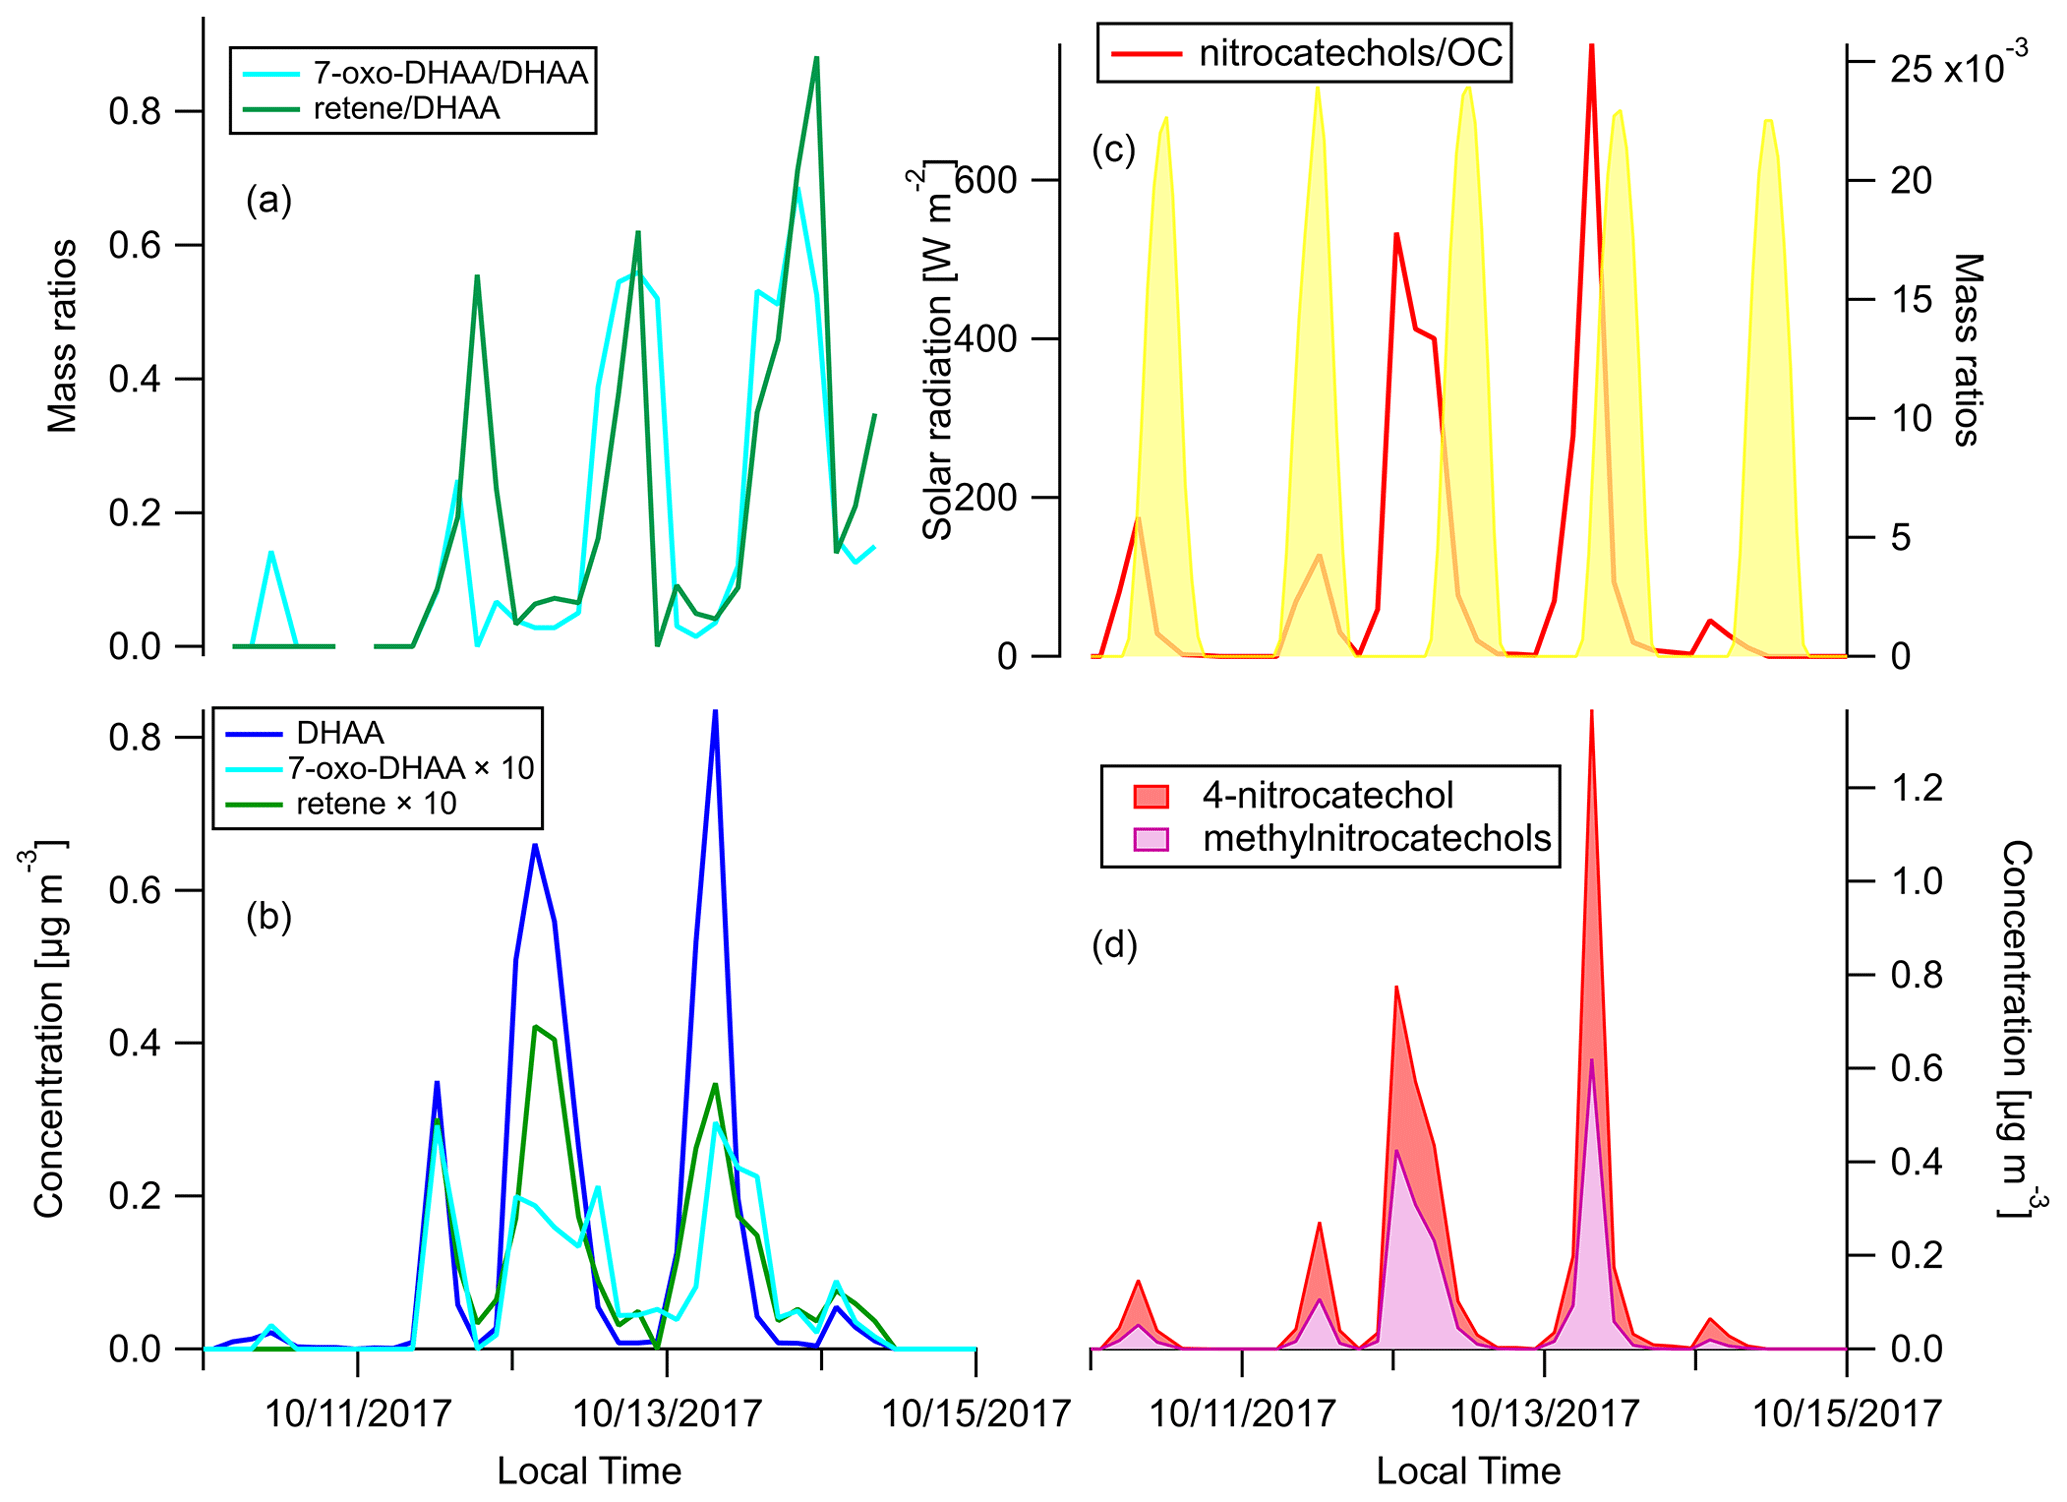
Figure 6Time series of (a) mass ratios of 7-oxo-DHAA DHAA and retene DHAA, (b) concentrations of DHAA, 7-oxo-DHAA, and retene (c), mass ratios of the sum of nitrocatechols OC and solar radiation, and (d) concentrations of 4-nitrocatechols and methylnitrocatechols. Solar radiation in panel (c) was measured at Bethel Island, a measurement site in between Napa and Berkeley.
Another group of compounds often used as tracers for BB SOA in source apportionment are the nitro-aromatic compounds (Watson et al., 2016). When catechol or methyl-catechols react with OH, NO3, or HONO with the presence of NO2, 4-nitrocatechol or methyl-nitrocatechols will be produced (Bertrand et al., 2018; Finewax et al., 2018; Iinuma et al., 2010; Vidović et al., 2018). The low vapor pressures of these compounds cause them to be mainly in the particle phase, and therefore they are expected to be useful BB SOA markers (Finewax et al., 2018). Figure 6d shows the concentration time series of the nitrocatechols. The sum of the nitrocatechols reached 1.37 µg m−3 in the early morning on 13 October, which is 9.1 % of total quantified OA. The nitrocatechol OC ratios in daytime plumes (11, 12, and 13 October afternoons) were lower than in the nighttime and/or early morning plumes (Fig. 6c). Since the plumes came from the same fires, the diel difference was either caused by the differences in day–night combustion processes or oxidation chemistry. The concentration of catechol and 4-nitrocatechol are shown in Fig. S5. In the daytime plumes, there were more catechol relative to 4-nitrocatechol than in the nighttime and/or early morning plumes. Finewax et al. (2018) has shown that the molar yields of 4-nitrocatechol when catechol reacts with OH and NO3 are 0.3 ± 0.03 and 0.91 ± 0.06, respectively. The dominance of NO3 radicals as the nighttime oxidants can help to explain the higher nitrocatechols OC ratio at night. It was recently reported that these nitrocatechols can be further oxidized by OH radicals, the major daytime oxidant (Palm et al., 2020). The difference in oxidation mechanism is thus a more plausible explanation for the diel changes in the nitrocatechols OC ratio observed at Berkeley.
Qualitatively, the nitrocatechols are good markers for BB SOA. However, assuming [OH] molecules cm−3 and [NO3] molecules cm−3, the lifetimes of catechol against OH or NO3 oxidation are only 1.4 h and 20 s, respectively (Finewax et al., 2018). As shown in Fig. 6b and d, the timelines of nitrocatechols are very similar to the primary BBOA tracers like dehydroabietic acid, especially in the nighttime plumes. Nitrocatechols and dehydroabietic acid were categorized into the same timeline factor in all four-factor to eight-factor solutions in the HCA analysis (see Sects. 2.6 and 3.4). Although these smoke plumes traveled approximately 3–4 h from the fires to Berkeley, it was long enough for the formation of substantial amounts of nitrocatechols. In addition, 4-nitrocatechol was also detected in fresh BBOA in the Fire Lab study (Jen et al., 2019). This issue could be a challenge for the use of nitrocatechols as BB SOA markers in timeline-based source apportionment analyses.
3.3 Clustering of compounds by HCA
To reduce the complexity of interpreting the time series of each of the 572 compounds, we simplified them into seven factors based on their similarity in temporal behavior. Figure 7a displays a dendrogram of the factors. The predicted volatility and calculated or predicted of each compound are displayed in Fig. 7b, colored by the factor the compound belongs to. Factor 1 (N=85) compounds include levoglucosan, mannosan, vanillic acid, 4-hydroxybenzoic acid, pentacosanoic acid, etc. These compounds are universally emitted in burning most kinds of biomass fuels. The grass fire tracer, p-Coumaryl alcohol (Nolte et al., 2001; Oros et al., 2006; Simoneit et al., 1993), is also in this factor. It indicates the presence of grass as understory fuel in all the fires. This factor contributes around one-third of the total quantified mass (Fig. 8). Factor 2 (N=78) is also dominated by primary BBOA compounds. Most aliphatic acids, alcohols, and alkenes above C20 (including n-nonacosan-10-ol) are in this factor. The most abundant alkane measured, n-nonacosane, is also in this factor. These compounds are likely from plant wax sources (Medeiros and Simoneit, 2008; Simoneit, 2002). Like factor 1, compounds in the second factor were present in almost all BB plumes. Factor 3 (N=100) is also a primary BBOA factor. But it is hard to associate with it with any specific fuels based on the chemical composition, and it is therefore called the “primary BBOA unknown” factor. Compounds in this factor were more abundant in the 11 October daytime plume than in the 12 and 13 October plumes. This factor contains hardwood tracers like syringic acid, as well as galactosan and pinitol, which are more abundant in conifer combustion emissions (Medeiros and Simoneit, 2008; Munchak et al., 2011). Other sugar alcohols, such as myo-inositol, ononitol, erythritol, and xylitol, are in this factor. These compounds are more abundant in green (moist) vegetation fires (Medeiros and Simoneit, 2008; Schmidl et al., 2008). The most abundant sugar alcohol, myo-inositol, is present in both plants and animals as well (Loewus and Murthy, 2000; Medeiros and Simoneit, 2008). Its concentration reached 0.28 µg m−3 in the 11 October plume that originated from Sonoma County.

Figure 7(a) Hierarchical clustering relationship. (b) Effective saturation concentration versus of compounds colored by factor number.
Factor 4 (N=35) is the most volatile factor, with more than half the compounds having C* above 102 µg m−3. This factor contains urban OA, such as nicotine, delta-9-tetrahydrocannabinol, glycerol, and terephthalic acid. However, several compounds emitted in hardwood fires, such as pyrogallol, syringol, and sinapyl alcohol are also in this factor. Their concentrations in the 17 October plumes were comparable to or even higher than those in the 11–13 October plumes. Since the 17 October plume mainly came from the Atlas Fire, the high abundances of these tracers were expected. However, it is unclear why other hardwood BBOA markers like syringaldehyde and sinapaldehyde did not follow this trend. The concentrations of syringol and pyrogallol were found to increase moderately in aging experiments due to partitioning or chemical formation (Bertrand et al., 2018; Fortenberry et al., 2018). Since the 17 October plume was more aged than the 11–13 October ones, it is possible that the two compounds were formed during transport. Factor 5 (N=124) is a BBOA factor. Its concentrations exceeded factor 1's in the densest plumes on 11–13 October. This factor represents BBOA from the Sonoma County fires according to the backward trajectory cluster. It consists of many hardwood tracers (such as sinapaldehyde, lupeol, α-amyrin, and syringaldehyde) and softwood tracers (such as DHAA, pimaric acid, sandaracopimaric acid, abietic acid, and retene), as well as fast-forming SOA such as nitrocatechols. The co-occurrence of both hardwood and softwood tracers indicates these fuels were burned simultaneously in the fires in Sonoma County.
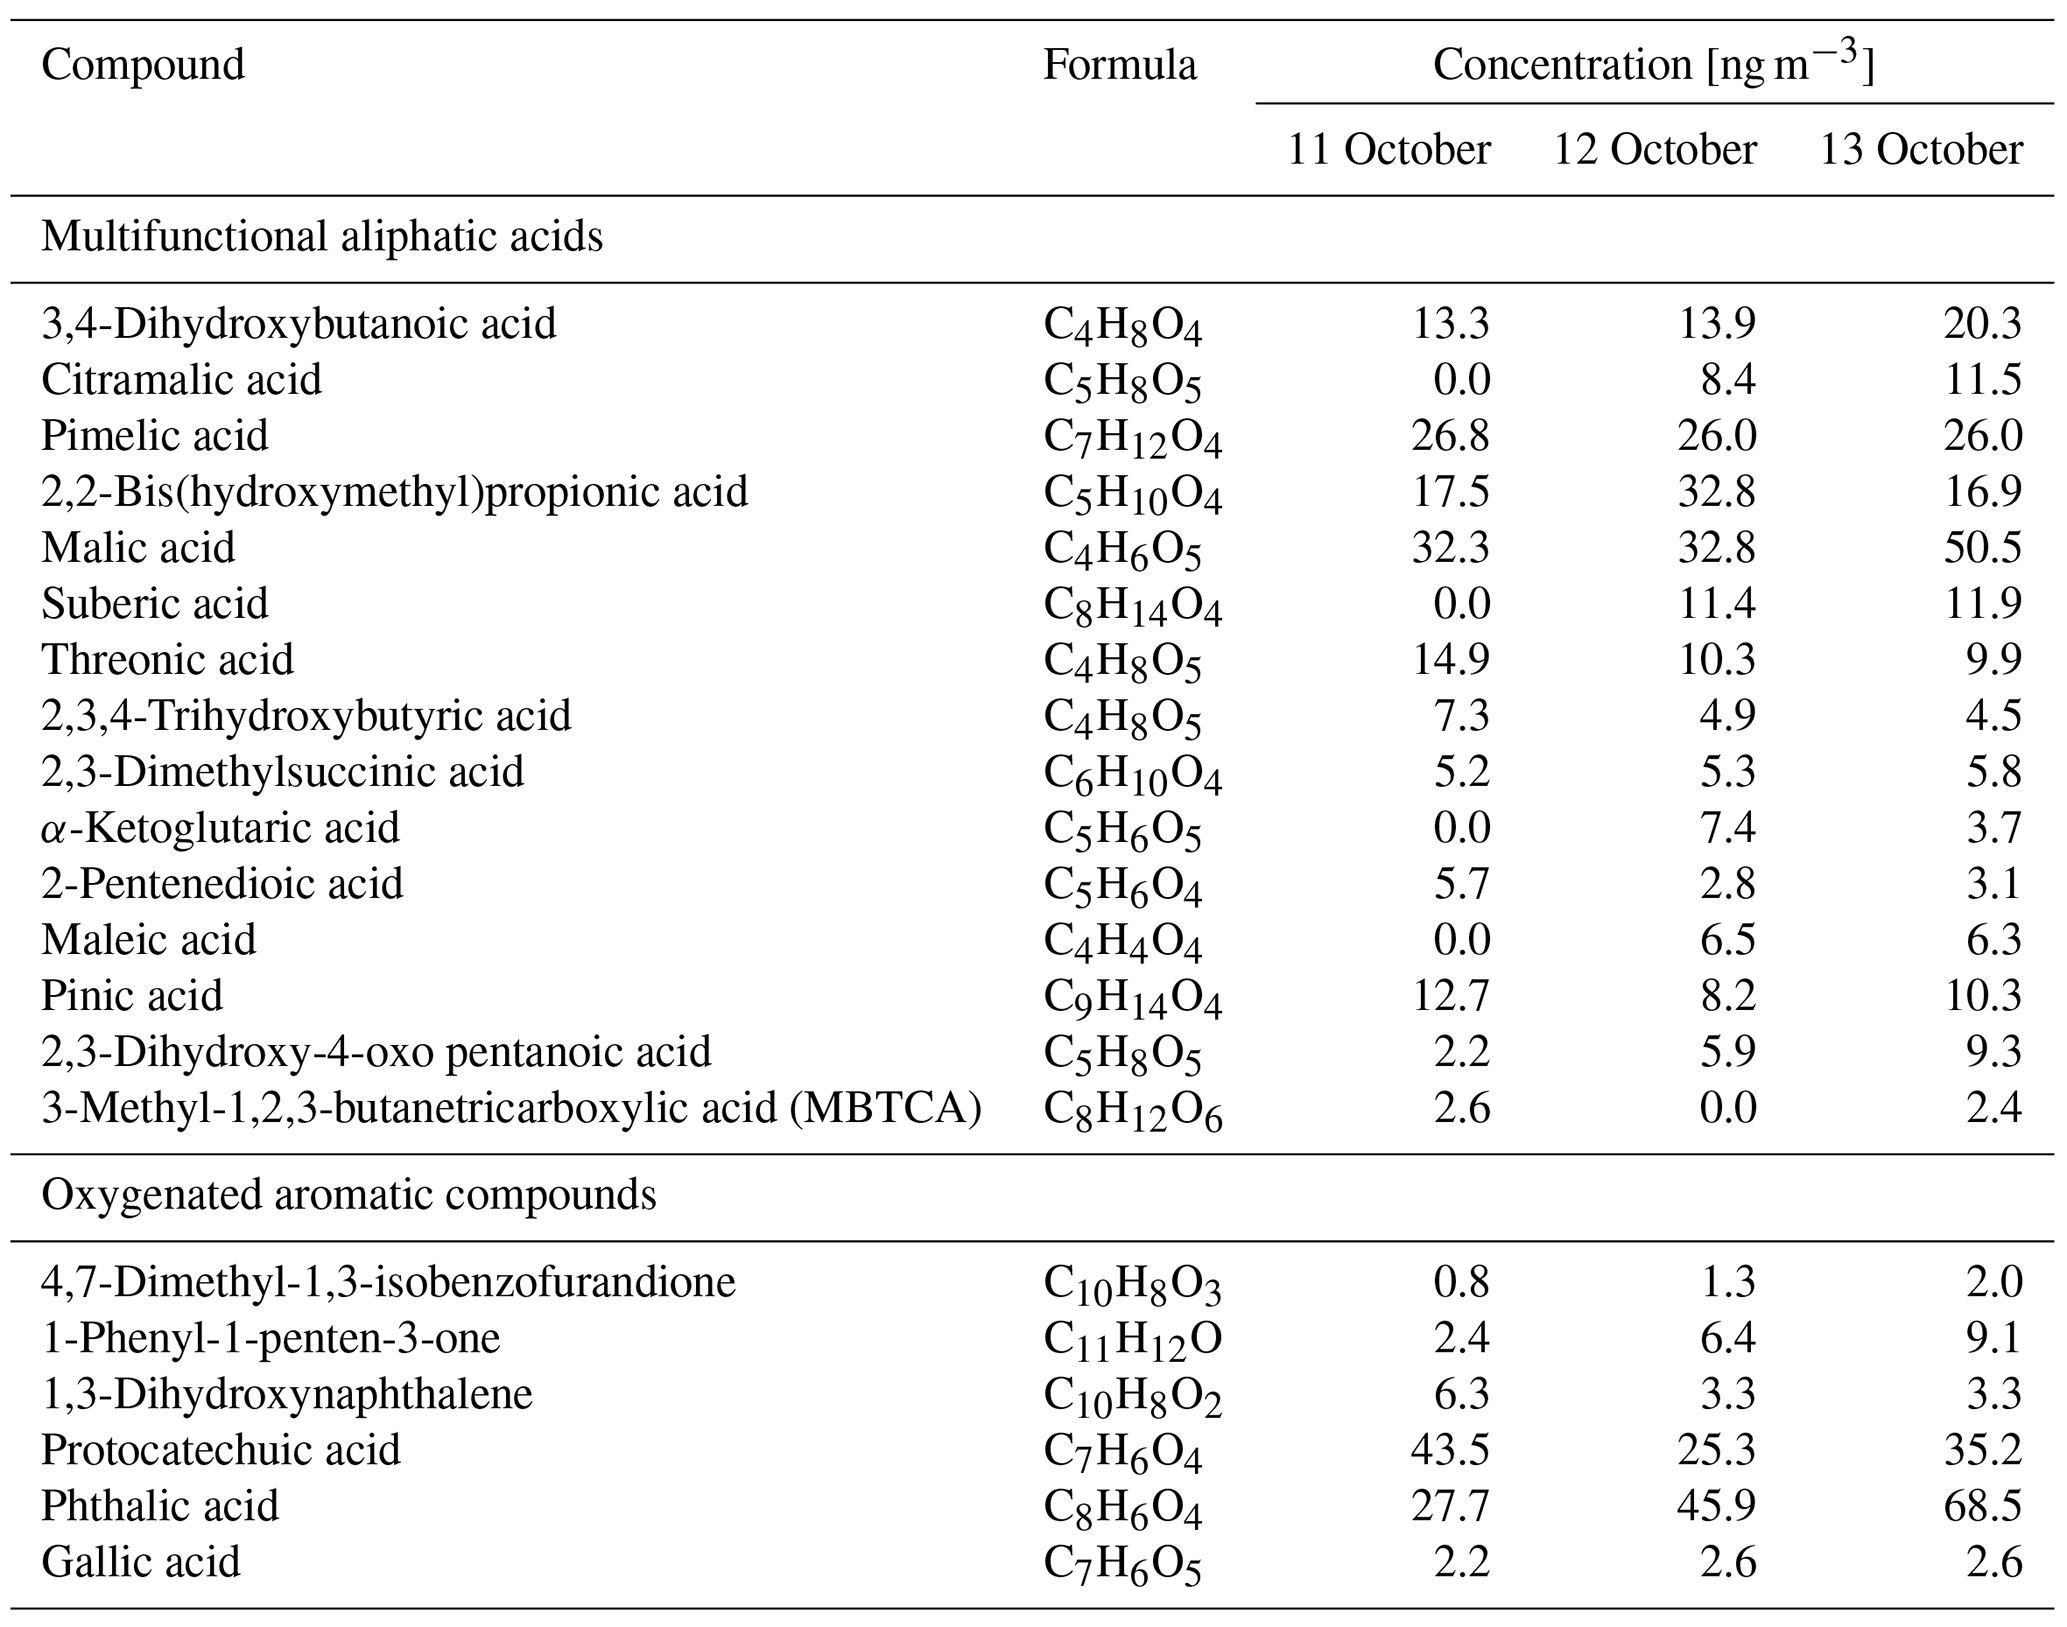
Factor 6 (N=100) is the daytime BB SOA factor. This factor has a moderate correlation with levoglucosan (r=0.68). The dendrogram shows this factor has a large distance (small correlation) from any other factor (Fig. 7a). Figure 9 displays the concentration of this factor versus time. The major peaks of this factor either happened in the afternoon or in the plume that arrived in Berkeley at night but had previously experienced daytime aging. Higher daytime concentrations of these compounds indicate stronger aging processes of BBOA in daytime. The 11 October afternoon plume was relatively fresh, with ∼ 3 h daytime aging (in backward trajectory cluster 2). The 12 and 13 October afternoon plumes were more aged (in backward trajectory cluster 3). Although the OC level in the 11 October plume was the highest, the concentration of factor 6 was higher in the 12 and 13 October afternoon plumes. This factor accounted for 9 %–14 % of total quantified OA in those plumes. More than 90 % of the mass of this factor resides in C* volatility bins between 1 and 103 µg m−3, which indicates the semi-volatile nature of this factor. Positively identified BB SOA compounds include multifunctional aliphatic acids and oxygenated aromatic compounds (Table 2). All the multifunctional aliphatic acids have less than 10 carbon atoms. Although they were abundant in aged biomass burning plumes, many of them are not specific tracers of BB SOA. For instance, malic acid and tartaric acid were found in aged wood smoke in oxidation experiments (Hartikainen et al., 2020). However, they can be produced in the oxidation of 1,3-butadiene and isoprene (Claeys et al., 2004; Jaoui et al., 2014). Malic acid can also be produced by the hydroxylation of succinic acid, an oxidation product of long-chain unsaturated fatty acids (Kawamura et al., 1996; Kawamura and Ikushima, 1993). Pinic acid and 3-methyl-1,2,3-butanetricarboxylic acid (MBTCA), commonly used as biogenic (monoterpene) SOA tracers (Jenkin et al., 2000; Szmigielski et al., 2007; Zhang et al., 2018), are also in this factor. Monoterpenes and oxy-monoterpenes can account for more than 5 % of total non-methane organic gas emissions in certain conifer fires (Hatch et al., 2019). The biogenic SOA could be oxidation products of the terpenes emitted in fires. It is also possible that biomass burning emissions enhanced the formation of biogenic SOA. As for aromatic compounds listed in Table 2, phthalic acid, 4,7-dimethyl-1,3-isobenzofurandione, and 1,3-dihydroxynaphthalene could be PAH oxidation products (Wang et al., 2007). Protocatechuic acid and gallic acid are likely more specific to biomass burning. Protocatechuic acid is a product of coniferyl alcohol and coniferyl aldehyde ozonolysis and of the vanillic acid + NO3 reaction (Liu et al., 2012; Net et al., 2010, 2011). Protocatechuic acid and gallic acids were also found to be the Fenton-like oxidation products of biomass burning-related small aromatic acids in the atmospheric aqueous phase (Santos et al., 2016a, b). These compounds could be monitored in future field and lab studies to verify whether they are suitable BB SOA tracers.
Table 2Concentrations of selected positively identified compounds in factor 6 in the plumes on the afternoons of 11, 12, and 13 October.
Factor 7 (N=51) is an urban OA factor. Palmitic acid, stearic acid, benzophenone, and 6,10,14-trimethyl-2-pentadecanone are all in this factor. The concentration of this factor was more constant over time than the others. It did not sharply increase in the fire plumes. EC (not included in Fig. 8) was also grouped into this factor, which indicates that EC measured at the UCB campus was not dominated by EC from fires.
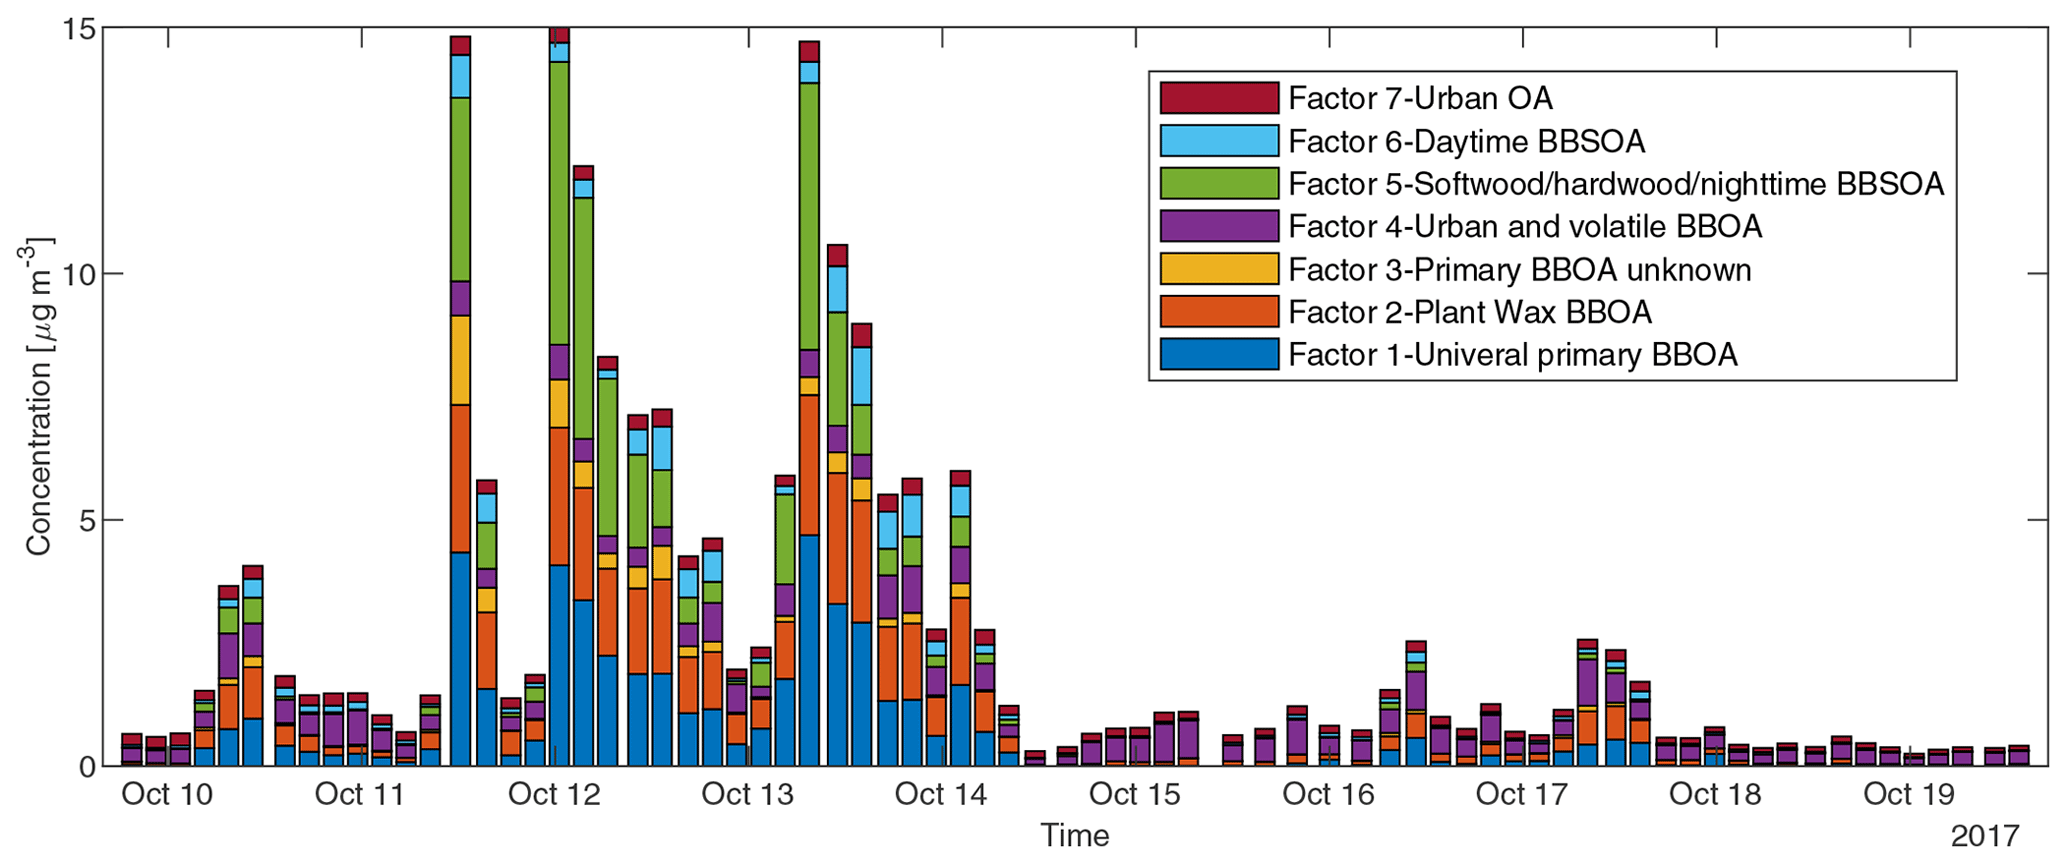
Figure 8Sum of concentrations of GC×GC speciated and quantified compounds in different factors in each sample.
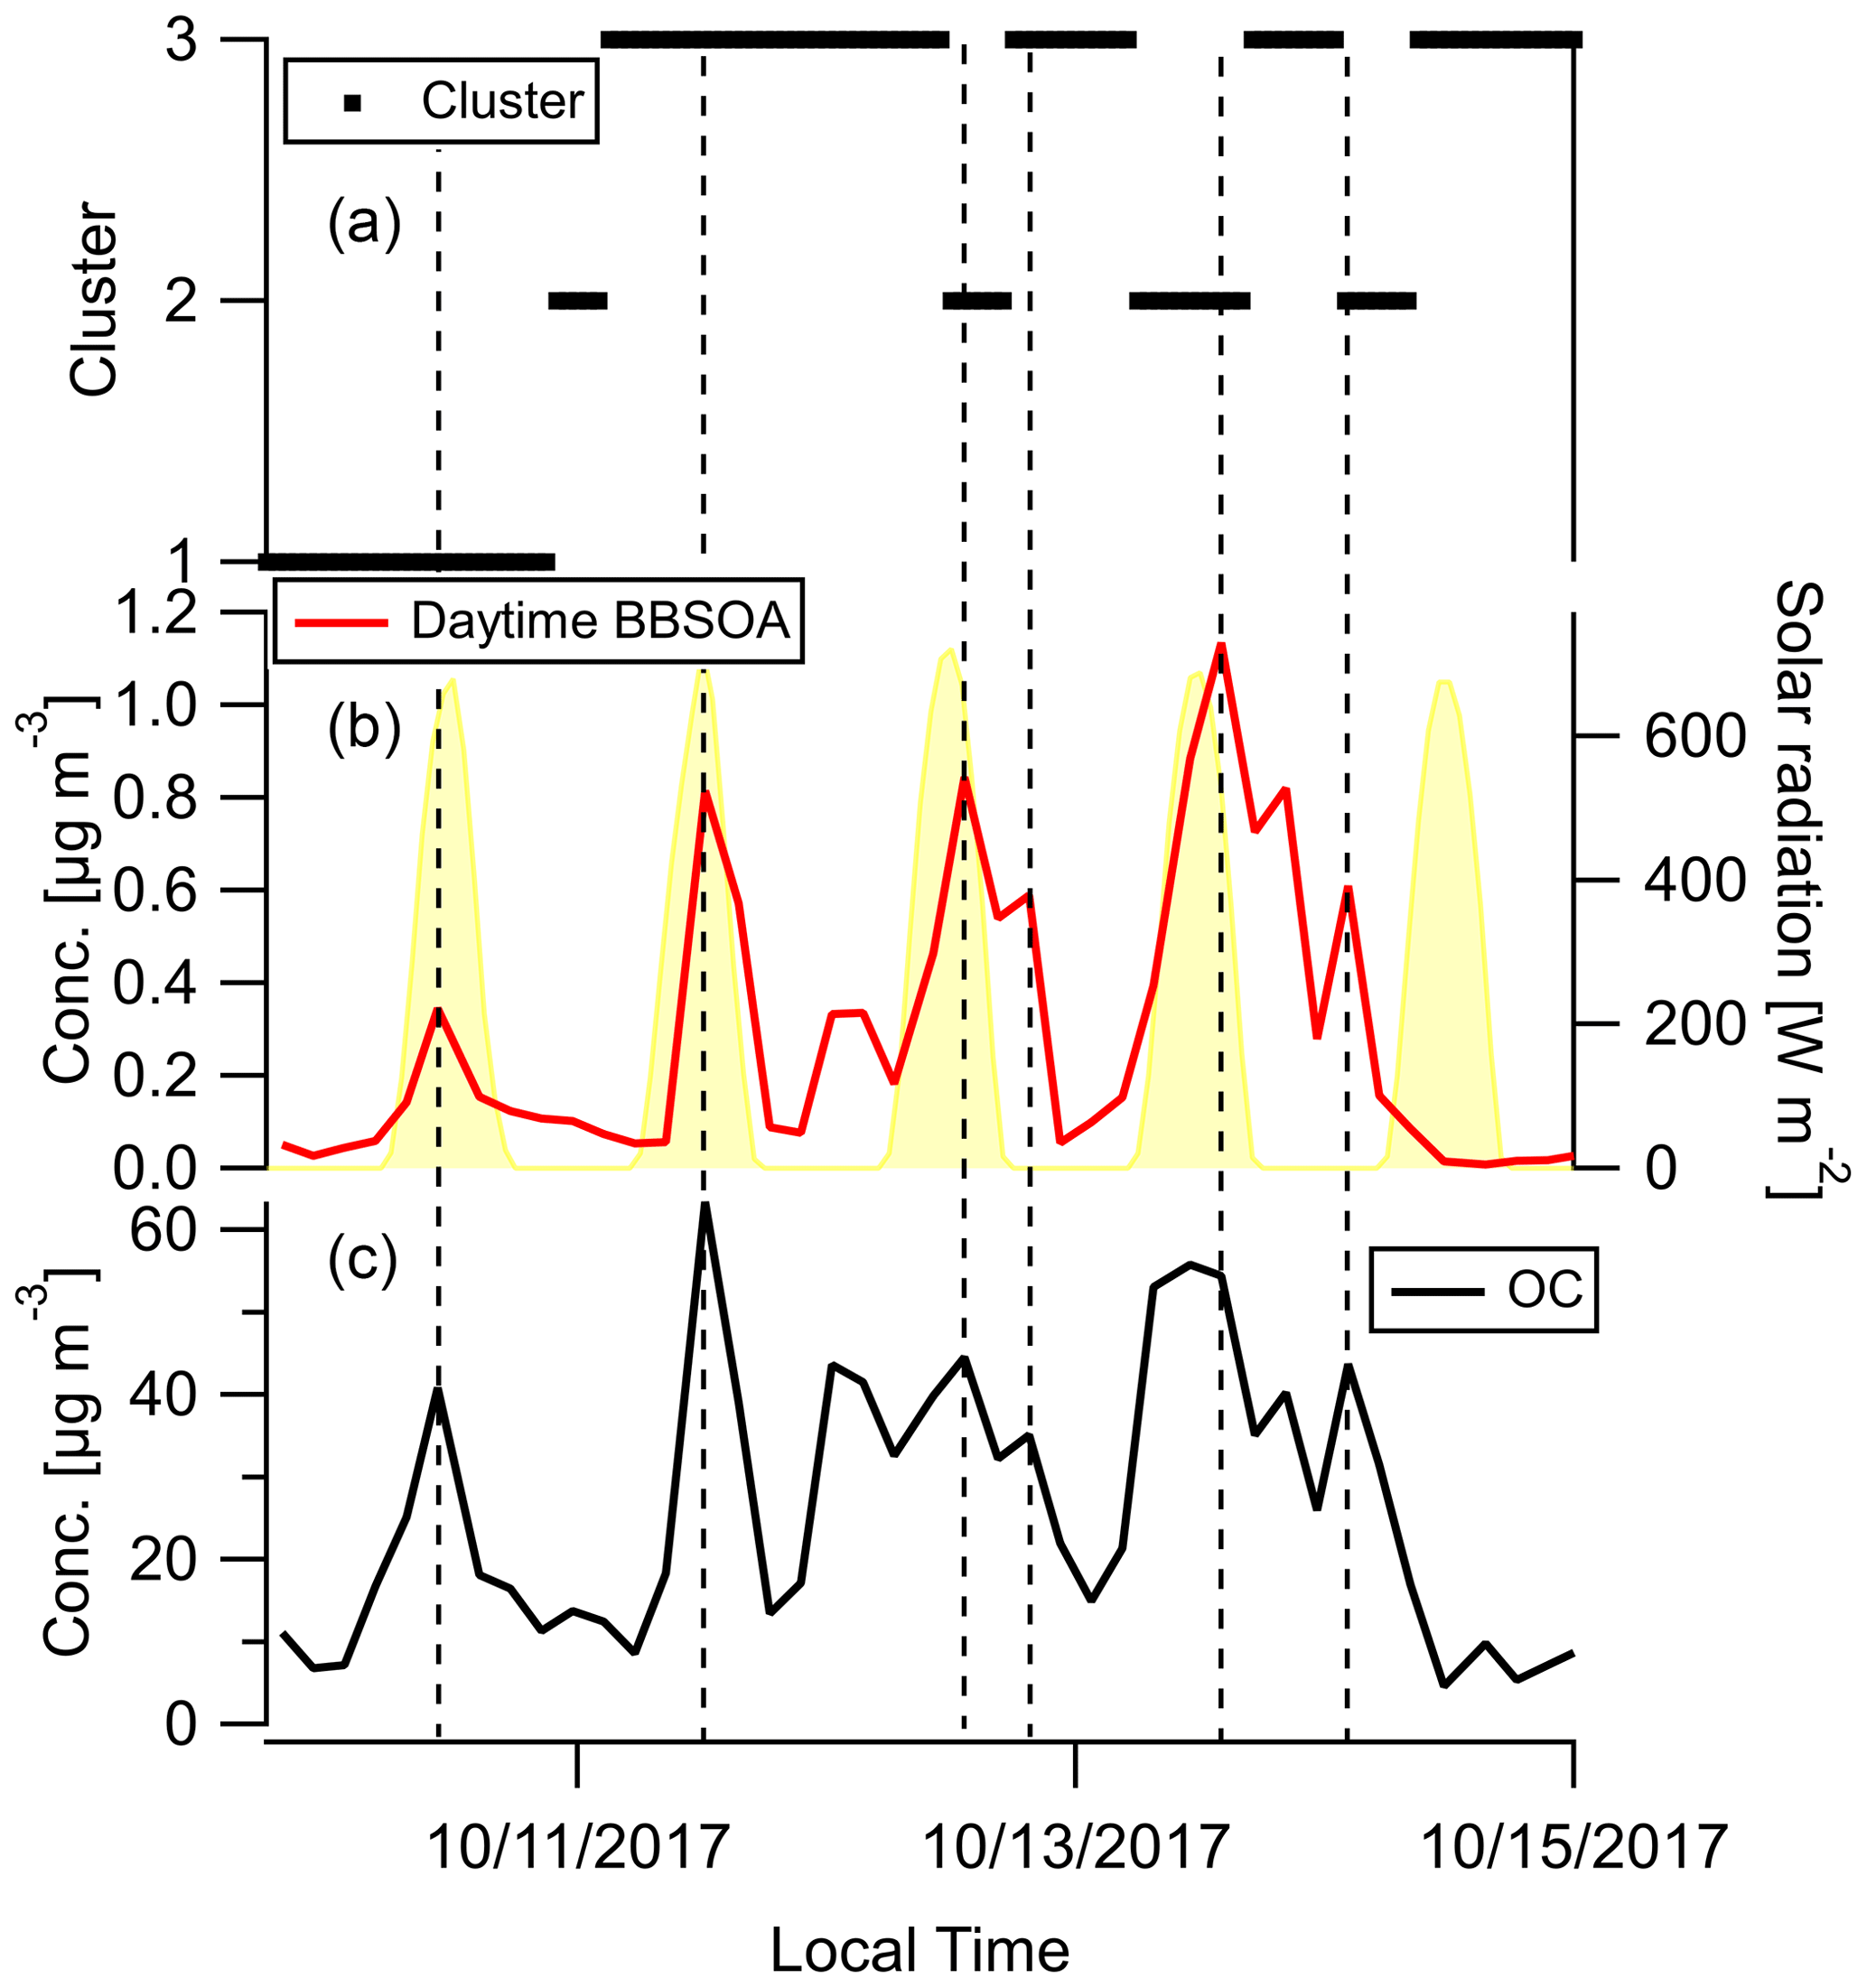
Figure 9Time series of (a) backward trajectory clusters (b), concentration of compounds in the daytime BB SOA factor, and (c) OC. Solar radiation in panel (b) was measured at Bethel Island, a measurement site in between Napa and Berkeley. The vertical reference lines mark peaks of fire plumes. Dates are indicated in mm/dd/yyyy format.
3.4 Effect of aging on the mass of fire-induced PM2.5 and OC
To investigate whether PM2.5 mass increased or decreased during transport and aging, the ΔPM2.5 / ΔCO ratio at multiple BAAQMD sites affected by the 11 October, the night of 11 October to the early morning of 12 October, and 17 October plumes are compared in Fig. 10. The Napa measurement station is around 5 and 10 km from the perimeters of the Atlas Fire and the Nuns Fire, respectively. Therefore, the plumes captured at the Napa station already had ages of at least 10–20 min and likely longer. In this period, rapid chemistry and SOA formation might have taken place. The Vallejo measurement station is 24 km from the Napa station. Measurement stations in Berkeley, San Francisco, and Oakland are 50–70 km away from the Napa station. The farthest measurement stations in San Jose are more than 110 km away from the Napa station. The levels of PM2.5 at the sites considered here reached their peaks 0–5 h after the Napa site. The ΔPM2.5 / ΔCO ratios in each fire plume intercepted at different sites have a narrow distribution, especially in the 11 October noontime plume. PM2.5 were diluted by a factor of 2–3 in 2 h. In this process, the evaporation induced by dilution must have approximately balanced SOA formation. Minimal increases of particle OC mass in aging were observed at the UCB campus as well. Acetonitrile is a stable compound that is commonly used as a biomass burning tracer (Gilman et al., 2015; Holzinger et al., 2005). Figure 11 shows that particle OC is linearly correlated with acetonitrile. The relationship was not affected by the fraction of the BB SOA factor in total quantified OA or day–night difference. The strong correlation and other indicators suggest that although substantial chemical transformation happened, there must have been near balance between evaporation and secondary OC formation in terms of the particle OC budget. The evaporation (and oxidative fragmentation) of primary BBOA could reduce the net increase of PM2.5 and OC mass. Also, since many BB SOA compounds are also semi-volatile, their evaporation and further oxidation could also reduce the net increase of particle mass. Since aged BBOA has slightly a higher ratio, it can be inferred that aging still resulted in a small increase of BBOA mass in aging. However, this increase was much smaller than the results reported by Vakkari et al. (2018), in which PM1 mass more than doubled in only 3 h of daytime aging.
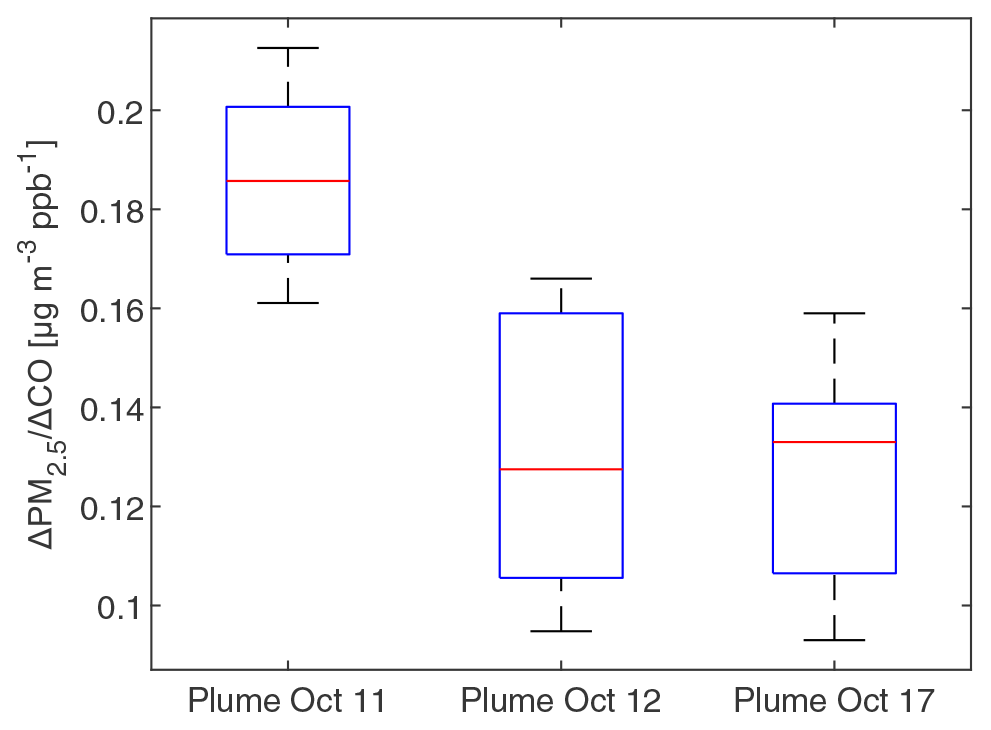
Figure 10Boxplot of the Δ PM2.5 / ΔCO ratios in at BAAQMD sites in the three plumes described in Fig. 2. ΔPM2.5 / ΔCO ratios were obtained by linearly fit PM2.5 versus CO during plumes (using R2=0.9 as the threshold). The top and bottom edges of the box indicate the 75th and 25th percentiles, respectively. The central red mark is the median. Whiskers extend out of the boxes to 1.5 times the interquartile ranges. There was no outlier in the data.
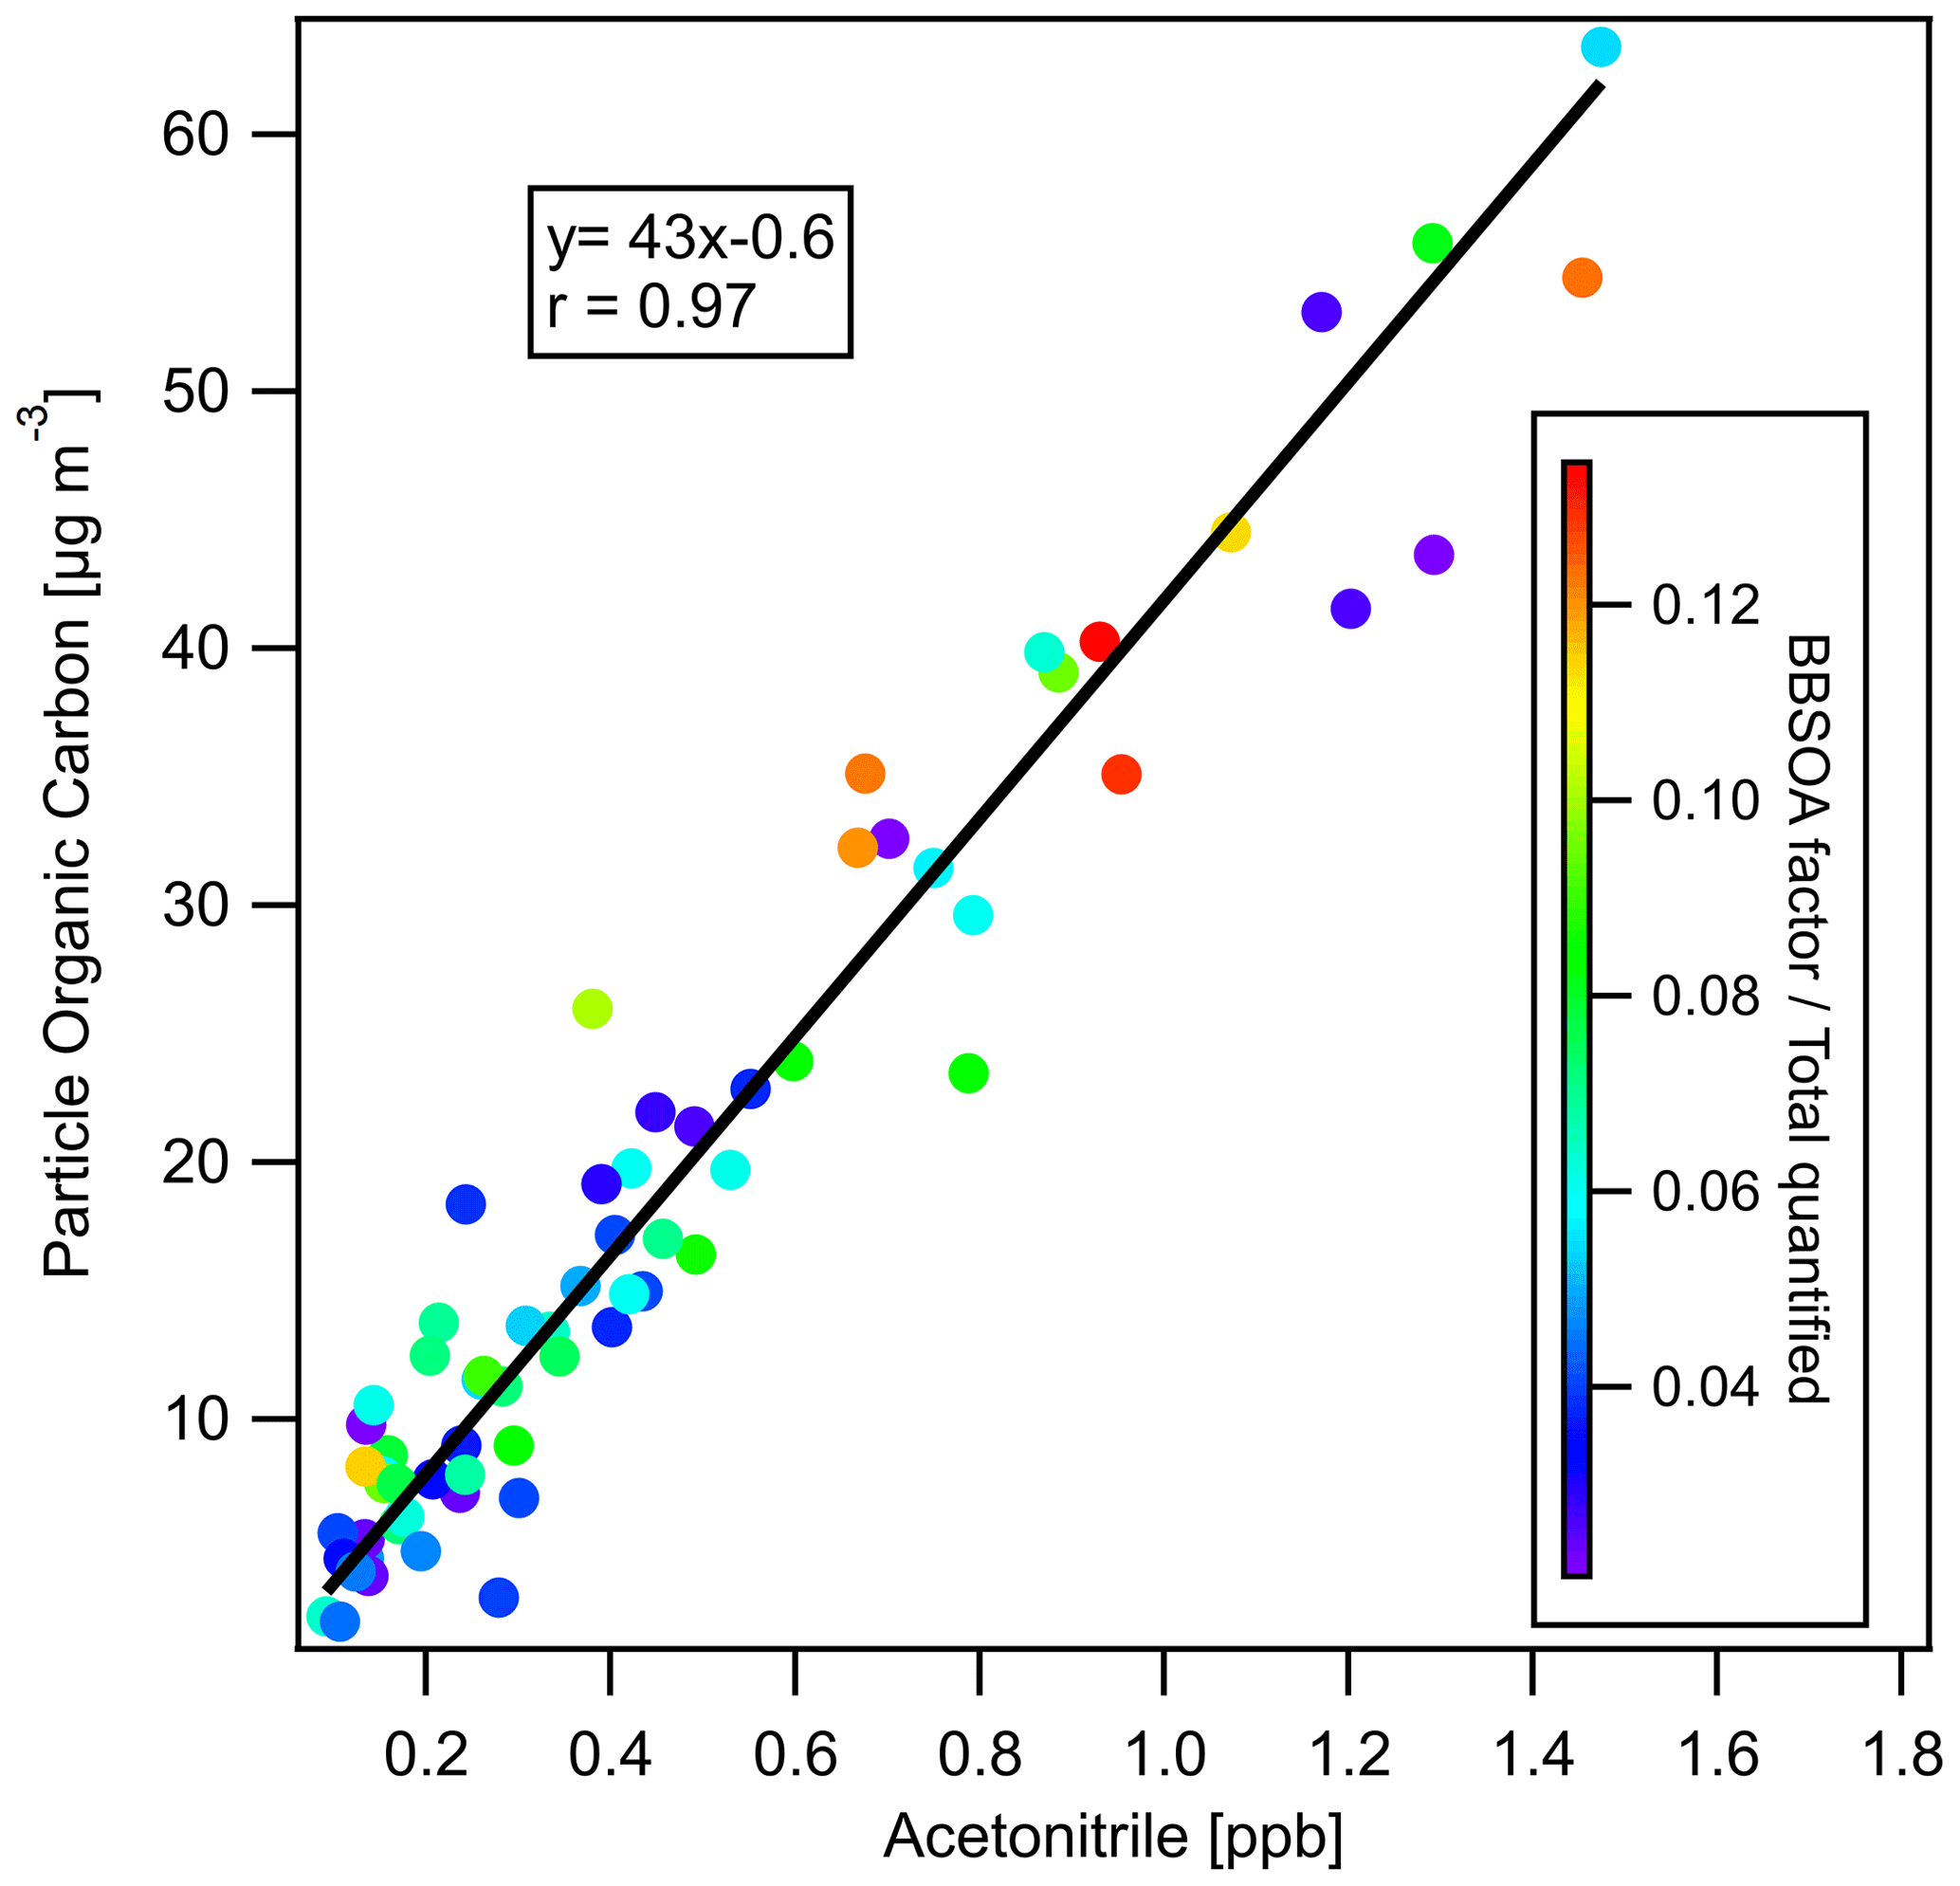
Figure 11Particle-phase OC versus acetonitrile (measured by PTR-ToF-MS), colored by the ratio of BB SOA factor to total GC×GC speciated and quantified OA. The linear regression line (using orthogonal distance regression) is also displayed.
The chemical composition of organic aerosol during the October 2017 Northern California wildfires was characterized in detail, tracking nearly 600 chemicals at 3–4 h time resolution. We demonstrated that using easily obtained parameters from GC×GC measurements, the volatility and of compounds can be predicted. The OA consisted of compounds spanning 10 orders of magnitude in volatility. The BBOA had high and possibly a high chance of fragmentation. We found that the time series of primary BBOA tracers at the receptor site can be used to trace back the fuels burned, and the timelines of BB SOA markers can indicate the transformation processes. Through hierarchical clustering analysis, we traced back the sources of the OA measured at Berkeley and discovered a unique daytime BB SOA factor. Compounds in that factor are highly oxygenated but are still semi-volatile. Using PM2.5 and CO measured by the BAAQMD network, we found the growth of particle mass during aging was small. Similar analysis could be used to study other fires. Relatively fresh and aged samples had similar OC acetonitrile ratio, which indicates the evaporation of particle organic compounds and the condensation of gas phase organic compounds were balanced in terms of carbon.
The thermal desorption GC×GC measurements remarkably improved our ability to separate and quantify the chemicals to which residents in the San Francisco Bay Area were exposed. We hope the resulting database can contribute to more accurate exposure assessments from wildfire smoke in general. Also, with better speciation of compounds in wildfires, more targeted toxicological studies could be carried out to elucidate the health impacts of BBOA.
The concentration timelines and other information of each compound will be deposited on https://nature.berkeley.edu/ahg/data/NoCalFire2017/ (Liang, 2020). The data used in this research are also available from the authors upon request.
The supplement related to this article is available online at: https://doi.org/10.5194/acp-21-5719-2021-supplement.
YL, CNJ, and PKM carried out measurements at UC Berkeley. YL, CNJ, and RJW performed experiments at the Advanced Light Source. YL, CNJ, RJW, and AHG analyzed data. YL and AHG wrote the manuscript, with all authors contributing comments.
The authors declare that they have no conflict of interest.
The authors thank BAAQMD for providing air quality and meteorological measurement data in the Ambient Air Monitoring Network. We acknowledge the use of data and imagery from LANCE FIRMS operated by NASA's Earth Science Data and Information System (ESDIS) with funding provided by NASA Headquarters. The authors thank Jeremy Nowak, Bruce Rude, and Kevin Wilson for their assistance during the beamline campaign. This research used resources of the Advanced Light Source, which is a DOE Office of Science User Facility under contract no. DE-AC02-05CH11231. The authors thank Deep Sengupta at UC Berkeley for helpful discussions.
This research has been supported by the US National Science Foundation (grant no. 1810641).
This paper was edited by Yafang Cheng and reviewed by two anonymous referees.
Abatzoglou, J. T. and Williams, A. P.: Impact of anthropogenic climate change on wildfire across western US forests, P. Natl. Acad. Sci. USA, 113, 11770–11775, https://doi.org/10.1073/pnas.1607171113, 2016.
Akagi, S. K., Yokelson, R. J., Wiedinmyer, C., Alvarado, M. J., Reid, J. S., Karl, T., Crounse, J. D., and Wennberg, P. O.: Emission factors for open and domestic biomass burning for use in atmospheric models, Atmos. Chem. Phys., 11, 4039–4072, https://doi.org/10.5194/acp-11-4039-2011, 2011.
Alam, M. S. and Harrison, R. M.: Recent advances in the application of 2-dimensional gas chromatography with soft and hard ionisation time-of-flight mass spectrometry in environmental analysis, Chem. Sci., 7, 3968–3977, https://doi.org/10.1039/c6sc00465b, 2016.
Alvarado, M. J., Lonsdale, C. R., Yokelson, R. J., Akagi, S. K., Coe, H., Craven, J. S., Fischer, E. V., McMeeking, G. R., Seinfeld, J. H., Soni, T., Taylor, J. W., Weise, D. R., and Wold, C. E.: Investigating the links between ozone and organic aerosol chemistry in a biomass burning plume from a prescribed fire in California chaparral, Atmos. Chem. Phys., 15, 6667–6688, https://doi.org/10.5194/acp-15-6667-2015, 2015.
Andreae, M. O.: Emission of trace gases and aerosols from biomass burning – an updated assessment, Atmos. Chem. Phys., 19, 8523–8546, https://doi.org/10.5194/acp-19-8523-2019, 2019.
Bertrand, A., Stefenelli, G., Jen, C. N., Pieber, S. M., Bruns, E. A., Ni, H., Temime-Roussel, B., Slowik, J. G., Goldstein, A. H., El Haddad, I., Baltensperger, U., Prévôt, A. S. H., Wortham, H., and Marchand, N.: Evolution of the chemical fingerprint of biomass burning organic aerosol during aging, Atmos. Chem. Phys., 18, 7607–7624, https://doi.org/10.5194/acp-18-7607-2018, 2018.
Bond, T. C., Streets, D. G., Yarber, K. F., Nelson, S. M., Woo, J. H., and Klimont, Z.: A technology-based global inventory of black and organic carbon emissions from combustion, J. Geophys. Res.-Atmos., 109, D14203, https://doi.org/10.1029/2003JD003697, 2004.
Cappellin, L., Karl, T., Probst, M., Ismailova, O., Winkler, P. M., Soukoulis, C., Aprea, E., Märk, T. D., Gasperi, F., and Biasioli, F.: On quantitative determination of volatile organic compound concentrations using proton transfer reaction time-of-flight mass spectrometry, Environ. Sci. Technol., 46, 2283–2290, https://doi.org/10.1021/es203985t, 2012.
Cheng, Y., Engling, G., He, K.-B., Duan, F.-K., Ma, Y.-L., Du, Z.-Y., Liu, J.-M., Zheng, M., and Weber, R. J.: Biomass burning contribution to Beijing aerosol, Atmos. Chem. Phys., 13, 7765–7781, https://doi.org/10.5194/acp-13-7765-2013, 2013.
Claeys, M., Graham, B., Vas, G., Wang, W., Vermeylen, R., Pashynska, V., Cafmeyer, J., Guyon, P., Andreae, M. O., Artaxo, P., and Maenhaut, W.: Formation of Secondary Organic Aerosols Through Photooxidation of Isoprene, Science, 303, 1173–1176, https://doi.org/10.1126/science.1092805, 2004.
Compernolle, S., Ceulemans, K., and Müller, J.-F.: EVAPORATION: a new vapour pressure estimation methodfor organic molecules including non-additivity and intramolecular interactions, Atmos. Chem. Phys., 11, 9431–9450, https://doi.org/10.5194/acp-11-9431-2011, 2011.
Dennison, P. E., Brewer, S. C., Arnold, J. D., and Moritz, M. A.: Large wildfire trends in the western United States, 1984–2011, Geophys. Res. Lett., 41, 2928–2933, https://doi.org/10.1002/2014GL059576, 2014.
Donahue, N. M., Epstein, S. A., Pandis, S. N., and Robinson, A. L.: A two-dimensional volatility basis set: 1. organic-aerosol mixing thermodynamics, Atmos. Chem. Phys., 11, 3303–3318, https://doi.org/10.5194/acp-11-3303-2011, 2011.
Donahue, N. M., Kroll, J. H., Pandis, S. N., and Robinson, A. L.: A two-dimensional volatility basis set – Part 2: Diagnostics of organic-aerosol evolution, Atmos. Chem. Phys., 12, 615–634, https://doi.org/10.5194/acp-12-615-2012, 2012.
Donahue, N. M., Chuang, W., Epstein, S. A., Kroll, J. H., Worsnop, D. R., Robinson, A. L., Adams, P. J., and Pandis, S. N.: Why do organic aerosols exist? Understanding aerosol lifetimes using the two-dimensional volatility basis set, Environ. Chem., 10, 151–157, https://doi.org/10.1071/EN13022, 2013.
Fabbri, D., Chiavari, G., Prati, S., Vassura, I., and Vangelista, M.: Gas chromatography/mass spectrometric characterisation of pyrolysis/silylation products of glucose and cellulose, Rapid Commun. Mass Sp., 16, 2349–2355, https://doi.org/10.1002/rcm.856, 2002.
Fine, P. M., Cass, G. R., and Simoneit, B. R. T.: Chemical characterization of fine particle emissions from the wood stove combustion of prevalent united states tree species, Environ. Eng. Sci., 21, 705–721, https://doi.org/10.1089/ees.2004.21.705, 2004.
Finewax, Z., De Gouw, J. A., and Ziemann, P. J.: Identification and Quantification of 4-Nitrocatechol Formed from OH and NO3 Radical-Initiated Reactions of Catechol in Air in the Presence of NOx: Implications for Secondary Organic Aerosol Formation from Biomass Burning, Environ. Sci. Technol., 52, 1981–1989, https://doi.org/10.1021/acs.est.7b05864, 2018.
Fortenberry, C. F., Walker, M. J., Zhang, Y., Mitroo, D., Brune, W. H., and Williams, B. J.: Bulk and molecular-level characterization of laboratory-aged biomass burning organic aerosol from oak leaf and heartwood fuels, Atmos. Chem. Phys., 18, 2199–2224, https://doi.org/10.5194/acp-18-2199-2018, 2018.
Gilman, J. B., Lerner, B. M., Kuster, W. C., Goldan, P. D., Warneke, C., Veres, P. R., Roberts, J. M., de Gouw, J. A., Burling, I. R., and Yokelson, R. J.: Biomass burning emissions and potential air quality impacts of volatile organic compounds and other trace gases from fuels common in the US, Atmos. Chem. Phys., 15, 13915–13938, https://doi.org/10.5194/acp-15-13915-2015, 2015.
Grieshop, A. P., Miracolo, M. A., Donahue, N. M., and Robinson, A. L.: Constraining the Volatility Distribution and Gas-Particle Partitioning of Combustion Aerosols Using Isothermal Dilution and Thermodenuder Measurements, Environ. Sci. Technol., 43, 4750–4756, https://doi.org/10.1021/es8032378, 2009a.
Grieshop, A. P., Logue, J. M., Donahue, N. M., and Robinson, A. L.: Laboratory investigation of photochemical oxidation of organic aerosol from wood fires 1: measurement and simulation of organic aerosol evolution, Atmos. Chem. Phys., 9, 1263–1277, https://doi.org/10.5194/acp-9-1263-2009, 2009b.
Grieshop, A. P., Donahue, N. M., and Robinson, A. L.: Laboratory investigation of photochemical oxidation of organic aerosol from wood fires 2: analysis of aerosol mass spectrometer data, Atmos. Chem. Phys., 9, 2227–2240, https://doi.org/10.5194/acp-9-2227-2009, 2009c.
Hartikainen, A., Tiitta, P., Ihalainen, M., Yli-Pirilä, P., Orasche, J., Czech, H., Kortelainen, M., Lamberg, H., Suhonen, H., Koponen, H., Hao, L., Zimmermann, R., Jokiniemi, J., Tissari, J., and Sippula, O.: Photochemical transformation of residential wood combustion emissions: dependence of organic aerosol composition on OH exposure, Atmos. Chem. Phys., 20, 6357–6378, https://doi.org/10.5194/acp-20-6357-2020, 2020.
Hatch, L. E., Rivas-Ubach, A., Jen, C. N., Lipton, M., Goldstein, A. H., and Barsanti, K. C.: Measurements of I/SVOCs in biomass-burning smoke using solid-phase extraction disks and two-dimensional gas chromatography, Atmos. Chem. Phys., 18, 17801–17817, https://doi.org/10.5194/acp-18-17801-2018, 2018.
Hatch, L. E., Jen, C. N., Kreisberg, N. M., Selimovic, V., Yokelson, R. J., Stamatis, C., York, R. A., Foster, D., Stephens, S. L., Goldstein, A. H., and Barsanti, K. C.: Highly Speciated Measurements of Terpenoids Emitted from Laboratory and Mixed-Conifer Forest Prescribed Fires, Environ. Sci. Technol., 53, 9418–9428, https://doi.org/10.1021/acs.est.9b02612, 2019.
Hays, M. D., Geron, C. D., Linna, K. J., Smith, N. D., and Schauer, J. J.: Speciation of gas-phase and fine particle emissions from burning of foliar fuels, Environ. Sci. Technol., 36, 2281–2295, https://doi.org/10.1021/es0111683, 2002.
Hays, M. D., Smith, N. D., and Dong, Y.: Nature of unresolved complex mixture in size-distributed emissions from residential wood combustion as measured by thermal desorption-gas chromatography-mass spectrometry, J. Geophys. Res.-Atmos., 109, D16S04, https://doi.org/10.1029/2003JD004051, 2004.
Hodshire, A. L., Akherati, A., Alvarado, M. J., Brown-Steiner, B., Jathar, S. H., Jimenez, J. L., Kreidenweis, S. M., Lonsdale, C. R., Onasch, T. B., Ortega, A. M., and Pierce, J. R.: Aging Effects on Biomass Burning Aerosol Mass and Composition: A Critical Review of Field and Laboratory Studies, Environ. Sci. Technol., 53, 10007–10022, https://doi.org/10.1021/acs.est.9b02588, 2019a.
Hodshire, A. L., Bian, Q., Ramnarine, E., Lonsdale, C. R., Alvarado, M. J., Kreidenweis, S. M., Jathar, S. H., and Pierce, J. R.: More Than Emissions and Chemistry: Fire Size, Dilution, and Background Aerosol Also Greatly Influence Near-Field Biomass Burning Aerosol Aging, J. Geophys. Res.-Atmos., 124, 5589–5611, https://doi.org/10.1029/2018JD029674, 2019b.
Holzinger, R., Williams, J., Salisbury, G., Klüpfel, T., de Reus, M., Traub, M., Crutzen, P. J., and Lelieveld, J.: Oxygenated compounds in aged biomass burning plumes over the Eastern Mediterranean: evidence for strong secondary production of methanol and acetone, Atmos. Chem. Phys., 5, 39–46, https://doi.org/10.5194/acp-5-39-2005, 2005.
Iinuma, Y., Böge, O., and Herrmann, H.: Methyl-nitrocatechols: Atmospheric tracer compounds for biomass burning secondary organic aerosols, Environ. Sci. Technol., 44, 8453–8459, https://doi.org/10.1021/es102938a, 2010.
Isaacman, G., Worton, D. R., Kreisberg, N. M., Hennigan, C. J., Teng, A. P., Hering, S. V., Robinson, A. L., Donahue, N. M., and Goldstein, A. H.: Understanding evolution of product composition and volatility distribution through in-situ GC × GC analysis: a case study of longifolene ozonolysis, Atmos. Chem. Phys., 11, 5335–5346, https://doi.org/10.5194/acp-11-5335-2011, 2011.
Isaacman, G., Wilson, K. R., Chan, A. W. H., Worton, D. R., Kimmel, J. R., Nah, T., Hohaus, T., Gonin, M., Kroll, J. H., Worsnop, D. R., and Goldstein, A. H.: Improved resolution of hydrocarbon structures and constitutional isomers in complex mixtures using gas chromatography-vacuum ultraviolet-mass spectrometry, Anal. Chem., 84, 2335–2342, https://doi.org/10.1021/ac2030464, 2012.
Jaoui, M., Lewandowski, M., Docherty, K., Offenberg, J. H., and Kleindienst, T. E.: Atmospheric oxidation of 1,3-butadiene: characterization of gas and aerosol reaction products and implications for PM2.5, Atmos. Chem. Phys., 14, 13681–13704, https://doi.org/10.5194/acp-14-13681-2014, 2014.
Jen, C. N., Liang, Y., Hatch, L. E., Kreisberg, N. M., Stamatis, C., Kristensen, K., Battles, J. J., Stephens, S. L., York, R. A., Barsanti, K. C., and Goldstein, A. H.: High Hydroquinone Emissions from Burning Manzanita, Environ. Sci. Tech. Let., 5, 309–314, https://doi.org/10.1021/acs.estlett.8b00222, 2018.
Jen, C. N., Hatch, L. E., Selimovic, V., Yokelson, R. J., Weber, R., Fernandez, A. E., Kreisberg, N. M., Barsanti, K. C., and Goldstein, A. H.: Speciated and total emission factors of particulate organics from burning western US wildland fuels and their dependence on combustion efficiency, Atmos. Chem. Phys., 19, 1013–1026, https://doi.org/10.5194/acp-19-1013-2019, 2019.
Jenkin, M. E., Shallcross, D. E., and Harvey, J. N.: Development and application of a possible mechanism for the generation of cis-pinic acid from the ozonolysis of α- and β-pinene, Atmos. Environ., 34, 2837–2850, https://doi.org/10.1016/S1352-2310(00)00087-X, 2000.
Jones, C. G., Rappold, A. G., Vargo, J., Cascio, W. E., Kharrazi, M., McNally, B., and Hoshiko, S.: Out-of-Hospital Cardiac Arrests and Wildfire-Related Particulate Matter During 2015–2017 California Wildfires, J. Am. Heart Assoc., 9, e014125, https://doi.org/10.1161/JAHA.119.014125, 2020.
Kawamura, K. and Ikushima, K.: Seasonal Changes in the Distribution of Dicarboxylic Acids in the Urban Atmosphere, Environ. Sci. Technol., 27, 2227–2235, https://doi.org/10.1021/es00047a033, 1993.
Kawamura, K., Seméré, R., Imai, Y., Fujii, Y., and Hayashi, M.: Water soluble dicarboxylic acids and related compounds in Antarctic aerosols, J. Geophys. Res.-Atmos., 101, 18721–18728, https://doi.org/10.1029/96jd01541, 1996.
Kim, Y. H., Warren, S. H., Krantz, Q. T., King, C., Jaskot, R., Preston, W. T., George, B. J., Hays, M. D., Landis, M. S., Higuchi, M., Demarini, D. M., and Gilmour, M. I.: Mutagenicity and lung toxicity of smoldering vs. Flaming emissions from various biomass fuels: Implications for health effects from wildland fires, Environ. Health Persp., 126, 017011, https://doi.org/10.1289/EHP2200, 2018.
Koss, A. R., Canagaratna, M. R., Zaytsev, A., Krechmer, J. E., Breitenlechner, M., Nihill, K. J., Lim, C. Y., Rowe, J. C., Roscioli, J. R., Keutsch, F. N., and Kroll, J. H.: Dimensionality-reduction techniques for complex mass spectrometric datasets: application to laboratory atmospheric organic oxidation experiments, Atmos. Chem. Phys., 20, 1021–1041, https://doi.org/10.5194/acp-20-1021-2020, 2020.
Kroll, J. H., Donahue, N. M., Jimenez, J. L., Kessler, S. H., Canagaratna, M. R., Wilson, K. R., Altieri, K. E., Mazzoleni, L. R., Wozniak, A. S., Bluhm, H., Mysak, E. R., Smith, J. D., Kolb, C. E., and Worsnop, D. R.: Carbon oxidation state as a metric for describing the chemistry of atmospheric organic aerosol, Nat. Chem., 3, 133–139, https://doi.org/10.1038/nchem.948, 2011.
Laskin, J., Laskin, A., and Nizkorodov, S. A.: Mass Spectrometry Analysis in Atmospheric Chemistry, Anal. Chem., 90, 166–189, https://doi.org/10.1021/acs.analchem.7b04249, 2018.
Leanderson, P. and Tagesson, C.: Cigarette smoke-induced DNA-damage: Role of hydroquinone and catechol in the formation of the oxidative DNA-adduct, 8-hydroxydeoxyguanosine, Chem.-Biol. Interact., 75, 71–81, https://doi.org/10.1016/0009-2797(90)90023-G, 1990.
Liang, Y.: Napa Sonoma Fire Data Supplement, available at: https://nature.berkeley.edu/ahg/data/NoCalFire2017/ (last access: 12 April 2021), 2020.
Liu, C., Zhang, P., Wang, Y., Yang, B., and Shu, J.: Heterogeneous reactions of particulate methoxyphenols with NO3 radicals: Kinetics, products, and mechanisms, Environ. Sci. Technol., 46, 13262–13269, https://doi.org/10.1021/es303889z, 2012.
Liu, Y., Misztal, P. K., Xiong, J., Tian, Y., Arata, C., Weber, R. J., Nazaroff, W. W., and Goldstein, A. H.: Characterizing sources and emissions of volatile organic compounds in a northern California residence using space- and time-resolved measurements, Indoor Air, 29, 630–644, https://doi.org/10.1111/ina.12562, 2019.
Liu, Z. and Phillips, J. B.: Comprehensive two-dimensional gas chromatography using an on-column thermal modulator interface, J. Chromatogr. Sci., 29, 227–231, https://doi.org/10.1093/chromsci/29.6.227, 1991.
Loewus, F. A. and Murthy, P. P. N.: myo-Inositol metabolism in plants, Plant Sci., 150, 1–19, 2000.
May, A. A., Levin, E. J. T., Hennigan, C. J., Riipinen, I., Lee, T., Collett, J. L., Jimenez, J. L., Kreidenweis, S. M., and Robinson, A. L.: Gas-particle partitioning of primary organic aerosol emissions: 3. Biomass burning, J. Geophys. Res.-Atmos., 118, 11327–11338, https://doi.org/10.1002/jgrd.50828, 2013.
McClure, C. D. and Jaffe, D. A.: US particulate matter air quality improves except in wildfire-prone areas, P. Natl. Acad. Sci. USA, 115, 7901–7906, https://doi.org/10.1073/pnas.1804353115, 2018.
Medeiros, P. M. and Simoneit, B. R. T.: Source profiles of organic compounds emitted upon combustion of green vegetation from temperate climate forests, Environ. Sci. Technol., 42, 8310–8316, https://doi.org/10.1021/es801533b, 2008.
Munchak, L. A., Schichtel, B. A., Sullivan, A. P., Holden, A. S., Kreidenweis, S. M., Malm, W. C., and Collett, J. L.: Development of wildland fire particulate smoke marker to organic carbon emission ratios for the conterminous United States, Atmos. Environ., 45, 395–403, https://doi.org/10.1016/j.atmosenv.2010.10.006, 2011.
Muthumalage, T., Prinz, M., Ansah, K. O., Gerloff, J., Sundar, I. K., and Rahman, I.: Inflammatory and oxidative responses induced by exposure to commonly used e-cigarette flavoring chemicals and flavored e-liquids without nicotine, Front. Physiol., 8, 1130, https://doi.org/10.3389/fphys.2017.01130, 2018.
Net, S., Alvarez, E. G., Balzer, N., Wortham, H., Zetzsch, C., and Gligorovski, S.: Photolysis and heterogeneous reaction of coniferyl aldehyde adsorbed on silica particles with ozone, ChemPhysChem, 11, 4019–4027, https://doi.org/10.1002/cphc.201000446, 2010.
Net, S., Alvarez, E. G., Gligorovski, S., and Wortham, H.: Heterogeneous reactions of ozone with methoxyphenols, in presence and absence of light, Atmos. Environ., 45, 3007–3014, https://doi.org/10.1016/j.atmosenv.2011.03.026, 2011.
Nolte, C. G., Schauer, J. J., Cass, G. R., and Simoneit, B. R. T.: Highly polar organic compounds present in wood smoke and in the ambient atmosphere, Environ. Sci. Technol., 35, 1912–1919, https://doi.org/10.1021/es001420r, 2001.
Oros, D. R., bin Abas, M. R., Omar, N. Y. M. J., Rahman, N. A., and Simoneit, B. R. T.: Identification and emission factors of molecular tracers in organic aerosols from biomass burning: Part 3: Grasses, Appl. Geochem., 21, 919–940, https://doi.org/10.1016/j.apgeochem.2006.01.008, 2006.
Pagonis, D., Sekimoto, K., and de Gouw, J.: A Library of Proton-Transfer Reactions of H3O+ Ions Used for Trace Gas Detection, J. Am. Soc. Mass Spectr., 30, 1330–1335, https://doi.org/10.1007/s13361-019-02209-3, 2019.
Palm, B. B., Peng, Q., Fredrickson, C. D., Lee, B. H., Garofalo, L. A., Pothier, M. A., Kreidenweis, S. M., Farmer, D. K., Pokhrel, R. P., Shen, Y., Murphy, S. M., Permar, W., Hu, L., Campos, T. L., Hall, S. R., Ullmann, K., Zhang, X., Flocke, F., Fischer, E. V., and Thornton, J. A.: Quantification of organic aerosol and brown carbon evolution in fresh wildfire plumes, P. Natl. Acad. Sci. USA, 117, 29469–29477, https://doi.org/10.1073/pnas.2012218117, 2020.
Pankow, J. F.: An absorption model of gas/particle partitioning of organic compounds in the atmosphere, Atmos. Environ., 28, 185–188, https://doi.org/10.1016/1352-2310(94)90093-0, 1994.
Purohit, V. and Basu, A. K.: Mutagenicity of nitroaromatic compounds, Chem. Res. Toxicol., 13, 673–692, https://doi.org/10.1021/tx000002x, 2000.
Ramdahl, T.: Retene – a molecular marker of wood combustion in ambient air, Nature, 306, 580–582, https://doi.org/10.1038/306580a0, 1983.
Reid, C. E., Brauer, M., Johnston, F. H., Jerrett, M., Balmes, J. R., and Elliott, C. T.: Critical review of health impacts of wildfire smoke exposure, Environ. Health Persp., 124, 1334–1343, https://doi.org/10.1289/ehp.1409277, 2016.
Santos, G. T. A. D., Santos, P. S. M., and Duarte, A. C.: Vanillic and syringic acids from biomass burning: Behaviour during Fenton-like oxidation in atmospheric aqueous phase and in the absence of light, J. Hazard. Mater., 313, 201–208, https://doi.org/10.1016/j.jhazmat.2016.04.006, 2016a.
Santos, P. S. M., Domingues, M. R. M., and Duarte, A. C.: Fenton-like oxidation of small aromatic acids from biomass burning in atmospheric water and in the absence of light: Identification of intermediates and reaction pathways, Chemosphere, 154, 599–603, https://doi.org/10.1016/j.chemosphere.2016.04.015, 2016b.
Schmidl, C., Bauer, H., Dattler, A., Hitzenberger, R., Weissenboeck, G., Marr, I. L., and Puxbaum, H.: Chemical characterisation of particle emissions from burning leaves, Atmos. Environ., 42, 9070–9079, https://doi.org/10.1016/j.atmosenv.2008.09.010, 2008.
Schroeder, W., Oliva, P., Giglio, L., and Csiszar, I. A.: The New VIIRS 375 m active fire detection data product: Algorithm description and initial assessment, Remote Sens. Environ., 143, 85–96, https://doi.org/10.1016/j.rse.2013.12.008, 2014.
Sengupta, D., Samburova, V., Bhattarai, C., Watts, A. C., Moosmüller, H., and Khlystov, A. Y.: Polar semivolatile organic compounds in biomass-burning emissions and their chemical transformations during aging in an oxidation flow reactor, Atmos. Chem. Phys., 20, 8227–8250, https://doi.org/10.5194/acp-20-8227-2020, 2020.
Shen, G., Tao, S., Wei, S., Chen, Y., Zhang, Y., Shen, H., Huang, Y., Zhu, D., Yuan, C., Wang, H., Wang, Y., Pei, L., Liao, Y., Duan, Y., Wang, B., Wang, R., Lv, Y., Li, W., Wang, X., and Zheng, X.: Field measurement of emission factors of PM, EC, OC, parent, nitro-, and oxy- polycyclic aromatic hydrocarbons for residential briquette, coal cake, and wood in rural Shanxi, China, Environ. Sci. Technol., 47, 2998–3005, https://doi.org/10.1021/es304599g, 2013.
Sigsgaard, T., Forsberg, B., Annesi-Maesano, I., Blomberg, A., Bølling, A., Boman, C., Bønløkke, J., Brauer, M., Bruce, N., Héroux, M. E., Hirvonen, M. R., Kelly, F., Künzli, N., Lundbäck, B., Moshammer, H., Noonan, C., Pagels, J., Sallsten, G., Sculier, J. P., and Brunekreef, B.: Health impacts of anthropogenic biomass burning in the developed world, Eur. Respir. J., 46, 1577–1588, https://doi.org/10.1183/13993003.01865-2014, 2015.
Simoneit, B. R. T.: Biomass burning – A review of organic tracers for smoke from incomplete combustion, Appl. Geochem., 17, 129–162, https://doi.org/10.1016/S0883-2927(01)00061-0, 2002.
Simoneit, B. R. T., Rogge, W. F., Mazurek, M. A., Standley, L. J., Hildemann, L. M., and Cass, G. R.: Lignin Pyrolysis Products, Lignans, and Resin Acids as Specific Tracers of Plant Classes in Emissions from Biomass Combustion, Environ. Sci. Technol., 27, 2533–2541, https://doi.org/10.1021/es00048a034, 1993.
Standley, L. J. and Simoneit, B. R. T.: Resin diterpenoids as tracers for biomass combustion aerosols, J. Atmos. Chem., 18, 1–15, https://doi.org/10.1007/BF00694371, 1994.
Stein, A. F., Draxler, R. R., Rolph, G. D., Stunder, B. J. B., Cohen, M. D., and Ngan, F.: Noaa's hysplit atmospheric transport and dispersion modeling system, B. Am. Meteorol. Soc., 96, 2059–2077, https://doi.org/10.1175/BAMS-D-14-00110.1, 2015.
Sun, J., Shen, Z., Zeng, Y., Niu, X., Wang, J., Cao, J., Gong, X., Xu, H., Wang, T., Liu, H., and Yang, L.: Characterization and cytotoxicity of PAHs in PM2.5 emitted from residential solid fuel burning in the Guanzhong Plain, China, Environ. Pollut., 241, 359–368, https://doi.org/10.1016/j.envpol.2018.05.076, 2018.
Szmigielski, R., Surratt, J. D., Gómez-González, Y., van der Veken, P., Kourtchev, I., Vermeylen, R., Blockhuys, F., Jaoui, M., Kleindienst, T. E., Lewandowski, M., Offenberg, J. H., Edney, E. O., Seinfeld, J. H., Maenhaut, W., and Claeys, M.: 3-methyl-1,2,3-butanetricarboxylic acid: An atmospheric tracer for terpene secondary organic aerosol, Geophys. Res. Lett., 34, L24811, https://doi.org/10.1029/2007GL031338, 2007.
Tang, X., Misztal, P. K., Nazaroff, W. W., and Goldstein, A. H.: Volatile organic compound emissions from humans indoors, Environ. Sci. Technol., 50, 12686–12694, https://doi.org/10.1021/acs.est.6b04415, 2016.
Thorne, J. H., Kennedy, J. A., Quinn, J. F., McCoy, M., Keeler-Wolf, T., and Menke, J.: A Vegetation Map of Napa County Using the Manual of California Vegetation Classification and Its Comparison to Other Digital Vegetation Maps, Madroño, 51, 343–363, 2004.
Traversi, D., Degan, R., De Marco, R., Gilli, G., Pignata, C., Villani, S., and Bono, R.: Mutagenic properties of PM2.5 urban pollution in the Northern Italy: The nitro-compounds contribution, Environ. Int., 35, 905–910, https://doi.org/10.1016/j.envint.2009.03.010, 2009.
Tuet, W. Y., Liu, F., De Oliveira Alves, N., Fok, S., Artaxo, P., Vasconcellos, P., Champion, J. A., and Ng, N. L.: Chemical Oxidative Potential and Cellular Oxidative Stress from Open Biomass Burning Aerosol, Environ. Sci. Tech. Let., 6, 126–132, https://doi.org/10.1021/acs.estlett.9b00060, 2019.
US EPA: Estimation Programs Interface Suite™ for Microsoft®Windows, United States Environ. Prot. Agency, Washington D.C., USA, 2012.
Vakkari, V., Beukes, J. P., Dal Maso, M., Aurela, M., Josipovic, M., and van Zyl, P. G.: Major secondary aerosol formation in southern African open biomass burning plumes, Nat. Geosci., 11, 580–583, https://doi.org/10.1038/s41561-018-0170-0, 2018.
Verma, V., Fang, T., Xu, L., Peltier, R. E., Russell, A. G., Ng, N. L., and Weber, R. J.: Organic aerosols associated with the generation of reactive oxygen species (ROS) by water-soluble PM2.5, Environ. Sci. Technol., 49, 4646–4656, https://doi.org/10.1021/es505577w, 2015.
Vidović, K., Lašič Jurković, D., Šala, M., Kroflič, A., and Grgić, I.: Nighttime Aqueous-Phase Formation of Nitrocatechols in the Atmospheric Condensed Phase, Environ. Sci. Technol., 52, 9722–9730, https://doi.org/10.1021/acs.est.8b01161, 2018.
Wang, L., Atkinson, R., and Arey, J.: Dicarbonyl products of the OH radical-initiated reactions of naphthalene and the C1- and C2-alkylnaphthalenes, Environ. Sci. Technol., 41, 2803–2810, https://doi.org/10.1021/es0628102, 2007.
Ward, J. H.: Hierarchical Grouping to Optimize an Objective Function, J. Am. Stat. Assoc., 58, 236–244, https://doi.org/10.1080/01621459.1963.10500845, 1963.
Watson, J. G., Chow, J. C., Chen, L. W. A., Engling, G., and Wang, X. L.: Source Apportionment: Principles and Methods, in Airborne Particulate Matter: Sources, Atmospheric Processes and Health, edited by: Harrison, X. Q. R. M. and Hester, R. E., 72–125, Royal Society of Chemistry, Cambridge, UK, 2016.
Westerling, A. L., Hidalgo, H. G., Cayan, D. R., and Swetnam, T. W.: Warming and Earlier Spring Increase Western U.S. Forest Wildfire Activity, Science, 400, 1054, https://doi.org/10.1126/science.1128834, 2006.
Wong, J. P. S., Tsagkaraki, M., Tsiodra, I., Mihalopoulos, N., Violaki, K., Kanakidou, M., Sciare, J., Nenes, A., and Weber, R. J.: Effects of Atmospheric Processing on the Oxidative Potential of Biomass Burning Organic Aerosols, Environ. Sci. Technol., 53, 6747–6756, https://doi.org/10.1021/acs.est.9b01034, 2019.
Worton, D. R., Decker, M., Isaacman-VanWertz, G., Chan, A. W. H., Wilson, K. R., and Goldstein, A. H.: Improved molecular level identification of organic compounds using comprehensive two-dimensional chromatography, dual ionization energies and high resolution mass spectrometry, Analyst, 142, 2395–2403, https://doi.org/10.1039/c7an00625j, 2017.
Yan, B., Zheng, M., Hu, Y. T., Lee, S., Kim, H. K., and Russell, A. G.: Organic composition of carbonaceous aerosols in an aged prescribed fire plume, Atmos. Chem. Phys., 8, 6381–6394, https://doi.org/10.5194/acp-8-6381-2008, 2008.
Yee, L. D., Isaacman-VanWertz, G., Wernis, R. A., Meng, M., Rivera, V., Kreisberg, N. M., Hering, S. V., Bering, M. S., Glasius, M., Upshur, M. A., Gray Bé, A., Thomson, R. J., Geiger, F. M., Offenberg, J. H., Lewandowski, M., Kourtchev, I., Kalberer, M., de Sá, S., Martin, S. T., Alexander, M. L., Palm, B. B., Hu, W., Campuzano-Jost, P., Day, D. A., Jimenez, J. L., Liu, Y., McKinney, K. A., Artaxo, P., Viegas, J., Manzi, A., Oliveira, M. B., de Souza, R., Machado, L. A. T., Longo, K., and Goldstein, A. H.: Observations of sesquiterpenes and their oxidation products in central Amazonia during the wet and dry seasons, Atmos. Chem. Phys., 18, 10433–10457, https://doi.org/10.5194/acp-18-10433-2018, 2018.
Zhang, H., Yee, L. D., Lee, B. H., Curtis, M. P., Worton, D. R., Isaacman-VanWertz, G., Offenberg, J. H., Lewandowski, M., Kleindienst, T. E., Beaver, M. R., Holder, A. L., Lonneman, W. A., Docherty, K. S., Jaoui, M., Pye, H. O. T., Hu, W., Day, D. A., Campuzano-Jost, P., Jimenez, J. L., Guo, H., Weber, R. J., de Gouw, J., Koss, A. R., Edgerton, E. S., Brune, W., Mohr, C., Lopez-Hilfiker, F. D., Lutz, A., Kreisberg, N. M., Spielman, S. R., Hering, S. V., Wilson, K. R., Thornton, J. A., and Goldstein, A. H.: Monoterpenes are the largest source of summertime organic aerosol in the southeastern United States, P. Natl. Acad. Sci. USA, 115, 201717513, https://doi.org/10.1073/pnas.1717513115, 2018.