Introduction
Type 2 diabetes mellitus (T2DM) and Alzheimer’s disease (AD) are two medical diseases that have significant drawbacks in modern healthcare systems [1]. In 2014, the average healthcare-related cost for individuals with DM was between $ 1,583 and $ 2,842 worldwide [2]. Type 2 DM is attributed to insulin resistance, which has also been documented for AD, making some scientists represent AD as “type 3 DM” or “brain-specific type 2 DM”. This hypothesis has been reinforced by a plethora of findings that have been occurring over the past few years, highlighting the presence of several shared molecular pathways [3].
High insulin levels in the brain have been recently proven to play a vital role in cognitive functions. In addition, insulin has been shown to have in utero protective function against oxidative stress-mediated through insulin receptor (IR) signaling pathways [4]. The majority of brain insulin is actively transported across the blood-brain barrier (BBB). However, a trace amount of peripherally synthesized insulin passively diffuses through the area postrema [5]. The hippocampal pyramidal neurons synthesize and release intracerebral insulin, which binds rapidly to the widely distributed IR receptors [6]. In T2DM, insulin uptake by the brain is downregulated. This deprives the highly metabolic limbic system neurons of the fuel required for their proper functions. This is translated clinically in the form of progressive deterioration of learning, memory, and cognitive brain functions [7]. Dysregulation of insulin signaling pathways has been recently claimed as a neuropathological hallmark for the progressive development of AD, tau protein hyper-phosphorylation, and β-amyloid (Aβ) deposition. Insulin/IR dysregulation has been located to defective processing of Aβ precursor protein (Aβ-PP), leading to misfolded Aβ accumulation [8]. Furthermore, the increased amount of misfolded Aβ protein competes with insulin for the insulin-degrading enzyme (IDE), which usually degrades both insulin and Aβ. Consequently, this leads to AB peptide deposition and formation of senile plaques, the histologic hallmark of AD [9].
Physical activity has a well-known, potent effect in alleviating neurological symptoms and counteracting pathologic consequences of impaired glucose tolerance and T2DM [10]. It was reported that regular exercise improved cognitive functions in elderly patients, in addition to its beneficial effects on vascular physiology, endothelial function, and neurovascular coupling [11]. Treadmill exercise decreased the incidence of AD by suppressing glycogen synthase kinase-3β expression in streptozotocin-induced diabetic rats. This has been linked to increased insulin sensitivity and enhanced downstream signaling [1].
Metformin is a member of the biguanide family of hypoglycemic drugs that is widely used worldwide in the management of T2DM [12] and metabolic syndrome [13]. It is a highly effective drug with an excellent safety profile, few side effects, and a low risk of inducing hypoglycemia. One of metformin’s mechanisms of action is to inhibit insulin-mediated hepatic glucose output. In addition, it enhances peripheral glucose utilization, leading to an efficient reduction of blood glucose levels and better glycemic control [14].
At the molecular level, metformin has a strong inhibitory effect on mitochondrial electron-transport-chain protein “complex I” in the liver, with subsequent suppression of adenosine triphosphate (ATP) production. Metformin also upregulates the production of AMP-activated protein kinase (AMPK), an essential regulator of glucose metabolism [15]. Metformin has been shown to play similar roles in the central nervous system (CNS), protecting brains of rats with streptozotocin-induced DM against oxidative stress. However, the exact mechanisms of these protective effects still need further investigation [16].
The current study aims at comparing the prophylactic effect of treadmill exercise and metformin medication on cognitive brain functions in male albino rats with type 3 DM.
Material and methods
Animal care and housing
Sixty adult male albino rats, 7 weeks old, and weighing 200 g (±10 g) were obtained from the animal care and use facility at Kasr Al-Ainy Faculty of Medicine, Cairo University, Egypt. Rats were kept under observation for 15 days prior to onset of experiments for adaptation and exclusion of any current infection. Rats were housed in plastic cages (3 rats/cage) under optimal temperature (25 ±5°C) and humid conditions with 12 h alternating light and dark cycles. Rats were given free water access and supplied daily with laboratory rat diet offered ad-lib. The experimental protocol used in this study was approved by the Institutional Animal Care and Use Committee (CU-IACUC), Cairo University, with approval number: CU/III/F/68/18.
Animal grouping
The study animals were divided into two groups: a normal control group (Group I, n = 15): non-diabetic male albino rats, not put under treadmill exercise, and a streptozotocin (STZ)-induced type 2 DM group (Group II): a total of 45 male albino rats were placed on high-fat diet (HFD) for 2 weeks, followed by a single intraperitoneal (IP) injection of low-dose streptozotocin (30 mg/kg) in 0.01 M citrate buffer (pH of 4.3); to induce type 2 DM (HFD + STZ). After STZ treatment, rats were continued on their respective diets for the study duration of 12 weeks [17]. T2DM was confirmed, on day 20, by measuring fasting plasma glucose and insulin levels. Only animals with blood glucose levels ≥ 300 mg/dl were used as the diabetic group [1]. This group was further subdivided into the following subgroups (15 rats each):
– DM control group (diabetic group, IIa): no exercise and no treatment;
– DM with exercise group (exercised-group, IIb): rats were put on a treadmill for 30 min/day, 5 days/week, for the study duration. The exercise program included running at a speed of 3 m/min for the first 5 min, 5 m/min for the next 5 min, and then 8 m/min for the last 20 min, with 0% grade of inclination [1];
– DM with metformin treatment group (metformin-treated group, IIc): rats in this group received 1.5 mg metformin/kg once daily, by gavage, for the study duration [18].
Step-down avoidance task latency
To evaluate the memory function following each experiment, rats were placed on a 7 × 25 cm platform with a height of 2.5 cm and were allowed to rest for 1 min on the platform. Platforms faced a 42 × 25 cm grid of parallel stainless steel bars with 0.1 cm-caliber, spaced apart by 1 cm distance.
In the training session, rats received a 0.5 mA foot shock for 2 s immediately upon stepping off of the platform. Latency was assessed at 2 and 48 h after the training session. The interval between rats stepping down the platform and placing all four paws on the grid was defined as the latency in the step-down avoidance task. Any latency over 300 s was counted as 300 s [19].
Blood sampling
Heparinized capillary tubes were used to collect blood samples from retro-orbital spaces. Blood samples were centrifuged at 10,000 rpm for 15 min, and serum was separated and stored at –70°C. Each serum sample was divided equally into three tubes for further testing.
Measurement of parameters
Serum blood glucose was measured using the enzymatic method. Briefly, glucose oxidase was used to catalyze the oxidation of glucose to hydrogen peroxide and gluconic acid. Hydrogen peroxide, when combined with 4-amino antipyrine and a phenol derivative, forms a red dye compound that can be measured by spectrophotometer. The intensity of red color generated is directly proportional to the glucose concentration in the sample. Serum concentration of 60-110 mg/dl was considered the normal reference range [20]. Serum FFA was measured according to Sfa [21]. Serum HDL and cholesterol were measured according to Young [22]. Serum triglycerides were measured according to Fossati and Principe [23]. Brain glucose was measured according to Fray et al. [24]. Brain amyloid β1-42 levels were measured according to Best et al. [25].
Toluidine blue staining
Isolated rat brains were fixed in 4% (w/v) paraformaldehyde, and then cut into tissue slices at 4 microns thick for toluidine blue staining. Slices were incubated with a 0.5% (w/v) toluidine blue solution at 56°C for 20 min. After dehydration, washing and mounting on glass slides, brain slices were examined under light microscopy. Morphological changes in hippocampal neurons in CA3 area were detected [26].
Immunohistochemical techniques
Tissue preparation: Rats’ brains were removed and fixed overnight in formaldehyde solution, then transferred into a 30% sucrose solution for cryoprotection. Serial coronal sections of 4 μm thickness were made using a freezing microtome (Leica, Nussloch, Germany).
Immunohistochemistry staining for brain Aβ depositions: Slides were incubated with the primary mouse anti-AB antibody (39320, Covance Inc, USA) at 4°C for 12 h. After incubation, slides were washed in 0.01 M phosphate buffered saline (PBS) solution 3 times for 5 min each, and secondary horseradish peroxidase (HRP)-labeled goat anti-mouse antibodies were added (sc-2005, Santa Cruz, CA, USA) at room temperature for 1 h [27].
Immunohistochemistry staining for brain tau-positive cells: Following incubation with the primary antibody, sections were incubated for 90 min with biotinylated anti-rabbit secondary antibody (1 : 200; Vector Laboratories, Burlingame, CA, USA). The secondary reaction was amplified with a Vector Elite ABC kit (1 : 100; Vector Laboratories). The antibody-biotin-avidin-peroxidase complexes were visualized using 0.03% diaminobenzidine (DAB). Finally, the stained tissue sections were mounted onto gelatin-coated slides. The slides were air dried overnight at room temperature, and then coverslipped using Permount (Fisher Scientific, Fairlawn, NJ, USA) [28].
The total number of granular, apoptotic, degenerated, and tau-positive cells, as well as Aβ depositions in dentate gyrus, was calculated hemilaterally using an Image-Pro Plus computer-assisted image analysis system (Media Cyberbetics Inc., Silver Spring, MD) [29].
Statistical analysis
Data were coded and entered using the statistical package SPSS version 24. Data were summarized using mean and standard deviation for quantitative variables and frequencies (number of cases) and relative frequencies (percentages) for categorical variables. One-way ANOVA was done to find out any statistically significant difference between the mean value of data of different groups. P-values less than 0.05 were considered statistically significant. A post hoc test was done to find out the level of inter-group significant difference [30].
Results
Physical experiment
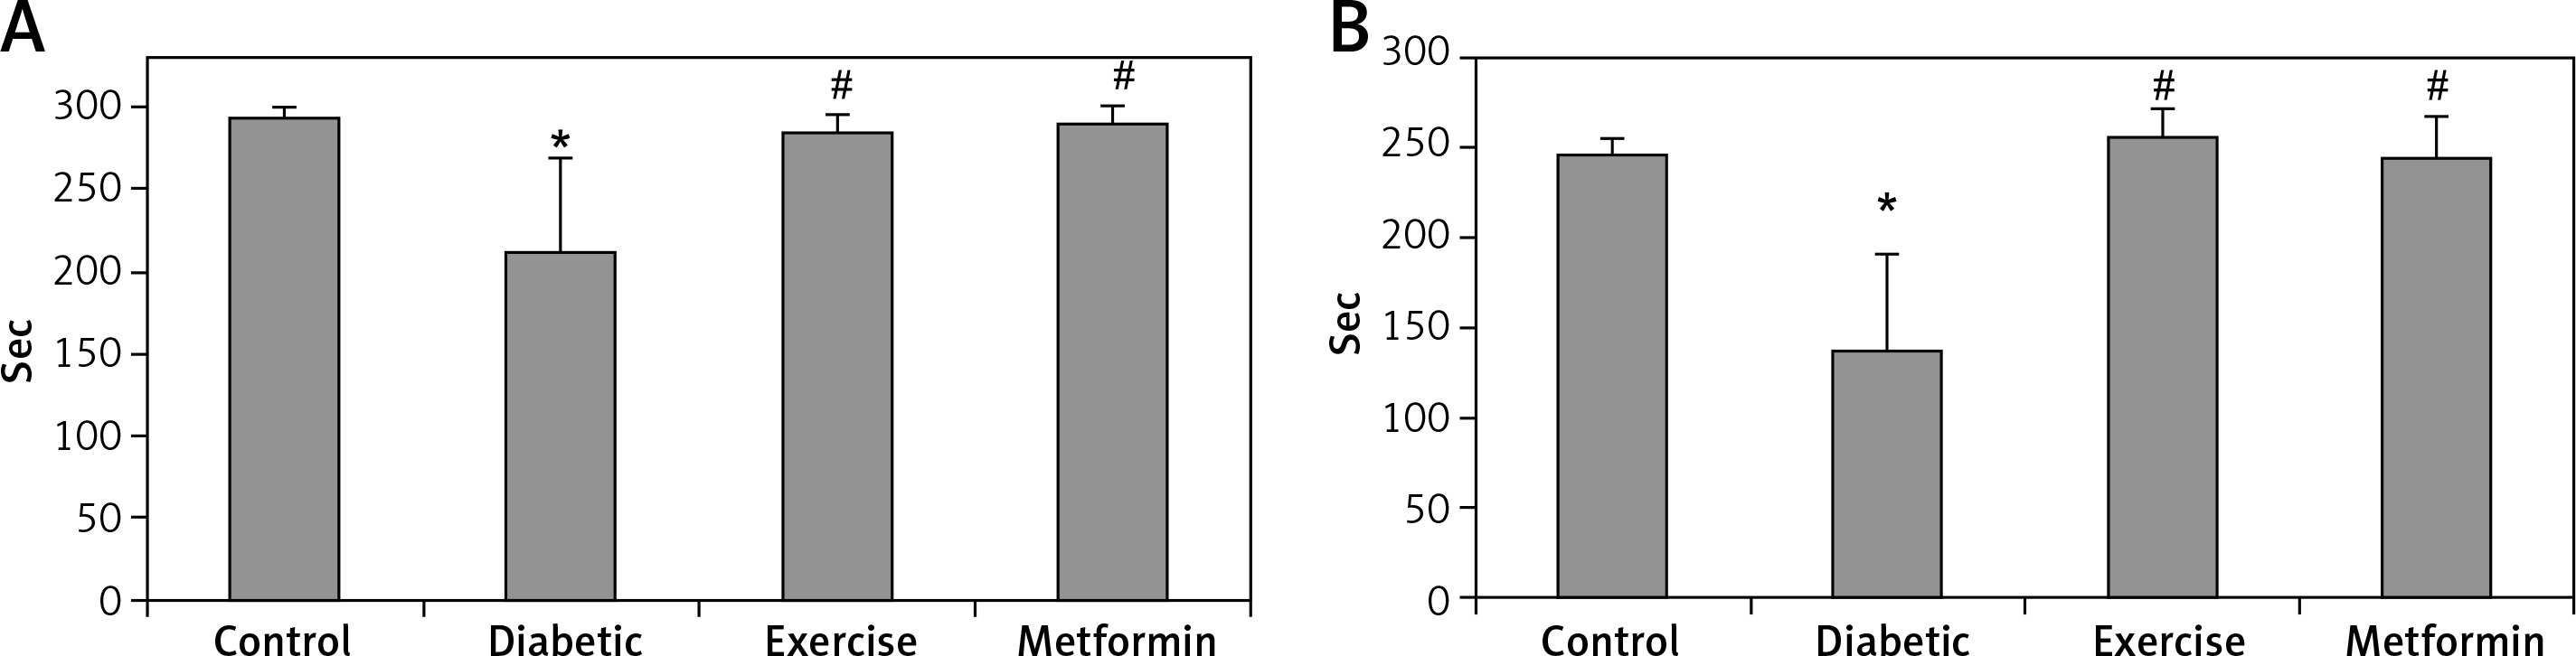
The diabetic group showed significant lower latency in the step-down avoidance test, both 2 and 48 h after exercise (–27.85% and –44.5% respectively), compared to the control group. However, rats put under regular exercise, and the metformin-treated group did not show any significant difference compared to the control group. On the other hand, the results showed significant higher latency in the exercise (+34.65% and +87.5% respectively) and metformin-treated (+36.83% and +78.8% respectively) groups compared to the diabetic group. Last, there was no significant difference between the exercise and metformin-treated groups (Table I, Figure 1).
Table I
Comparison of different parameters among the studied groups
| Parameters | Control | Diabetic | Exercise | Metformin |
|---|---|---|---|---|
| Step-down avoidance test after training [s]: | ||||
| 2 h | 293.84 ±6.06 | 212.02 ±57.38* | 285.48 ±10.18# | 290.10 ±11.76# |
| 48 h | 246.32 ±8.99 | 136.78 ±54.12* | 256.42 ±15.45# | 244.56 ±23.19# |
| Serum glucose [mg/dl] | 105.96 ±11.88 | 269.75 ±29.47* | 153.55 ±10.92*# | 139.38 ±21.92*# |
| Lipid profile: | ||||
| FFA [µmol/l] | 38.84 ±5.31 | 111.68 ±12.34* | 80.89 ±10.91*# | 69.91 ±15.57*# |
| Cholesterol [mg/dl] | 94.20 ±59.42 | 240.90 ±27.07* | 178.40 ±14.03*# | 171.00 ±14.45*# |
| TG [mg/dl] | 75.60 ±4.62 | 110.20 ±14.41* | 94.80 ±12.85*# | 90.90 ±10.24# |
| LDL [mg/dl] | 81.42 ±8.09 | 187.59 ±27.62* | 112.98 ±14.31*# | 103.58 ±14.54# |
| HDL [mg/dl] | 57.66 ±3.51 | 31.27 ±5.56* | 47.18 ±6.06*# | 49.24 ±4.45*# |
| Brain glucose [mg/dl] | 57.16 ±6.18 | 145.11 ±18.79* | 80.24 ±8.19*# | 83.15 ±10.16*# |
| Brain Aβ-42 [pg/ml] | 1.50 ±0.40 | 10.41 ±2.20* | 4.50 ±1.70*# | 4.54 ±1.65*# |
| Toluidine blue cell counting [cells/10 mm2]: | ||||
| Granular | 100.83 ±11.97 | 55.67 ±5.05* | 85.17 ±6.11*# | 86.67 ±5.85*# |
| Dark | 8.83 ±2.32 | 27.5 ±3.78* | 12.33 ±2.16*# | 15.83 ±3.87*# |
| Degenerated | 5.5 ±2.07 | 22.67 ±4.27* | 10.33 ±1.63*# | 11.83 ±3.06*# |
| Immunohistochemistry for brain [cells/mm2]: | ||||
| Aβ-42 +ve | 115.09 ±7.86 | 373.74 ±17.25* | 245.81 ±14.48*# | 248.72 ±15.52*# |
| Tau +ve | 62.95 ±6.42 | 198.64 ±19.53* | 142.33 ±11.79*# | 170.72 ±14.57*$ |
Figure 1
Changes in the mean of step-down avoidance task: A – 2 h, and B – 48 h among the study groups
Values are presented as mean ± SD. *Statistically significant compared to the corresponding value in the control group (p < 0.05); #statistically significant compared to the corresponding value in the diabetic group (p < 0.05).
Biochemical studies
Serum glucose levels
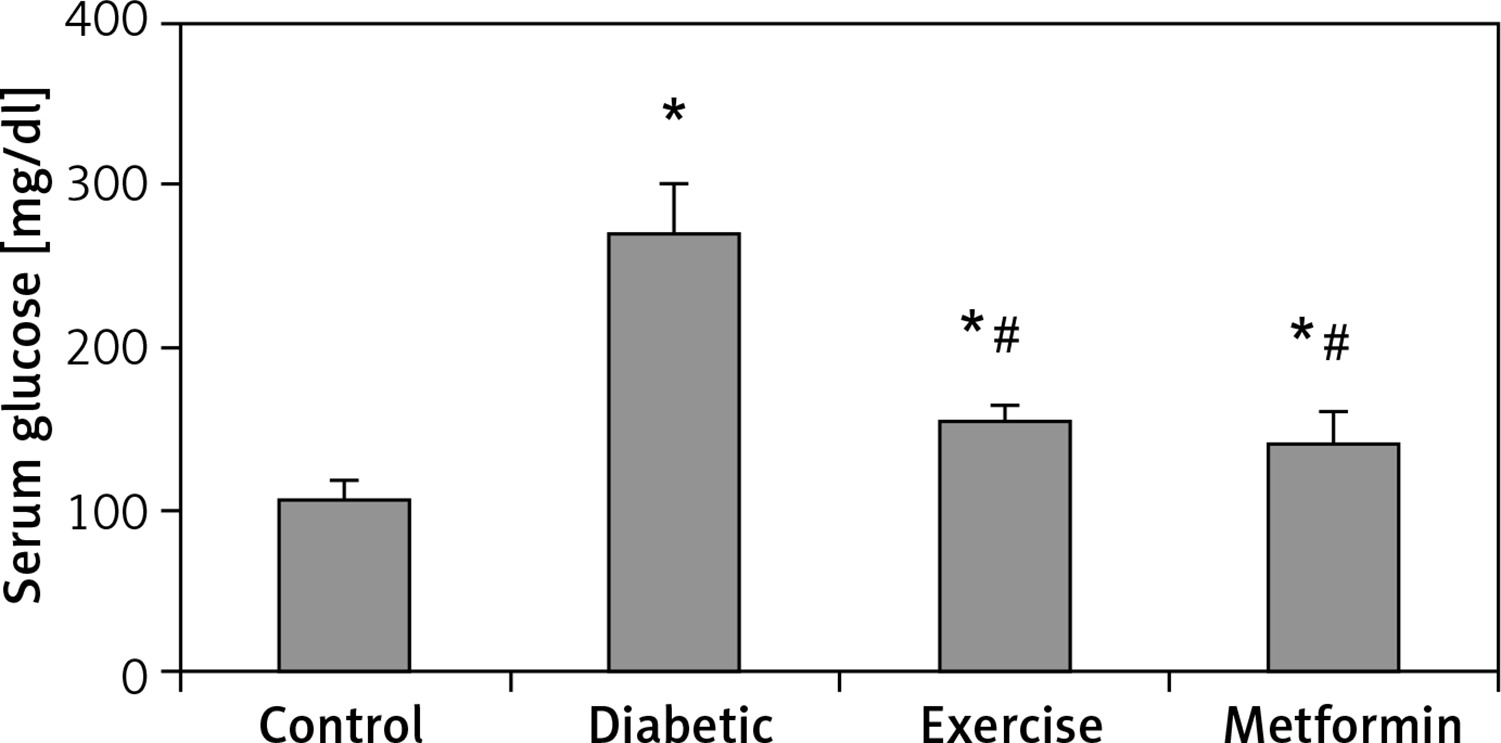
There was a significant higher serum glucose levels in the diabetic (+153.87%), exercise (+44.91%), and metformin-treated (+31.54%) groups, as compared to the control group. As expected, there was a significant lower serum glucose levels in both exercise (–43.08%) and metformin-treated (–48.33%) rats compared to the diabetic group. Interestingly, there was no significant difference in serum glucose levels between the exercise and metformin-treated groups (Table I, Figure 2).
Lipid profile
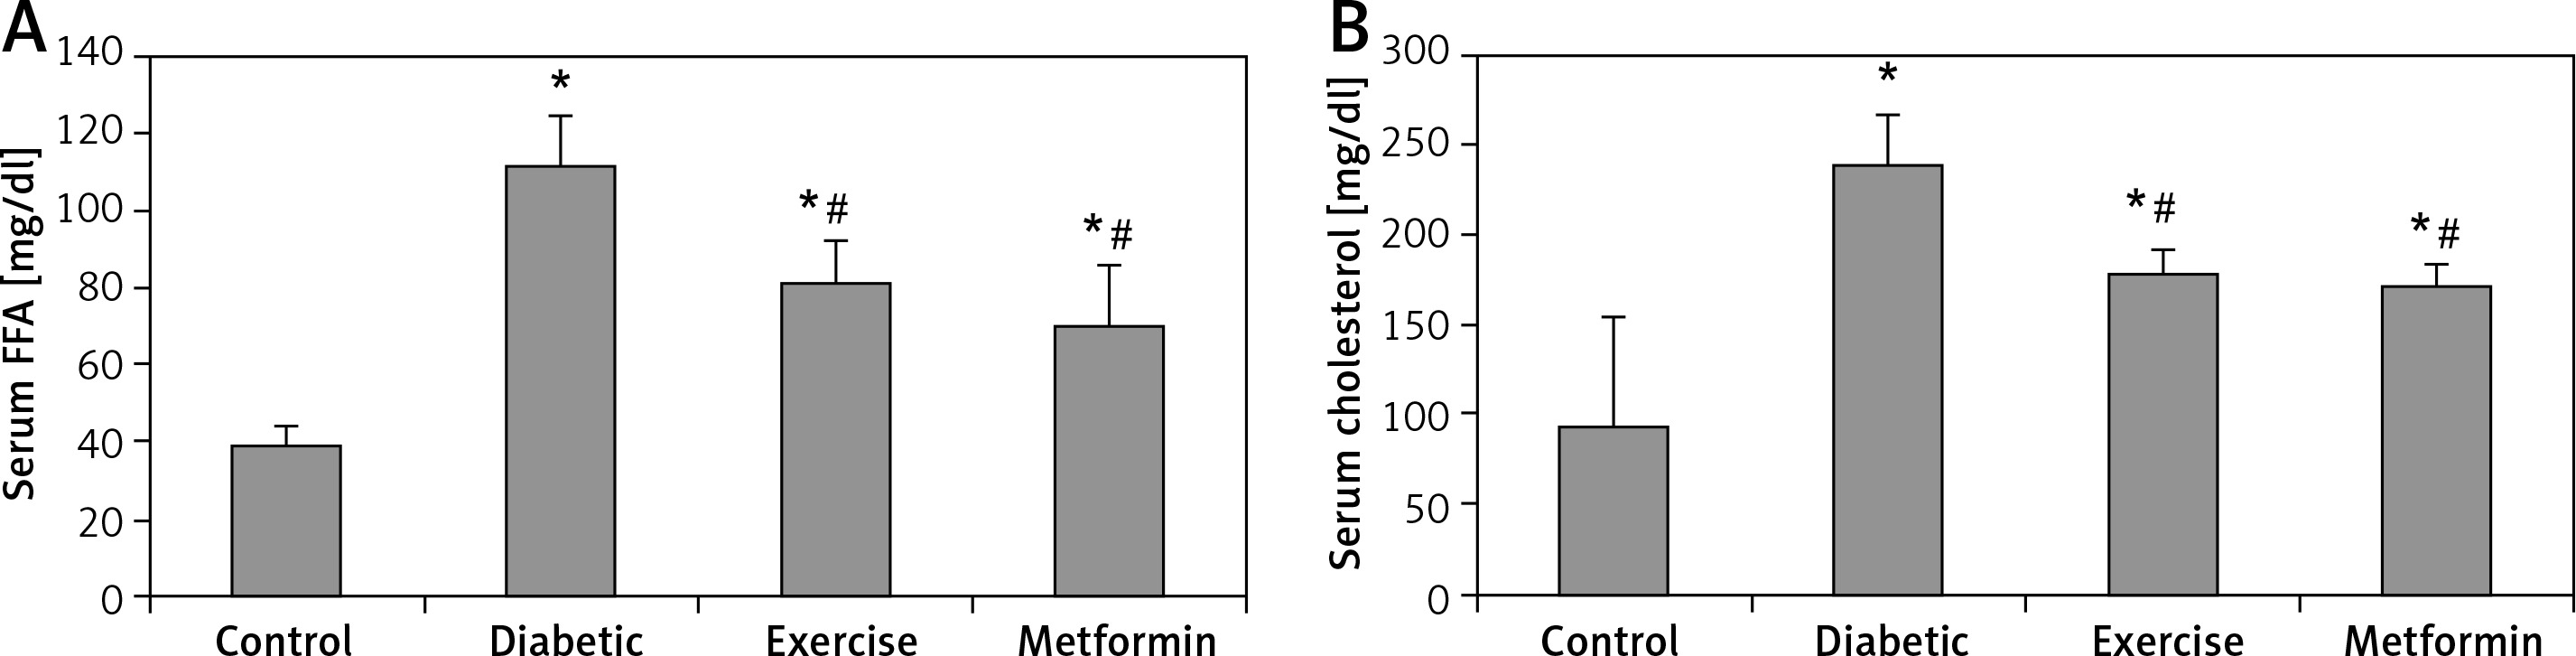
Our results showed a significant higher serum FFA and cholesterol levels in the diabetic (+187.5% and +155.73% respectively), exercise (+108.26% and +89.38% respectively), and metformin-treated (+79.99% and +81.53% respectively) groups compared to the control group. On the other hand, the present study showed a significant lower FFA and cholesterol levels in both exercise (–27.57% and –25.94% respectively) and metformin-treated (–37.4% and –29.01% respectively) groups compared to the diabetic group. There was no significant difference in serum FFA and cholesterol levels between the exercise and metformin-treated groups (Table I, Figure 3).
Figure 3
Changes in the mean of serum: A – FFA and B – cholesterol among the study groups
Values are presented as mean ± SD. *Statistically significant compared to the corresponding value in the control group (p < 0.05); #statistically significant compared to the corresponding value in the diabetic group (p < 0.05).
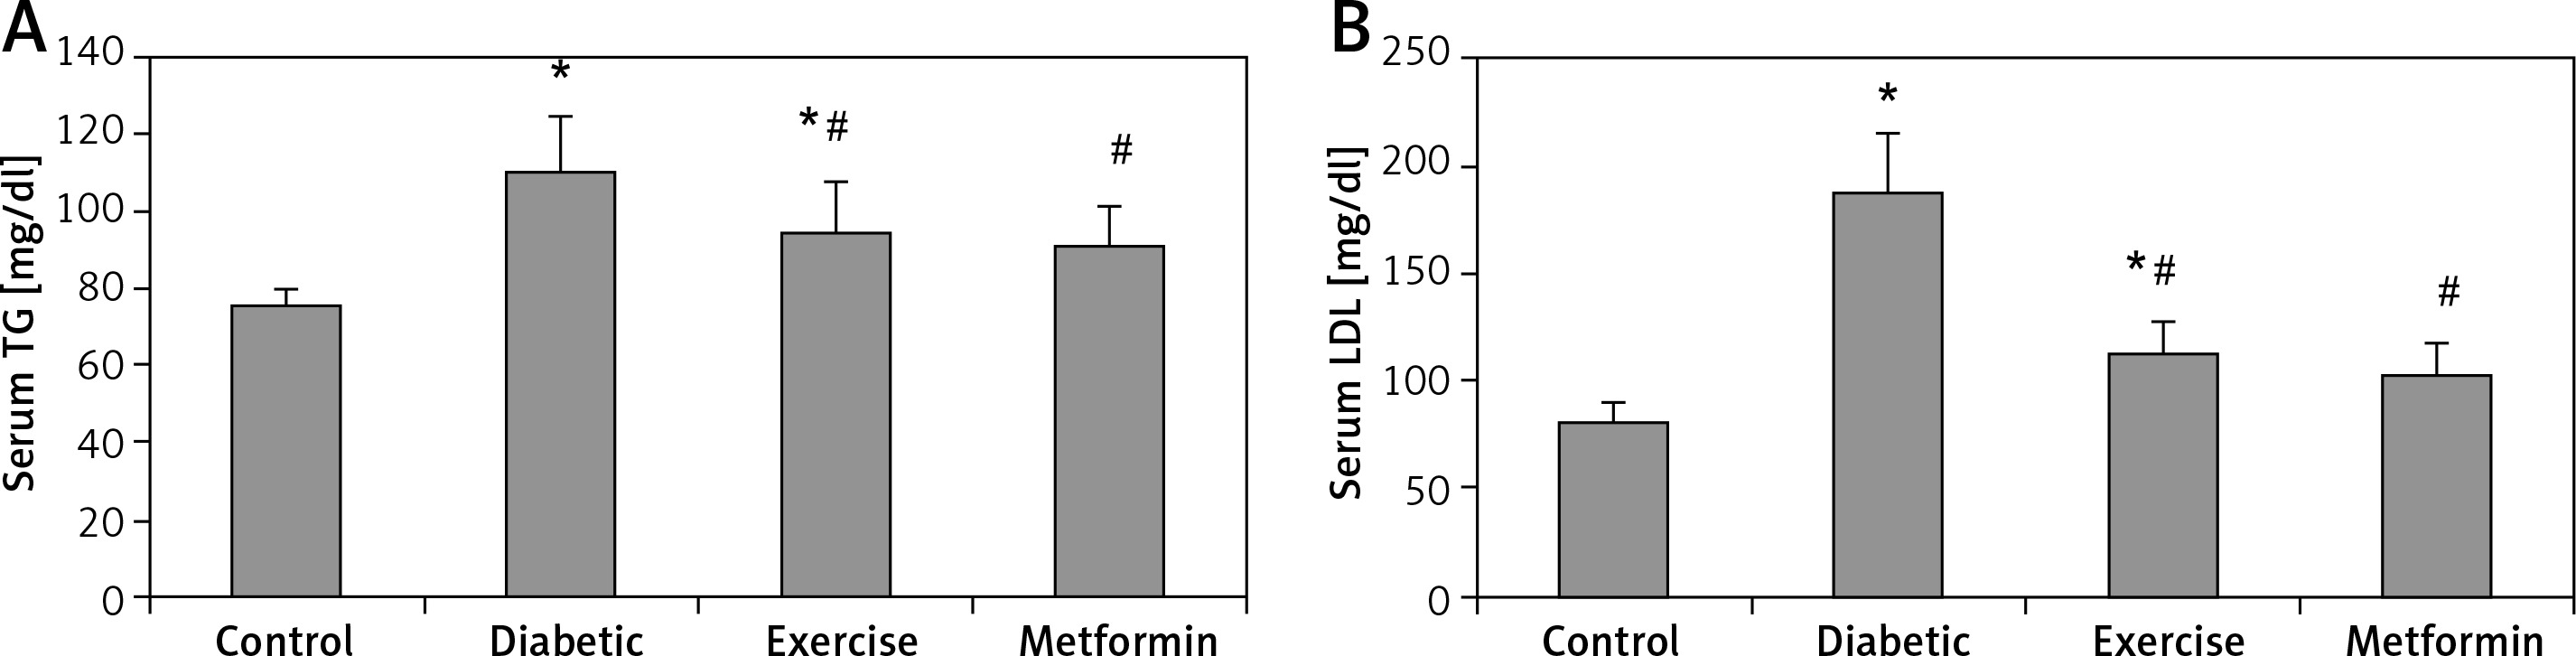
Serum TG and LDL levels showed a significant higher the diabetic (+45.7% and +130.4% respectively) and exercise (+25.4% and +38.76% respectively) groups compared to the control group. Also, there was a significant lower serum TG and LDL levels in both exercise (–13.97% and –39.77% respectively) and metformin-treated (–17.51% and –44.69% respectively) groups compared to the diabetic group. Interestingly, there was no significant lower serum levels of both TG and LDL among metformin-treated, control, and exercise groups (Table I, Figure 4).
Figure 4
Changes in the mean of serum: A – TG, B – LDL in the adult rats of the experimental groups
Values are presented as mean ± SD. *Statistically significant compared to the corresponding value in the control group (p < 0.05); #statistically significant compared to the corresponding value in the diabetic group (p < 0.05).
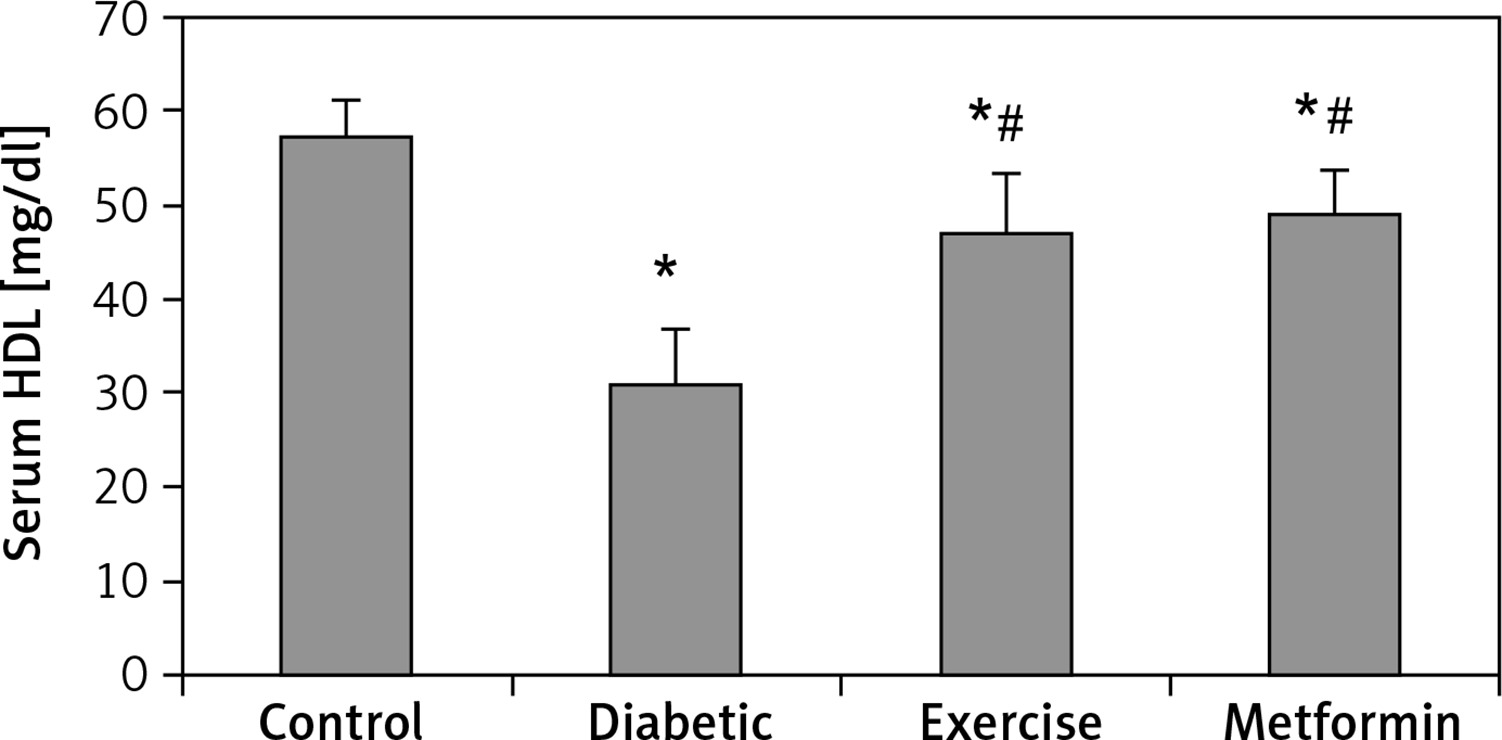
Our results demonstrated a significant lower serum HDL levels in the diabetic (–45.77%), exercise (–18.17%), and metformin-treated (–14.6%) groups compared to the control group. At the same time, there was a significant higher HDL serum levels in both exercise (+50.88%) and metformin-treated (+57.5%) groups compared to the diabetic group. The results showed no significant difference in HDL serum levels between the exercise and metformin-treated groups (Table I, Figure 5).
Brain glucose and Aβ-42 levels
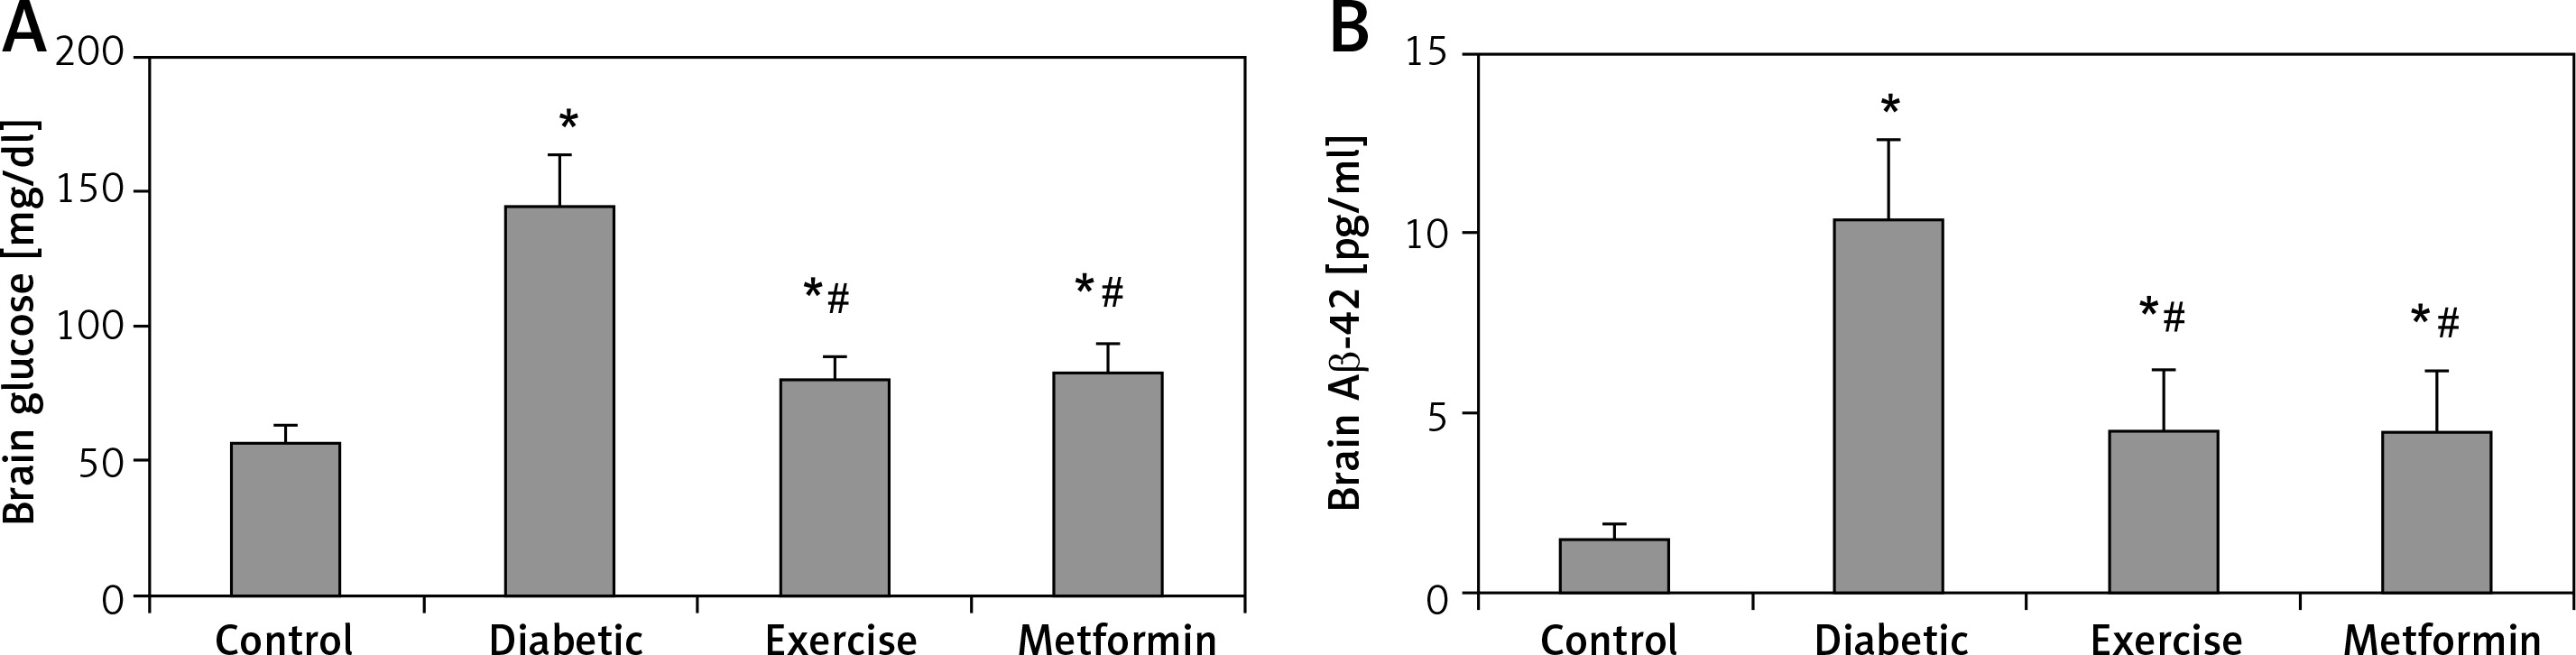
The current study showed a significant higher brain glucose and Aβ-42 levels in diabetic (+153.87% and +594% respectively), exercise (+40.38% and +200% respectively) and metformin-treated (+45.47% and +304% respectively) groups when compared to the control group. Additionally, the results showed a significant lower glucose and Aβ-42 levels in the brains of rats put under exercise (–44.7% and –56.77% respectively) or treated with metformin (–42.7% and –56.38% respectively) compared to the diabetic group. There was no significant difference in hippocampal Aβ-42 levels between the exercise and metformin-treated groups (Table I, Figure 6).
Figure 6
Changes in the mean of the brain: A – glucose, and B – Aβ-42 levels among the study groups
Values are presented as mean ± SD. *Statistically significant compared to the corresponding value in the control group (p < 0.05); #statistically significant compared to the corresponding value in the diabetic group (p < 0.05).
Toluidine blue staining and cell counting
Hippocampal granular cells
The present study demonstrated a significant fewer hippocampal granular cells in diabetic (–44.79%), exercise (–15.53%), and metformin-treated (–14.04%) groups compared to the control group. The results also showed a significant greater hippocampal granular cells in both exercise (+52.99%) and metformin-treated (+55.69%) groups compared to the diabetic group. We did not see any significant difference in hippocampal granular cell numbers between exercise and metformin-treated groups (Table I, Figures 7 A, 8).
Figure 7
Changes in the mean number of the brain A – granular, B – dark (apoptotic), and C – degenerated cells in the adult rats of the experimental groups
Values are presented as mean ± SD. *Statistically significant compared to the corresponding value in the control group (p < 0.05); #statistically significant compared to the corresponding value in the diabetic group (p < 0.05).
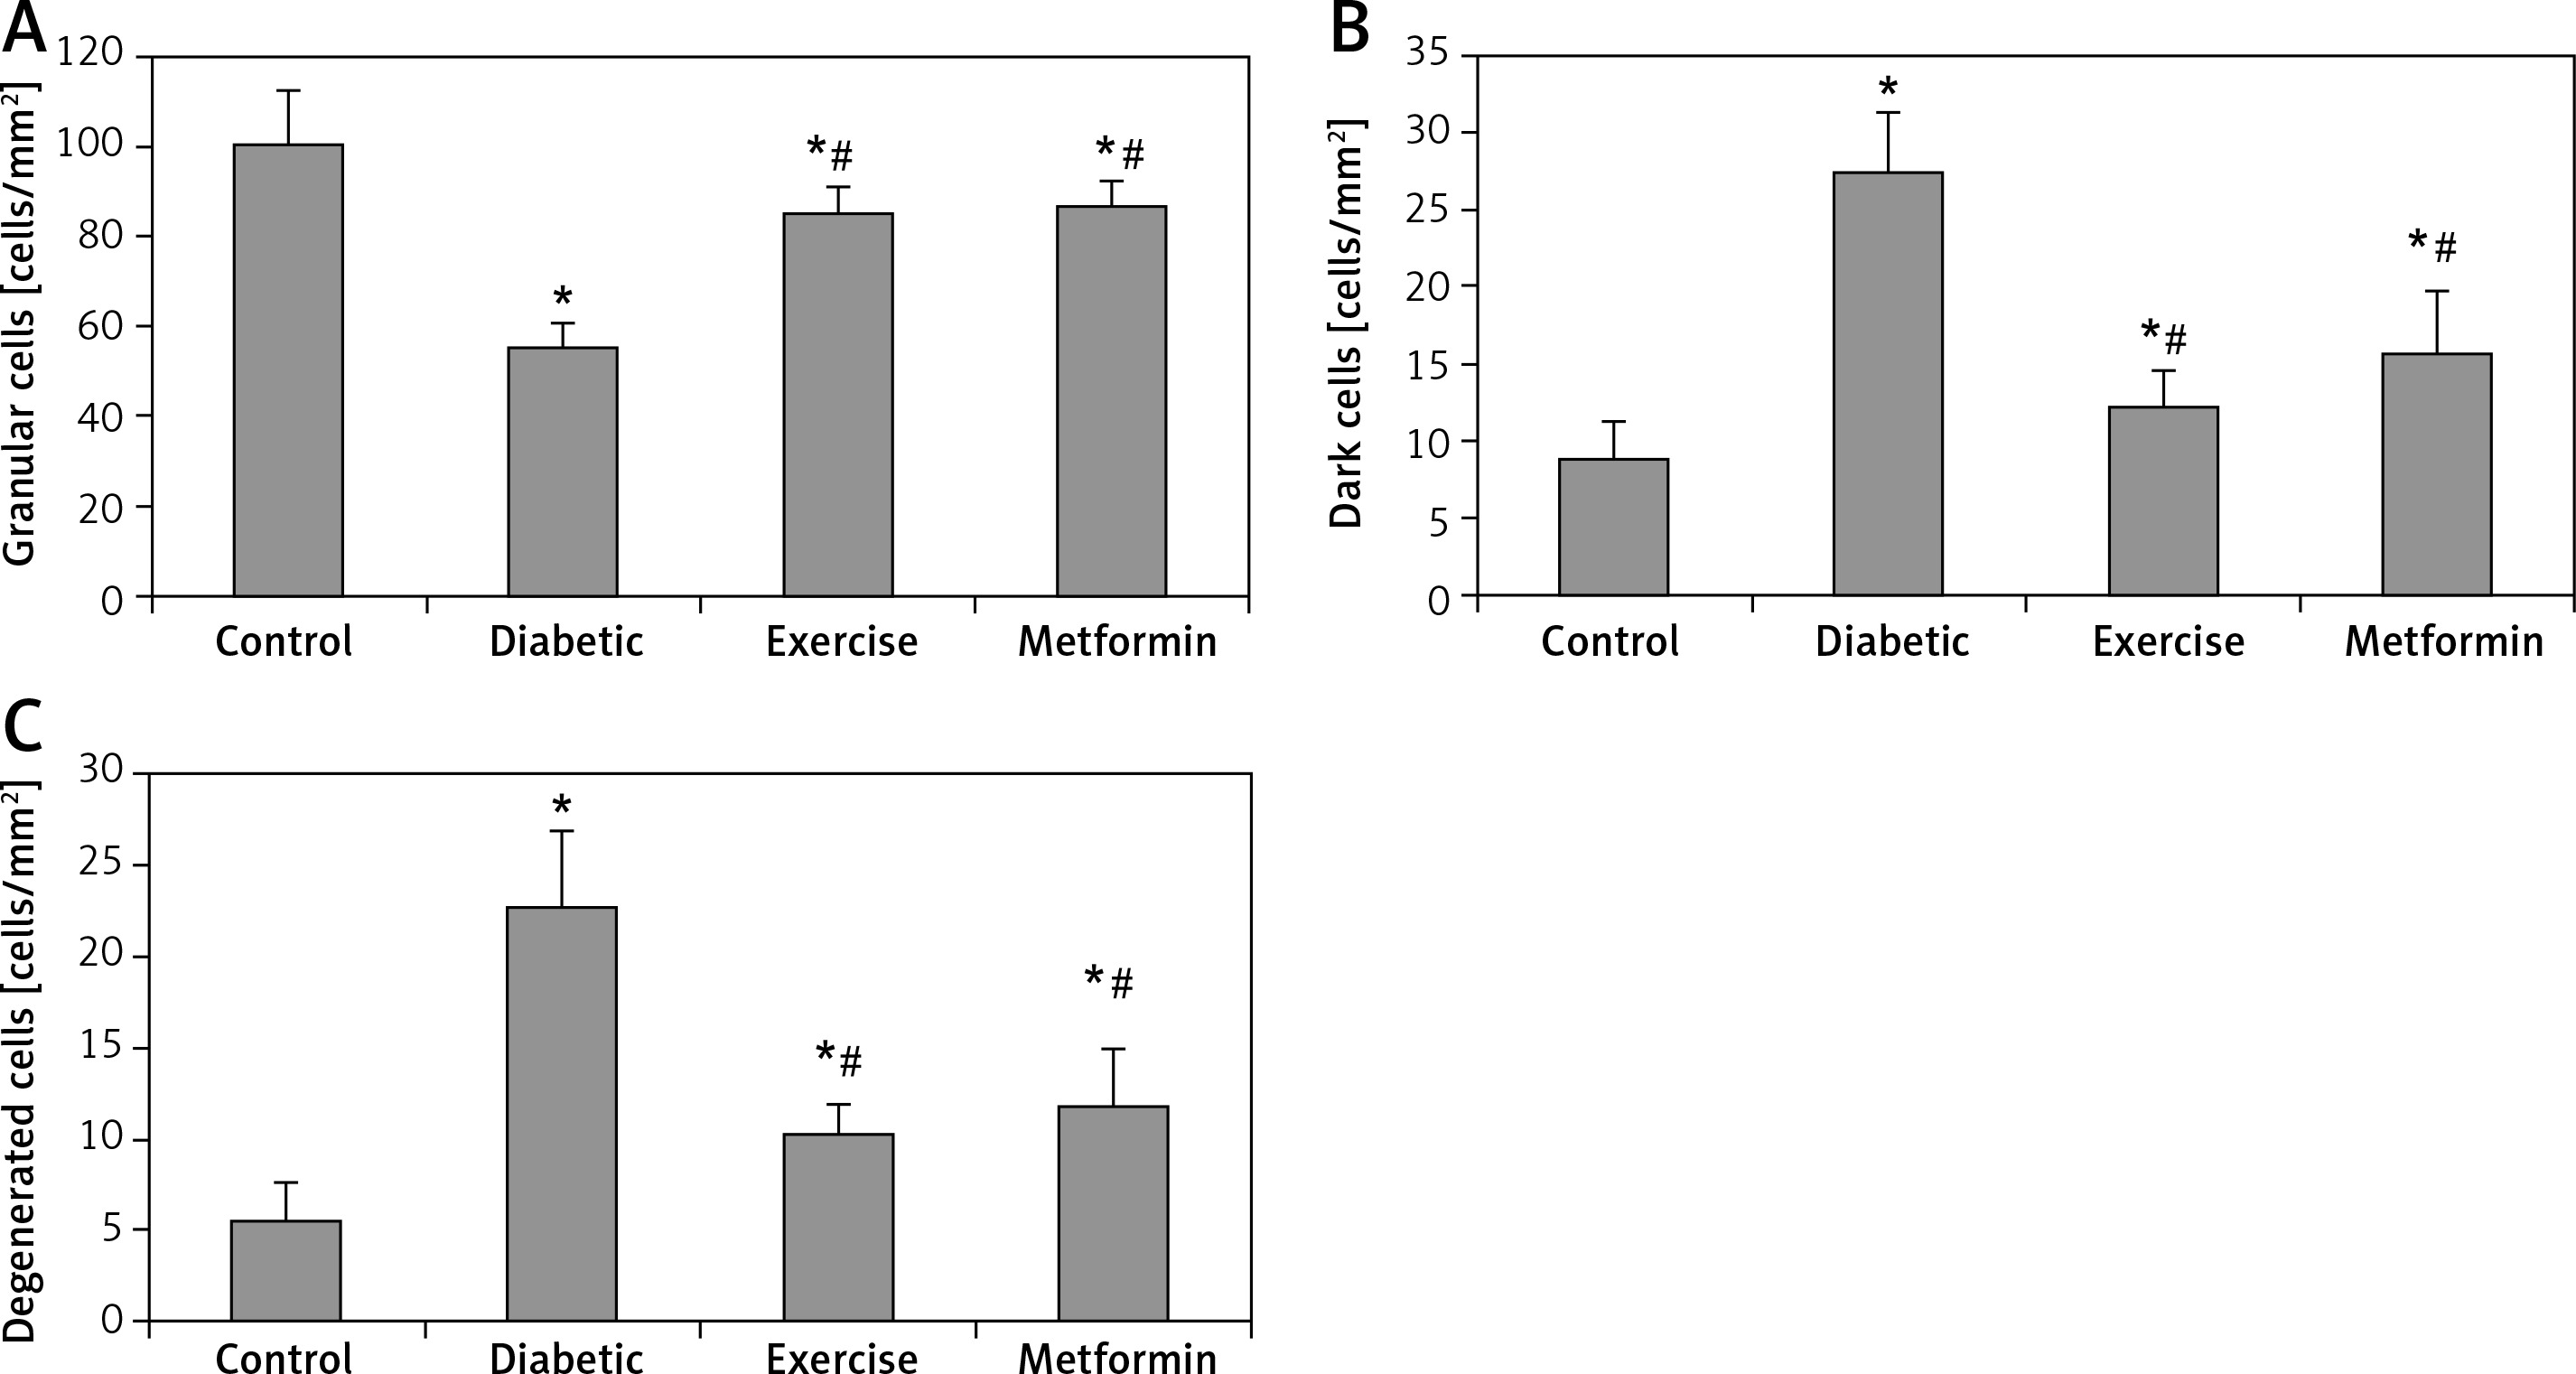
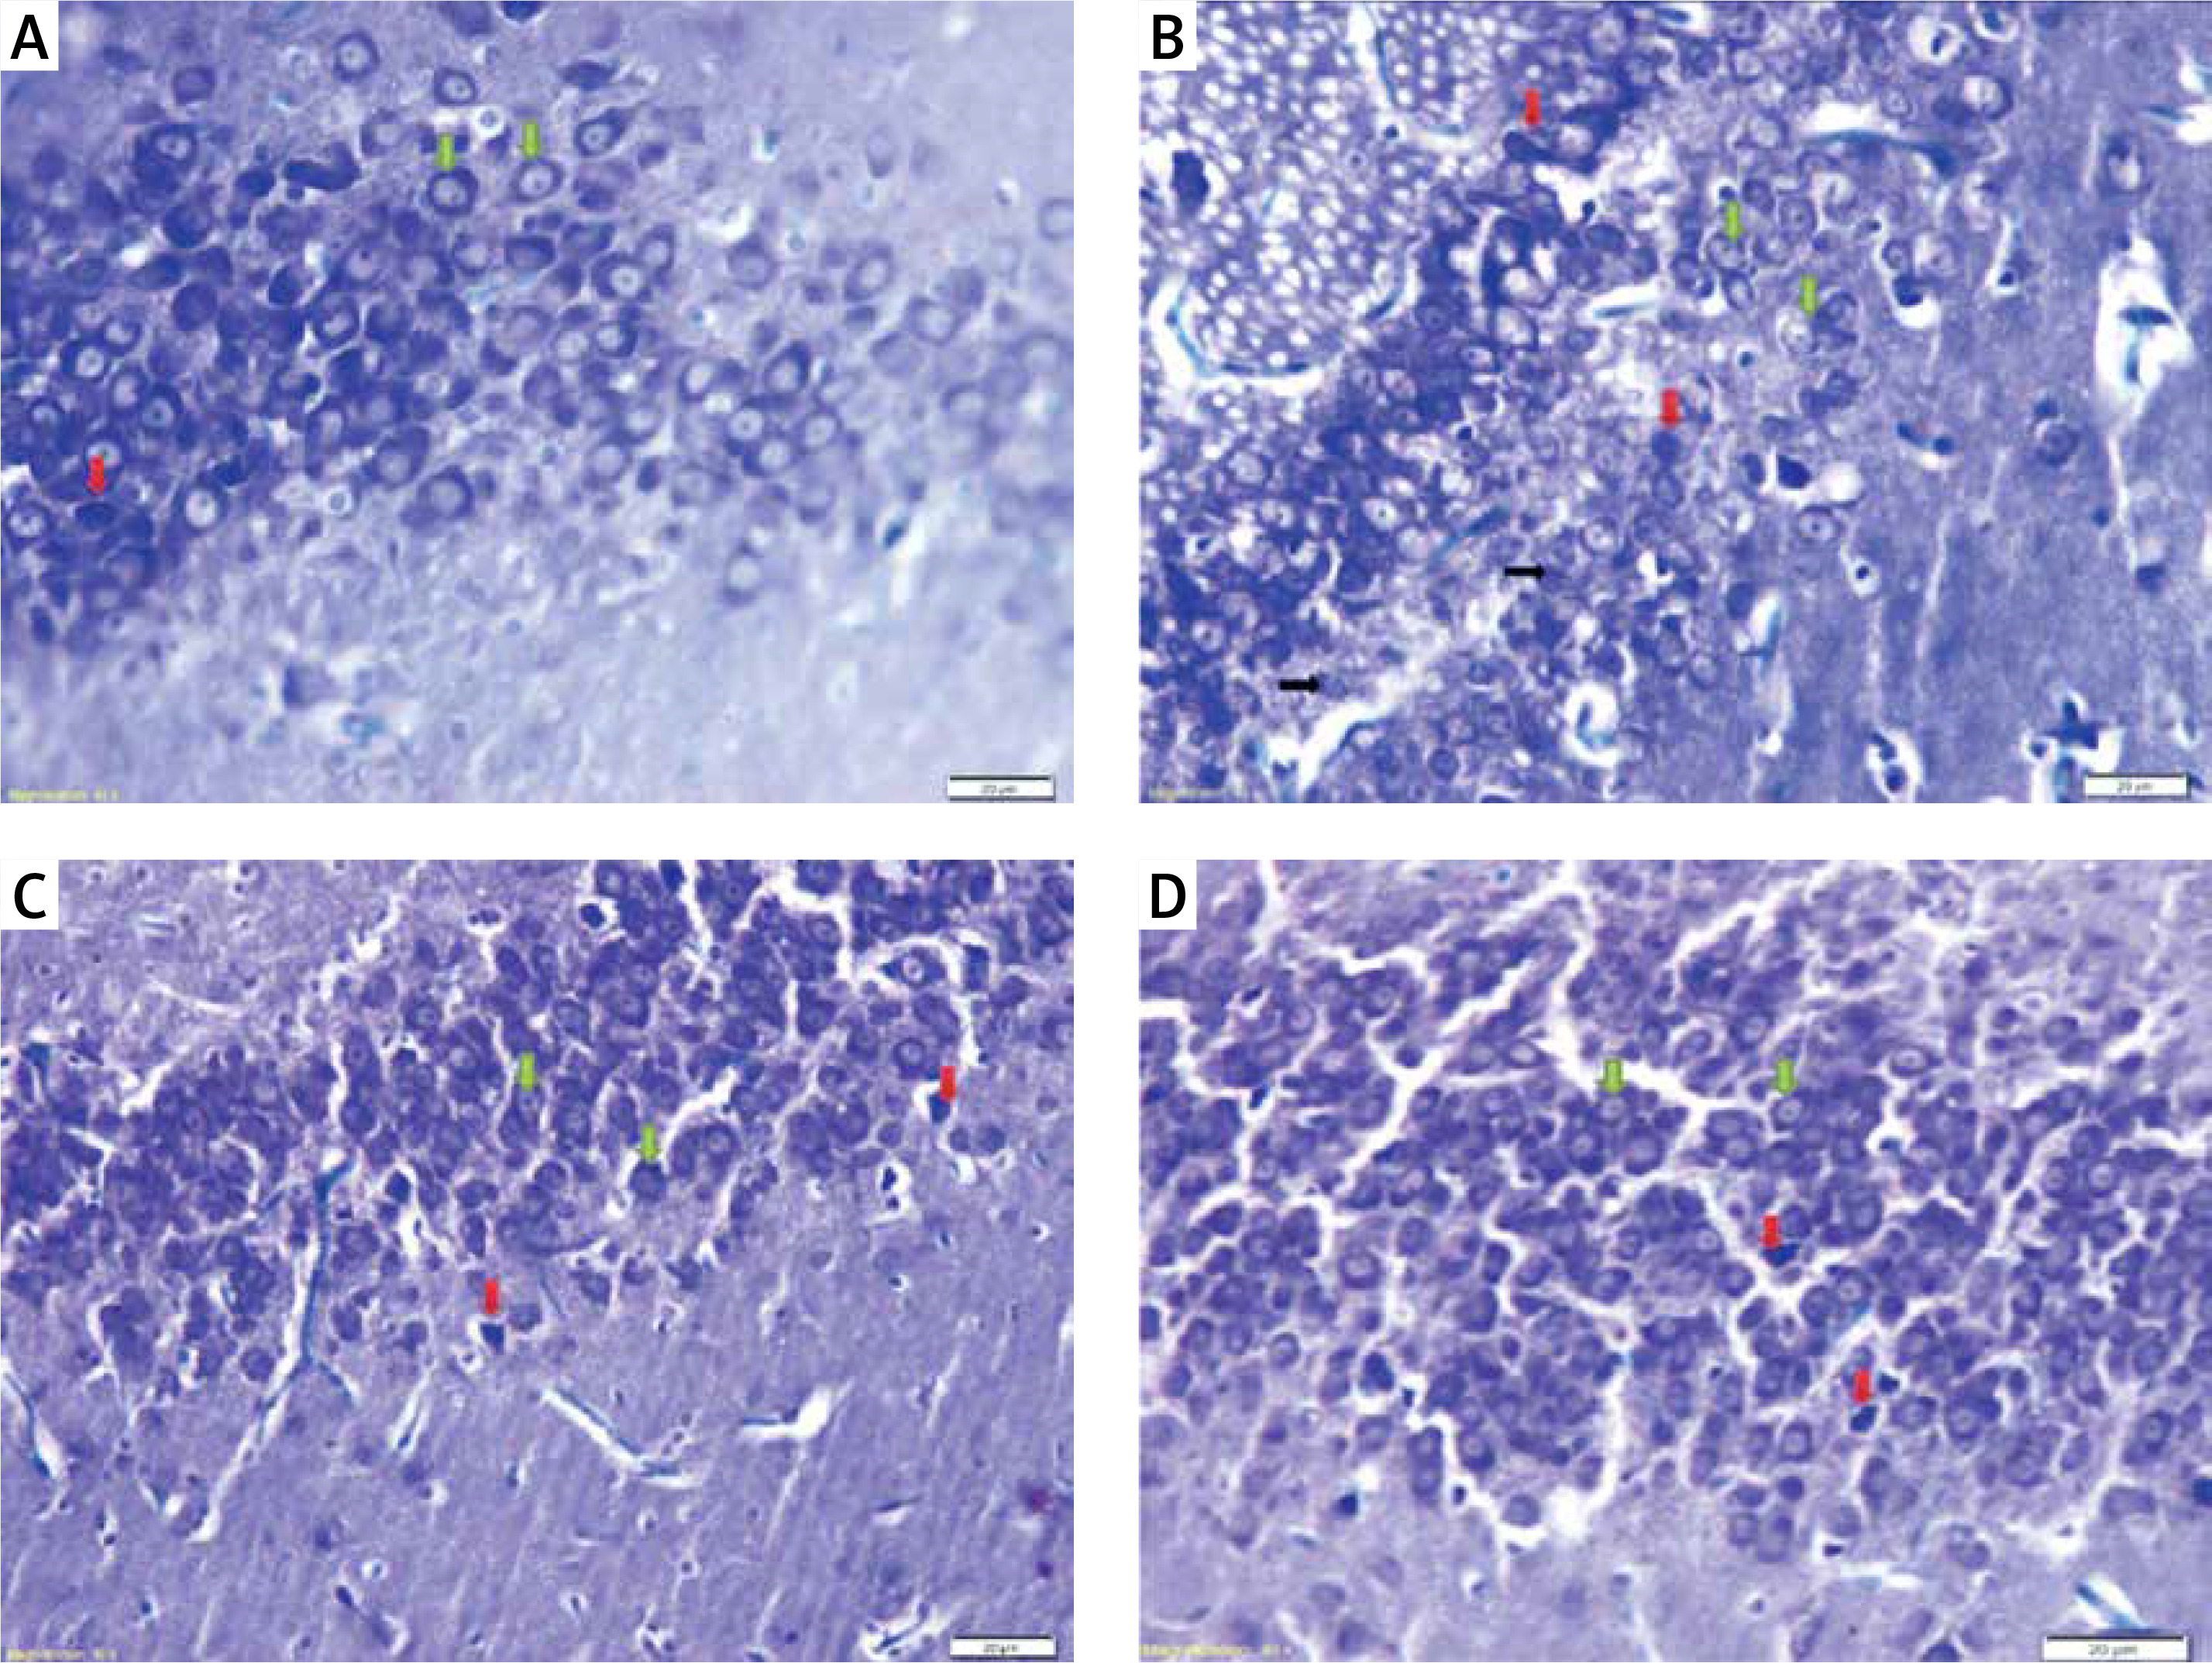
Figure 8
Photomicrograph of sections of the dentate gyrus stained with toluidine blue showing: A – normal thickness of granular cell layer, normal granular cells (green arrows) and dark (apoptotic) cells (red arrow) in control rats. B – normal pyramidal cells (green arrows), degenerated cells (black arrows), apoptotic cells (red arrows) and multiple cavitations in diabetic group. C – normal granular cells (green arrows) and some dark (apoptotic) cells (red arrows) in diabetic exercise group. D – normal granular cells (green arrows) and some apoptotic cells (red arrows) in diabetic metformin-treated group (Toluidine blue, 400×)
Hippocampal dark and degenerated cells
The study also demonstrated a significant greater hippocampal dark and degenerated cells in diabetic (+211.44% and +312.18%, respectively), exercise (+39.64% and +87.82% respectively) and metformin-treated (+79.28% and +115.09% respectively) groups when compared to the control group. Yet, there was a significant fewer dark and degenerated cells in both exercise (–55.16% and –54.43% respectively) and metformin-treated (–42.44% and –47.82% respectively) rat groups compared to the diabetic group. There was no significant difference in the numbers of hippocampal dark and degenerated cells between exercise and metformin-treated groups (Table I, Figures 7 B, C, 8).
Immunohistochemistry
Immunohistochemistry for hippocampal Aβ-42 protein
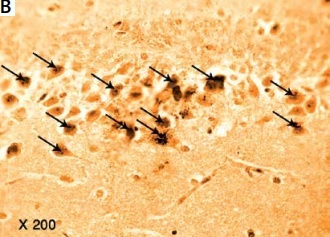
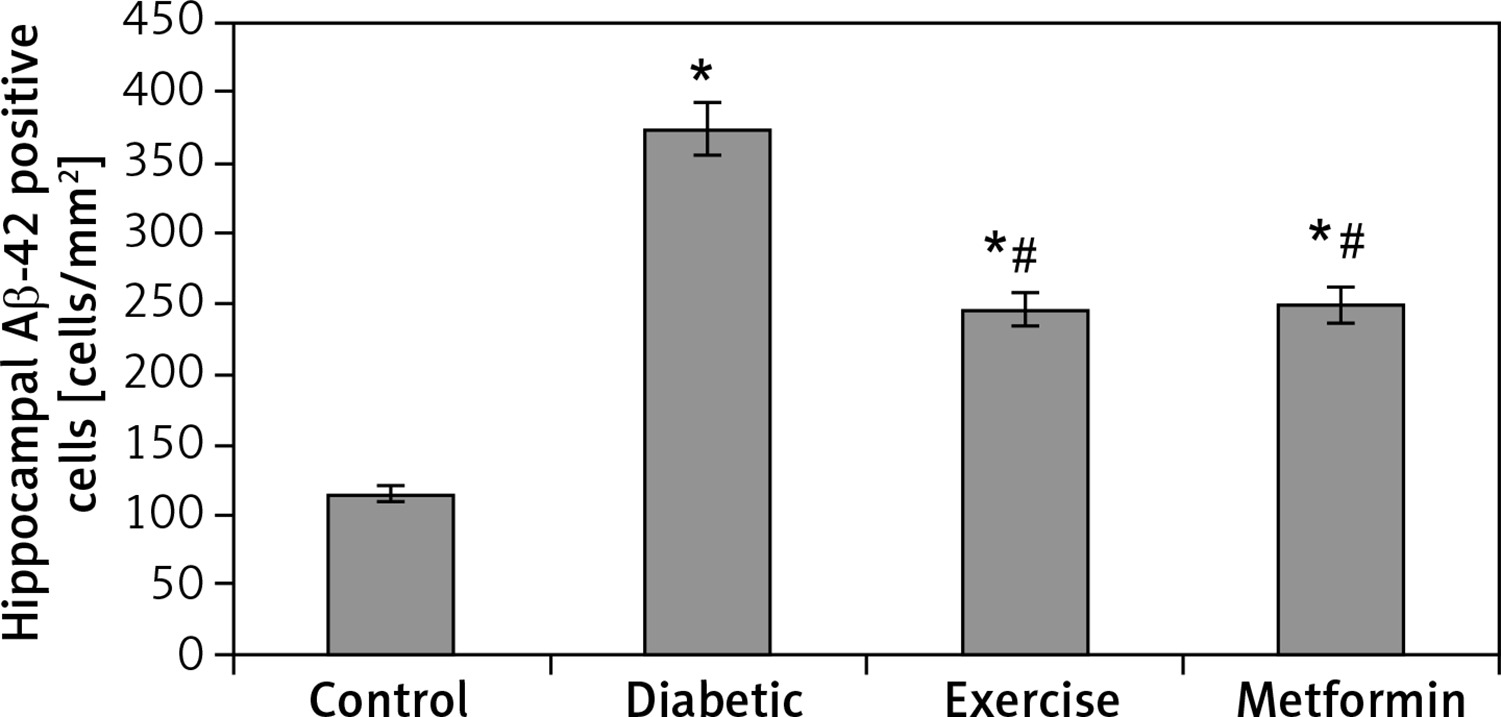
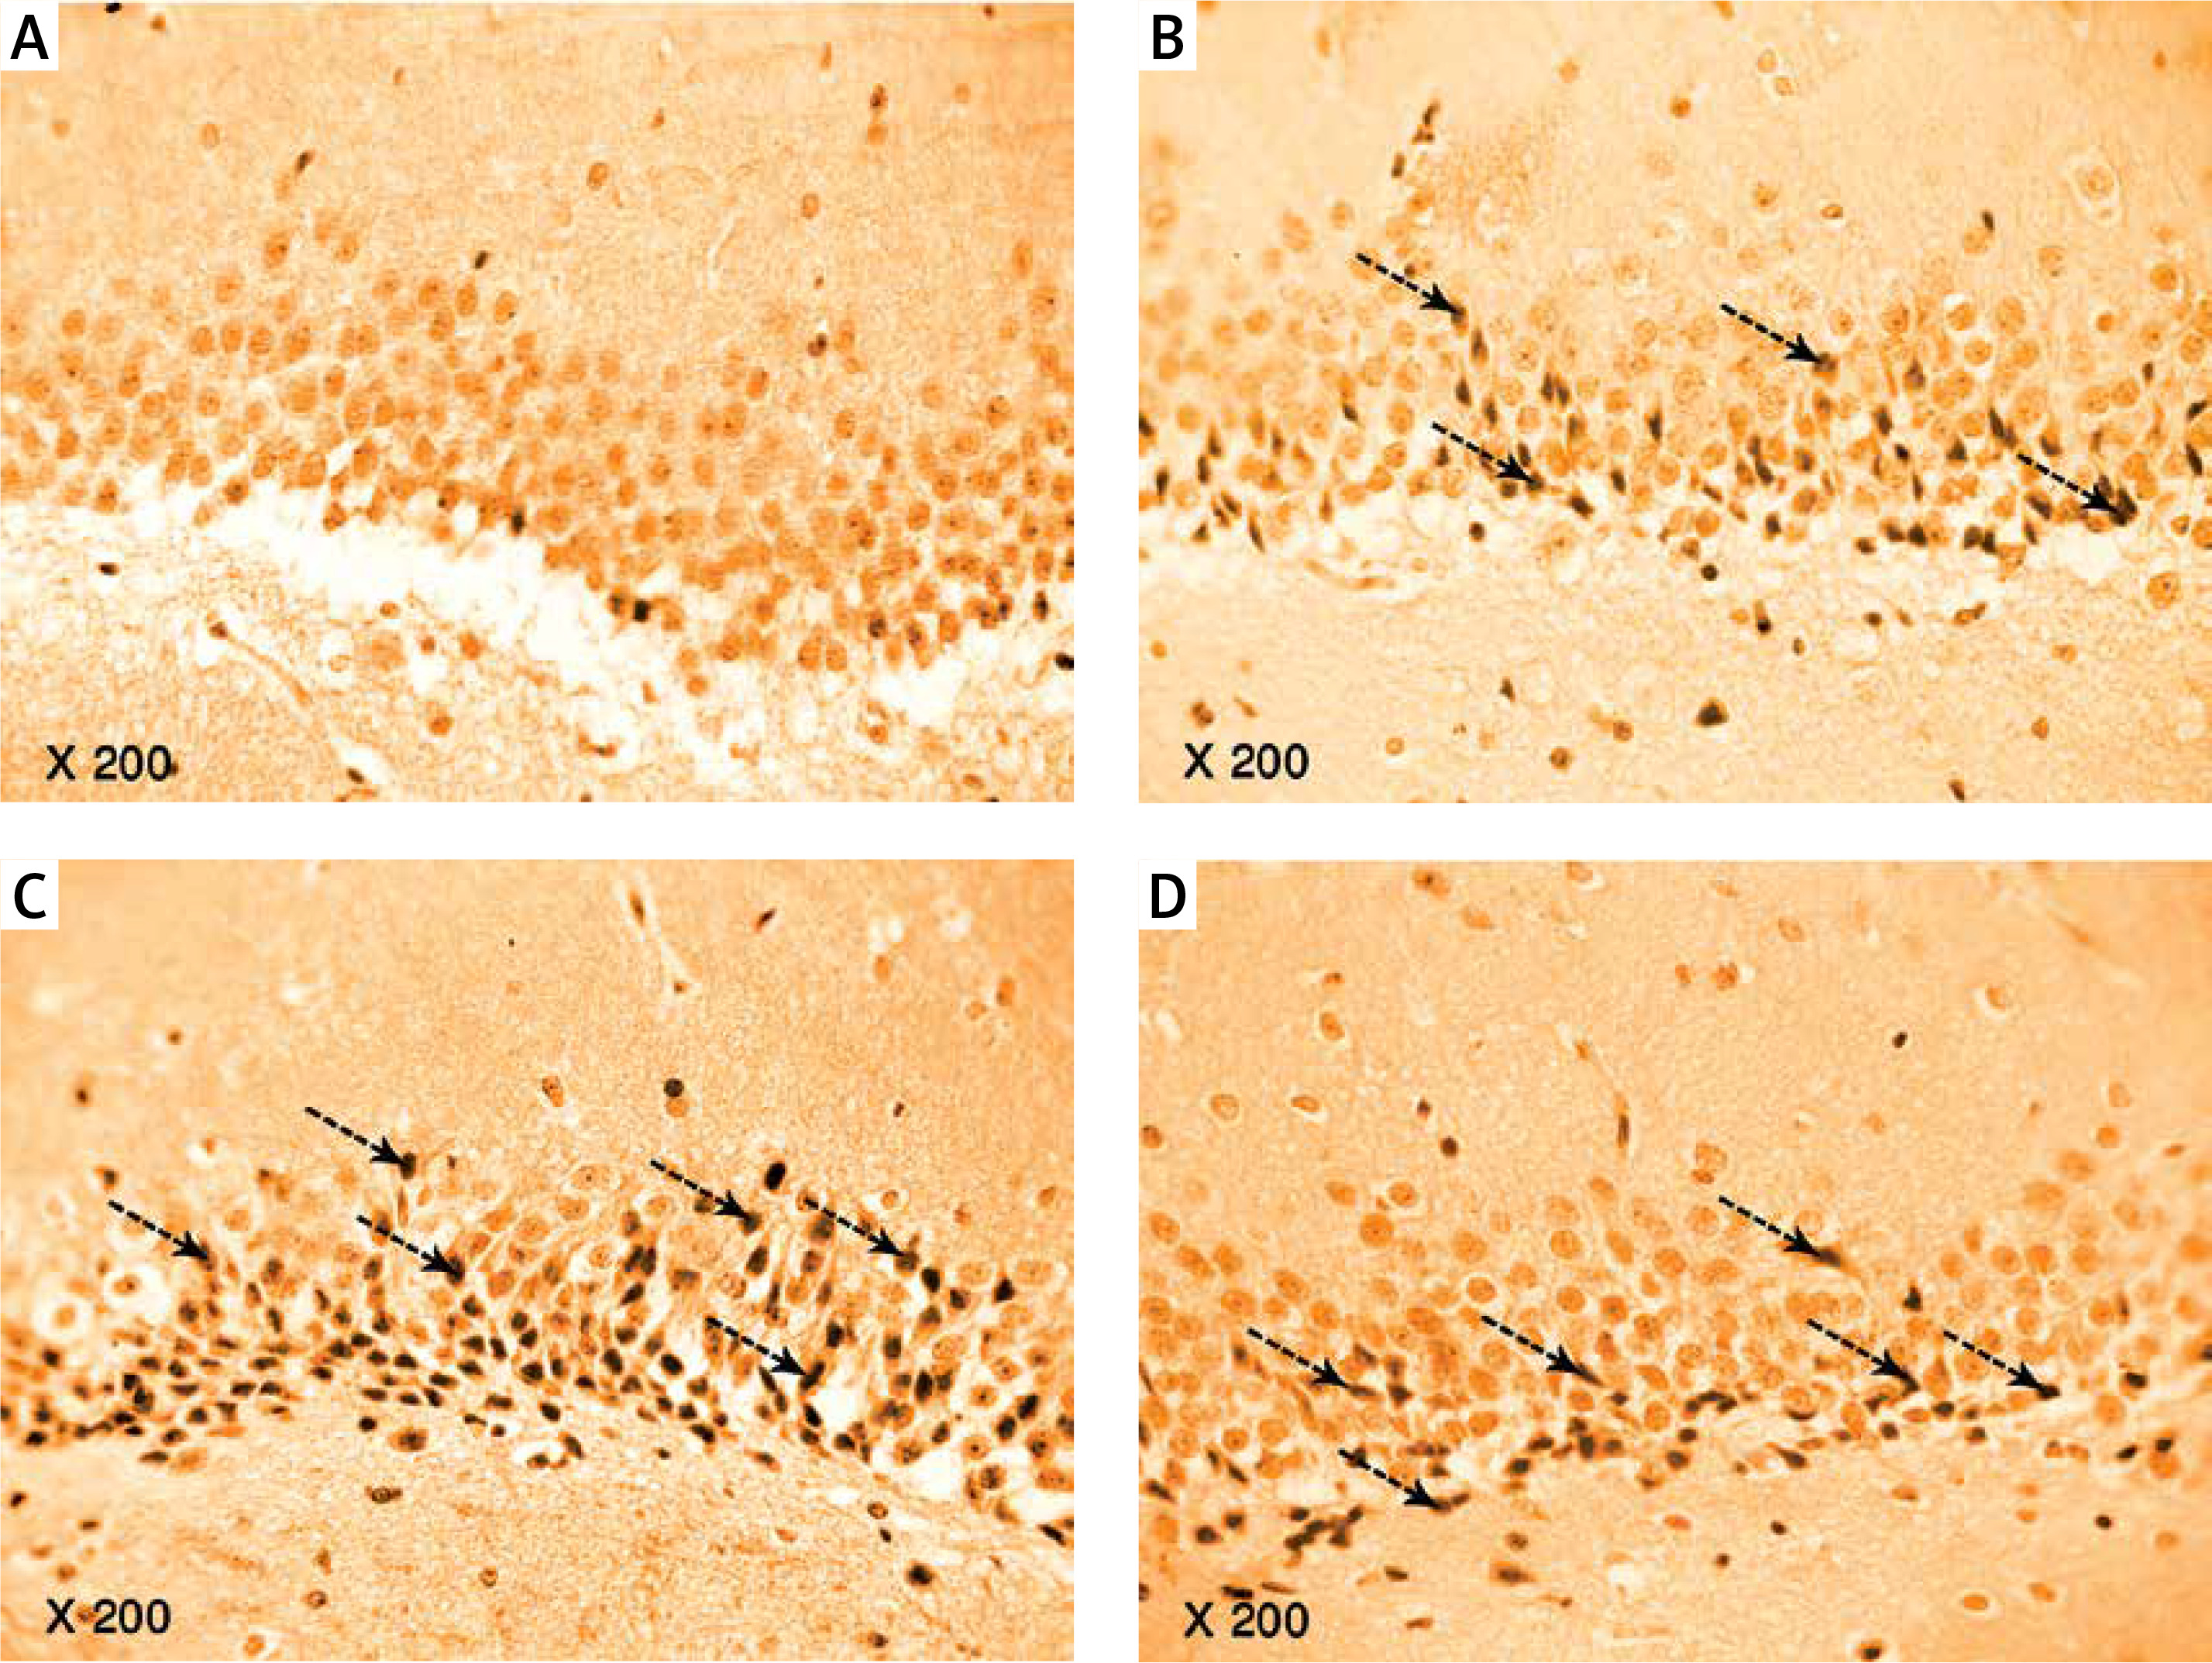
The results of the current study showed a significant greater hippocampal Aβ-42 immuno-histochemistry (IHC) positive cells in diabetic (+224.74%), exercise (+113.6%), and metformin-treated (+116.1%) groups compared to the control group. Excitingly, there was a significant fewer hippocampal Aβ-42 positively staining cells in both the exercise (–34.23%) and metformin-treated (–33.45%) groups when compared to the diabetic group. Noticeably, there was no significant difference in the number of hippocampal Aβ-42 positive cells between exercise and metformin-treated groups (Table I, Figures 9, 10).
Figure 9
Photomicrograph of a cryo-section of the dentate gyrus of A – Control rats, B – Diabetic group, C – Diabetic exercise group, and D – Diabetic metformin-treated group showing positive immunoreactivity of neurons in the form of brown staining of cytoplasmic Aβ-42 (arrows) (Immunohistochemical stain, Counterstained with Hx., 200×)
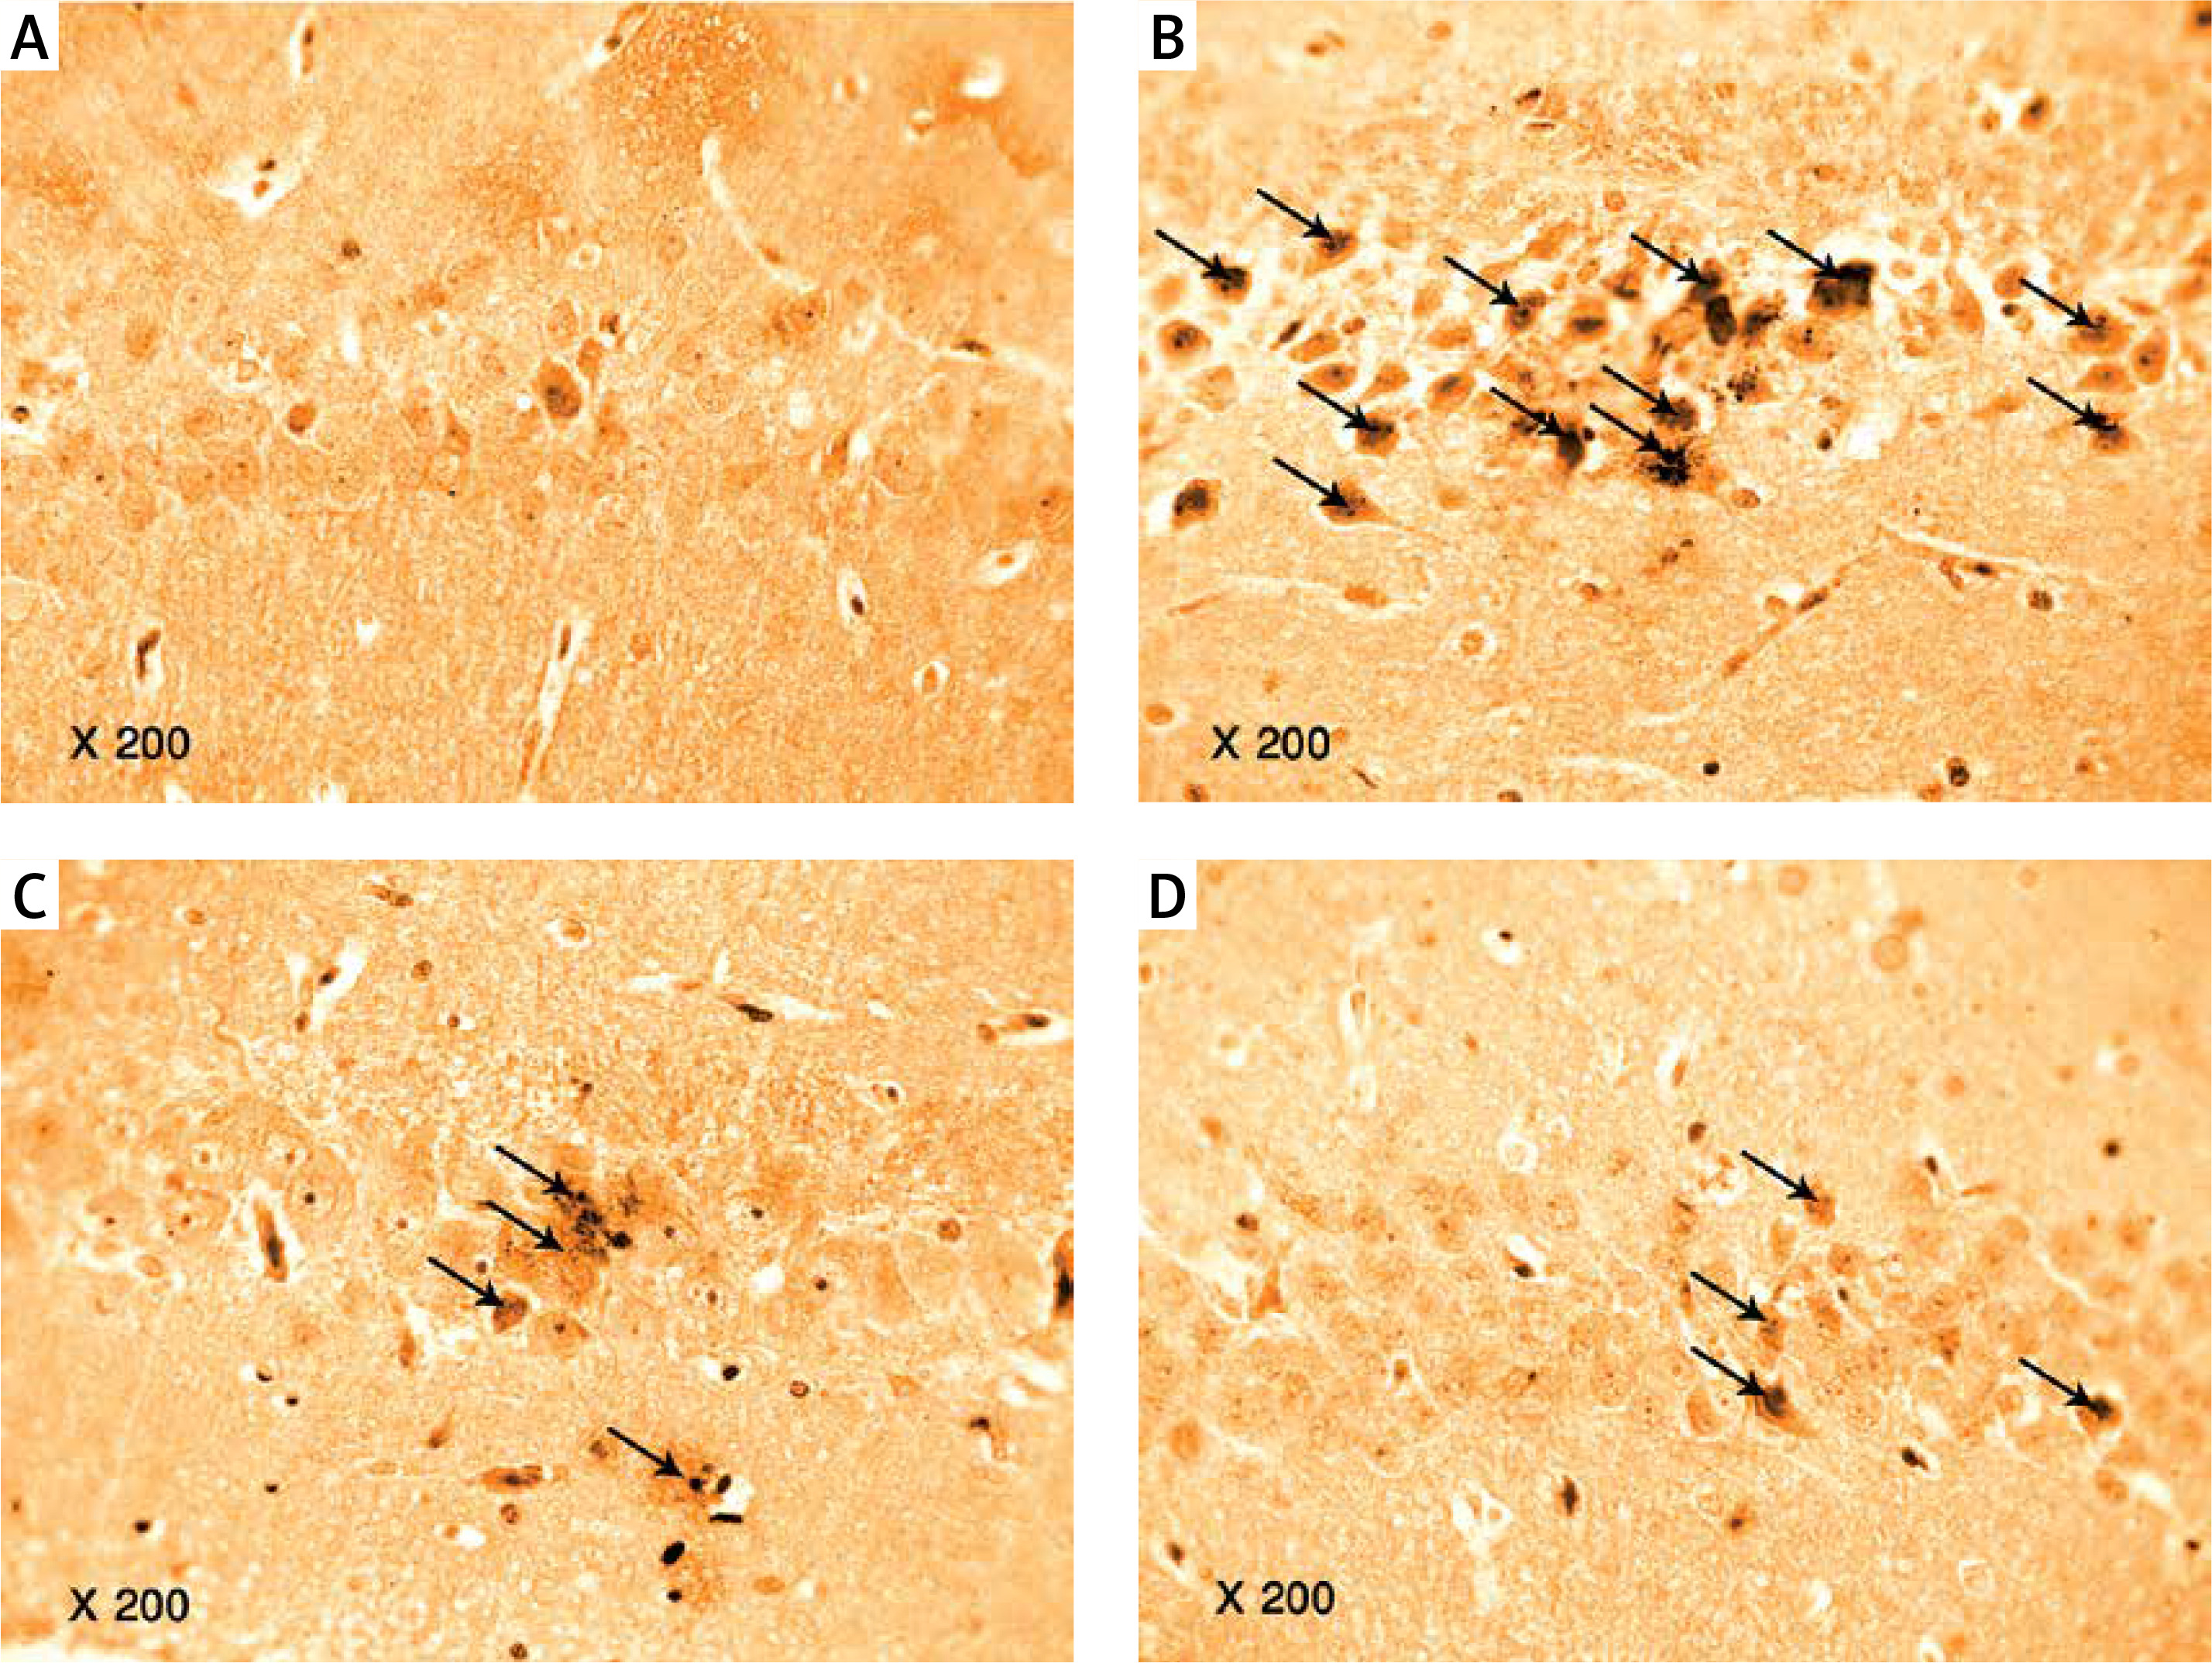
Figure 10
Changes in the mean number of brain Aβ-42 positive cells in the adult rats of the experimental groups
Values are presented as mean ± SD. *Statistically significant compared to the corresponding value in the control group (p < 0.05); #statistically significant compared to the corresponding value in the diabetic group (p < 0.05).
Immunohistochemistry for hippocampal tau protein
The results of our work showed a significant increase in hippocampal tau-positive cells in diabetic (+215.5%), exercise (+126.1%), and metformin-treated (+171.2%) groups compared to the control group. In comparison to the number of tau-positive cells in the diabetic group, the exercise group showed a significant fewer positively staining cells (28.35%), while there was no significant reduction in metformin-treated rats. Interestingly enough, when we compared the metformin-treated group to the exercise group, we found a robust fewer hippocampal tau-positive cells in the brain of the latter group of rats (–19.95%) (Table I, Figures 11, 12).
Figure 11
Changes in the mean number of brain tau-positive cells in the adult rats of the experimental groups
Values are presented as mean ± SD. *Statistically significant compared to the corresponding value in the control group (p < 0.05); #statistically significant compared to the corresponding value in the diabetic group (p < 0.05); $statistically significant compared to the corresponding value in the exercise group (p < 0.05).
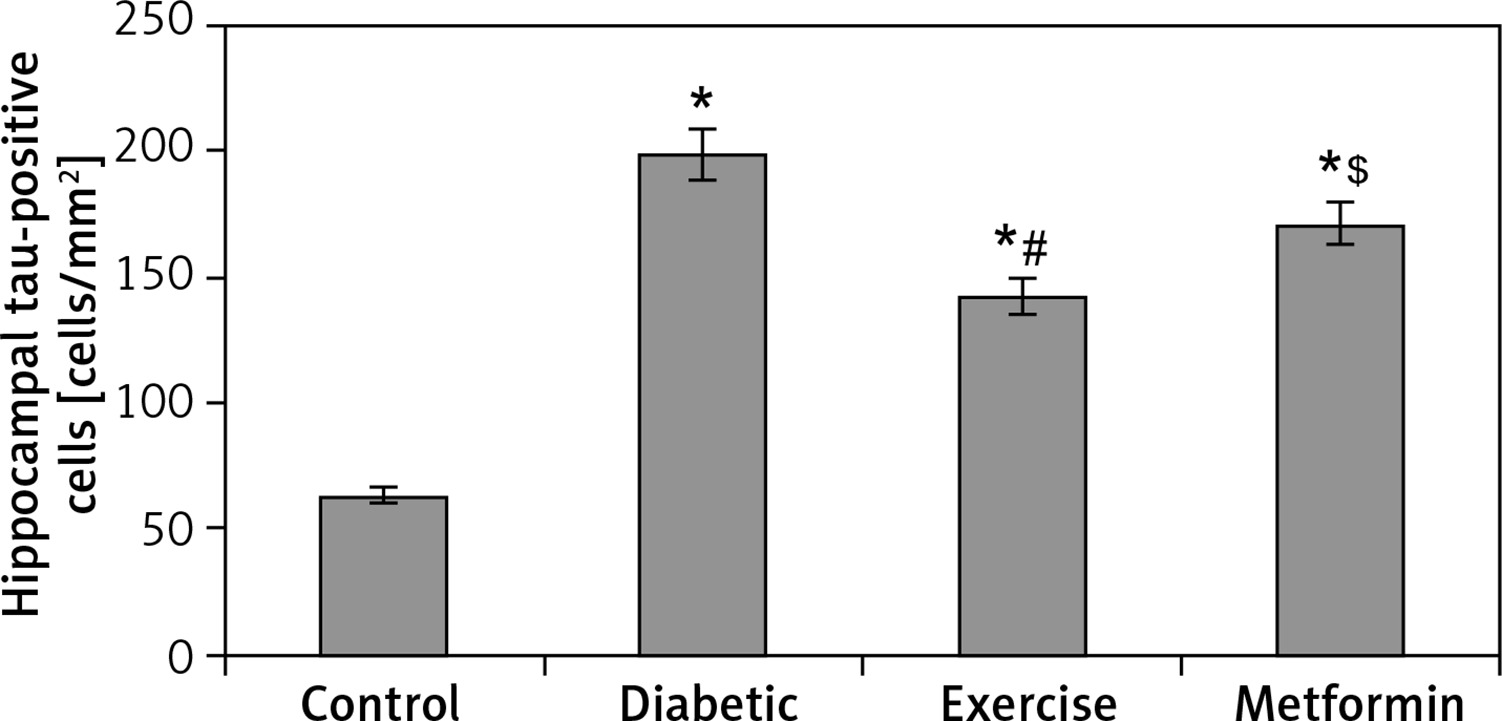
Figure 12
Photomicrograph of a cryo-section of the dentate gyrus of A – Control rats, B – Diabetic group, C – Diabetic exercise group and D – Diabetic metformin-treated group showing positive immunoreactivity of neurons in the form of brown staining of cytoplasmic tau protein (interrupted arrows) (Immunohistochemical stain, Counterstained with Hx., 200×)
Discussion
Type 2 DM is associated with dysregulation of the insulin signaling pathway, reduction of neuronal proliferation and synaptic plasticity, and downregulation of melatonin receptors in rat hippocampus. These insulin-induced molecular dysregulations result in learning and memory deficits, as well as general impairment of cognitive functions [1, 31]. Our results, in line with work published by others, showed a significant impairment of cognitive functions in diabetic albino rats compared to the non-diabetic control group, as measured by lower latency in step-down avoidance test in the diabetic group. Noticeably, this latency was significantly higher in exercise and metformin-treated rats compared to the diabetic group. Exercise has been shown to improve motor and cognitive functions in rats by activating PI3-kinase/protein kinase B pathway [32, 33], which subsequently reduces blood glucose levels and induces hippocampal neuroblast cell proliferation [34].
These effects can be explained by the antioxidant effects of regular exercise, as well as the improved adaptive and cellular responses, together with the increased production of variable neurotrophic and antioxidant substances, most notably, the brain-derived neurotrophic factors, which lead to enhanced synaptogenesis, improved synaptic plasticity, and decreased neuronal apoptosis [35].
Chronic hyperglycemia is directly associated with neuronal apoptosis of the hippocampus, which can be reverted with metformin. Metformin leads to reduced expression of the pro-apoptotic protein Bax and increased expression of the anti-apoptotic protein Bcl2 [36]. Metformin also increased neuronal growth factor, which is vital for the neuronal survival and differentiation of cells in the CNS [37].
The serum and brain glucose levels showed a significant increase in diabetic, exercised, and metformin-treated groups compared to the control group. Fasting insulin levels can strongly stimulate brain glucose metabolism by increasing cellular glucose uptake, enhancing glucose transporters 1, 2, and 4 to get attached to the plasma membrane [38, 39].
The exercised and metformin-treated groups showed a significant decrease in serum and brain glucose compared to the diabetic group. Exercise improves insulin resistance and modulates insulin signaling, leading to increased glucose uptake [40, 41]. It also enhances the cellular processes involved in the skeletal muscle cellular turnover and proliferation, differentiation, motility, survival, and intracellular trafficking through the activation of various intracellular signaling mechanisms, including the AMPK and PI3 kinase/AKT pathways [42].
The results of recent research studies revealed that dietary modification, together with a regular exercise program, can improve certain aspects of pathological consequences associated with DM, including endothelial dysfunction, as well as insulin resistance, a finding supported with several recent aging-related studies. Physical activity can revert insulin resistance through activating IR and IRS proteins, together with the stimulation of insulin-independent signaling pathways [43], leading to the preservation of the β-cell mass and the prevention of islet cell exhaustion [44].
Regular physical exercise induced a significant increase in the pancreatic islet size and insulin secretion [45]. This effect is mediated through adenosine receptor stimulation in pancreatic islets β-cells [46]. Metformin increases β-cell sensitivity to glucose and protects β-cell mass [47]. It reduces insulin-mediated hepatic glucose production and increases peripheral glucose disposal [48]. It stimulates AMPK, which downregulates gluconeogenesis [49]. AMPK activators improve the glucose profile in type 2 DM by suppressing hepatic glucose output [49, 50].
Diabetes mellitus is associated with decreased levels of serum insulin, increased lipolysis in adipose tissue, increased fatty acid content in the liver, and increased synthesis of endogen triglycerides [51]. The serum FFA in diabetic, exercised, and the metformin-treated groups showed a significantly higher level compared to the control group. The diabetic state inhibits the tissue lipase, which increases serum FFA, in turn increasing insulin resistance [52]. The serum FFA in exercised and the metformin-treated groups showed a significantly lower level in comparison to the diabetic group. The fatty acid oxidation is increased during low-intensity exercise and progressively decreases when the exercise intensity is further increased [53]. Moderate intensity exercise led to increased delivery of FFA to the exercising muscles and increased FFA oxidation [54]. Regular physical exercise increased the breakdown of intramuscular triglycerides, delivery of fatty acids to exercising muscles, movement of fatty acids across the muscle membrane, and movement of fatty acids across the mitochondrial membrane [55]. Metformin decreased the levels of TGs, cholesterol, LDL-cholesterol, and FFA [56], through AMPK-mediated inhibition of adipocytes hormone-sensitive lipase [57].
The serum cholesterol showed a significant higher levels in diabetic, exercised, and metformin-treated groups in comparison to the control group. The inhibited activity of lipoprotein lipase caused by insulin resistance elevates levels of total cholesterol in diabetic rats [40]. Controlling blood glucose improves the total cholesterol rise in diabetic patients [58]. In our study, there was a significant lower levels of serum cholesterol in exercised and the metformin-treated groups compared to the diabetic group. Regular exercise had a significant reducing effect on total cholesterol in rats with T2D through activation of the AMPK and PI3K downstream pathway [41].
The diabetic and exercised groups also showed a significant higher levels of the serum TGs compared to the control group. However, serum TGs showed a considerable lower levels in exercised and metformin-treated groups compared to the diabetic group. Exercise decreases plasma and liver TGs by improving the activity of antioxidant enzymes and reduces obesity-induced oxidative stress [59]. Moderate intensity exercise led to TGs breakdown and increased FFA oxidation [55]. Through activation of the AMPK pathway, metformin overcomes the inhibitory effect of diacylglycerol exerted on AMPK, which leads to glucose disposal and serum lipids reduction in turn [60].
The serum LDL showed a significant lower levels in exercised and metformin-treated groups compared to the diabetic group. This can be attributed to the increased activity of lipoprotein phospholipase A2 [61]. Proprotein convertase subtilisin/Kexin 9 (PCSK9) decreases liver absorption and oxidation of LDL. Exercise is associated with reduced levels of PCSK9 and its gene expression [62]. Metformin therapy decreases insulin resistance in skeletal muscles, possibly by inhibiting miR21, which acts as a post-translational regulator. MiR21 was recently linked to insulin resistance in skeletal muscles and adipocytes [63].
The serum HDL showed a significant higher levels in exercised and metformin-treated groups compared to the diabetic group. This finding could be explained by the increased expression of ATP-binding cassette transporter A-1 that has a strong effect on increasing plasma HDL [64] and by increasing insulin sensitivity by metformin [65].
It is well accepted that memory is intimately associated with the plasticity of neuronal synapses in the hippocampus [66]. In our study, the granular cells of the dentate gyrus region were significantly fewer in diabetic, exercised, and metformin-treated groups compared to the control group. However, the numbers of the dark cells, at risk of developing cell death [67] (pyknosis), and degenerated cells were significantly greater in diabetic, exercised, and metformin-treated groups compared to the control group.
The diabetic animals’ hippocampal environment favors apoptosis [68]. Activation of caspases represents an irreversible point in the cell death process. Caspase regulation occurs by extrinsic or intrinsic signaling pathways [69]. There is evidence demonstrating that the experimental diabetes model had hippocampal apoptosis resulting from caspase-dependent mechanisms [70, 71]. Anarkooli et al. found increased caspases-3 activity in the hippocampus of STZ-induced diabetic rats after 8 weeks [72]. The increase in the number of degenerated cells is explained by hyperglycemic-stimulated free radical production via glucose oxidation, nonenzymatic proteins glycation, and glycated proteins’ oxidative degradation [73]. A weak body defense system becomes unable to counteract the enhanced reactive oxygen species (ROS) generation, and an imbalance between ROS and their protection occurs, which damages the cellular organelles and enzymes, and increases lipid peroxidation with insulin resistance development [74, 75].
The hippocampal Aβ-42 and Aβ-42 immunohistochemically stained positive cells showed a significant greater number in diabetic, exercised, and metformin-treated groups compared to the control group. However, there was a significant fewer cells in exercised and metformin-treated groups compared to the diabetic group. The diabetic groups’ considerable greater number of cells could be attributed to the translational upregulation of the β-secretase enzyme and its substrate, amyloid precursor protein [76]. The increased level of plasma lipids is associated with insulin resistance [77]. Exercise decreases β-secretase one protein content and activity with an accompanying decline in AMPK phosphorylation as well as Akt and MAPK phosphorylation, leading to inhibition of the DM-induced Aβ accumulation and memory deficit [78]. Exercise can increase lipoprotein receptor-related protein-1 levels in the hippocampus of AD transgenic mice and reduce the levels of soluble Aβ protein [79]. Metformin-induced AMPK activation may inhibit the downstream mTOR signaling, thus promoting autophagy and lysosomal degradation of Aβ [80]. Metformin also enhances AMPK expression through increased transcript levels of both Bcl-2 and CREP protein [81]. Metformin, by AMPK activation, provides phosphorylation of the PGC1α protein, which can control anti-apoptotic genes that are inhibited by Aβ-42 [82].
The hippocampal tau-positive cells showed a significant greater numbers in diabetic, exercised, and metformin-treated groups compared to the control group. Diabetes increased tau phosphorylation due to insulin resistance through IRS-1, extracellular signal-related kinase (ERK)/MAPK, and PI3 kinase/Akt pathways [83]. Cerebral insulin resistance leads to over-activation of the important tau phosphorylation-regulator glycogen synthase kinase-3β, which was normalized by the administration of intranasal insulin normalized cerebral glycogen synthase kinase 3 (GSK-3) levels and reduced cerebrospinal fluid (CSF) tau levels [84].
The results also showed that there was a significant fewer number of tau-positive cells in the exercised group compared to both the diabetic and metformin-treated groups. Exercise suppresses hyperphosphorylation of tau in the hippocampus by decreasing GSK-3β activity through PI3 kinase/Akt pathway activation [1]. It also increases Wnt3 expression and suppresses GSK-3β expression by activating the Wnt signaling pathway, which causes inhibition on GSK-3β expression [51].
In conclusion, treadmill exercise training and metformin, besides their metabolic effects, caused regression of biomarkers of Alzheimer’s disease, protecting the hippocampus functions against DM-induced memory deterioration. This effect was achieved mostly through upregulating the insulin signaling pathways in the brain. Further investigations are required to emphasize such effects and to find out new possible mechanisms.