Revised: October 24, 2012
Accepted: January 17, 2013
Published online: January 28, 2013
AIM: To evaluate different promising magnetic resonance imaging (MRI) methods at 7.0 Tesla (T) for the pre-stereotactic visualization of the zona incerta (ZI).
METHODS: Two neuroradiologists qualitatively and quantitatively examined T2-turbo spin-echo (T2-TSE), T1-weighted gradient-echo, as well as FLASH2D-T2Star and susceptibility-weighted imaging (SWI) for the visualization of the ZI at 7.0 T MRI. Delineation and image quality for the ZI were independently examined using a 6-scale grading system. Inter-rater reliability using Cohen’s kappa coefficient (κ) were assessed. Contrast-to-noise ratios (CNR), and signal-to-noise ratios (SNR) for the ZI were calculated for all sequences. Differences in delineation, SNR, and CNR between the sequences were statistically assessed using a paired t-test. For the anatomic validation the coronal FLASH2D-T2Star images were co-registered with a stereotactic atlas (Schaltenbrand-Wahren).
RESULTS: The rostral part of the ZI (rZI) could easily be identified and was best and reliably visualized in the coronal FLASH2D-T2Star images. The caudal part was not definable in any of the sequences. No major artifacts in the rZI were observed in any of the scans. FLASH2D-T2Star and SWI imaging offered significant higher CNR values for the rZI compared to T2-TSE images (P > 0.05). The co-registration of the coronal FLASH2D-T2Star images with the stereotactic atlas schema (Schaltenbrand-Wahren) confirmed the correct localization of the ZI in all cases.
CONCLUSION: FLASH2D-T2Star imaging (particularly coronal view) provides the reliable and currently optimal visualization of the rZI at 7.0 T. These results can facilitate a better and more precise targeting of the caudal part of the ZI than ever before.
- Citation: Kerl HU, Gerigk L, Brockmann MA, Huck S, Al-Zghloul M, Groden C, Hauser T, Nagel AM, Nölte IS. Imaging for deep brain stimulation: The zona incerta at 7 Tesla. World J Radiol 2013; 5(1): 5-16
- URL: https://www.wjgnet.com/1949-8470/full/v5/i1/5.htm
- DOI: https://dx.doi.org/10.4329/wjr.v5.i1.5
Deep brain stimulation (DBS) is an accepted neurosurgical technique for the treatment of many neurological and psychiatric disorders, such as Parkinson’s disease (PD), essential tremor (ET), dystonia[1-4]. The subthalamic nucleus (STN) represents the commonly chosen target site to suppress resting tremor in patients with PD[1,5,6]. Despite the improvements in motor function, several clinical trails have yielded information about negative limbic effects of STN DBS, including depression, apathy, and decreased cognitive function[7,8].
Recent studies, however, have reported that the most effective contact of a quadripolar DBS lead (contact 3 in DBS of the STN) lies dorsal/dorsomedial to the STN, in the region of the zona incerta (ZI)[9-11].
The ZI, an embryological derivate of the ventral thalamus, is a small horizontally elongated area of grey matter cells in the subthalamic region of the mesencephalon. The nucleus gains increasing importance as an alternative target for the treatment with DBS of various neurological and psychiatrical disorders including ET and PD[12,13]. It is located at the base of the dorsal thalamus and separates the lenticular fasciculus from the thalamic fasciculus (“field H1 and H2 of Forel”)[14,15]. The nucleus is a distinct heterogeneous structure with up to 20 different types of neurochemically defined cells[16]. Functionally the ZI is divided into two main parts (rostral and caudal). Each is thought to have several physiological functions: The rostral component (rZI), attributed to the visceral control[17], extends over the dorsal and medial surface of the STN separated by the pallidofugal fibres (PFF) and crossing the internal capsule (Ci). The caudal part (cZI) or the motor component is located posteriomedial to the STN and extends behind the prelemniscal radiation[18]. Ventrocaudally to the ZI lies the substantia nigra[19,20], laterally the Ci, and dorsomedially the red nucleus[21,22].
A recent study by Burrows et al[23] comparing DBS of the STN and the ZI provided similar findings resulting in sustained motor benefit with less limbic side effects, including anxiety and self-reported depression, for ZI stimulation. Furthermore, the stimulation of the cZI[18,24,25] seems to be superior compared to the stimulation of the STN in improving contralateral parkinsonism[26]. Moreover, a prospective study suggested that bilateral stimulation of the cZI nucleus is effective in suppressing tremors of various etiologies of both the distal and proximal extremities[25].
Previous studies including magnetic resonance imaging (MRI) studies up to 1.5 T showed that the visualization of the ZI is unsatisfactory as the small nucleus is hard to distinguish from the surrounding vital structures in the subthalamic region[27,28]. Therefore, different indirect targeting approaches have been established. These indirect techniques use proportional calculation schemata, relative to a line connecting the anterior and posterior commissures and other more closely located landmarks as the red nucleus and the STN [measured by ventriculography, computed tomography (CT) or MRI], estimating the position of the target structure by empirical values[29-31]. Similarly, atlas-derived maps co-registered to the magnetic resonance images are used to more accurately delimit the localization of the target area[31,32]. Apart from pre-operative imaging, intra-operative electrophysiological function mapping is used to confirm the exact stereotactic position[33,34].
In contrast, the direct targeting method employs stereotactic pre-operative MRI for the visualization and localization of the target structure. As the subthalamic region varies considerably in position and size[35,36], the individually optimal electrode position can be achieved.
Lately published studies of 7.0 T MRI for deep brain structures provided initial promising results due to an increase in tissue contrast compared to lower field strengths[27,37]. Besides the most frequently used heavily T2-weighted fast spin-echo[20,31,38] new sequences including quantitative T1 and T2 imaging[39,40], T2* mapping[41-43] and susceptibility-weighted imaging (SWI)[44], have been proposed to improve the visibility of the target structures. For the ZI no respective data exists. The aim of this study is to compare different promising MRI methods at 7.0 T (sequence and orientation) for the direct visualization of the ZI.
Nine healthy volunteers (five male, four female) with a mean age of twenty-five years (range 21-28 years) were enrolled in this study.
Informed consent was obtained from all participants. The study was approved by the local research ethics committee. The approval also covers the analysis of other brain regions of the volunteers not addressed in this study.
For MR imaging of all subjects a whole body 7.0 T MRI system (Magnetom, Siemens Healthcare, Erlangen, Germany) with a 24 channel receive and single channel transmit head coil (Nova Medical, Wilmington, MA, United States) was used. The following sequences were acquired: T2-turbo spin-echo (T2-TSE), T1-weighted gradient-echo (T1-GRE), T2-star-weighted two-dimensional fast low angle shot MRI (FLASH2D-T2Star) and SWI. The specific imaging parameters used are summarized in Table 1.
| TR (ms) | TE (ms) | Flip angle (°) | FOV (mm) | Matrix | Resolution (mm) | Slice thickness (mm) | NoA | Receiver bandwidth (Hz/pixel) | Scan time (min) | Slice orientation | |
| T1-GRE | 6.6 | 2.38 | 12 | 230 × 230 | 448 × 448 | 0.513 × 0.513 | 0.649 | 1 | 310 | 06:38 | Sagittal |
| T2-TSE tra | 12 000 | 57 | 90 | 178 × 220 | 624 × 768 | 0.286 × 0.286 | 2 | 1 | 100 | 04:37 | Axial |
| FLASH2D-T2Star tra | 504 | 17 | 30 | 176 × 176 | 704 × 704 | 0.25 × 0.25 | 2 | 1 | 40 | 05:55 | Axial |
| FLASH2D-T2Star cor | 504 | 17 | 30 | 176 × 176 | 704 × 704 | 0.25 × 0.25 | 2 | 1 | 40 | 05:55 | Coronal |
| FLASH2D-T2Star sag | 504 | 17 | 30 | 176 × 176 | 704 × 704 | 0.25 × 0.25 | 2 | 1 | 40 | 06:49 | Sagittal |
| SWI cor | 13.3 | 21 | 5 | 149 × 199 | 288 × 384 | 0.52 × 0.52 | 0.5 | 2 | 120 | 13:21 | Coronal |
Slice thickness was manually adapted to completely cover the area of interest while maintaining an adequate acquisition time. Axial and coronal views of the isotropic T1-GRE were reconstructed in-plane with a slice thickness of 0.51 mm. Axial and sagittal orientation of the SWI images were reconstructed in-plane with a slice thickness of 0.52 mm. In addition, minimum intensity projections (MIP) of the SWI (SWI-MIP) datasets were reconstructed with a slice thickness of 4.0 mm (coronal), respectively 4.16 mm (axial/sagittal).
Two neuroradiologists independently analyzed the delineation of the ZI to the adjacent structures for each dataset. The borders of the ZI were defined on the basis of anatomical and MRI data[21,26].
Viewing and analysis of the acquired datasets were performed electronically on a DICOM workstation using OsiriX Imaging Software (http://www.osirix-viewer.com/index.html). Raters were allowed to freely adjust window/level settings.
The delineation of the ZI vs the Ci, the ZI vs the STN, and the ZI vs the PPF was assessed on the basis of each reader’s own professional judgment using a 6-point scale (5 - excellent delineation; 4 - good delineation; 3 - moderate delineation; 2 - poor delineation; 1 - no delineation; 0 - no image/not evaluable).
The image quality of each sequence regarding artifacts was determined by consensus of the two readers using a 6-point grading system. The grading was as follows: 5 - no artifacts; 4 - minimal artifacts; 3 - moderate artifacts; 2 - significant artifacts; 1 - massive artifacts; 0 - no image/not evaluable.
Quantitative analyses [contrast-to-noise ratios (CNR) and signal-to-noise ratios (SNR)] for the ZI were assessed for the acquired sequences by using the Osirix-software. Each dataset was carefully scrutinized to identify the sections with the structures of interest.
The mean signal intensity (SI) was measured for all datasets, considering intra-individual identical localization, by manually placing a region of interest (ROI) of approximately 0.05 cm2 within the ZI and a ROI of approximately 0.1 cm2 within the Ci. The average standard deviation of noise was determined by manually placing a ROI (approximately 2.0 cm2) outside the brain and away from phase-encoding artifacts. Identical ROI sizes were used for all corresponding images. ROI measurements were repeated three times and average values were taken.
CNR and SNR for the ZI were computed for each of the nine participants (18 cerebral hemispheres) according to the equations:
CNR = (SIZI-SICi)/σ,
SNR = SIZI/σ,
where SIZI specifies the measured mean signal within the ZI, SICi the mean signal value in the internal capsule, and σ the average standard deviation of the noise.
To allow an easy clinical implementation we used pulse sequences from the vendor and adapted pixel size and slice thickness. In general, SNR and CNR are linear proportional to the slice thickness and pixel size[45]. Hence, to additionally obtain geometrically comparable SNRs and CNRs the directly measured values were adjusted to a voxel of 1 mm3× 1 mm3× 1 mm3. This geometrical correction of the SNR and CNR values has been used previously to quantitatively compare various sequences differing in voxel size[46].
Statistical calculations were conducted using the Statistical Package for the Social Sciences software (SPSS 19, IBM Corporation, Somers, NY, United States). Cohen’s kappa coefficient (κ) was used to assess the inter-rater reliability for the delineation of the ZI[47].
Kappa values were categorized as < 0 indicating no agreement, 0-0.20 as slight, 0.21-0.40 as fair, 0.41-0.60 as moderate, 0.61-0.80 as substantial and 0.81-1 as almost perfect agreement[48,49].
A P value less than 0.05 will be considered as statistically significant. Differences in delineation, SNR and CNR between the sequences were statistically evaluated using a paired t-test.
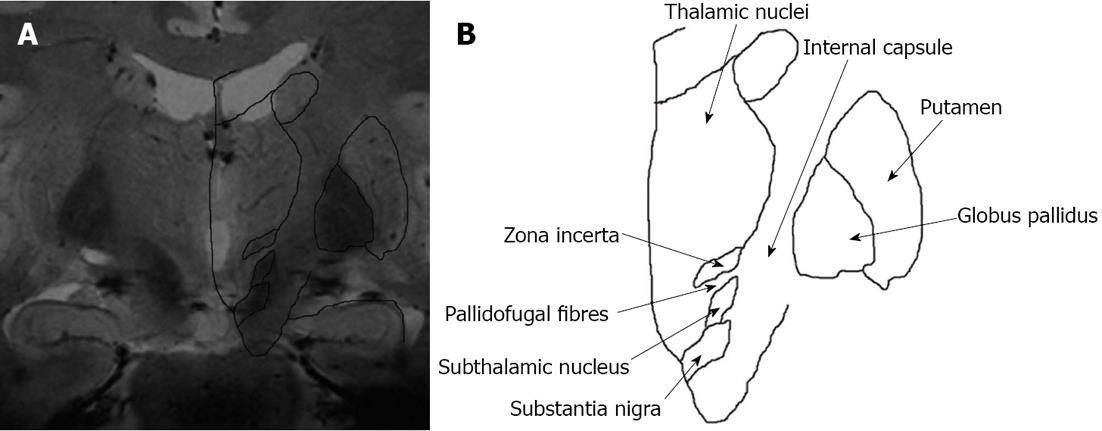
The coronal a FLASH2D-T2Star image at the level of the ZI, approximately 2 mm anterior to the midcommissural point, was co-registered with the corresponding digitized coronal section of the Schaltenbrand and Wahren atlas for stereotaxy of the human brain (plate 27)[21]. For the overlay distinct anatomic structures in the MR image (e.g., lateral wall of the third ventricle, and globus pallidus) were used. The position of the ZI was judged to be within or outside of the limits of the atlas schema.
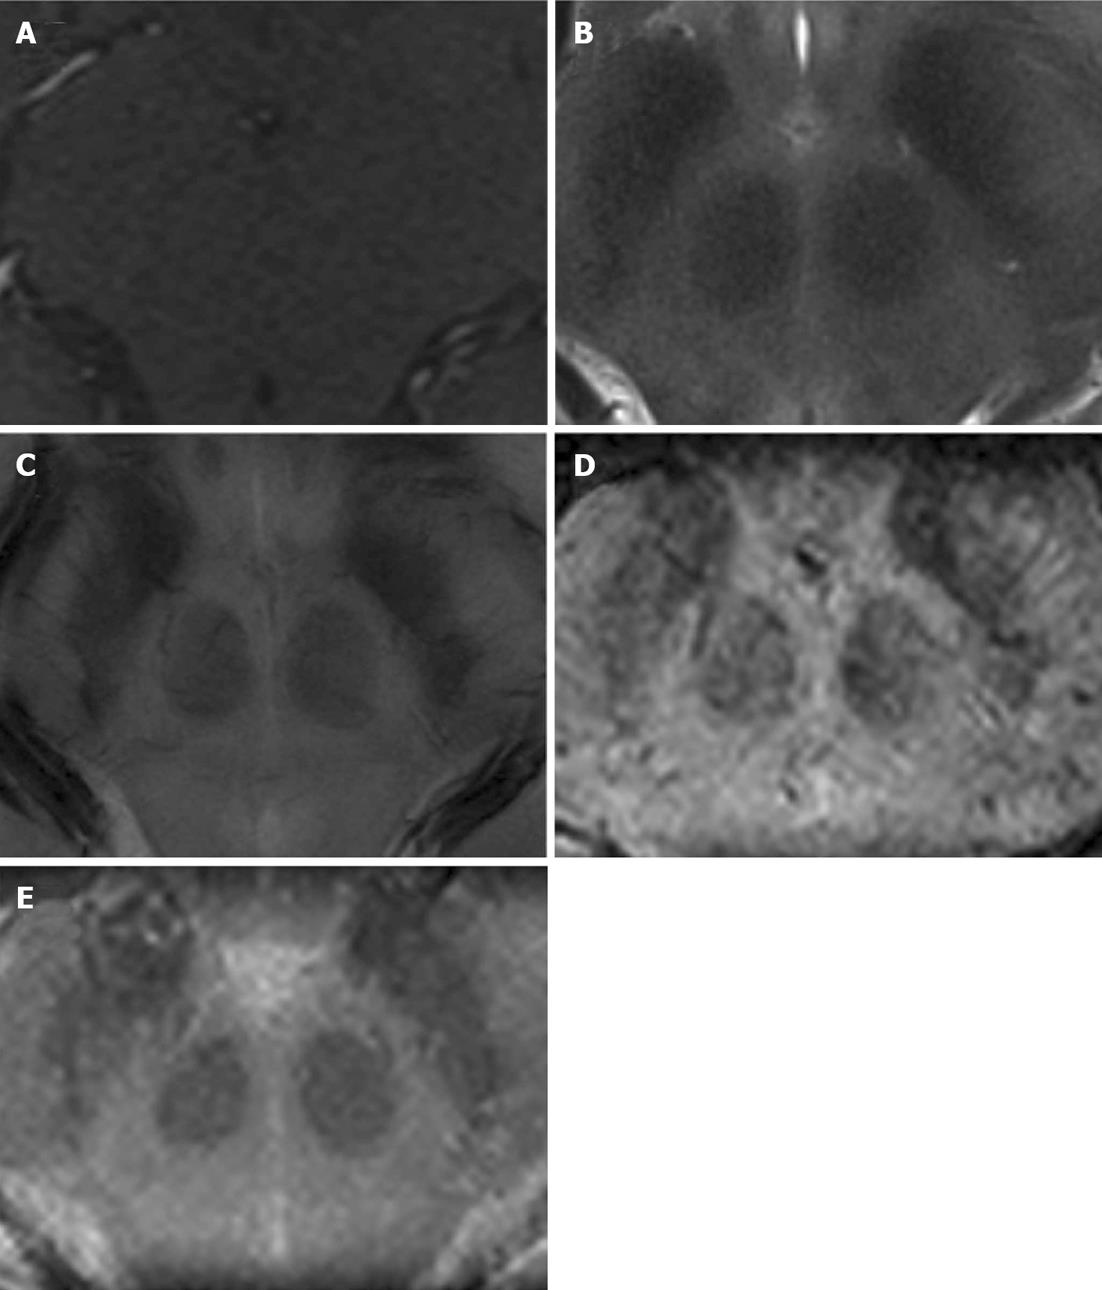
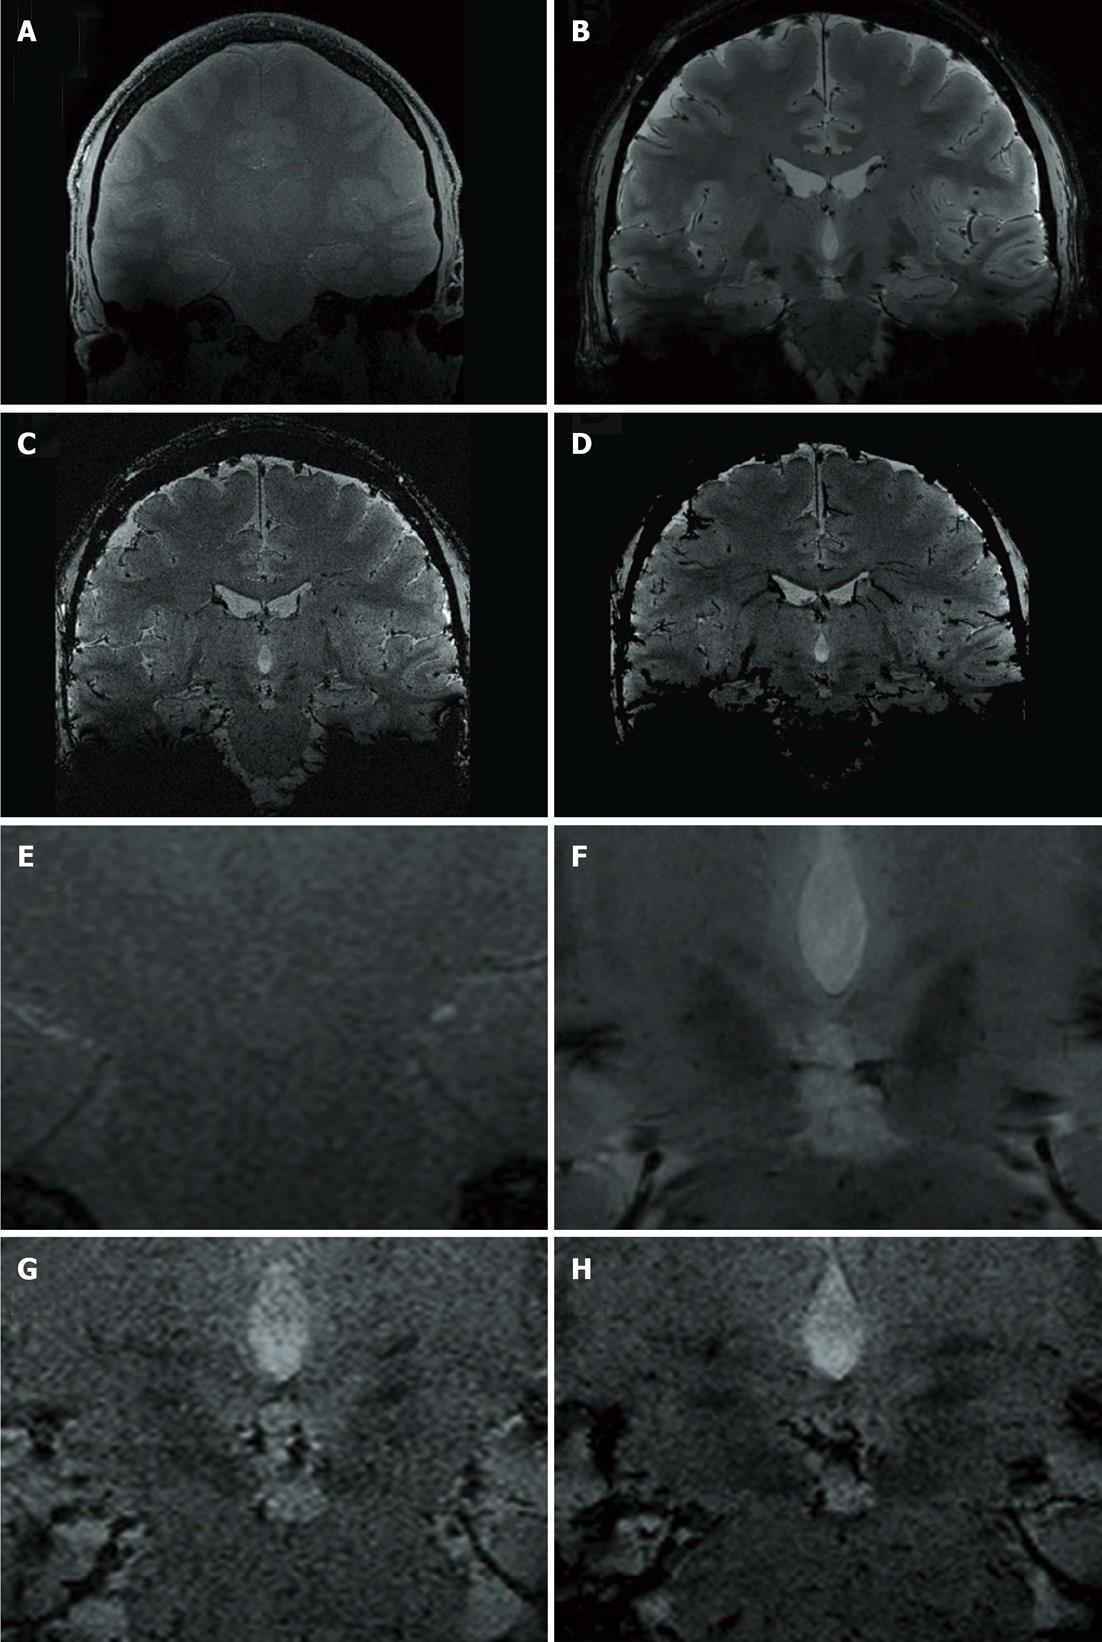
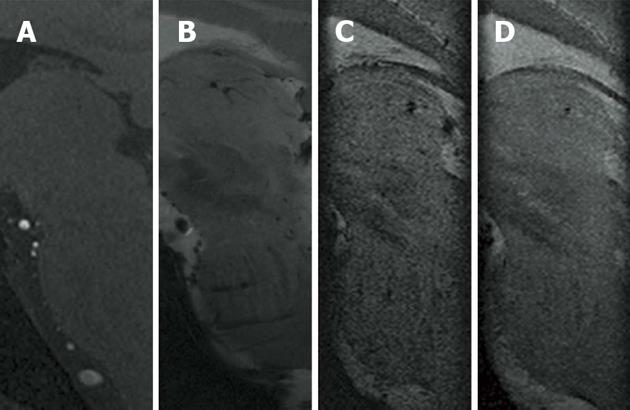
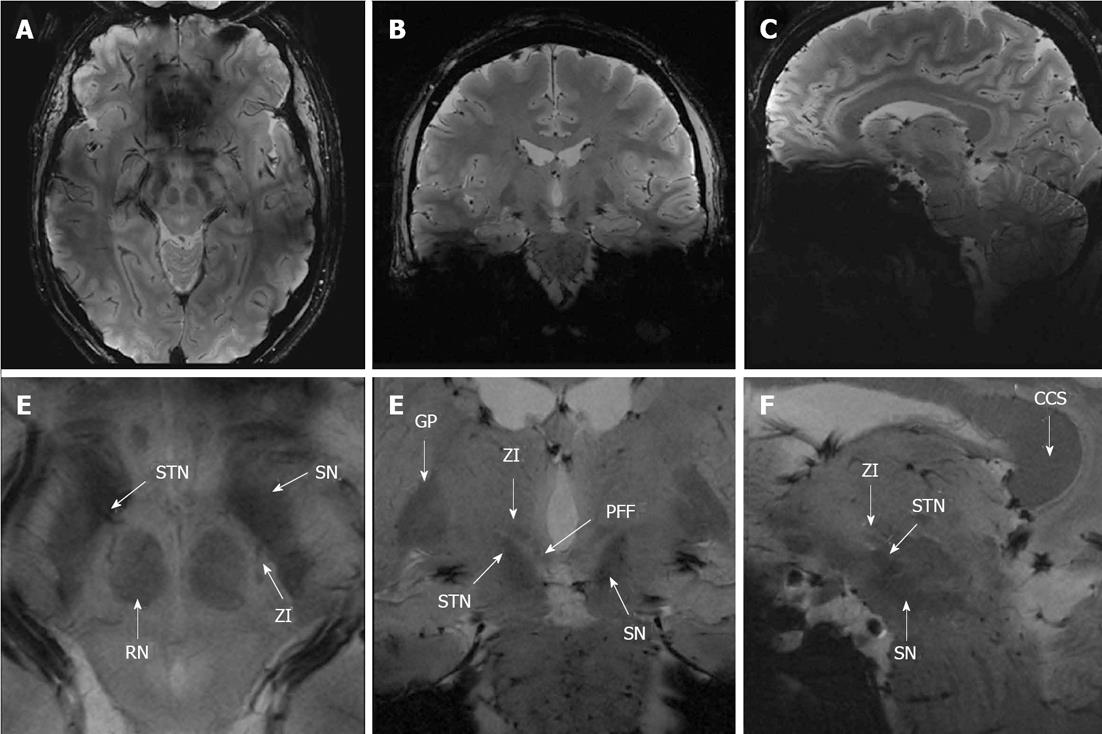
Images of a representative healthy volunteer at the level of the ZI in axial (tra), coronal (cor), and sagittal (sag) orientation are displayed in Figures 1-3, respectively.
All acquired images were evaluable except for the SWI sequence of one participant, which had to be excluded due to significant motion artifacts. Moderate artifacts were found for susceptibility-weighted imaging (SWI and SWI-MIP), minimal artifacts were visible in T2-TSE, and FLASH2D-T2Star imaging, and no artifacts within the ROI were seen in T1-GRE (tra, cor and sag) (Table 2).
| Sequence | Consensus of two readers |
| T1-GRE tra | 5.00 ± 0.00 |
| T1-GRE-cor | 5.00 ± 0.00 |
| T1-GRE sag | 5.00 ± 0.00 |
| T2-TSE tra | 4.78 ± 0.43 |
| FLASH2D-T2Star tra | 3.94 ± 0.54 |
| FLASH2D-T2Star cor | 3.94 ± 0.73 |
| FLASH2D-T2Star sag | 3.94 ± 0.64 |
| SWI tra | 2.92 ± 0.62 |
| SWI cor | 2.79 ± 0.43 |
| SWI sag | 3.00 ± 0.39 |
| SWI-MIP tra | 2.57 ± 0.51 |
| SWI-MIP cor | 2.64 ± 0.50 |
| SWI-MIP sag | 2.57 ± 0.51 |
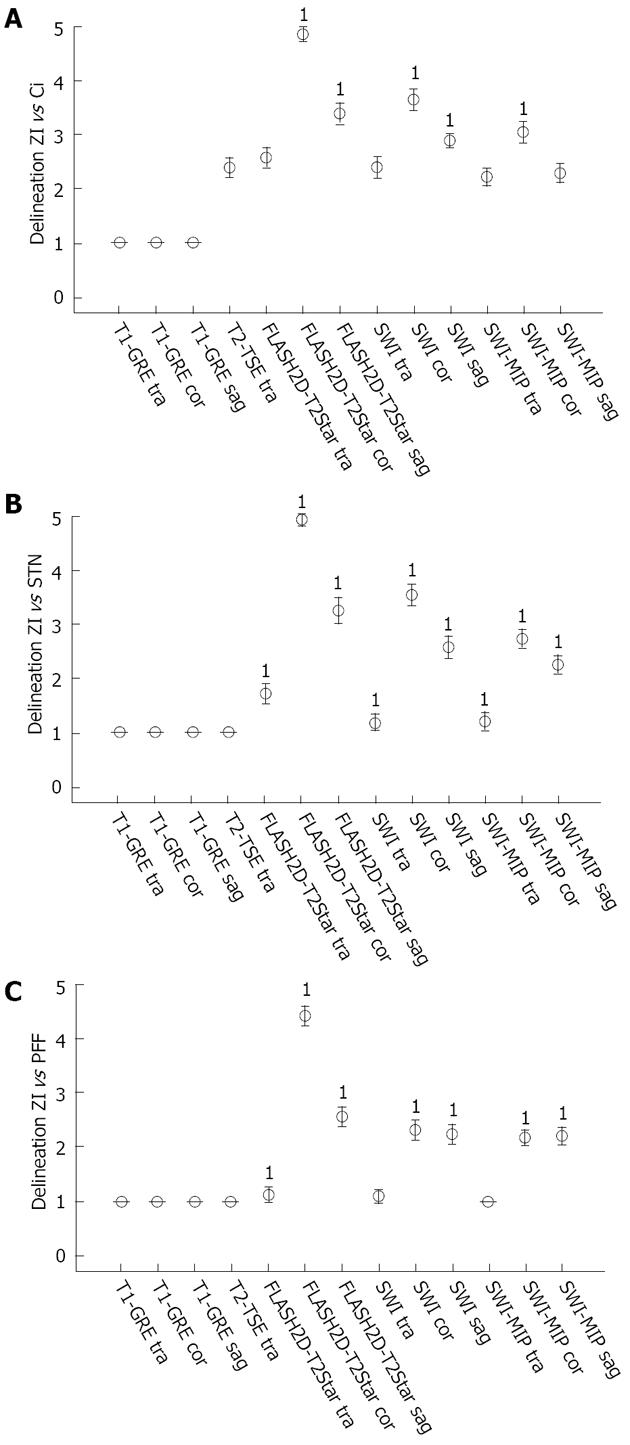
The initial assessment of the acquired images revealed that the rZI could easily be delineated whereas the cZI was not discernable in any of the sequences. For the subsequent analysis we therefore focused on the rZI. Qualitative ratings are summarized in Figure 4.
Regarding inter-rater reliability, identical results of both readers were seen for the delineation of the rZI vs the Ci, the rZI vs the STN, and the rZI vs the PFF in T1-GRE imaging (tra, cor and sag) (κ = 1). For T2-TSE varying results were obvious with perfect agreement for the delineation of the rZi vs the STN and vs the PFF, and slight agreement for the distinction of the rZI vs the Ci. Fair agreement was found for FLASH2D-T2Star sag imaging for the delineation of the rZI vs the Ci and for SWI-MIP cor imaging for the distinction of the rZI vs the PFF. The inter-rater reliability for FLASH2D-T2Star, SWI, and SWI-MIP (all orientations) was at least moderate.
In terms of delineation the T1-weighted images provided, besides a good contrast between cortex and white matter, only little contrast between the midbrain structures resulting in no obvious delineation of the Ci, the STN, and the PFF vs the ZI in all views. The T2-TSE images demonstrated good contrast for the grey matter. However, the rZI vs the Ci could only be delineated poorly. In addition delineation between the ZI and the STN, respectively between the ZI and the PFF was impossible. In contrast, SWI (SWI and SWI-MIP) and FLASH2D-T2Star images provided a considerably better demarcation of the rZI. Especially the coronal orientation and to a lesser degree the sagittal orientation showed a clear boundary dividing the rZI from the Ci, the STN, and the PFF. Moreover, the rZI was discernible in coronal FLASH2D-T2Star images in all nine healthy volunteers in both hemispheres (Figure 5).
In comparison to the current standard sequence used for DBS targeting (T2-TSE) particularly the coronal and to a lesser degree the sagittal the FLASH2D-T2Star, as well as the SWI sequences (SWI and SWI-MIP) provided also statistically a significant superior delineation (P < 0.001) of the rZI vs the Ci, vs the STN, and vs the PFF (Figure 4).
To provide directly clinical relevant information, we analyzed the SNR and CNR of the sequences as acquired (non-adjusted for voxel-size). Additionally we adjusted the measurements for a comparison independent of the acquired voxel size. SNR and CRN measurements for the rZI are shown in Table 3.
| SNR | CNR | |||
| Sequence | Non-adjusted | Adjusted | Non-adjusted | Adjusted |
| T1-GRE tra | 46.30 ± 9.481 | 271.09 ± 55.511 | 6.14 ± 2.01 | 35.96 ± 11.79 |
| T1-GRE cor | 46.33 ± 8.881 | 271.23 ± 55.981 | 6.47 ± 2.12 | 37.87 ± 12.42 |
| T1-GRE sag | 45.75 ± 9.441 | 267.84 ± 55.241 | 7.05 ± 2.67 | 41.30 ± 15.63 |
| T2-TSE tra | 17.18 ± 6.51 | 105.03 ± 39.81 | 19.40 ± 4.20 | 121.69 ± 25.68 |
| FLASH2D-T2Star tra | 40.28 ± 16.321 | 322.23 ± 130.601 | 44.17 ± 12.901 | 353.33 ± 103.191 |
| FLASH2D-T2Star cor | 53.06 ± 11.091 | 424.48 ± 88.761 | 31.76 ± 8.281 | 254.08 ± 66.241 |
| FLASH2D-T2Star sag | 57.84 ± 10.311 | 462.75 ± 88.761 | 33.92 ± 11.761 | 271.39 ± 94.051 |
| SWI tra | 18.94 ± 6.98 | 140.05 ± 51.62 | 10.99 ± 4.94 | 81.26 ± 36.57 |
| SWI cor | 19.20 ± 8.23 | 141.98 ± 60.88 | 10.40 ± 4.35 | 76.95 ± 32.15 |
| SWI sag | 18.80 ± 7.52 | 139.05 ± 55.65 | 11.07 ± 4.30 | 81.90 ± 31.85 |
| SWI-MIP tra | 358.89 ± 152.811 | 331.81 ± 141.281 | 275.70 ± 127.521 | 254.90 ± 117.901 |
| SWI-MIP cor | 354.00 ± 116.371 | 327.29 ± 107.591 | 275.86 ± 121.591 | 255.05 ± 112.411 |
| SWI-MIP sag | 312.66 ± 8.441 | 289.07 ± 75.291 | 261.28 ± 121.881 | 241.57 ± 119.151 |
The non-adjusted SNRs of the rZI in SWI-MIP, T1-GRE, and FLASH2D-T2Star images were significantly higher compared to T2-TSE. Non-MIP SWI images provided slightly higher SNRs compared to T2-TSE, yet without a statistical significance. The adjusted SNR differ only slightly: Similarly, SWI-MIP, T1-GRE, and FLASH2D-T2Star images showed significantly higher SNR values compared to T2-TSE. Besides, also coronal SWI images showed a slight, significantly higher SNR compared to T2-TSE images.
After calculation of the SNR and according to the Rose criterion[50] all scans allowed the recognition of image features with a 100% certainty (all SNR values are higher than 5).
SWI-MIP showed the best non-adjusted CNR with significant higher measurements relative to the T2-TSE images for the rZI. FLASH2D-T2Star imaging provided a lower, still significantly higher CNR compared to T2-TSE imaging. SWI and T1-GRE images, in contrast, showed the least non-adjusted CNRs of all acquired sequences, below the CNR values for T2-TSE imaging. After adjustment of the directly measured CNR values to a voxel volume of 1 mm3 similar result were obtained: SWI-MIP and FLASH2D-T2Star imaging provided significantly higher CNR values compared to T2-TSE images for the rZI. The lowest CNRs were calculated for T1-GRE imaging.
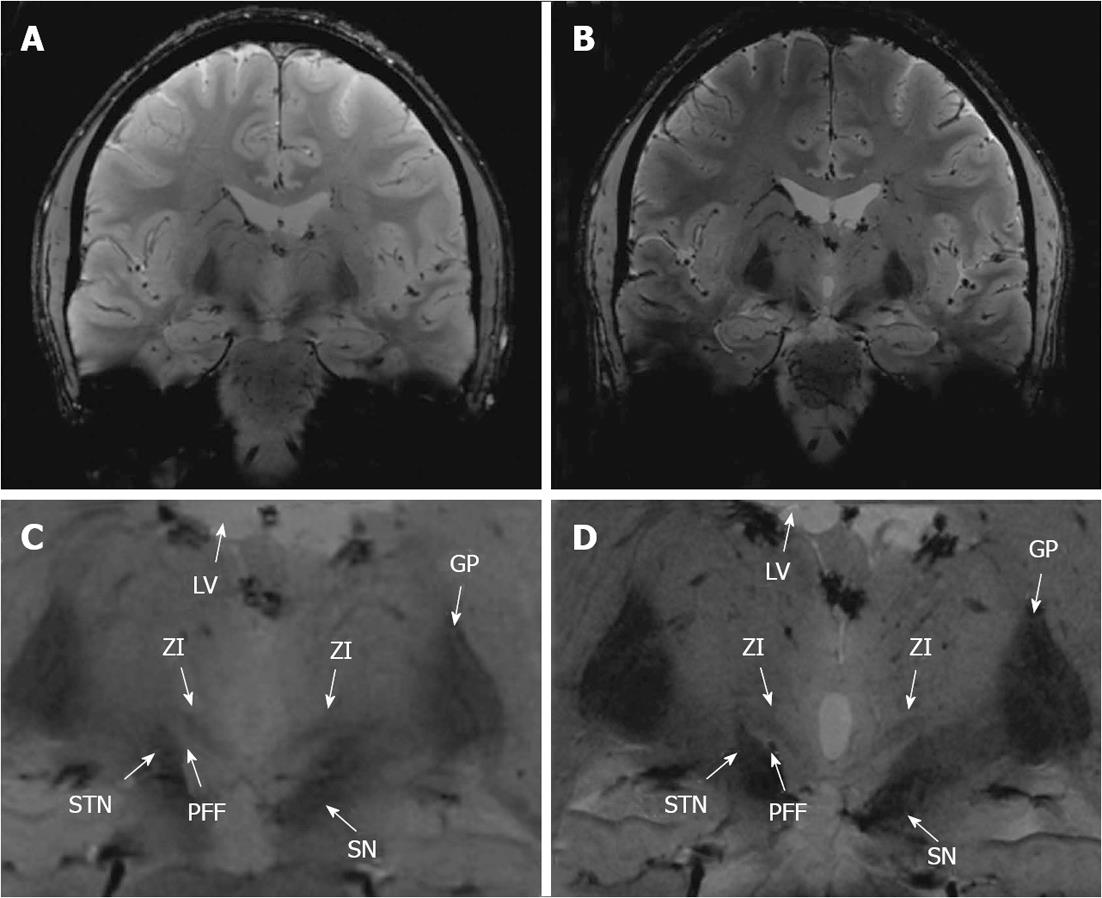
Figure 6 illustratively opposes 3.0 T and 7.0 T images of one volunteer (coronal FLASH2D-T2Star). 7.0 T provides a much sharper delineation of the rZI with substantially higher contrast.
To verify the anatomical correctness we co-registered the coronal FLASH2D-T2Star image at the level of the rZI (approximately 2 mm anterior to the midcommissural point) with the widely used atlas for brain surgery, the Schaltenbrand and Wahren atlas for stereotaxy of the human brain[21]. With the help of the schema an easy identification of the ZI was possible. The ZI projected into the boundaries of the anatomical schema in all 18 cases. Figure 7 illustrates a co-registration of the respective coronal FLASH2D-T2Star image with a coronal schematic drawing of the deep brain nuclei (due to license issues the respective image from the Schaltenbrand and Wahren atlas is currently not available for open-access publication).
DBS is a reversible stereotactic long-term therapeutic option for patients with chronic movement disorders including PD and tremor[1,51]. The method plays, after the approval by the US Food and Drug Administration, an accepted role in the treatment of medically refractory movement disorders including ET[52].
Progress in medical imaging has improved the visualization of the DBS target structures. In the era of 1.5 T the direct visualization failed, secondary to insufficient contrast and low resolution[27,53]. At 3.0 T initial promising results for the visualization of the ZI have been presented[54]. The implementation of 7.0 T MRI is a further technical advance to a higher signal and a superior spatial resolution compared to 1.5 T and 3.0 T[27,37,55]. Nevertheless, due to its localization in the subthalamic region, adjacent to a number of vital structures[19,20,28], the ZI is difficult to visualize and localize. Hence, the use of 7.0 T MRI may facilitate the direct visualization of the ZI.
This is the first study to present data on the visualization of the ZI at 7.0 T. A key finding of our analysis is that the rZI can be visualized easily. The cZI cannot be discerned using the sequences of this study. This finding has to be kept in mind for the pre-stereotactic planning of the ZI on the basis of MRI. Consequently, the rZI can be used as a landmark for targeting of the adjacent cZI. We hypothesize that the diverging visualization of rZI and cZI is secondary to its heterogeneous histological composition (that also become obvious in the diverse appearance on the histological sections of the stereotactic atlas[21]).
In our qualitative as well as our quantitative analysis the rZI was optimally delineated in the FLASH2D-T2Star sequence, especially in coronal orientation.
For the implementation of image-guided stereotactic neurosurgery a sufficiently high inter-rater reliability of the radiological evaluation is crucial. To our knowledge, inter-rater reliability has not yet been assessed for the visualization of the ZI at 7.0 T. In our analysis, the inter-rater reliability of the most adequate sequence for the visualization of the rZI, the coronal FLASH2D-T2Star, was substantial for the demarcation of the rZI versus the Ci, the STN and the PFF.
In summary, these results indicate that the most adequate sequence at 7.0 T MRI for the imaging of the ZI, the coronal FLASH2D-T2Star, allows a reliable pre-stereotactic visualization of the rZI if performed by readers experienced in the imaging of deep brain nuclei. Nevertheless, further optimization of the sequences is required to ameliorate the inter-rater reliability.
In our study the rZI was optimally delineated in sequences susceptible to local field inhomogeneities. Although the chemical composition of the ZI is yet not exactly known, we assume that the signal characteristics of the rZI are caused by iron deposits[20].
The association between iron deposition and neurodegenerative diseases has been described before[56,57]. Particularly in deep brain structures of PD patients (subthalamic region and basal ganglia) a progressive increase of iron concentration has been reported[58]. While iron accumulation seems to be a result of non-specific neuronal degeneration, the exact relation between iron deposition and neurodegenerative diseases remains still unknown[20].
Gelman et al[59] initially reported that the SI of the basal ganglia on T2-weighted images primarily depends on the iron concentration. Similarly, in T2*- and susceptibility weighted images the high iron concentration results in a hypointense signal of the STN and internal globus pallidus[20,31]. We found a hypointense signal in the rZI in sequences that are susceptible to local field inhomogeneities and therefore assume that the signal characteristics of the rZI are analogously caused by iron deposition. This iron deposition in the rZI may render patients affected by neurodegenerative diseases especially suitable for T2*, T2*-FLASH2D and SWI imaging. It is therefore necessary to further validate our findings (young and healthy population) in a patient cohort.
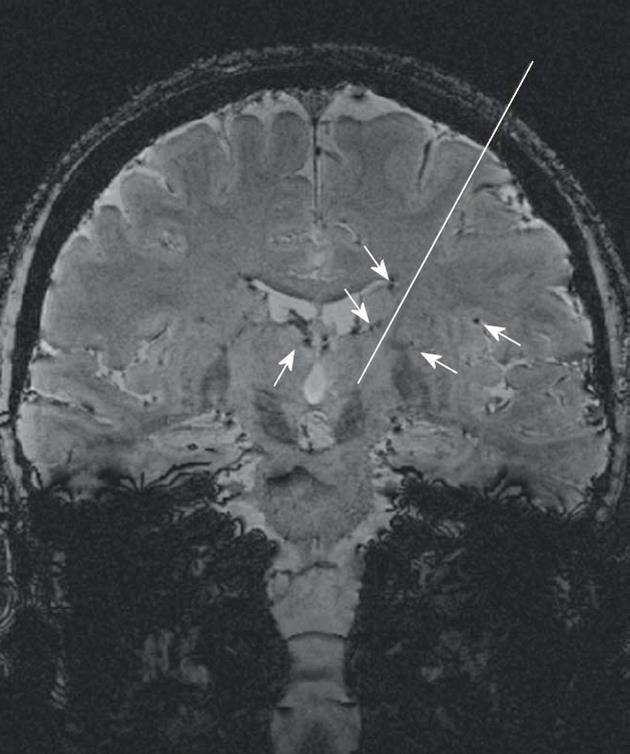
As an additional benefit, SWI, originally developed to track blood oxygen saturation[44], provides a clear visualization of deep cerebral veins and transparenchymal vessels. These anatomic details may help the neurosurgeon in the pre-operative planning to avoid predictable intracranial hemorrhages due to blood vessel injuries (Figure 8)[60].
Initially, geometrical distortions and susceptibility artifacts have been assumed to complicate an accurate DBS navigation with MRI (especially at 7 T). However, different studies demonstrate that the targeting error for structures located within the center of the brain away from air-filled cavities (like the ZI) is in the submillimeter range. Initial reports at 1.5 T found distortions of T2-TSE to be less than one millimeter[36]. At 3 T MRI Balachandran et al[61] described the targeting error of T2-TSE in comparison to CT with a maximum of 0.13 mm over twelve targets. Duchin et al[62] compared T2-TSE at 7 T and 1.5 T and found distortion differences of less than one voxel size. At 7 T MRI Cho et al[27] quantified the geometrical distortions of a T2-weighted gradient-echo sequence with a mean deviation of 0.12 ± 0.13 mm.
Our results confirm these findings. In the co-registration the rZI projected in its boundaries of the anatomic schema[21] in all 18 cases. This supports the correct identification of the rZI and affirms the anatomic accuracy of the technique.
Furthermore, current evolutions in MR methodology, including B0 shimming[63] as well as the use of commercially pre-installed second-order active shimming[27] may further compensate geometrical distortions caused by the high magnetic field.
In conclusion, the rZI is precisely and reliably visualized by FLASH2D-T2Star imaging at 7.0 T (particularly in the coronal view), whereas the cZI is not identifiable in any of the sequences tested. These results facilitate enhanced and more precise targeting of the cZI. Therefore intervention time and complication rates in DBS surgery may be reduced substantially in the future.
Deep brain stimulation (DBS) is an accepted neurosurgical technique for the treatment of many neurological and psychiatric disorders, such as Parkinson’s disease, essential tremor, dystonia. The subthalamic nucleus (STN) represents the commonly chosen target site to suppress resting tremor in patients with Parkinson’s disease. However, several clinical trails have reported negative limbic effects of STN DBS, including depression, apathy and decreased cognitive function. Therefore, the zona incerta (ZI) has been proposed as an alternative target area. For the exact stereotactical planning optimal delineation of the ZI by magnetic resonance imaging (MRI) has to be achieved.
Up to now, MRI data concerning the ZI is sparse. One study at 3.0 Tesla (T) reports that the visualization of the ZI is feasible but limited due to lack of signal and spatial resolution. With the higher field strength 7.0 T has the potential to improve the discernibility of the ZI.
For the first time, different sequences and orientations were evaluated to find the currently optimal combination for the visualization of the ZI at 7.0 T. Intraindividual comparison between 3.0 and 7.0 T demonstrated a clearly superior delineation and substantially higher contrast using the higher field strength. The rostral part of the ZI (rZI) could easily be identified and was best and reliably visualized in the coronal FLASH2D-T2Star images. The caudal part (cZI) was not definable in any of the sequences. FLASH2D-T2Star and susceptibility-weighted imaging offered significant higher contrast-to-noise rations for the rZI compared T2-turbo spin-echo (T2-TSE). T1-gradient-echo and T2-TSE were clearly inferior both in quantitative and qualitative analysis. The co-registration of the coronal FLASH2D-T2Star images with the stereotactic atlas schema (Schaltenbrand-Wahren) confirmed the correct localization of the ZI in all cases.
The results provide the currently optimal delination of the rZI at 7.0 T. These results can facilitate a better and more precise targeting of the cZI.
DBS is a treatment option in several medication refractory neurological disorders. The method consists in inserting a small electrode through the brain parenchyma to a small specific target region in the area of the deep brain nuclei.
The manuscript submitted by the authors for publication demonstrates the merits of 7.0T MRI of the ZI for the purpose of DBS treatment planning. The subject matter is interesting and current and the authors provide a thorough bibliographical introduction in order to set the context for the objective of their research. The materials and methods are sufficiently described and the results are presented in a concise and informative way. The discussion of the results outlines both the author’s conclusions and avenues of further research. It is still the recommendation for priority publication of this article.
P- Reviewer Antoniou P S- Editor Song XX L- Editor Webster JR E- Editor Xiong L
| 1. | Deep-Brain Stimulation for Parkinson’s Disease Study Group. Deep-brain stimulation of the subthalamic nucleus or the pars interna of the globus pallidus in Parkinson’s disease. N Engl J Med. 2001;345:956-963. [PubMed] [DOI] [Cited in This Article: ] [Cited by in Crossref: 1092] [Cited by in F6Publishing: 1161] [Article Influence: 50.5] [Reference Citation Analysis (0)] |
| 2. | Kim HJ, Jeon BS, Paek SH, Lee JY, Kim HJ, Kim CK, Kim DG. Bilateral subthalamic deep brain stimulation in Parkinson disease patients with severe tremor. Neurosurgery. 2010;67:626-632; discussion 632. [PubMed] [DOI] [Cited in This Article: ] [Cited by in Crossref: 25] [Cited by in F6Publishing: 27] [Article Influence: 2.1] [Reference Citation Analysis (0)] |
| 3. | Rehncrona S, Johnels B, Widner H, Törnqvist AL, Hariz M, Sydow O. Long-term efficacy of thalamic deep brain stimulation for tremor: double-blind assessments. Mov Disord. 2003;18:163-170. [PubMed] [DOI] [Cited in This Article: ] [Cited by in Crossref: 237] [Cited by in F6Publishing: 204] [Article Influence: 9.7] [Reference Citation Analysis (0)] |
| 4. | Tisch S, Rothwell JC, Limousin P, Hariz MI, Corcos DM. The physiological effects of pallidal deep brain stimulation in dystonia. IEEE Trans Neural Syst Rehabil Eng. 2007;15:166-172. [PubMed] [DOI] [Cited in This Article: ] [Cited by in Crossref: 50] [Cited by in F6Publishing: 51] [Article Influence: 3.0] [Reference Citation Analysis (0)] |
| 5. | Castrioto A, Lozano AM, Poon YY, Lang AE, Fallis M, Moro E. Ten-year outcome of subthalamic stimulation in Parkinson disease: a blinded evaluation. Arch Neurol. 2011;68:1550-1556. [PubMed] [Cited in This Article: ] |
| 6. | Mandat T, Tykocki T, Koziara H, Koziorowski D, Brodacki B, Rola R, Bonicki W, Nauman P. Subthalamic deep brain stimulation for the treatment of Parkinson disease. Neurol Neurochir Pol. 2011;45:32-36. [PubMed] [Cited in This Article: ] |
| 7. | Bejjani BP, Damier P, Arnulf I, Thivard L, Bonnet AM, Dormont D, Cornu P, Pidoux B, Samson Y, Agid Y. Transient acute depression induced by high-frequency deep-brain stimulation. N Engl J Med. 1999;340:1476-1480. [PubMed] [DOI] [Cited in This Article: ] [Cited by in Crossref: 452] [Cited by in F6Publishing: 476] [Article Influence: 19.0] [Reference Citation Analysis (0)] |
| 8. | Umemura A, Oka Y, Yamamoto K, Okita K, Matsukawa N, Yamada K. Complications of subthalamic nucleus stimulation in Parkinson’s disease. Neurol Med Chir (Tokyo). 2011;51:749-755. [PubMed] [Cited in This Article: ] |
| 9. | Hamel W, Fietzek U, Morsnowski A, Schrader B, Herzog J, Weinert D, Pfister G, Müller D, Volkmann J, Deuschl G. Deep brain stimulation of the subthalamic nucleus in Parkinson’s disease: evaluation of active electrode contacts. J Neurol Neurosurg Psychiatry. 2003;74:1036-1046. [PubMed] [Cited in This Article: ] |
| 10. | Herzog J, Fietzek U, Hamel W, Morsnowski A, Steigerwald F, Schrader B, Weinert D, Pfister G, Müller D, Mehdorn HM. Most effective stimulation site in subthalamic deep brain stimulation for Parkinson’s disease. Mov Disord. 2004;19:1050-1054. [PubMed] [DOI] [Cited in This Article: ] [Cited by in Crossref: 184] [Cited by in F6Publishing: 194] [Article Influence: 9.7] [Reference Citation Analysis (0)] |
| 11. | Voges J, Volkmann J, Allert N, Lehrke R, Koulousakis A, Freund HJ, Sturm V. Bilateral high-frequency stimulation in the subthalamic nucleus for the treatment of Parkinson disease: correlation of therapeutic effect with anatomical electrode position. J Neurosurg. 2002;96:269-279. [PubMed] [DOI] [Cited in This Article: ] [Cited by in Crossref: 218] [Cited by in F6Publishing: 238] [Article Influence: 10.8] [Reference Citation Analysis (0)] |
| 12. | Blomstedt P, Sandvik U, Linder J, Fredricks A, Forsgren L, Hariz MI. Deep brain stimulation of the subthalamic nucleus versus the zona incerta in the treatment of essential tremor. Acta Neurochir (Wien). 2011;153:2329-2335. [PubMed] [DOI] [Cited in This Article: ] [Cited by in Crossref: 43] [Cited by in F6Publishing: 46] [Article Influence: 3.5] [Reference Citation Analysis (0)] |
| 13. | Sandvik U, Hariz GM, Blomstedt P. Quality of life following DBS in the caudal zona incerta in patients with essential tremor. Acta Neurochir (Wien). 2012;154:495-499. [PubMed] [DOI] [Cited in This Article: ] [Cited by in Crossref: 20] [Cited by in F6Publishing: 23] [Article Influence: 1.9] [Reference Citation Analysis (0)] |
| 14. | Mitrofanis J. Some certainty for the “zone of uncertainty”? Exploring the function of the zona incerta. Neuroscience. 2005;130:1-15. [PubMed] [Cited in This Article: ] |
| 15. | Jones EG. The Thalamus. New York: Plenum Press 1985; . [Cited in This Article: ] |
| 16. | Mitrofanis J, Ashkan K, Wallace BA, Benabid AL. Chemoarchitectonic heterogeneities in the primate zona incerta: clinical and functional implications. J Neurocytol. 2004;33:429-440. [PubMed] [Cited in This Article: ] |
| 17. | Mok D, Mogenson GJ. Convergence of signals in the zona incerta for angiotensin-mediated and osmotic thirst. Brain Res. 1987;407:332-340. [PubMed] [Cited in This Article: ] |
| 18. | Plaha P, Khan S, Gill SS. Bilateral stimulation of the caudal zona incerta nucleus for tremor control. J Neurol Neurosurg Psychiatry. 2008;79:504-513. [PubMed] [Cited in This Article: ] |
| 19. | Carpenter M. The subthalamic region. Human Neuroanatomy. Baltimore: Wiliams and Wilkins 1976; 509-511. [Cited in This Article: ] |
| 20. | Dormont D, Ricciardi KG, Tandé D, Parain K, Menuel C, Galanaud D, Navarro S, Cornu P, Agid Y, Yelnik J. Is the subthalamic nucleus hypointense on T2-weighted images? A correlation study using MR imaging and stereotactic atlas data. AJNR Am J Neuroradiol. 2004;25:1516-1523. [PubMed] [Cited in This Article: ] |
| 21. | Schaltenbrand G, Wahren W. Atlas for Stereotaxy of the Human Brain. 2nd ed. Stuttgart: Thieme 1977; . [Cited in This Article: ] |
| 22. | Yelnik J, Percheron G. Subthalamic neurons in primates: a quantitative and comparative analysis. Neuroscience. 1979;4:1717-1743. [PubMed] [Cited in This Article: ] |
| 23. | Burrows AM, Ravin PD, Novak P, Peters ML, Dessureau B, Swearer J, Pilitsis JG. Limbic and motor function comparison of deep brain stimulation of the zona incerta and subthalamic nucleus. Neurosurgery. 2012;70:125-130; discussion 130-131. [PubMed] [DOI] [Cited in This Article: ] [Cited by in Crossref: 14] [Cited by in F6Publishing: 22] [Article Influence: 1.8] [Reference Citation Analysis (0)] |
| 24. | Plaha P, Filipovic S, Gill SS. Induction of parkinsonian resting tremor by stimulation of the caudal zona incerta nucleus: a clinical study. J Neurol Neurosurg Psychiatry. 2008;79:514-521. [PubMed] [Cited in This Article: ] |
| 25. | Plaha P, Javed S, Agombar D, O’ Farrell G, Khan S, Whone A, Gill S. Bilateral caudal zona incerta nucleus stimulation for essential tremor: outcome and quality of life. J Neurol Neurosurg Psychiatry. 2011;82:899-904. [PubMed] [DOI] [Cited in This Article: ] [Cited by in Crossref: 63] [Cited by in F6Publishing: 64] [Article Influence: 4.9] [Reference Citation Analysis (0)] |
| 26. | Plaha P, Ben-Shlomo Y, Patel NK, Gill SS. Stimulation of the caudal zona incerta is superior to stimulation of the subthalamic nucleus in improving contralateral parkinsonism. Brain. 2006;129:1732-1747. [PubMed] [Cited in This Article: ] |
| 27. | Cho ZH, Min HK, Oh SH, Han JY, Park CW, Chi JG, Kim YB, Paek SH, Lozano AM, Lee KH. Direct visualization of deep brain stimulation targets in Parkinson disease with the use of 7-tesla magnetic resonance imaging. J Neurosurg. 2010;113:639-647. [PubMed] [DOI] [Cited in This Article: ] [Cited by in Crossref: 133] [Cited by in F6Publishing: 137] [Article Influence: 9.8] [Reference Citation Analysis (0)] |
| 28. | Hattingen E, Blasel S, Nichtweiss M, Zanella FE, Weidauer S. MR imaging of midbrain pathologies. Clin Neuroradiol. 2010;20:81-97. [PubMed] [DOI] [Cited in This Article: ] [Cited by in Crossref: 13] [Cited by in F6Publishing: 14] [Article Influence: 1.0] [Reference Citation Analysis (0)] |
| 29. | Spiegelmann R, Friedman WA. Rapid determination of thalamic CT-stereotactic coordinates: a method. Acta Neurochir (Wien). 1991;110:77-81. [PubMed] [Cited in This Article: ] |
| 30. | Aziz TZ, Nandi D, Parkin S, Liu X, Giladi N, Bain P, Gregory RG, Joint C, Scott RB, Stein JF. Targeting the subthalamic nucleus. Stereotact Funct Neurosurg. 2001;77:87-90. [PubMed] [Cited in This Article: ] |
| 31. | Brunenberg EJ, Platel B, Hofman PA, Ter Haar Romeny BM, Visser-Vandewalle V. Magnetic resonance imaging techniques for visualization of the subthalamic nucleus. J Neurosurg. 2011;115:971-984. [PubMed] [DOI] [Cited in This Article: ] [Cited by in Crossref: 40] [Cited by in F6Publishing: 42] [Article Influence: 3.2] [Reference Citation Analysis (0)] |
| 32. | Andrade-Souza YM, Schwalb JM, Hamani C, Eltahawy H, Hoque T, Saint-Cyr J, Lozano AM. Comparison of three methods of targeting the subthalamic nucleus for chronic stimulation in Parkinson’s disease. Neurosurgery. 2005;56:360-368; discussion 360-368. [PubMed] [Cited in This Article: ] |
| 33. | Bour LJ, Contarino MF, Foncke EM, de Bie RM, van den Munckhof P, Speelman JD, Schuurman PR. Long-term experience with intraoperative microrecording during DBS neurosurgery in STN and GPi. Acta Neurochir (Wien). 2010;152:2069-2077. [PubMed] [DOI] [Cited in This Article: ] [Cited by in Crossref: 89] [Cited by in F6Publishing: 70] [Article Influence: 5.0] [Reference Citation Analysis (0)] |
| 34. | Chang WS, Kim HY, Kim JP, Park YS, Chung SS, Chang JW. Bilateral subthalamic deep brain stimulation using single track microelectrode recording. Acta Neurochir (Wien). 2011;153:1087-1095. [PubMed] [DOI] [Cited in This Article: ] [Cited by in Crossref: 27] [Cited by in F6Publishing: 31] [Article Influence: 2.4] [Reference Citation Analysis (0)] |
| 35. | Ashkan K, Blomstedt P, Zrinzo L, Tisch S, Yousry T, Limousin-Dowsey P, Hariz MI. Variability of the subthalamic nucleus: the case for direct MRI guided targeting. Br J Neurosurg. 2007;21:197-200. [PubMed] [Cited in This Article: ] |
| 36. | Daniluk S, G Davies K, Ellias SA, Novak P, Nazzaro JM. Assessment of the variability in the anatomical position and size of the subthalamic nucleus among patients with advanced Parkinson’s disease using magnetic resonance imaging. Acta Neurochir (Wien). 2010;152:201-10; discussion 210. [PubMed] [DOI] [Cited in This Article: ] [Cited by in Crossref: 51] [Cited by in F6Publishing: 49] [Article Influence: 3.5] [Reference Citation Analysis (0)] |
| 37. | Abosch A, Yacoub E, Ugurbil K, Harel N. An assessment of current brain targets for deep brain stimulation surgery with susceptibility-weighted imaging at 7 tesla. Neurosurgery. 2010;67:1745-1756; discussion 1756. [PubMed] [DOI] [Cited in This Article: ] [Cited by in Crossref: 170] [Cited by in F6Publishing: 166] [Article Influence: 12.8] [Reference Citation Analysis (0)] |
| 38. | Kitajima M, Korogi Y, Kakeda S, Moriya J, Ohnari N, Sato T, Hayashida Y, Hirai T, Okuda T, Yamashita Y. Human subthalamic nucleus: evaluation with high-resolution MR imaging at 3.0 T. Neuroradiology. 2008;50:675-681. [PubMed] [DOI] [Cited in This Article: ] [Cited by in Crossref: 38] [Cited by in F6Publishing: 35] [Article Influence: 2.2] [Reference Citation Analysis (0)] |
| 39. | Guo T, Finnis KW, Deoni SC, Parrent AG, Peters TM. Comparison of different targeting methods for subthalamic nucleus deep brain stimulation. Med Image Comput Comput Assist Interv. 2006;9:768-775. [PubMed] [Cited in This Article: ] |
| 40. | Gringel T, Schulz-Schaeffer W, Elolf E, Frölich A, Dechent P, Helms G. Optimized high-resolution mapping of magnetization transfer (MT) at 3 Tesla for direct visualization of substructures of the human thalamus in clinically feasible measurement time. J Magn Reson Imaging. 2009;29:1285-1292. [PubMed] [DOI] [Cited in This Article: ] [Cited by in Crossref: 42] [Cited by in F6Publishing: 43] [Article Influence: 2.9] [Reference Citation Analysis (0)] |
| 41. | Duyn JH, van Gelderen P, Li TQ, de Zwart JA, Koretsky AP, Fukunaga M. High-field MRI of brain cortical substructure based on signal phase. Proc Natl Acad Sci USA. 2007;104:11796-11801. [PubMed] [Cited in This Article: ] |
| 42. | O’Gorman RL, Shmueli K, Ashkan K, Samuel M, Lythgoe DJ, Shahidiani A, Wastling SJ, Footman M, Selway RP, Jarosz J. Optimal MRI methods for direct stereotactic targeting of the subthalamic nucleus and globus pallidus. Eur Radiol. 2011;21:130-136. [PubMed] [DOI] [Cited in This Article: ] [Cited by in Crossref: 65] [Cited by in F6Publishing: 69] [Article Influence: 4.9] [Reference Citation Analysis (0)] |
| 43. | Nölte IS, Gerigk L, Al-Zghloul M, Groden C, Kerl HU. Visualization of the internal globus pallidus: sequence and orientation for deep brain stimulation using a standard installation protocol at 3.0 Tesla. Acta Neurochir (Wien). 2012;154:481-494. [PubMed] [DOI] [Cited in This Article: ] [Cited by in Crossref: 26] [Cited by in F6Publishing: 32] [Article Influence: 2.7] [Reference Citation Analysis (0)] |
| 44. | Haacke EM, Xu Y, Cheng YC, Reichenbach JR. Susceptibility weighted imaging (SWI). Magn Reson Med. 2004;52:612-618. [PubMed] [DOI] [Cited in This Article: ] [Cited by in Crossref: 1223] [Cited by in F6Publishing: 1107] [Article Influence: 55.4] [Reference Citation Analysis (0)] |
| 45. | Stark DD, Bradley WG. Magnetic resonance imaging. St. Louis, Missouri: Mosby 1999; 64. [Cited in This Article: ] |
| 46. | Haneder S, Attenberger UI, Biffar A, Dietrich O, Fink C, Schoenberg SO, Michaely HJ. Gadofosveset: parameter optimization for steady-state imaging of the thoracic and abdominal vasculature. Invest Radiol. 2011;46:678-685. [PubMed] [DOI] [Cited in This Article: ] [Cited by in Crossref: 12] [Cited by in F6Publishing: 13] [Article Influence: 1.1] [Reference Citation Analysis (0)] |
| 47. | Cohen J. A coefficient of agreement for nominal scales. Educ Psychol Meas. 1960;20:37-46. [DOI] [Cited in This Article: ] |
| 48. | Landis JR, Koch GG. An application of hierarchical kappa-type statistics in the assessment of majority agreement among multiple observers. Biometrics. 1977;33:363-374. [PubMed] [Cited in This Article: ] |
| 49. | Landis JR, Koch GG. The measurement of observer agreement for categorical data. Biometrics. 1977;33:159-174. [PubMed] [Cited in This Article: ] |
| 50. | Bushberg JT. The Essential Physics of Medical Imaging. 2nd ed. Philadelphia: Lippincott Williams and Wilkins 2006; . [Cited in This Article: ] |
| 51. | Østergaard K, Sunde N, Dupont E. Effects of bilateral stimulation of the subthalamic nucleus in patients with severe Parkinson’s disease and motor fluctuations. Mov Disord. 2002;17:693-700. [PubMed] [DOI] [Cited in This Article: ] [Cited by in Crossref: 153] [Cited by in F6Publishing: 148] [Article Influence: 6.7] [Reference Citation Analysis (0)] |
| 52. | Kitagawa M, Murata J, Kikuchi S, Sawamura Y, Saito H, Sasaki H, Tashiro K. Deep brain stimulation of subthalamic area for severe proximal tremor. Neurology. 2000;55:114-116. [PubMed] [Cited in This Article: ] |
| 53. | Cuny E, Guehl D, Burbaud P, Gross C, Dousset V, Rougier A. Lack of agreement between direct magnetic resonance imaging and statistical determination of a subthalamic target: the role of electrophysiological guidance. J Neurosurg. 2002;97:591-597. [PubMed] [DOI] [Cited in This Article: ] [Cited by in Crossref: 115] [Cited by in F6Publishing: 121] [Article Influence: 5.5] [Reference Citation Analysis (0)] |
| 54. | Kerl HU, Gerigk L, Huck S, Al-Zghloul M, Groden C, Nölte IS. Visualisation of the zona incerta for deep brain stimulation at 3.0 Tesla. Clin Neuroradiol. 2012;22:55-68. [PubMed] [DOI] [Cited in This Article: ] [Cited by in Crossref: 17] [Cited by in F6Publishing: 13] [Article Influence: 1.1] [Reference Citation Analysis (0)] |
| 55. | Nakada T. Clinical application of high and ultra high-field MRI. Brain Dev. 2007;29:325-335. [PubMed] [Cited in This Article: ] |
| 56. | Kosta P, Argyropoulou MI, Markoula S, Konitsiotis S. MRI evaluation of the basal ganglia size and iron content in patients with Parkinson’s disease. J Neurol. 2006;253:26-32. [PubMed] [DOI] [Cited in This Article: ] [Cited by in Crossref: 94] [Cited by in F6Publishing: 102] [Article Influence: 5.4] [Reference Citation Analysis (0)] |
| 57. | McNeill A, Chinnery PF. Neurodegeneration with brain iron accumulation. Handb Clin Neurol. 2011;100:161-172. [PubMed] [Cited in This Article: ] |
| 58. | Zhang W, Sun SG, Jiang YH, Qiao X, Sun X, Wu Y. Determination of brain iron content in patients with Parkinson’s disease using magnetic susceptibility imaging. Neurosci Bull. 2009;25:353-360. [PubMed] [Cited in This Article: ] |
| 59. | Gelman N, Gorell JM, Barker PB, Savage RM, Spickler EM, Windham JP, Knight RA. MR imaging of human brain at 3.0 T: preliminary report on transverse relaxation rates and relation to estimated iron content. Radiology. 1999;210:759-767. [PubMed] [Cited in This Article: ] |
| 60. | Park JH, Chung SJ, Lee CS, Jeon SR. Analysis of hemorrhagic risk factors during deep brain stimulation surgery for movement disorders: comparison of the circumferential paired and multiple electrode insertion methods. Acta Neurochir (Wien). 2011;153:1573-1578. [PubMed] [DOI] [Cited in This Article: ] [Cited by in Crossref: 34] [Cited by in F6Publishing: 38] [Article Influence: 2.9] [Reference Citation Analysis (0)] |
| 61. | Balachandran R, Welch EB, Dawant BM, Fitzpatrick JM. Effect of MR distortion on targeting for deep-brain stimulation. IEEE Trans Biomed Eng. 2010;57:1729-1735. [PubMed] [DOI] [Cited in This Article: ] [Cited by in Crossref: 18] [Cited by in F6Publishing: 20] [Article Influence: 1.4] [Reference Citation Analysis (0)] |
| 62. | Duchin Y, Abosch A, Yacoub E, Sapiro G, Harel N. Feasibility of using ultra-high field (7 T) MRI for clinical surgical targeting. PLoS One. 2012;7:e37328. [PubMed] [DOI] [Cited in This Article: ] [Cited by in Crossref: 73] [Cited by in F6Publishing: 67] [Article Influence: 5.6] [Reference Citation Analysis (0)] |
| 63. | Shmueli K, de Zwart JA, van Gelderen P, Li TQ, Dodd SJ, Duyn JH. Magnetic susceptibility mapping of brain tissue in vivo using MRI phase data. Magn Reson Med. 2009;62:1510-1522. [PubMed] [DOI] [Cited in This Article: ] [Cited by in Crossref: 392] [Cited by in F6Publishing: 398] [Article Influence: 28.4] [Reference Citation Analysis (0)] |


