Abstract
Although clinical trials have demonstrated that primary percutaneous coronary intervention (PPCI) provides better outcomes than thrombolysis for STEMI, it cannot be assumed that similar results can be obtained in day-to-day practice. To determine whether standards are being met, continuous audit of PPCI programmes is necessary, with appropriate feedback to participating centres and operators.
Both the MINAP and BCIS national audit projects allow central electronic collection of data on consecutive patients presenting to every hospital involved in the acute management of these patients. Regular programmed feedback is provided to centres performing primary PCI that attempts to take account of statistical variation and differences in case mix between units by making use of funnel plots, statistical process control graphs and risk adjustment models.
This reporting of “process” and “outcome” data, both confidentially and within the public domain, has been used to drive up clinical performance and has been associated with steady improvements and reduced inequalities of care.
Abbreviations
BCIS: British Cardiovascular Intervention Society
CCAD: Central Cardiac Audit Database
CTB: call-to-balloon
DES: drug-eluting stent
DTB: door-to-balloon
MACE: major adverse cardiovascular events
MACCE: major adverse cardiovascular and cerebrovascular events
MINAP: Myocardial Ischaemia (formally infarction) National Audit Project
NHS: National Health Service
NICOR: National Institute for Clinical Outcomes Research
PCI: percutaneous coronary intervention
PPCI: primary percutaneous coronary intervention
SD: standard deviation
SPC: statistical process control
STEMI: ST-elevation myocardial infarction
UK: United Kingdom
Introduction
Although clinical trials have demonstrated that primary percutaneous coronary intervention (PPCI) provides better outcomes than thrombolysis for the majority of patients presenting with ST-elevation myocardial infarction (STEMI)1, it cannot be assumed that similar results can be obtained in day-to-day practice outside of the strict criteria surrounding a clinical trial. Improved outcomes will only be achieved if PPCI is delivered within the timeframes consistent with trial protocols, and if all PPCI centres can achieve success rates comparable to those achieved by participating trial centres. Clinical trials often have restrictive inclusion and exclusion criteria whereas a national registry can evaluate unselected clinical practice. To determine whether standards are being met, continuous audit of PPCI programmes is necessary, with appropriate feedback to participating centres and operators. There are advantages in such an audit process being performed nationally, as this allows a central overview of activity and outcomes and benchmarking comparisons between units. A centrally-performed audit also makes best use of those skills required to collect, analyse and deliver outcome data. To be effective, it is essential that the audit reports back to the participating centres.
Clinical audit should evaluate the infrastructure needed to perform the activity in question, the processes involved in delivering the activity, the appropriateness of the intervention, and clinical outcomes. Any benchmarking must take account of statistical variation and differences in case mix between units. In the UK, a series of national registries has been developed to evaluate the standards of care across a wide range of cardiovascular conditions and therapies.
Development of national cardiovascular audit programmes in the UK
The collection of national PCI data in the United Kingdom (UK) started when the British Cardiovascular Intervention Society (BCIS) was established in 1988. Initially, data collection was simply a paper survey of clinical activity. Similar processes were introduced by other specialist cardiovascular societies and in 1996 a number of these collaborated and created the Central Cardiac Audit Database (CCAD), which allowed prospective electronic data collection on consecutive patients.
Following a government initiative to improve standards of care for patients with coronary disease (the “National Service Framework for Coronary Heart Disease”)2, CCAD was used as a means of tracking outcomes of patients suffering acute myocardial infarction, using the Myocardial Infarction (now Ischaemia) National Audit Project (MINAP) dataset. Established in 1999, MINAP was thereafter used by all hospitals admitting patients with acute myocardial infarction. Over time, the data collection and reporting processes have become more sophisticated and datasets have evolved. For example, one of the original aims of MINAP was to audit the delivery of thrombolysis for patients with STEMI, whereas it now also tracks the processes and outcomes of patients undergoing PPCI procedures, and those with other acute coronary syndromes3. The BCIS dataset collects mainly procedural information on all patients undergoing PCI4. Whereas there is some duplication of effort for the PPCI cohort, this has been useful as a cross-check between the datasets, and steps are being made to fuse them. CCAD is now based in the National Institute for Clinical Outcomes Research (NICOR), University College, London, and supports national audits for a range of cardiovascular conditions (Figure 1)5.

Figure 1. The national cardiovascular audits served by the Central Cardiac Audit Database (CCAD), now part of the National Institute for Cardiovascular Outcomes Research (NICOR).
National (UK) participation in the electronic collection of PCI data has been achieved since 2005. Although bespoke software is optionally offered by CCAD (now under the auspices of NICOR), each PCI centre can if they wish use either self-developed or commercially available data collection systems. Whichever electronic system for data collection is used, all feed into a local copy of Lotus Notes™ software that is present in each PCI centre. This software deals with data encryption and secure communication between the local centre and the central data servers. It is also programmed to provide a view of the “live” data in the entire national registry (which is presented in aggregated and anonymised format). Any centre can therefore compare its own “live” data with the national aggregate. Data analyses allow overviews of patient demographics, clinical characteristics, procedural and technical aspects of PCI and clinical outcomes, including adverse events. For example, when comparing a local unit with national data, a user can drill down progressively from all PCI procedures, to those performed for primary PCI, to those using drug-eluting stents, and so on.
For each PCI procedure a total of 113 variables are collected, including a unique patient identifier (the National Health Service number for those in England and Wales) that allows mortality tracking to be performed. The main purpose of the BCIS data collection is to help PCI units improve the quality of their PCI services. Thus the focus is on clinical audit against standards and outcomes analysis. Much of this hinges on providing feedback to support benchmarking to allow units to see how well they are performing against other units in the UK and national and international guidelines. This feedback from BCIS is provided in a variety of ways and MINAP publishes an annual report providing both an overview of processes and outcomes and key indicators of individual hospital performance.
Feedback of national audit data to networks, hospitals and individual clinicians
Individual units can use their software to evaluate virtually any aspect of local PCI delivery, but in addition BCIS generates regular reports, providing an overview of UK activity and outcomes in individual hospitals.
National annual report
A fundamental feedback to the participating centres has been their completeness of data collection, especially relating to twelve key variables (Figure 2). These allow outcome tracking and the risk modelling that BCIS uses to evaluate outcomes after PCI (see below). Year-on-year improvements have led to the majority of units now being 100% compliant with these aspects of the audit programme. In addition, data in CCAD are compared with summary statistics collected separately from each unit and, where discrepancies are found, hospitals are informed (Figure 3).
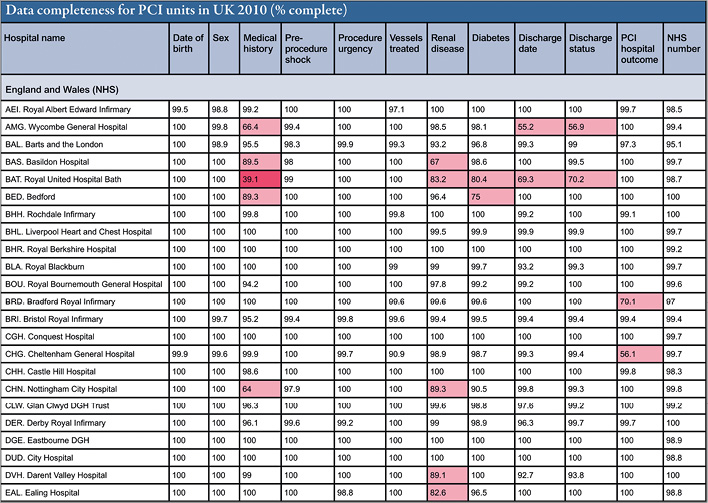
Figure 2. Data completeness in CCAD for the twelve key variables in the BCIS dataset. A section of the table of data completeness by hospital with a focus on those fields required to measure risk-stratified outcome. Where values fall below 90% the cell is coloured pink, and below 50% coloured red.
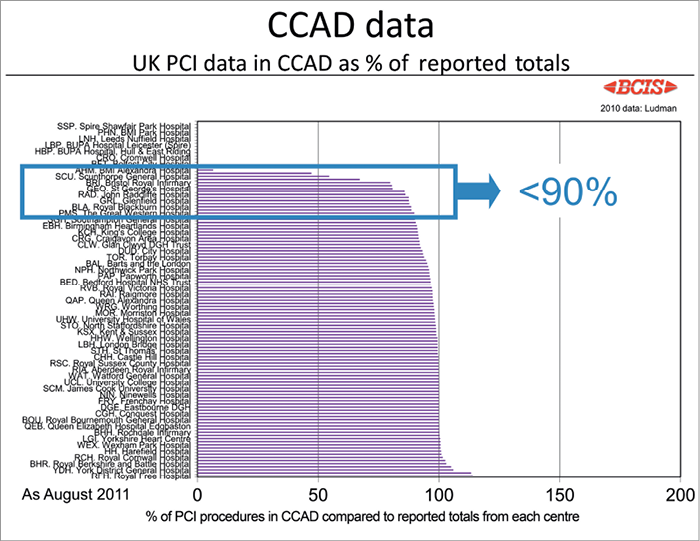
Figure 3. Display of case ascertainment in the BCIS CCAD dataset. If all cases performed are in the database, the value should be 100%. The names of those with <90% are displayed in a detail slide and these units are also contacted to encourage better data entry. Many of those at 0% are new low-volume units not yet connected to the electronic data collection system. The result is that, in England and Wales, 96.2% of all PCI procedures had been uploaded to the central servers in 2010.
Each year the BCIS data are analysed and presented as an audit report at one of the Society’s annual meetings. This report is then made publicly available6, and a summary of findings is separately distributed to all networks and PCI units in a short report. To encourage data submission, the report includes information about both case ascertainment and the completeness of each record (as described above). Individual PCI centres are identified, encouraging improvement through peer comparison.
In the annual BCIS report6, a wide range of outputs is provided detailing the practice of PCI in the UK. Some of the data relevant to patients undergoing PPCI are as follows:
Structure
For a population of over 62 million people, in 2010 the UK had 114 centres with PCI capability; 17 of these were private institutions that performed a very small proportion of the overall PCI activity. Overall, 45% of hospitals had on-site cardiac surgery and in 55% it was available, where needed, by inter-hospital transfer. There were 97 National Health Service (NHS - state-funded) facilities (38% with on-site surgery), and all but four contributed to the national audit process in 2010. An additional 69 hospitals had cardiac catheterisation facilities (for diagnostic studies, pacing and electrophysiology procedures) but did not perform PCI.
In 2010, the UK performed 87,676 PCIs (1,407 per million population). Annual activity in individual centres varied enormously, from less than 100 (in new centres just starting their experience) to over 3,000. Different centres have different staffing arrangements, some having interventional cardiologists working only on one site, and others having both in-house and visiting cardiologists. Some of these visiting cardiologists also perform PCI in their base hospitals. The number of operators varied between sites. The minimum required by current BCIS recommendations is three and the most who contributed to a programme was 24 (average seven per PCI unit)6-8. For centres where PPCI was performed on a 24/7 basis, the mean number of consultants was 10.6 per hospital. Although PPCI activity was performed in 74% of all NHS PCI centres, only 52% of NHS PCI centres had a full 24/7 service. The latter centres were identified during a national implementation programme for PPCI as a replacement for thrombolysis as the main reperfusion therapy for STEMI9.
Appropriateness
The case mix for PCI has changed steadily over the last few years, from a predominantly elective programme to one that is now dominated by urgent and emergency acute coronary syndrome cases (62.2% of activity in 2010 compared with 44% in 2005; 24.2% of activity is now in the context of STEMI). In some centres urgent and emergency work now accounts for 80% of all PCI activity. There has been a dramatic growth in PPCI cases, with a concomitant reduction in the need for rescue PCI for failed thrombolysis. However, the total rate of PPCI in 2010 amounts to only 287 per million population, which is significantly less that that expected across Europe10. There has, however, been a fall in the incidence of STEMI for some years in the UK, as with other nations11,12. Of the PPCI procedures undertaken, 2% involved treatment of the left main stem and in 2% the culprit lesion involved vein grafts. Appropriateness regarding PPCI activity is also determined by an evaluation of the process of its delivery, and in particular the timings of treatment.
Process
For overall PCI activity (89.7% being single vessel, and 10.3% multivessel in 2010), drug-eluting stents (DES) were used in 67.1% of cases. There has been a year-on-year increase in the use of DES in PPCI cases with 54.4% of such patients receiving DES in 201013. The radial access route was used in about 50% of PPCI cases. There has been a slight fall in the use of glycoprotein inhibitor use during PPCI (used in 61.7% in 2010) but bivalirudin was used in only 7.4% of cases. Prasugrel was used instead of clopidogrel in 9.3% of PPCI cases.
The key measures of “process” in PPCI delivery are door-to-balloon (DTB), defined as time to the first device used in the vessel, and call-to-balloon (CTB) times. The call time is the time a patient first calls for help (usually to emergency services), and the door time is the time of arrival at the PPCI centre. The combined data from all units are presented as funnel plots, which are favoured over league tables because they take account of normal variation due to case mix. Where a unit is performing to a level that is not statistically different from another, the funnel display avoids inappropriate interpretation and allows the audit process to concentrate on true outliers. Where centres find that their performance lies statistically outside that expected, this stimulates a re-examination of process to see where improvements can be made. In this way, audit may lead to continuous improvements in performance.
Figure 4 shows the proportion of cases for individual hospitals where a CTB time of less than 150 minutes was met in 2010. The CTB time is a good measure of the entire system of care in PPCI, from the time the patient first calls for help, performance of the emergency services, and that of the admitting hospital(s). Some fell outside the funnel, indicating more variation than would be statistically expected by chance fluctuations, and so demonstrates that different systems of care are being provided. Those centres where a low proportion of patients were treated within 150 minutes may benefit by learning the processes of care adopted by centres with faster CTB times. Figure 5 shows a similar plot for DTB times, where DTB uses the time of arrival at the door of the PPCI hospital. It demonstrates performance of the PCI centre itself. Data from one year can be compared with another (Figure 6), to show which centres are improving their system of care (and conversely, those where the delays appear to have increased).
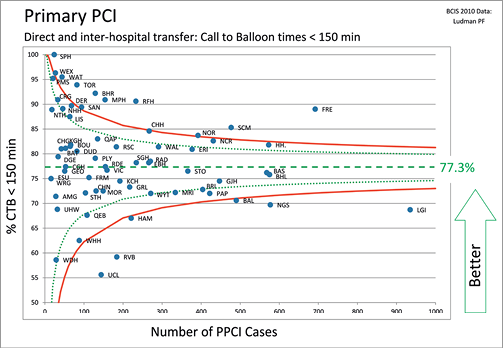
Figure 4. Percentage of cases in individual units where a target call-to-balloon (CTB) time of less than 150 minutes is achieved. CTB time is the time between the patient’s first call to the emergency medical services for help, to the time of first intra-coronary device (see text). Presented as percentage of patients whose CTB is less than 150 min, against the number of primary PCIs performed by that unit; 2 (green) and 3 (red) standard deviation lines of the funnel plot are also displayed.
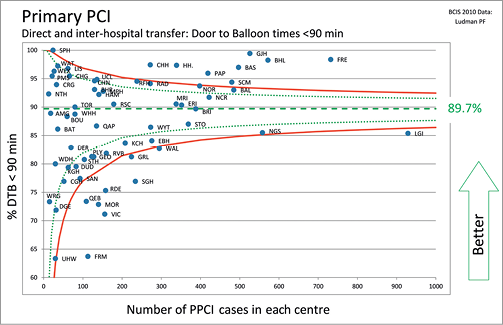
Figure 5. Proportion of cases in individual units where a door-to-balloon time of less than 90 minutes is achieved. DTB time is the time between the patient’s arrival at the PCI centre and the deployment of the first device in the culprit coronary artery (whether that be a thrombectomy catheter, balloon or stent). Presented as percentage of patients whose DTB is less than 90 min against the number of primary PCIs performed by that centre. 2 (green) and 3 (red) standard deviation lines of the funnel plot are also displayed.
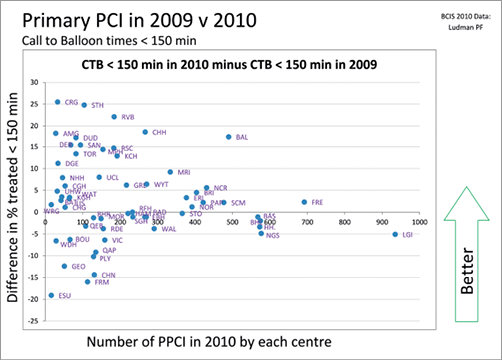
Figure 6. Improvement in call-to-balloon (CTB) times between 2009 and 2010 by PCI centre. Each centre is represented as a labelled point on the graph. Centres above the horizontal zero line have increased the percentage of patients that are treated within 150 minutes of first call for help.
Outcome
The reporting of outcomes is more problematic than processes, whichever form of analysis and public display is used, because the reporting of major adverse cardiovascular events (MACE) or major adverse cardiovascular and cerebrovascular events (MACCE) are dependent on detection, recording and self-reporting by individual units (strict definitions for these events are provided to encourage consistency). A national validation process is unachievable. Moreover, comparative analysis depends on the use of a risk adjustment model (see below). Because all-cause mortality can be assessed by tracking each patient’s unique NHS number, funnel plots of outcomes are provided, accepting that these are not risk-adjusted. In the relatively homogenous cohort of patient who present without the need for ventilation or shock, mortality outcomes from all units appeared satisfactory in 2010, with no unit showing a mortality rate outside the 2 standard deviation (SD) funnel limit (Figure 7). This is a form of “index case” assessment, but fails to include some of the sickest patients. In the more heterogeneous population of all-comers being treated for STEMI by PPCI there was, as expected, more scatter in outcomes, but no unit was outside 3 SD (Figure 8).
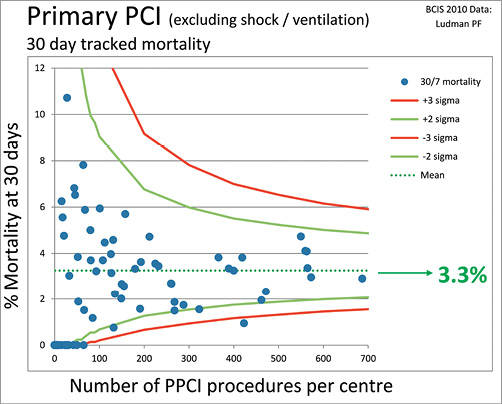
Figure 7. All-cause mortality at 30 days following PPCI for ST-elevation MI in England and Wales in 2010. Patients presenting in cardiogenic shock or requiring ventilation have been excluded from this analysis. Each point on the graph represents a single PCI centre. Mortality is tracked centrally and not dependent on a centre identifying this outcome in their patients.
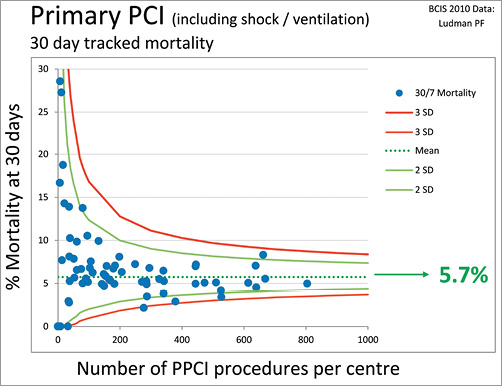
Figure 8. All-cause mortality at 30 days for all patients treated by PPCI for ST-elevation MI in England and Wales, including those in shock or on a ventilator at the time of treatment. Each point on the graph represents a single PCI centre. Mortality is tracked centrally and not dependent on a centre identifying this outcome in their patients.
Variation in patient outcomes following PCI is usually affected more by the clinical characteristics of the patient, and their presenting clinical syndrome, than the quality of the care received. To assess quality of care it is therefore essential to adjust for these risk factors. For the UK audit the North West Quality Improvement programme risk model is currently used to analyse observed and predicted MACCE14. The BCIS audit uses cumulative funnel plots to display these data, as they have the advantage of combining sequential assessment with confidence limits15.
To construct these plots the cumulative mean predicted adverse event rate is calculated as each successive PCI case is added to the series, and plotted as a line (pale blue in Figure 9). Another line is drawn from the cumulative mean actual adverse event rate (dark blue) and 2 and 3 SD confidence limits are added. By examining the actual and predicted lines, one can readily appreciate if observed performance is better or worse than would have been predicted from the risk adjustment model, and also if any difference is more than might be expected by chance (when the line will cross the confidence limits). As the number of cases in the sequence rises, the influence of random fluctuation falls and the confidence intervals narrow, hence the funnel shape of statistical limits.
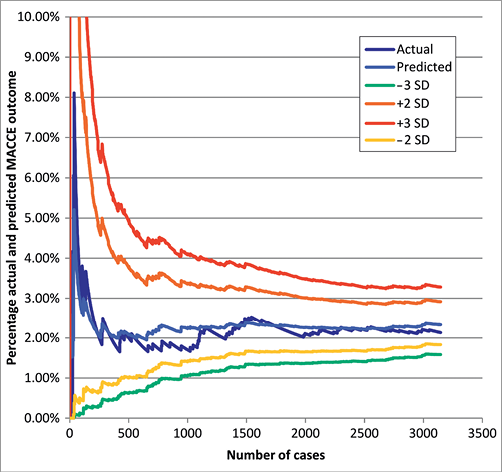
Figure 9. Example of a cumulative funnel plot for an individual centre showing observed versus expected major adverse cardiovascular and cerebrovascular events. See text for details of the construction of this plot.
While these plots simplify the presentation of data, allowing a more intuitive indication of outcomes, there are some caveats. Predicted outcomes are only as good as the model used to make that prediction, yet no model is perfect and all models become out of date particularly where they refer to techniques developing as rapidly as PCI. In addition, the risk profile of patients is self-reported, and some factors that have a large impact on predicted outcome (such as the presence of cardiogenic shock) are relatively subjective judgements. In the UK postprocedural mortality can be measured independently by tracking, and the use of a different model that predicts mortality alone would avoid another potential pitfall, that of having to rely on PPCI units to record accurately all adverse outcomes up to the time of hospital discharge. This can be particularly challenging for patients who are transferred to another centre immediately after PCI. Anonymised examples of such plots are shown at the national meeting to highlight the methodology, but individual hospitals receive their individual plots separately and confidentially.
Programmed reports
To raise the profile of process measures of PPCI, every month each unit in the UK is sent an email with an analysis of several aspects of their performance. There is a particular focus on their CTB and DTB times. Statistical process control (SPC) charts are also sent to centres monthly, providing a graphical display to aid identification of patients who experience long delays to treatment. This form of display plots successive PPCI cases along the x axis with the time delay to treatment on the y axis16,17. An example is shown in Figure 10. Individual patients with prolonged delays sit well above the control line and so are highlighted and can be specifically investigated. Even if the system appears to be stable but the median is at a level that is not as good as other units, then individual components of the process of care can be examined to see where changes could be introduced and improvements in process achieved.
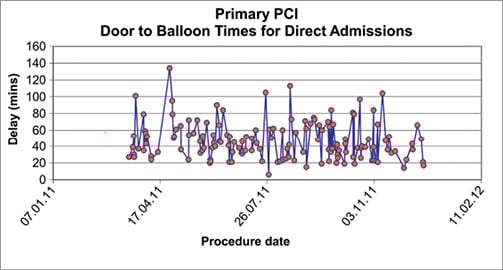
Figure 10. A statistical control plot showing door-to-balloon times for individual patients. This plot shows the delays to treatment for each individual patient, allowing outliers to be readily identified. The effects of changes in systems of care can be demonstrated by observing differences in median times over time intervals16.
All units receive a quarterly cumulative funnel plot of their risk-adjusted outcomes for all PCI activity (described above). The plots for all centres are examined by a confidential BCIS committee and, where outcomes outside the upper confidence intervals are identified, BCIS writes to the clinical lead and medical director of those centres pointing out the observation and recommending further investigation. In most cases, this has identified errors in reporting rather than a truly higher frequency of adverse events.
Does participation in audit impact on the cardiologist’s activity?
Providing feedback alone may not be enough to help the multi-disciplinary teams involved in the care for patients presenting with STEMI. There is evidence that the public reporting of process and outcomes can have a deleterious effect on patient care, because it can cause healthcare professionals to avoid treating the sickest patients, those who potentially have the most to gain from an intervention18,19. There is also evidence that the analysis of outcomes and confidential discussion among the healthcare teams caring for patients can improve outcomes, and that they may not be further improved by public reporting20. Care has been taken to differentiate what is reported publicly (an attempt to stimulate performance) and what is reported confidentially to the individual hospitals. There has been a progressive improvement in the care of patients with STEMI over recent years, both during the thrombolytic era (Figure 11) and now with the almost complete switch to PPCI (Figure 12 and Figure 13). Alongside the transition in reperfusion therapy, observed mortality has fallen9. Cause and effect cannot be proven by these observational data, but both the change in reperfusion strategy and improved prescription of secondary preventive medications (Figure 14) may have a role. We believe that the benchmarking process and public display of performance have been integral to driving up standards of care and improving patient outcomes.
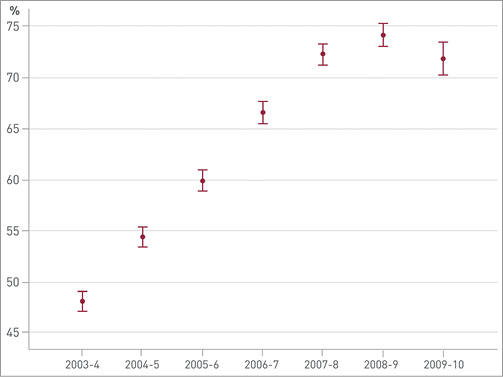
Figure 11. Percentage of patients with an admission diagnosis of STEMI having thrombolytic therapy within 60 minutes of a call for help. The observed fall between 2008-9 and 2009-10 is likely to be due to the substantial increase in the use of primary PCI rather than thrombolysis to treat STEMI. From the 9th MINAP Public report 2010 (http://www.rcplondon.ac.uk/sites/default/files/minap-public-report-sept-2010.pdf).
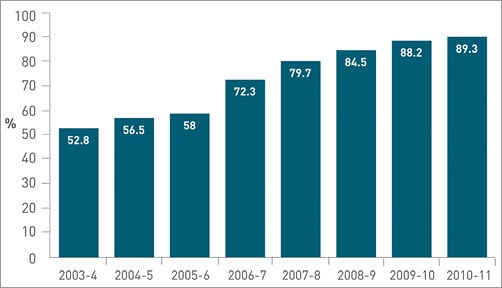
Figure 12. Percentage of patients with an admission diagnosis of STEMI having primary angioplasty within 90 minutes of arrival in hospital. From the 10th MINAP Public report 2011 (http://www.ucl.ac.uk/nicor/audits/minap/minap-news/minapreport2011).
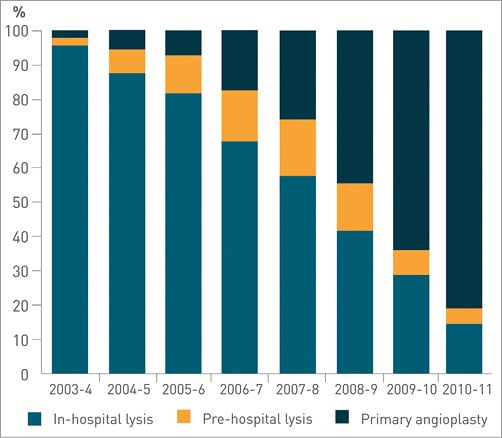
Figure 13. Use of reperfusion treatment for patients with a final diagnosis of STEMI. Primary angioplasty makes up more than 80% of reperfusion treatment. From the 10th MINAP Public report 2011 (http://www.ucl.ac.uk/nicor/audits/minap/minap-news/minapreport2011).
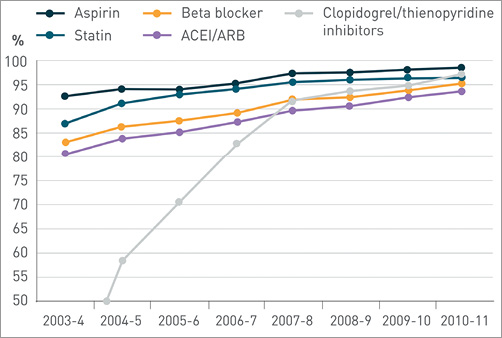
Figure 14. Use of secondary prevention medication (all types of myocardial infarction). Transfers, deaths, contraindicated and patient refusal are excluded. From the 10th MINAP Public report 2011 (http://www.ucl.ac.uk/nicor/audits/minap/minap-news/minapreport2011).
In the near future, physicians and surgeons in the UK will have to conform to a process of appraisal and revalidation. Evidence to be collected as part of this process will reflect the individual doctor’s knowledge, skills and behaviours. As part of the evidence to ensure skills are maintained at an acceptable level, the BCIS audit process will be conformed to report similar processes not only for separate hospitals but also for individual interventional cardiologists.
Conclusion
The UK has long-standing cardiovascular audits, especially those which address the management of patients with acute coronary syndromes. Both the MINAP and BCIS audit projects allow central collection of data, on consecutive patients, presenting to every hospital involved in the acute management of these patients. Reporting of “process” and “outcome” data, both confidentially and within the public domain, has been used to drive up clinical performance and has been associated with steady improvements and reduced inequalities of care.
Conflict of interest statement
The authors have no conflict of interest to declare.