How Perceived Benefits and Barriers Affect Millennial Professionals’ Online Security Behaviors ()
1. Introduction
The purpose of the study was to examine the relationship between Millennial professionals’ perceptions of cybersecurity risks and users’ online security behaviors. The study focused on Millennial professionals as the target population. A thorough review of the factors influencing the perceptions of cybersecurity risks supported the examination of the relationship between perceived benefits, perceived barriers, and users’ online security behaviors. The health belief model served as the theoretical foundations to develop a model to examine the relationship between perceptions of cybersecurity risks and users’ online security behaviors. The theoretical framework allowed for a better understanding of how computer users perceived the benefits and barriers of using anti-malware software and the correlation between these factors and the online security behaviors that Millennials professionals manifested on the internet. A quantitative approach supported the examination of the problem and the collection of the data. The investigation method was based on a self-reported web-based survey to gather data and test the model adapted from the health belief model. The survey provided insights into Millennial professionals’ online security behaviors.
The growing interest that researchers have in users’ perceptions of cybersecurity risks is because individuals, as well as organizations, have become more dependent to technology and the internet to accomplish daily operations [1] [2]. The reliance on technology exposes users to various forms of cyber-attack [1] [2] [3]. The increased use of the internet caused by users demanding great service delivery via the internet has made secure computing and cybersecurity a chief concern [4]. The U.S. government has established a cyber command within the military whose mission is to protect against cyber-attacks from adversaries [5]. The public and private sectors seem to pay less attention to secure computing and cybersecurity practices [4]. The public sector relies on observations, friends, and media to assist with cyber defense strategies [6] [7] [8] [9].
Researchers in information security discipline have leveraged theories from other disciplines to study information security phenomena. The application of the theories in information security has been the subject of a lot of criticism [10]. Scholars have found that the findings based on the protection motivation theory within the information security literature are inconsistent with theoretical expectations [11].
Researchers used the health belief model to explain phenomena in information security [12]. Reference [13] used the health belief model to analyze home personal computer security adoption behavior. Reference [14] used the health belief model to examine user computer security behaviors. Both studies omitted protection motivation, fear appeals, and response efficacy. Reference [15] used the health belief model to examine home computer users’ security awareness, information privacy, and security behaviors. The study solely relied on constructs from the health belief model and did not present any correlation between these constructs and those of the protection motivation theory.
The study contributed to a better understanding of the relationship between Millennials perceptions of benefits and costs of good cybersecurity practice and users’ online security behaviors. As a significant group of the population, Millennials constitute an essential part of the workforce for most organizations [16]. Millennials are the savviest generation regarding the use of information technology products [17] [18] [19]. The significance of the study was that it addresses security managers’ concerns regarding the lack of studies on Millennial professionals’ security-related perceptions and behaviors [20]. There was a gap of knowledge on the understanding of the relationship between Millennial professionals’ perceptions of the benefits and costs of cybersecurity and online security behaviors. The study can help government agencies, businesses, and scholars understand Millennial professionals’ perception of cybersecurity risks and their online security behaviors. Organizations must understand users’ online security behaviors to develop adequate training and policies materials [21]. The findings of the study can support the development of security tools and training tailored to Millennial professionals. Researchers, scholars, and practitioners can take advantage of the study by using the knowledge gained to implement new measures that promote safe online behaviors. Scholars and researchers can build on the results of the study to develop new tools to improve information security.
In the following sections, the paper presents a discussion from scholars and researchers on a holistic approach to the importance of understanding perceptions to explain behaviors. The paper examines the role that perceptions of risks played in shaping online security behaviors. The paper presents a description of the methodology used, data analysis, and results.
2. Review of the Literature
2.1. Millennial Cybersecurity Posture
With the excessive number of cyber-attacks, ensuring the security of computer systems continues to be a challenge to organizations as well as to individuals. In the first quarter of 2016 report, the Anti-Phishing Working Group stated that the total number of unique phishing websites observed was 289,371. The number grew steadily from 48,114 in October 2015 to 123,555 observed in March 2016. The increase represents a 250% jump over six months [22]. Reference [23] reported that in 2016, there were 1209 total breaches with 1.1 billion identities exposed. Most Millennials have risky online security behaviors [24]. Reference [25] reported that as much as 66% of Millennials have connected to a public Wi-Fi network in previous months, and 42% shared a password with a non-family member in 2016. Millennials professionals need to know the type of cyber-attacks they are vulnerable to and how their perceptions of cybersecurity risks affect their security behavior online [26]. Twenty percent of the surveyed participants have never changed the online banking password, and many Millennials use the same password to sign into different accounts/websites. Millennials often skip two-step authentications when they are available and engage in other risky behaviors [25]. It is not clear how the users’ perceptions of cybersecurity risks influence online security behaviors [20].
2.2. Risk Perception in the Cyberspace
Media outlets increasingly report cyber-attacks and incidents. Every month, there are reports of significant incidents affecting hundreds of thousands of users [27]. Despite these reports, it is unclear if Millennials have the requisite knowledge to protect themselves [28]. Some users might have a false sense of security and expose themselves to security risks as a result [29]. The increased number of data breaches through hacking incidents has become a phenomenon of interest for internet security researchers [30]. As the breaches are targeting more online shopping sites, it is likely that users’ knowledge and perceptions of the internet have changed over time [31] [32]. Although internet users are conscious of the potential cyber threats, it does not prevent them from connecting their computers and other smart devices to the internet [33].
Security awareness is one of the essential elements of information security management [34] [35]. Security awareness is the extent to which the members of an organization understand the importance of information security, individual responsibilities, and the minimum security required by the organization and behave accordingly. Today, practitioners and researchers agree that security awareness is critical to a successful and effective information security management and that it will be more cost-effective to invest in security awareness improvement than technology [36] [37]. The current knowledge of security awareness is limited because researchers have not studied the behavioral aspect of security awareness and its operationalization and conceptualization in existing research have been too broad for the most part [34].
2.3. Health Belief Model
In past security behavioral research, the research relies on constructs developed under the health belief model [14] [38]. Perceived severity, perceived susceptibility, perceived benefits, perceived barriers, cues to action, general security orientation, and self-efficacy are all factors in human behaviors. All these constructs have a particular influence on the security behaviors of computer end-users [15]. Cybersecurity awareness of risks influences users’ attitudes and behaviors toward safety [39] [40]. Most of the studies conducted on the use of the internet and users’ risk perceptions focused on scenarios that identified some of the variables in the risk equation as opposed to the type of threat that exists on the internet [41]. Studies that focused on the social impact of cyber-attacks are rare [42]. Below is outlined the two constructs under the health belief model which represent the dependent variables examined in the study.
Perceived benefits. The construct represents the favorable outcome that the individual perceives in adopting the new behavior that will diminish the risk of acquiring the disease or that of being a victim. An individual will most likely adopt a new behavior if the person thinks that the behavior adopted will decrease the chance of acquiring the disease [43]. If Millennials do not see the benefits of reducing cybersecurity risks, there will be fewer incentives for a change of behavior [44].
Perceived barriers. The construct represents the individual’s apprehension of the difficulties that one will face to adopt the new behavior. It has a direct correlation with preventive security behaviors [45]. Reference [46] implied that from all the constructs in the health belief model, perceived barriers are the most important in assessing a change of behavior.
Below Figure 1 is a view of the theoretical framework.
3. Methodology and Data Analysis
3.1. Methodology
The quantitative methodology supported the approach of the study. In a quantitative method, applying deductive reasoning with the results and responses allows moving from specific to general [47]. Reference [48] developed a survey instrument (see Appendix A) that served as a basis to develop the survey instrument for the study. The researcher had received permission from the authors to use and modify the survey instrument. Validity and reliability are essential elements of a quantitative methodology [49]. A quantitative methodology fits because the variables to measure and the results are numerical data [50]. Quantitative methodology was appropriate as it is evidence-based practice in psychology and used to measure the changes in variables [51].
Survey research was appropriate because of the examination of the relationship between variables [52]. The objective was to examine the relationship between the perceptions of cybersecurity risks and the users’ online security behavior of Millennial professionals. An analysis of the correlation helped determine the relationship between variables and make predictions [53].
3.2. Research Questions and Hypothesis
The dependent variable was the users’ online security behaviors (OSB). The independent variables were perceived benefits (PBE) and perceived barriers (PBA).
3.2.1. Research Questions
RQ1: What is the relationship between Millennial professionals’ perceived benefits and users’ online security behaviors?
RQ2: What is the relationship between Millennial professionals’ perceived barriers and users’ online security behaviors?
3.2.2. Hypotheses
H1o: A correlation does not exist between Millennial professionals’ perceived benefits and users’ online security behaviors.
H1A: A correlation does exist between Millennial professionals’ perceived benefits and users’ online security behaviors.
H2o: A correlation does not exist between Millennial professionals’ perceived barriers and users’ online security behaviors.
H2A: A correlation does exist between Millennial professionals’ perceived barriers and users’ online security behaviors.
3.3. Population and Sample
The population of research represents the group targeted, or the group referred to in the conclusion [54]. The population was Millennial professionals in the United States who met a set of criteria as defined below. Millennials represent the largest generation in the U.S. labor force, with more than one third participating in the labor force. As of 2017, roughly 35% or 35 million of Millennials were looking for work or working [55]. The population included Millennial professionals among Survey Monkey audience, who own a computer and have regular access to the internet. The study did not focus on a specific industry, and the participants had to be employed to meet the professionalism criteria. For the purpose of the study, a professional was defined as someone who uses professional knowledge and skills to address the issues that arise in the workplace [56]. Therefore, the target population criteria included: 1) any Millennials, which refers to individuals born between 1982 and 2000 [57] ; 2) participants must have a current job; 3) participants must own a computer; 4) participants must have regular access to the internet; and 5) participants must be accessible through the SurveyMonkey platform. SurveyMonkey has over 2.5 million daily respondents answering surveys on the platform [58]. The target population represented all the respondents on the platform who met the criteria above. The researcher did not obtain an estimation of the target population since SurveyMonkey could not provide an estimate of how many SurveyMonkey users met criteria a through d. The information collected from each participant during the survey process served as the primary data.
The sample size was determined by using the ANZMTG Statistical Decision Tree, which is a sample calculator that leverages the power calculation for Pearson’s and Spearman’s correlation method. The ANZMTG Statistical Decision Tree is a tool used to determine the sample size in function of the predefined criteria inputted in the tool. The tool confirmed that a sample size of 38 participants was appropriate with a power of 1 − β = 0.9, a correlation coefficient of ρ = 0.5 for a large effect size, and a significance level of α = 0.05, which are the only criteria relevant to calculating the sample size for the Spearman’s correlation test [59] [60] [61]. With the given parameters, the ANZMTG Statistical Decision Tree analysis tool indicated a 90% confidence of obtaining the correct result if the study was repeated with different random samples. Additionally, the level of significance indicated that there is only a 5% risk of false-positive findings with a total sample size of 38 participants for a Spearman’s correlation test [61] [62]. To ensuring greater reliability of the findings, the author went beyond the recommended sample size and conducted the study with a sample size of 109 participants.
3.4. Data Collection
Participants received a clear and unambiguous statement regarding the voluntary nature of the survey. Also, the statement expressed the researcher’s commitment to ensuring the participants’ anonymity and the protection of PII. SurveyMonkey served as a medium to collect data. The data collection process followed a sequence of ten steps as described below:
Step 1. The authors of the survey instrument (see Appendix A) leveraged for the study have granted permission to use and potentially modify the survey instrument selected. The instrument (Likert-type scales) was previously validated in previous studies [48]. In several studies, researchers have developed surveys by combining surveys or using questions from previously validated survey instruments [14] [63] [64].
Step 2. Modifications to the survey instrument consisted of replacing a word such as spyware with malware. The modifications were limited and did not affect any of the significant elements of each survey instrument. The modifications strengthened the content validity which is considered mandatory [65]. Content validity refers to the level to which inferences are legitimate to operationalize the theoretical constructs in the study [66].
Step 3. SurveyMonkey was the platform used to conduct the survey. The researcher sent a letter to request permission and received authorization to use the SurveyMonkey website.
Step 4. A SurveyMonkey account was created to gain access to the products offered on the website. The survey instrument was created using a custom survey creation builder available on the SurveyMonkey website.
Step 5. Invitations were sent to 155 Millennial professionals who had met the targeting criteria. The invitation included the research topic, instructions on how to complete the survey, and a Uniform Resource Locator (URL) link that redirected participants to the online survey once they clicked on it.
Step 6. Once the potential participants clicked on the URL link in the invitation, they had to review an informed consent form which explained the nature of the research, the security measures in place to protect their anonymity and PII and the survey expectations. Participants had the choice to continue the survey or to exit the website [67].
Step 7. Participants who chose to continue with the survey moved on to the next page, where they had to answer four qualifying questions (see Appendix B) to verify their eligibility to participate.
Step 8. If the participants chose to exit the survey here, the survey did not collect their PII, and they were directed to a thank you page which expresses gratitude for their time. The website also automatically directed the participants who had completed the survey to a thank you page at the end. SurveyMonkey saved the answers.
Step 9. At the end of the survey period, all data saved on SurveyMonkey databases were downloaded on an external hard drive and analyzed.
Step 10. The data were encrypted and stored in a secure room. The researcher archived the data contained in the hard drive for 5 years [68]. After 5 years, the researcher will destroy the data.
4. Data Analysis
A quantitative, non-experimental, correlational design was the best fit because it facilitated the analysis of the relationship between dependent and independent variables [69]. A quantitative, non-experimental, correlational design supported cause-effect and causal relationship analysis [70]. The research design was useful to analyze strategies [71]. Correlation allowed the identification of the relationship that may exist between two or more variables [70]. The data analysis process followed a sequence of five steps as described below:
Step 1. A valid copy of SPSS (Statistical Package for Social Sciences) was obtained from the university library. SPSS was the statistical tool of choice to analyze the data collected. The data were analyzed using correlation analysis.
Step 2. All the data were entered into SPSS for non-parametric Spearman correlation analysis. Spearman correlation was appropriate for the study as the variables were measured on scales that were ordinal, and the data were considered non-parametric [72].
Step 3. The coefficient of correlation indicated the direction and strength of the relationship between the dependent and independent variables. It allowed for a better appreciation of the influence that one variable had on the other when there was a change in value. The measure of the coefficient of correlation supports all appropriate inferences to the general population [73]. The independent variables considered were perceived susceptibility, perceived severity, perceived barriers, perceived benefits, and self-efficacy in cybersecurity. The dependent variable was users’ online security behaviors. The calculation of the coefficient of correlation helped to determine the direction and strength of the relationship between each pair of variables. The determination was based on the following measures: 1) 0.00 - 0.19 is considered as “very weak”; 2) 0.20 - 0.39 is “weak”, 0.40 - 0.59 is “moderate”, 0.60 - 0.79 is “strong”, and 0.80 - 1.0 is “very strong” [74].
Step 4. An interpretation of the statistical metrics such as median, mean, standard deviation, minimum/maximum values, and count of information presented descriptive statistics of the sample. The non-parametric Spearman correlation analysis supported the decision of whether to reject or fail to reject each null hypothesis using a p-value threshold p < 0.05 to determine the level of significance.
Step 5. Additional analysis was conducted using the data collected with the second group of demographic questions which inquired about the participant’s: 1) age group; 2) gender; 3) region; 4) household income; and 5) internet experience. The analysis aimed at identifying any trends related to each demographic category and to compare between categories and the independent variables.
For the purpose of this study, perceived safeguard effectiveness, perceived safeguard cost, and avoidance behavior were relabelled as perceived benefits, perceived barriers, and online security behaviors respectively for data analysis.
4.1. Participant Demographics
The SurveyMonkey website provided the researcher with the platform to administer the survey to the participants of the study. The targeted audience for the study included Millennial Professionals with or without a college degree, 35 job functions from writer to researcher, 19 options for industry from advertising and marketing to utilities/energy/extraction, and five job levels (owner/executive/C-level, senior management, middle management, intermediate, and entry-level). The first page of the survey contained the informed consent form. Participation in the survey required that each participant agreed to the consent form by clicking the “Yes” box to proceed to the next page where the participant had to answer three qualifying questions. The qualifying questions served as a second layer of screening. Participants who met the criteria had to answer “Yes” to each of the three questions to start answering the survey questions. Any selection of the “No” box on either page (informed consent or qualifying criteria) automatically disqualified the participant.
The demographic question of the survey focused on participants’ number of years of internet experience. All the participants in the survey were Millennial professionals. Participants had a diverse background, as they came from various regions within the United States and represented a broad spectrum of industry sectors. SurveyMonkey website provided the platform through which the survey questions were administered. The participants were all members of the SurveyMonkey pool of active users or panelists. In addition to the demographic question within the survey, SurveyMonkey collected a few demographic data regarding the participants’ age, gender, household income, region, and device type. The additional demographic questions were added to the survey questions for all participants to answer.
4.2. Presentation of the Data
The researcher downloaded and stored the data collected through the SurveyMonkey website on a personal computer. The data was saved in an SPSS format/file and subsequently imported into SPSS Statistics Standard GradPack 24 for descriptive and correlation analysis. Participants’ responses were organized into a demographic section and correlational statistics section. The demographic section presented the data about the participants’ age group, gender, region, household income, and internet experience. The correlational variables section presented the result of the data preparation analysis and the correlation test.
A total of 155 participants agreed to take the survey study. From the total number of participants, four participants were disqualified because they did not agree to the Informed Consent form, 19 participants were disqualified because they did not meet the qualifying criteria, 23 of the participants who consented and qualified to participate in the study did not complete the survey. The remaining 109 participants who completed the survey represented the sample study. There was no need to consider a larger sample, given that the recommended sample size was determined with a power of 1 − β = 0.9, which indicates a 90% confidence of obtaining the correct result if the study was repeated with different random samples. The power selected is superior to the minimum recommended value. Additionally, the significance level of α = 0.05 met the recommended value for most academic studies [61].
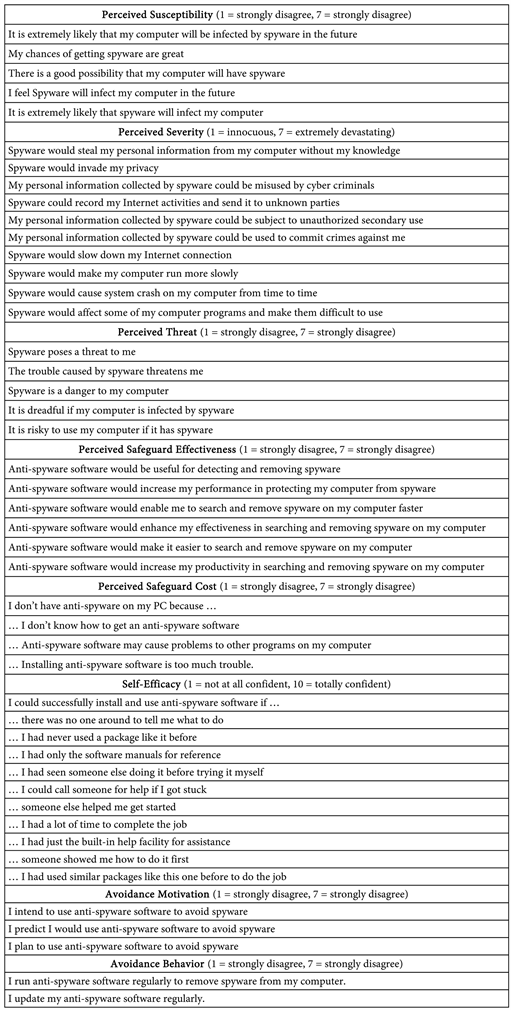
Before starting the analysis of the data collected for the study, it was essential to measure and assess the reliability of the survey instrument. Cronbach’s alpha test helped verify the survey instrument reliability. Cronbach’s alpha is an appropriate test to measure the internal consistency and reliability of a research instrument [75]. The survey instrument centered around 44 statements which constituted the core questions in the survey. The core questions included: 1) five statements measuring the perceived susceptibility construct on a 7-point Likert scale; 2) ten statements measuring the perceived severity construct with a 7-point Likert scale; 3) six statements measuring the perceived benefits construct with a 7-point Likert; 4) three statement measuring the perceived barriers construct with a 7-point Likert scale; 5) ten statement measuring the self-efficacy in cybersecurity with a 10-point Likert scale; and 6) two statements measuring the online security behaviors construct with a 7-point Likert scale.
A Cronbach’s alpha test was performed to measure the internal validity and reliability of each variable. Because the study examined several constructs, a test was performed for each variable to avoid inflating the value of alpha [76]. Reference [77] agreed that a Cronbach’s alpha value 0.70 or above indicates an acceptable level of internal consistency and reliability. Reference [76] indicated that a Cronbach’s alpha value between 0.70 and 0.95 is desirable to support the internal consistency and reliability of an instrument. A higher value may indicate redundancy in the instrument but is still reliable. Other researchers agreed that to confirm internal consistency reliability, the Cronbach alpha value should be at least 0.60 for exploratory studies and 0.70 for confirmatory studies [62]. Reference [78] indicated that 0.70 should be considered as an acceptable reliability coefficient.
An alpha value of 0.930 was measured for the six original questions for perceived benefits (see Table 1). A coefficient greater than 0.9 is considered as excellent. This value indicates that there is an excellent internal consistency of the items in the scale measuring the perceived benefits variable [79] [80].
![]()
Table 1. Perceived benefits reliability statistics.
An alpha value of 0.695 was measured for the three original questions for perceived barriers (see Table 2). An alpha value between 0.60 and 0.70 is considered as questionable and indicates questionable internal consistency within the survey instrument measuring PBA [80]. The alpha value calculated here could be due to the low number of statements [76]. A lower threshold (<0.70) of the reliability coefficient is sometimes used in studies [81].
A second test was performed for PBA to determine the effect on the alpha value when each statement measuring this variable is removed. After dropping PBA2, the Cronbach’s alpha increased to 0.710 (see Table 3). The researcher decided to keep all items measuring PBA in the analysis given that the instrument validity has been tested in previous studies [48] [82]. Reference [48] used two criteria to assess convergent and discriminant validity of the measurements. Their assessment verified that each item had a higher loading on its hypothesized construct than other constructs and that each construct’s Average Variance Extracted (AVE) was higher than the correlations with other constructs [83]. The results met the pre-defined criteria (each item had higher self-loadings than cross-loadings, and each AVE’s square root was higher than the construct’s cross-correlation with other constructs). The researchers also determined the composite reliability coefficient for each construct. All coefficients were greater than 0.70, which suggested an adequate measurement of reliability [48] [82].
In addition to the two independent variables, a Cronbach’s alpha test was also performed on the dependent variable. An alpha value of 0.926 was measured for the two original questions for online security behaviors. A coefficient greater than 0.9 is considered as excellent. This value indicates that there is an excellent internal consistency of the items in the scale measuring the online security behaviors variable [80].
4.3. Descriptive Analysis and Demographic Results
Table 4 presents the frequency distribution of the participants’ number of years of internet experience. The table shows the different ranges under which each participant identified. Most participants had over 20 years of internet experience representing 45.0% of the sample. Participants representing 42.2% of the sample had between 11 and 20 years of internet experience, followed by 12.8% with 6 to 10 years of internet experience (see Table 4).
Table 5 presents the frequency distribution of all the participants’ age. Given that the sample only included Millennial professionals, the age range could only vary between 19 to 37. The table shows that only two age groups were represented in the sample. Participants between the age of 25 to 29 had the highest percentage with 56.9% while the remaining of participants identified between 19 to 24 with 43.1% (see Table 5).
![]()
Table 2. Perceived barriers reliability statistics.
Table 6 presents the frequency distribution of the gender of all the participants. The table shows that the majority of participants were female representing 67.9 % of the sample. Male represented 32.1% of the participants (see Table 6).
Table 7 presents the frequency distribution that provides an insight into the income range of the participants. The table represents the household income of participants. Most participants earned from $50,000 - $74,999 representing 32.1%, while 21.1% earned from $25,000 - $49,999, and 18.3% earned from $75,000 - $99,999 (see Table 7).
4.4. Data Preparation and Screening Analysis
Table 8 presents the frequency distribution related to participants’ perceived benefits to using anti-virus software. The result included a total of 109 values corresponding to the sample size. There was no missing value, as each participant answered all the questions.
Table 9 presents the frequency distribution related to participants’ perceived barriers to using anti-virus software. The result included a total of 109 values corresponding to the sample size. There was no missing value, as each participant answered all the questions.
The researcher performed calculations to determine the mean, median, mode standard variation, and variance to determine the level of each variable in examining the relationship between Millennial professionals’ perception of cybersecurity risks and users’ online security behaviors. The survey questions were assessed using Likert scale ordinal variables with the following weighted formats: 1 = “strongly disagree”, 2 = “disagree”, 3 = “somewhat disagree”, 4 = “neither agree nor disagree”, 5 = “somewhat agree”, 6 = “agree”, and 7 = “strongly agree”. Table 10 presents the result of the analysis, which indicates that perceived benefits have the highest mean score (M = 5.85) of all the variables measured with a
7-point Likert scale. The mean indicates a substantial degree of likelihood that users may be more influenced by the perceived benefits in adopting good online security behaviors. An assessment of the standard deviation indicates that users’ online security behavior had the highest average distance from the mean (M = 4.36) with σ = 2.053, which indicates that participant online security behaviors were more spread out.
4.5. Research Questions
The central research question for the study was what is the relationship between Millennial professionals’ perceptions of cybersecurity risks and users’ online security behaviors? The dependent variable was the users’ online security behaviors (OSB). The independent variables were the perceptions of cybersecurity risks operationalized into the following independent variables for the research: perceived benefits (PBE) and perceived barriers (PBA). In the study, the researchers defined two hypotheses. A test of the two hypotheses helped determine if there was a significant relationship between Millennial professionals’ perceptions of cybersecurity risks and users’ online security behaviors. The central research question takes into consideration the independent variables which produce the following research questions and hypotheses:
The first question and corresponding hypotheses developed in the study were the followings:
RQ1: What is the relationship between Millennial professionals’ perceived benefits and users’ online security behaviors?
H1o: A correlation does not exist between Millennial professionals’ perceived benefits and users’ online security behaviors.
H1A: A correlation does exist between Millennial professionals’ perceived benefits and users’ online security behaviors.
Table 11 presents the result of the Spearman’s correlation test, which showed that the coefficient correlation was 0.330, and the two-tailed significance level was 0.000. The finding showed that a weak positive correlation existed between perceived benefits and online security behaviors, and there was a statistically significant relationship (ρ = 0.330, 0.000 < 0.05). The result from the statistical test provided enough evidence to reject the null hypothesis (H1o) in support of the study.
The second question and corresponding hypotheses developed in the study were the followings:
RQ2: What is the relationship between Millennial professionals’ perceived barriers and users’ online security behaviors?
H2o: A correlation does not exist between Millennial professionals’ perceived barriers and users’ online security behaviors.
H2A: A correlation does exist between Millennial professionals’ perceived barriers and users’ online security behaviors.
Table 12 presents the result of the Spearman’s correlation test, which showed that the coefficient correlation was −0.471, and the two-tailed significance level was 0.000. The finding showed that a moderate negative correlation existed between perceived barriers and online security behaviors, and there was a statistically significant relationship (ρ = −0.471, 0.000 < 0.05). The result from the statistical test provided enough evidence to reject the null hypothesis (H2o) in support of the study.
![]()
Table 11. Spearman’s correlation between PBE and OSB.
**Correlation is significant at the 0.01 level (2-tailed).
![]()
Table 12. Spearman’s correlation between PBA and OSB.
**Correlation is significant at the 0.01 level (2-tailed).
5. Findings and Conclusions
5.1. Implications for Practice
The problem addressed in the study was that the relationship between Millennial professionals’ perceptions of cybersecurity risks and users’ online security behaviors had not been identified [20]. There was a gap of knowledge on the understanding of the relationship between Millennial professionals’ perceptions of cybersecurity risks and online security behaviors. The findings of the study showed that a statistically significant correlation does exist between each of the two independent variables (PBE and PBA) and the dependent variable (OSB). The results of the correlation analysis indicated that Millennial professionals’ perceived benefits of using anti-malware software; perceived barriers to acquiring, installing, and using anti-malware; and ability to install and use anti-malware have a significant relationship with their online security behaviors. Enterprise leaders can leverage these findings and consider how they impact their organization’s security posture. The study provides valuable insight into the Millennial professionals’ perceptions of cybersecurity risks. The knowledge gained from the study can help enterprise leaders tailor information assurance training for their Millennial staff as 76% of the participants agreed on the benefits of using anti-malware software.
5.2. Conclusions
A Spearman’s correlation analysis was performed to determine the strength of the relationship between each of the two variables associated with cybersecurity risk perceptions and users’ online security behaviors. Spearman’s correlation was selected as the best statistical test because the study met the three assumptions necessary for the use of Spearman’s correlation test. All the variables for the study were measured on an ordinal scale, the observation values for the variables were paired, and there was a monotonic relationship in variables.
The research questions for the study inquired about the relationship between each of the constructs associated with Millennial professionals’ perceptions and users’ online security behaviors. To answer these questions, the researcher developed two research questions based on each independent variable: perceived benefits (PBE), perceived barriers (PBA); and the dependent variable which was online security behaviors (OSB).
The first research question examined the relationship between Millennial professionals’ perceived benefits and users’ online security behaviors. The corresponding hypotheses were as follow: The null hypothesis (H1o): A correlation does not exist between Millennial professionals’ perceived benefits and users’ online security behaviors. The alternative hypothesis (H1A): A correlation does exist between Millennial professionals’ perceived benefits and users’ online security behaviors. Table 11 presented the result of the Spearman’s correlation test, which showed that the coefficient correlation was 0.330, and the two-tailed significance level was 0.000. The finding showed that a weak positive correlation existed between perceived benefits and online security behaviors, and there was a statistically significant relationship (ρ = 0.330, 0.000 < 0.05). The result from the statistical test provided enough evidence to reject the null hypothesis (H1o). This finding is consistent with findings elsewhere [14] [84] [85]. Reference [14] found that perceived benefit is a significant factor that influences computer security behavior. This can inform policies and cybersecurity awareness campaigns aimed at improving users’ cyber threat awareness.
The second research question examined the relationship between Millennial professionals’ perceived barriers and users’ online security behaviors. The corresponding hypotheses were as follow: The null hypothesis (H2o): A correlation does not exist between Millennial professionals’ perceived barriers and users’ online security behaviors. The alternative hypothesis (H2A): A correlation does exist between Millennial professionals’ perceived barriers and users’ online security behaviors. Table 12 presented the result of the Spearman’s correlation test, which showed that the coefficient correlation was −0.471, and the two-tailed significance level was 0.000. The finding showed that a moderate negative correlation existed between perceived barriers and online security behaviors, and there was a statistically significant relationship (ρ = −0.471, 0.000 < 0.05). The result from the statistical test provided enough evidence to reject the null hypothesis (H2o). This finding is consistent with findings elsewhere [14] [84] [85]. This can inform businesses looking to sell anti-malware software to potential users. Executives and IT managers can rely on the findings when developing policies and cybersecurity awareness campaigns aimed at improving users’ cyber threat awareness.
Acknowledgements
This study has benefited from the teachings and insights of many faculty whose advice was essential in my education. I specially acknowledged the support received from Dr. Schmitt; whose guidance was instrumental in the completion of this study. As a student, I could not be more grateful to have her as my research supervisor. Dr. Schmitt’s availability, comments, and suggestions contributed to the realization of this study!
Appendix A
Survey Instrument
Appendix B
Survey Questions
Qualifying Questions
1) Were you born between 1982 and 2000?
Yes
No
2) Are you currently employed?
Yes
No
3) Do you own a computer?
Yes
No
4) Do you have regular access to the internet?
Yes
No