Case
Teaching Notes
Supplementary Resources
Abstract
The case study focuses on the entrepreneurial career of John Hanke, a 1996 MBA graduate of the Haas School of Business at the University of California, Berkeley. While the case’s central storyline centers on Hanke’s most recent venture—an entity called Niantic Labs that develops augmented reality (AR) games, such as Ingress, Pokémon Go, and Harry Potter: Wizards Unite! for use on smart phones—and how he might then best scale this business afterwards during 2019 and beyond with its Real World Platform and the advent of 5G technology, it also examines Hanke’s career as a “professional entrepreneur” that eventually led him to Google in 2004 and the subsequent development of the Google Geo-products division, which created products such as Google Earth, Google Maps, and Google StreetView, under his leadership. Hanke’s story teaches an important lesson in entrepreneurship and innovation: that technical innovations and market opportunities that arise from their application, may evolve through multiple entities, and create multiple opportunities. It is the mark of a true “professional entrepreneur” that Hanke was able to channel his passion for the opportunities created by the convergence of geo-location, gaming, networking and mobility to create a sequence of successful ventures, both free-standing and as corporate divisions, (Keyhole, Google Geo, and Niantic Labs) to create and capture value for customers, employees, investors, and himself.
This case was prepared for inclusion in Sage Business Cases primarily as a basis for classroom discussion or self-study, and is not meant to illustrate either effective or ineffective management styles. Nothing herein shall be deemed to be an endorsement of any kind. This case is for scholarly, educational, or personal use only within your university, and cannot be forwarded outside the university or used for other commercial purposes.
2025 Sage Publications, Inc. All Rights Reserved
Resources
Exhibit 1 Key Milestones in John Hanke’s Career and Niantic Labs
1967 | Born in Cross Plains, Texas |
1980 | Self-teaches himself coding while in junior high school |
1985 | Enters the University of Texas at Austin |
1988 | Chairs the Distinguished Speakers Series at UT |
1989 | Graduates from University of Texas with honors |
1994 | Enters the MBA program at the Haas School of Business at the University of California at Berkeley |
1996 | Graduates with a MBA from Berkeley-Haas |
1998 | Starts his second startup, the Big Network |
1999 | Sells the Big Network |
1999 | Purchases Keyhole technology from Intrinsic Labs |
2004 | Google’s IPO |
2005 | Keyhole rebranded as Google Earth |
2005 | Google Maps launched |
2007 | Google Street View launched |
2010 | Creates Niantic Labs within Google |
2012 | Niantic Labs launches Field Trip |
2013 | First Ingress XM Anomaly takes place in Europe. Primary sites include Hamburg, Germany; Oslo, Norway; Copenhagen, Denmark; Helsinki, Finland; Moscow, Russia; and St. Petersburg, Russia. |
2015 | Niantic Labs spins out of Google |
2016 | Niantic Labs launches Pokémon Go |
2018 | Niantic Labs acquires Escher Reality |
2019 | Niantic Lab launches Harry Potter: Wizards Unite! |
Source: Case Writer Research.
Exhibit 2 Pokémon Go
Starting from the left, the screens of the three smartphones are as follows:
Zoomed out view of the Pokémon Go Game Map
Zoomed in view of player with a Squirtle that just appeared
Squirtle encounter screen
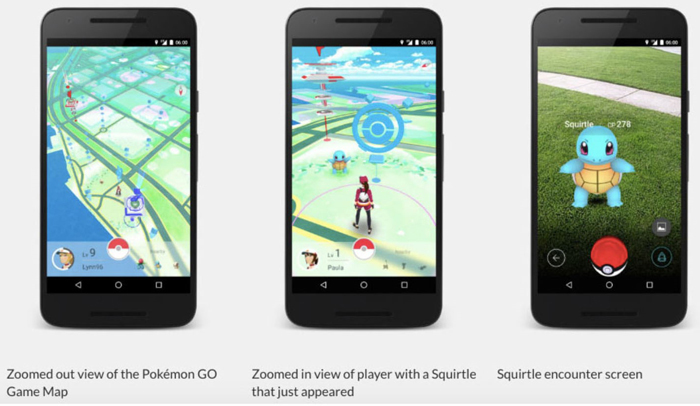
Source: Niantic.
Exhibit 3 Top 26 Most Valuable Private Tech Companies in the U.S.—May 2019
Rank | Company | Mkt Cap $Billion | Description |
1 | WeWork | $47.0 | Shared workspaces for small businesses |
2 | Juu | 38.0 | Nicotine vaporizer developer |
3 | SpaceC | 31.5 | Space transport vehicle manufacturer |
4 | Airbnb | 31.0 | Online marketplace for short-term home rentals |
5 | Stri pe | 22.5 | Online payment platform |
6 | Palantir | 20.5 | Data fusion platforms for companies |
7 | Epic Games | 15.0 | Developer of video games, including Fortnite |
8 | Doordash | 12.6 | On-demand food delivery app |
9 | Sumumed | 12.4 | Drugs for degenerative diseases |
10 | Coinbase | 8.1 | Bitcoin exchange platform |
11 | Wish | 8.0 | Digital shopping app for items directly from suppliers |
12 | Instracart | 7.9 | On-demand grocery app |
13T | Slack | 7.1 | Collaboration and communication platform for workplace |
12T | UniPath | 7.1 | Robotic process automation software |
15 | Tanium | 6.7 | Endpoint security systems |
16 | Magic Leap | 6.4 | Augmented reality and 3D imaginary technologies |
17 | Unity | 6.3 | Game development platform |
18 | Robinhood | 5.6 | Financial investments platform |
19 | Machine Zone | 5.0 | Multiplayer mobile game developer |
20 | Compass | 4.4 | Platform for real estate agents and customers |
21 | SoFi | 4.3 | Financial services for loans and wealth management |
22 | Peloton | 4.2 | At-home stationary bikes and other fitness equipment |
2.3 | Intarcia Therapeutics | 4.1 | Therapeutic drugs for chronic diseases |
24T | Houzz | 4.0 | Platform for home remodeling and design |
24T | Niantic | 4.0 | Augmented reality video games, including Pokémon Go |
24T | Credit Karma | 4.0 | Platform for consumer finance and free credit scores |
Source: Paige Leskin, “The 26 most valuable private tech companies in the US”, Business Insider, May 29, 2019. https:
Exhibit 4a Geographic Information Systems: Multi-Layers
The image has two parts. The left part is labeled the real world and shows a cross sectional square piece of a land divided into two parts by river, which runs diagonally. The left part is filled with numerous trees. The right part has urban buildings. A right arrow from real world points at a stack of square pieces labeled GIS world model. The GIS world model has the following layers in the stack:
- Imagery
- Elevation
- Transportation
- Addresses
- Boundaries
- Water features
- Survey control
- Your data
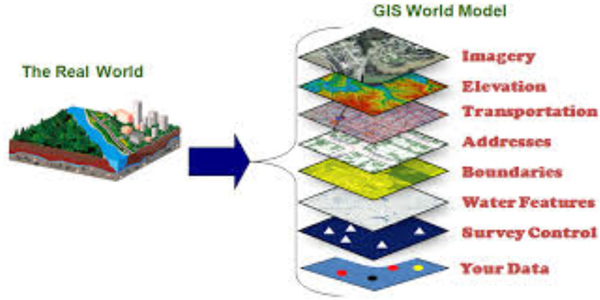
Source: Henrico County, Virginia, GIS information page. Public domain use.
Exhibit 4b Geographic Information Systems – Evolution
In the illustration, there are several arrows that are connected to look like a helical spring. The parts of the spring are color coded to show what was in focus at the time and are labeled. Starting from the bottom and moving up, the event and the corresponding focus shown by the spring are as follows:
- The early years
- Computer mapping (1970s). Mapping focus
- Spatial dB Mgt. Data/structure focus
- GIS modeling (1990s). Analysis focus
- Contemporary GIS
- Revisit Geo-reference (2010s). Data/structure focus
- Multimedia mapping (2000s)
- Revisit analytics (2020s). Analysis focus
- Future directions
On the bottom left of the spring is legend which shows the following relationship:
- Mapping focus points to data/structure focus, which in turn points to analysis focus, which further points to mapping focus.
On the right of the spring is an up arrow labeled time.
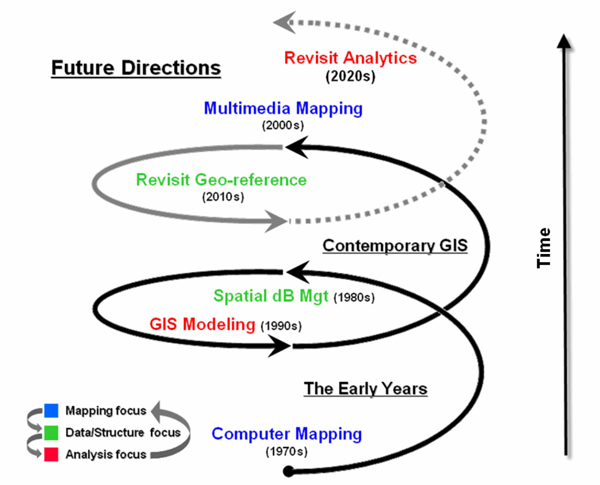
Source: www
Exhibit 5 The World of Google (2015)
In the collage, the name of each product or service is accompanied by its respective logo. The products and services are as follows:
- Google Search: Google’s core business and still the key driver of its revenues and profits.
- Google Books ’03: An online catalog of every book published.
- Gmail ’04: Google’s email and storage service available to users for free.
- Google Maps ’05: Online maps that provide step-by-step navigation and street-view level images.
- Google Drive ’06: Cloud-based office software and storage.
- YouTube ’06: Google’s digital video platform. Acquired for $1.7 billion.
- Google Health ’08: Online medical records and healthcare info. Retired in 2011.
- Android ’08: Google’s mobile-phone operating system.
- Google Chrome ’08: Google’s web browser.
- Google Wave ’09: Failed combination instant messaging and email service targeting workplace use. Retired in 2012.
- Niantic Labs 10: A skunkworks-type lab to identify new-augmented reality-based products through the intersection of social media, geo-local, and gaming.
- Self-driving Cars ’10: Sensor-enabled vehicles that can drive themselves.
- Google Buzz ’10: Twitter-like blogging service. Retired in 2011 due to lack of popularity.
- Chromebooks’ 11: Economic laptops that run on ChromeOS, Google’s desktop operating system.
- Google + ’11: Google’s social platform.
- Google Glass’12: Wearable computer-enabled glasses with built-in camera, info-based lens, and voice command tech. Retired in 2015, largely due to privacy and safety concerns. Icon of a pair of glasses.
- Google Fiber ’12: Dedicated Google fiber network that can provide super-fast internet and cable TV.
- Motorola Mobility ’12: Acquired for 12.5 billion, this longtime handset maker allows Google to make its own mobile phones.
- Calico ’13: Standalone company owned by Google dedicated to work on health and aging.
- Project Loon ’13: Balloons that can provide internet services to remote areas from air.
- Makani Power ‘13: Experimental business that uses airborne turbines to collect usable wind power.
- Nest Labs ’14: Maker of sensor-drivin, artificial intelligence-based home products. Acquired for $3.2 billion.
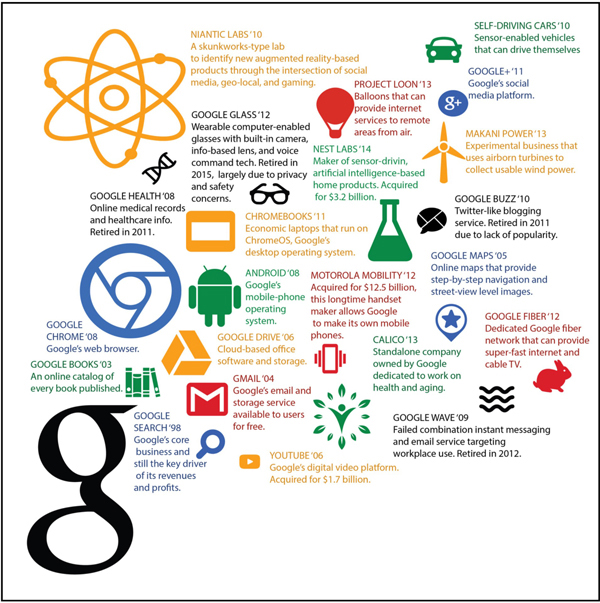
Source: BHCS diagram from Case Writer Research
Exhibit 6 Niantic Real World Platform
In the illustration, there is a transparent, rectangular cube with the logo of Niantic on it. Like the illustration, the cube is also titled Niantic Real World Platform. The cube also has rectangular cards that read gameplay, social, mapping, and Adv. Ar. The cube is horizontally projecting the logos of Ingress, Pokémon go, and Harry Potter Wizards Unite. On the bottom right of the illustration is the logo of Adidas Barcelona. Next to the log number 19 is written.
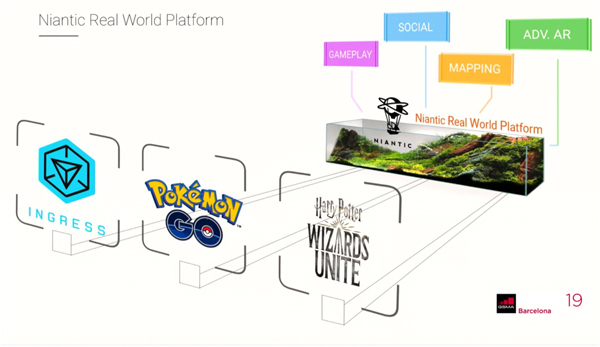
Source: Niantic.
Exhibit 7 Niantic Competitive Positioning (2019)
In the illustration, there is a text box on the left. Next to the text box are two intersecting circles. On the right of the intersecting circles is another text box. The contents text boxes and circles are as follows:
- First text box has the following list:
- Benefiting from secular growth in gaming
- Significant portion of revenue underpinned by mobile or social
- Scalability directly tied to user base
- Monetization through in-app purchases and/or advertising
- First circle. This circle is labeled mobile/social gaming has the names and logos of the following:
- Activation Blizzard
- Net Ease Games
- Huya
- CyberAgent
- NCsoft
- Nexon
- Netmarble
- Tencent
- Sea
- Zynga
- Second circle. This circle is labeled technology platforms and has the names and logos of the following:
- Microsoft
- Snapchat
- Second text box has the following list:
- Holistic B2B2C technology platforms
- Focus on AR/VR
The intersection of the two circles has a Niantic logo in it.
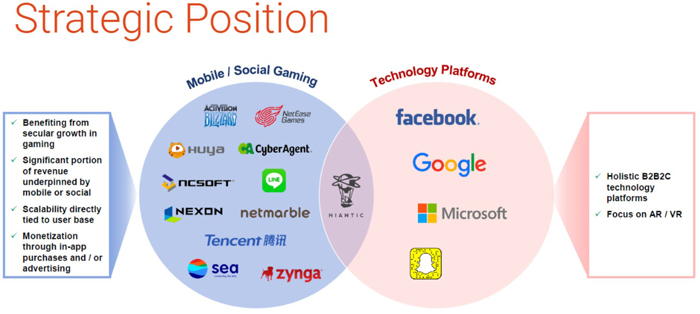
Source: Niantic.
Appendix: The Geography of Innovation and Its Impact on Entrepreneurial Strategy Cluster of Innovation: Silicon Valley1
As an entrepreneur, Hanke’s career benefitted from the Silicon Valley’s ecosystem as he intersected with different key components at different points in his career. A description of the Silicon Valley’s ecosystem as seen through a “Cluster of Innovation” (COI) lens follows.
A global “hot spot.” COIs are global economic “hot spots” where new technologies germinate at an astounding rate and where pools of capital, expertise, and talent foster the new ways of doing business. They are vibrant, effervescent, ecosystems composed of startups, businesses that support the startup process, and mature enterprises (many of whom evolved from rapidly from a startup history). In these ecosystems, resources of people, capital, and know-how are fluidly mobile and the pace of transactions is driven by a relentless pursuit of opportunity, staged financing, and short business model cycles.
In California’s Silicon Valley, the archetype of such a cluster, several key components define these aggregations: universities, government, entrepreneurs, venture capital investors, mature corporations, R&D centers, and specialized service providers and management.2 (Exhibit A) They are also distinguished by key behaviors that favor the development of high-potential entrepreneurial ventures: a high mobility of resources (principally people, capital, and information—including intellectual property); an entrepreneurial process (the relentless pursuit of opportunity without regard for resource limitations); increased velocity of business development; a strategic global perspective; a culture of alignment of interests and transaction structures that reinforced that alignment; incentives and goals that lead to an affinity for collaboration; and development of global ties and bonds.
Silicon Valley is an example of a COI, but certainly not the only COI. Many exist around the world. Many communities share some of the COI attributes and gain advantage by forming close linkages to other innovation hot-spots. Let’s take a closer look at Silicon Valley and reflect on how these attributes are also reflected in other communities we are familiar with around the world.
Key COI Components
Three components—universities, government, and entrepreneurs—played key historic roles in the transformation of the Silicon Valley from a small agricultural valley into the global powerhouse of invention and business creation that now extends north into San Francisco and the East Bay corridor.
- Universities. Major universities, such as the University of California at Berkeley, the University of California at San Francisco, and Stanford University, were the sources of new technologies and inventions. Universities supported commercialization of technology with entrepreneurship education, incubators, and seed funding. For example, at Berkeley, between 1988 and 2012, there were 140 startups from university inventions, including 65 funded at an average of $13.8 million dollars each. At Stanford, between 2006 and 2012, there were 8,961 patents and 2,770 spin-off companies. In addition, there were 30 other colleges and universities in the San Francisco Bay Area that provided an ongoing pool of talent.
- Government. Immediately before World War II and during the Cold War decades afterwards, military contracts provided contracts at Stanford that led to the growth of pillar Silicon Valley companies such as Hewlett-Packard, Varian, and Lockheed Missiles and Space. This provided the foundation for a future techno-centric innovation cluster. In addition, ongoing federally funded research labs, such as the Berkeley National Laboratory, played a central role in ongoing interdisciplinary research. Finally, government policies, such as the Bayh-Dole Act of 1980, gave invention ownership to universities instead of government, fostering spin-offs from government-sponsored research.
- Entrepreneurs. The work force is not only highly educated and technically skilled, but extremely innovative and entrepreneurial. For example, in 2010, the ZIP code 95054—the suburban city of Santa Clara in the heart of the Silicon Valley—produced the most industrial patents of any zip code in the U.S. With over 20,000 patents, this zip code would be ranked 17th compared to all the nations globally. Startups, and the entrepreneurs that drive them, are often highlighted in popular culture. Apple (Steve Jobs and Steve Wozniak), Google (Page and Brin), and Facebook (Mark Zuckerburg) have become cultural icons. This entrepreneurial spirit evolved from California’s Gold Rush Days, when adventurous individuals turned their attention to other enterprises in the Bay Area. What differentiated these adventurous individuals was their willingness to take big risk in return for big gains. Silicon Valley entrepreneurs seek potential upsides and are willing to use outside equity financing in pursuit of these gains, even though it may come at the high price of diluted control over their ventures.
Other Significant COI Components
In addition, four other significant COI components—venture capital, mature corporations, industrial research centers, and service providers and management—evolved in the Silicon Valley as it developed.3
- Venture Capital. Investments in the early Silicon Valley startups, such as Shockley Semiconductor Labs and Fairchild Semiconductor, were provided by operating corporations, not investment firms. With the first IPOs of the Silicon Valley startups—Varian in 1956, Hewlett-Packard in 1957, and Ampex in 1958—professional venture capital firms appeared, investing their own capital in early-stage companies as well as funds from large institutional investors, such as pension funds. Venture capital investors have provided critical capital to nascent companies—in the last decade VC investment in the U.S. has been $26 billion to $30 billion with one-third invested regularly invested in Silicon Valley. In 2012, the San Francisco Bay Area, including the Silicon Valley, accounted for 40 percent of all the venture capital spending in the top 100 U.S. cities. (Exhibit B)
- Mature Corporations. Many of Silicon Valley’s best-known global enterprises (such as Intel, Apple, Cisco, Google, and Genentech) are recently birthed entrepreneurial firms that recognized the benefits of collaborating with emerging firms. Collaboration between mature corporations and startups can take many forms, from simple contractual agreements to equity investments, partnerships, and acquisitions.
- Industrial Research Centers. As Silicon Valley expanded, so did the bounty of research centers. In addition to federally funded research labs, many major corporations also created research and development (R&D) centers either because they were headquartered in the Valley (like Hewlett-Packard or Cisco) or because they wanted their researchers closer to the center of innovation (like IBM, Xerox, and Samsung). This trends continued with the recent imports, including Wal-Mart and Baidu research center. Other independent R&D centers spun out of university relationships, such as the Stanford Research Institute (SRI). In addition to providing the Valley with a deep reservoir of top technical talent, these centers spark new ventures as engineers and scientists seek entrepreneurial outlets for themselves and their projects.
- Service Providers and Management. The needs of large numbers of cash-starved, high-potential startups led to the development of specialized providers (such as lawyers, accountants, design professionals, recruiting firms, investment bankers, incubators, and accelerators) who not only provided tailored professional services, but also were willing to discount or defer fees, often in exchange for a small share in the venture’s eventual returns. Similarly, a professional entrepreneur management class evolved to enable the rapid scaling of young ventures. These managers are highly regarded individuals who specialize in working with startups of a certain size or stage where their functional expertise (i.e., product development, finance, engineering, sales, and marketing) is primary, with industry-specific experience secondary.
- Moore’s Law. A principal—and underlying—driver of technological innovation in the Silicon Valley and worldwide over the last 50 years has been the ever-increasing power of the computer microprocessor, a phenomenon that has now become known as Moore’s Law. Named for the co-founder of Intel who first observed this trend, Gordon Moore had predicted in 1965 that the calculating power of a computer microprocessor would double every 12 months for the next 10 years. Ten years later his prediction had held true. Moore then forecasted in 1975 that the doubling would occur every two years for the next 10 years through 1985. In the late 1980s, Moore again estimated that this doubling would occur every two years for another decade.4 Over a half-century, Moore’s Law still held true. (Exhibit C) This increased power of microprocessors over the last five decades has led to its evolution from integrated circuits to the personal computer, the internet and mobile devices, (Exhibit D) and the emergence of several innovative and disruptive high-tech companies.
Which of these factors were important to Niantic’s eventual success? At what stages? Are they still important? Which may be most useful going forward? [e.g. Established tech incumbents? Early stage tech or game startups? VC firms?] Why? How would you structure to engage with them?
Exhibit A Cluster of Innovation
In the illustration, there is a large oval titled large pools of private capital. It has three intersecting circles listed as follows:
- Circle 1
- Major corporations
- Strategic investors
- R&D centers
- Potential acquirers
- Circle 2
- Entrepreneurs
- Circle 3
- Venture Capital
- Investor
An oval labeled universities touches circle 1 and circle 2. An oval labeled management intersects circle 2. An oval labeled government intersects circle 3. An oval labeled professions is on the bottom and of circle 2 and 3, respectively.
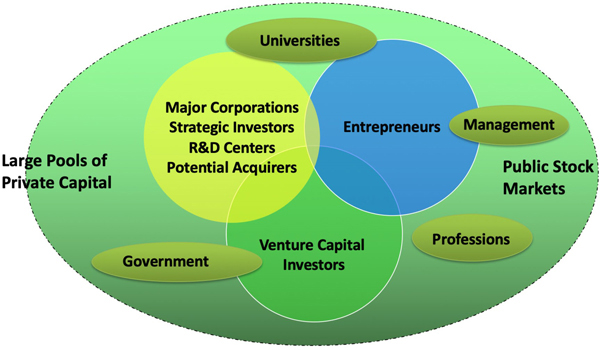
Source: Developed by author, 2016.
Exhibit B Top Cities in the U.S. for Venture Capital Investment (2016)
1. | San Francisco-Oakland-Hayward, CA: $23.401 billion (34.13% of U.S. Total) |
2. | New York City-Newark-Jersey City, NY-NJ-PA: $7.565 billion (11.03%) |
3. | San Jose-Sunnyvale-Santa Clara, CA: $6.718 billion (9.80%) |
4. | Boston-Cambridge-Newton, MA-NH: $6,028 billion (9.79%) |
5. | Los Angeles-Long Beach-Santa Ana, CA: $5.446 billion (7.95%) |
6. | San Diego-Carlsbad, CA: $1.549 billion (2.26%) |
7. | Seattle-Tacoma-Bellevue, WA: $1.503 billion (2.19%) |
8. | Miami-Fort Lauderdale-West Palm Beach, FL: $1.296 billion (1.89%) |
9. | Chicago-Naperville-Elgin, IL-IN-WI: $1.245 billion (1.82%) |
10. | Washington-Arlington-Alexandria, D.C-VA-MD-WV: $1.090 billion (1.59%) |
11. | Austin-Red Round, TX: $977 million (1.43%) |
12. | Philadelphia-Camden-Wilmington, PA-NJ-DE-MD: $897 million (1.31%) |
13. | Atlanta-Sandy Springs-Roswell, GA: $754 million (1.10%) |
14. | Dallas-Fort Worth-Arlington, TX: $678 million (0.99%) |
15. | Salt Lake, UT: $633 million (0.92%) |
16. | Provo-Orem, UT: $549 million (0.80%) |
17. | Denver-Aurora-Lakewood, CO: $502 million (0.73%) |
18. | Minneapolis-St. Paul-Bloomington, MN-WI: $491 million (0.72%) |
19. | Boulder, CO: $368 million (0.54%) |
20. | Durham,-Chapel Hill, NC: $351 million (0.53%) |
Source: Richard Florida, “Venture Capital Remains Highly Concentrated in Just A Few Cities”, Citylab, October 3, 2017, https:
Exhibit C Moore’s Law
In the scatterplot, the horizontal axis is scaled from 1971 to 2011 in irregular increments and labeled date of introduction and the vertical axis is scaled from 2,300 to 2,600,000.00 in irregular increments and labeled transistor count. Most of the transistors are plotted along an increasing line. The transistors plotted in the graph are as follows:
- 4004
- 8008
- RCA 1802
- 8080
- 6800
- MOS 6502
- Z80
- 8085
- 6890
- 8086
- 8088
- 80186
- 80286
- 80386
- 80486
- Pentium
- AMD K5
- Pentium II
- AMD K6
- Pentium III
- AMD K6-III
- AMD K7
- Pentium 4
- Atom
- Barton
- AMD K8
- Itanium 2
- Cell
- Core 2 Duo
- AMD K10
- Itanium 2 with 9MB cache
- Power6
- Core i7 (Quad)
- Six-core Opteron 2400
- AMD K10
- Dual-Core Itanium 2
- Six-Core Xeon 7400
- Quad-Core Itanium Tukwila
- 8 Core Xeon Nehalem-Ex
- Quad-Core z196
- 8-Core Power 7
- Six-core Core i7
- 16-Core SPARC T3
- 10-core Xeon Westermere-Ex
A text on the right of the graph reads note: curve shows transistor count doubling every two years.
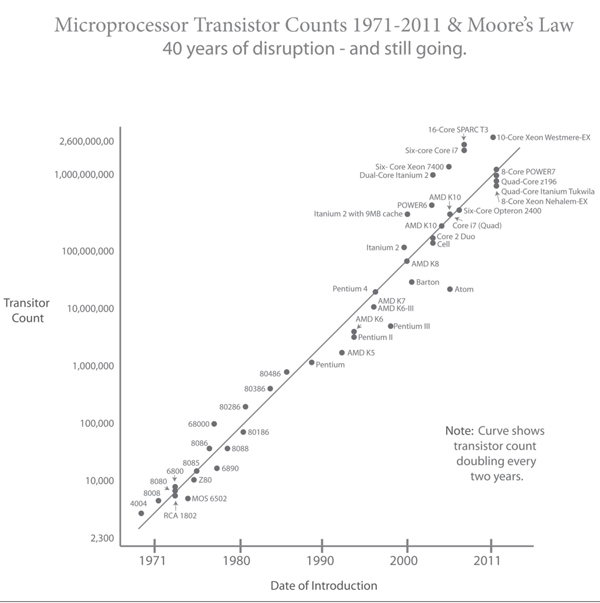
BHCS diagram.
Source: Wikimedia commons. https:
Exhibit D Eras of Technological Innovation
In the graph, the horizontal axis is scaled from 1960s to 2010s in increments of 10 years and labeled date of introduction and the vertical axis is labeled product performance. The graph shows four differently colored S-shaped curves that represent integrated circuits, personal computers, internet, and mobile. Technological innovations are plotted around those curves and are as follows:
- Integrated circuits: late 1960s to late 1970s
- Fairchild
- Shockley semiconductor
- Intel
- AMD
- HP
- Personal computer: late 1970s to early 1990s
- HP
- Xerox
- IBM
- Apple (1976)
- 3Com (1979)
- Osborne (1980)
- Silicon Graphics (1981)
- Internet: early 1980s to late 2000s
- Compaq (1982)
- Cisco (1984)
- eBay
- Yahoo (1995)
- Google (1998)
- Facebook (2004)
- YouTube (2005)
- Mobile: early 1990s to 2010s
- eBay
- Yahoo (1995)
- Google (1998)
- Facebook (2004)
- YouTube (2005)
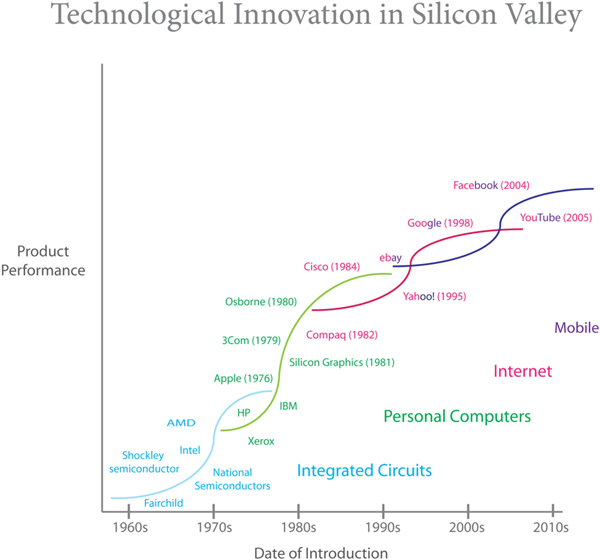
Source: Developed by the author, 2016
Notes
1. Portions of this section from Jerome S. Engel, “Global Clusters of Innovation: Lessons from Silicon Valley,” California Management Review, 57/2 (Winter 2015): 36–65.
2. Jerome S. Engel and I. del-Palacio, “Global Networks of Clusters of Innovation: Accelerating the Innovation Process,” Business Horizons, 52/5 (September 2009): 493–503.
3. Jerome S. Engel, “Global Clusters of Innovation: Lessons from Silicon Valley,” California Management Review, Winter 2015, 36–65.
4. Jeffrey F. Rayport and Bernard Jaworski, e-Commerce (McGraw-Hill, 2001), chapter 9, p. 326.
This case was prepared for inclusion in Sage Business Cases primarily as a basis for classroom discussion or self-study, and is not meant to illustrate either effective or ineffective management styles. Nothing herein shall be deemed to be an endorsement of any kind. This case is for scholarly, educational, or personal use only within your university, and cannot be forwarded outside the university or used for other commercial purposes.
2025 Sage Publications, Inc. All Rights Reserved
