Case
Supplementary Resources
Abstract
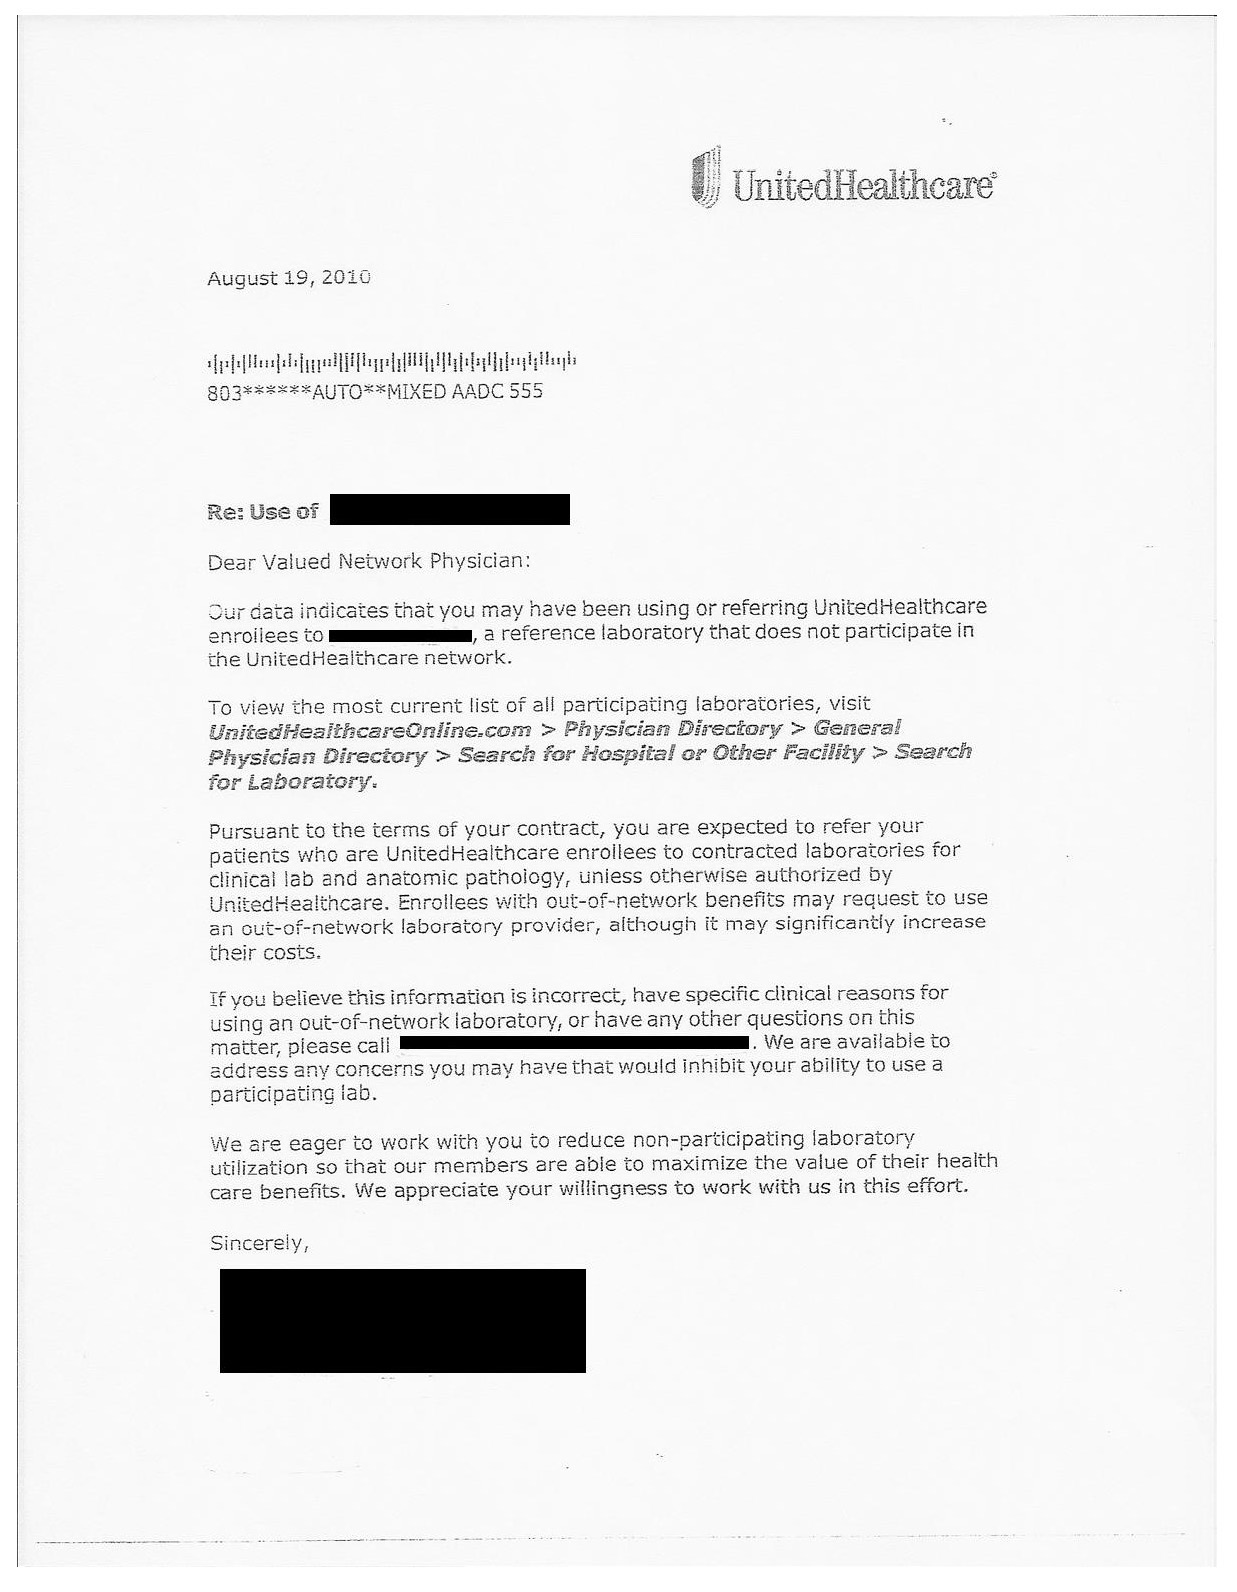
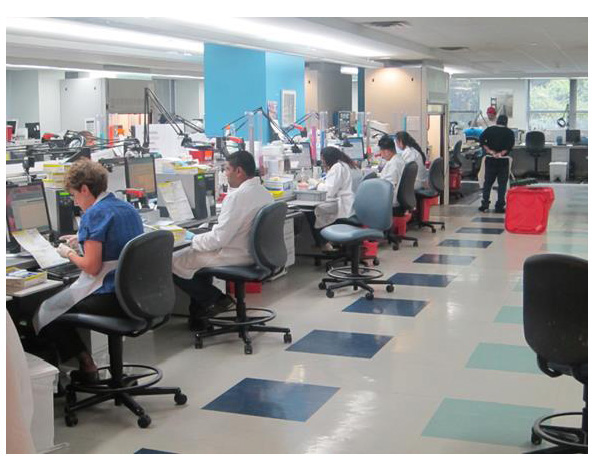
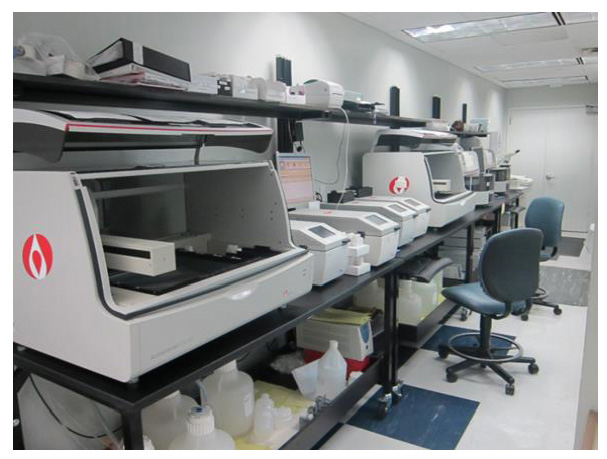
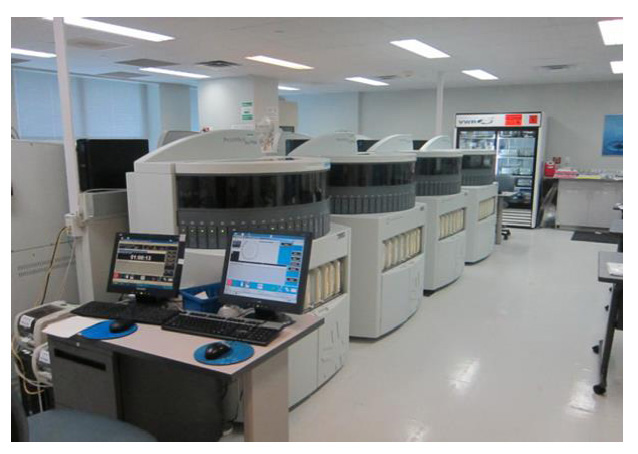
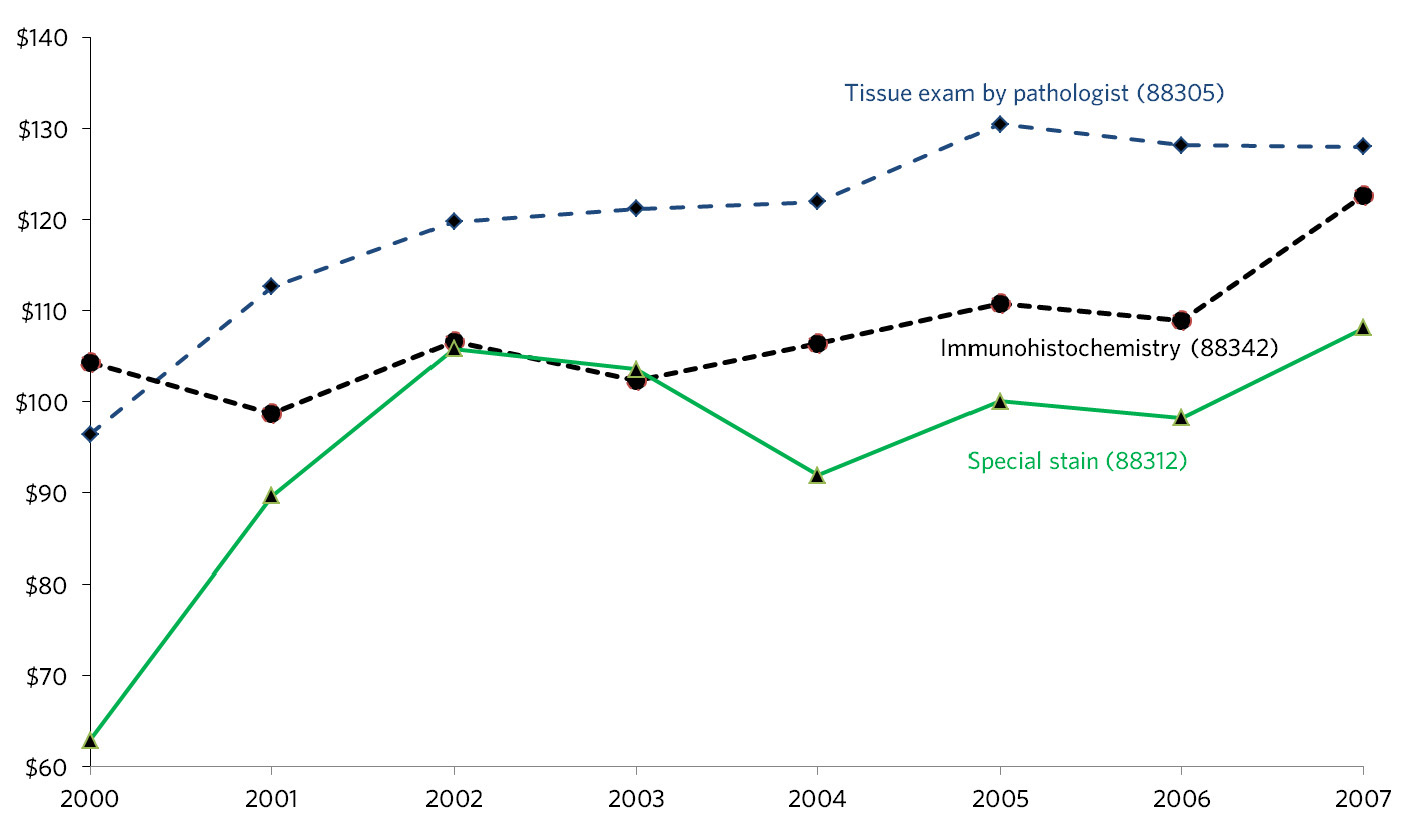
In the beginning of 2007, Dr. Carlos Urmacher, the Chief Medical Officer of CBLPath, and David Bryant, President and Chief Operating Officer of CBLPath, found themselves in the curious position of having their clients ask for their help in reducing the amount of work they were sending to CBLPath. The company was not alone in this situation. Throughout the country, large medical groups were “insourcing” pathology. CBLPath was a medium-sized commercial anatomic pathology lab, serving medical practices on the east coast of the United States. Like other anatomic pathology labs, CBLPath had established relationships with medical practices that needed to have tissue samples (biopsies) analyzed for the presence of disease. Physicians would take biopsies of suspect tissue and courier them to CBLPath's labs. At the lab, the tissue would be prepared for analysis and then scrutinized by pathologists. Having arrived at a diagnosis, the pathologist would issue a written report to the physician. Since Urmacher took an equity stake and went to work for CBLPath in 2000, the company had emphasized high quality medical service. CBLPath employed a large number of pathologists committed to accurate diagnosis and intensive consulting with physicians. When Bryant joined the company from a competitor, CBLPath added increased customer service and a knowledgeable sales force to its operations. In the intervening years, “high touch” service and medical expertise became central to CBLPath's identity. Like other pathology labs, CBLPath billed insurance companies (or Medicare) directly for its services. For each test, there was a technical component (TC) of the bill related to preparation of the sample and a professional component (PC) for the pathologist's analysis. In the 2000s, a number of larger medical practices began to insource the TC and/or PC. The economic incentives were obvious. While insurance companies had reduced the amount they were willing to pay for most medical services, the remittances for pathology tests had remained relatively constant.
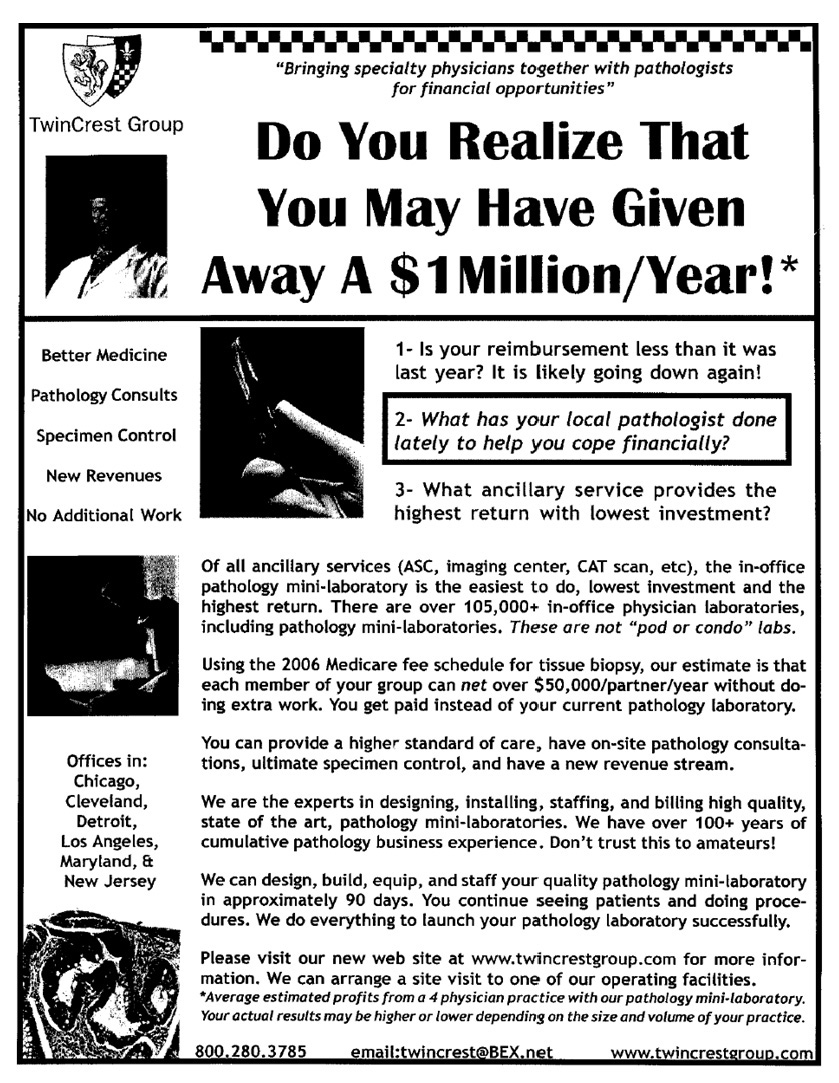
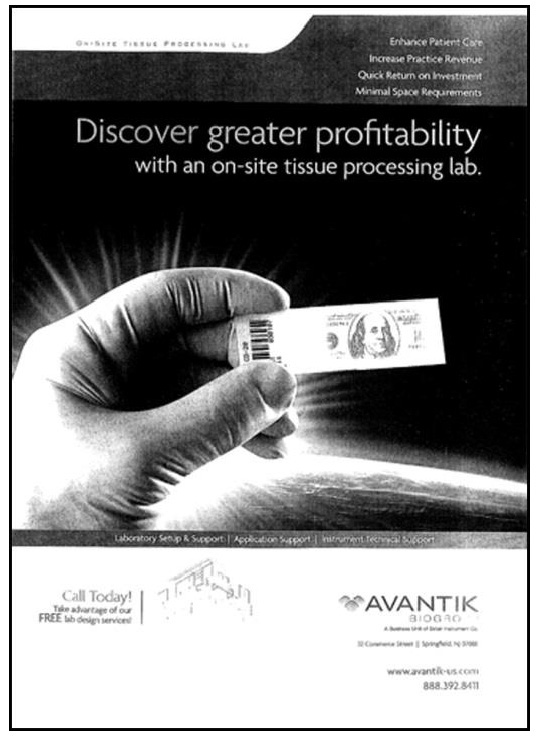
A number of commercial pathology labs were helping medical practices insource by aiding in the set-up of labs in the practices and/or supplying the TC or PC while the practices performed and billed the rest. Some of CBLPath's largest customers had asked the company to join in a similar arrangement. Until now, CBLPath had resisted. Urmacher and Bryant saw CBLPath's reputation for complete and excellent pathology services as being central to the company's future. But with large numbers of their best customers considering insourcing, Urmacher and Bryant wondered if it wouldn't be better to secure half a revenue stream rather than none.
This case was prepared for inclusion in Sage Business Cases primarily as a basis for classroom discussion or self-study, and is not meant to illustrate either effective or ineffective management styles. Nothing herein shall be deemed to be an endorsement of any kind. This case is for scholarly, educational, or personal use only within your university, and cannot be forwarded outside the university or used for other commercial purposes.
2025 Sage Publications, Inc. All Rights Reserved
Resources
Exhibit 1: Quest and LabCorp Financials and Acquisitions
Quest Diagnostics Financial Data Year Ended December 31, 2007 (millions) | |
Selected Operations Data: | |
Net revenues | $6,704 |
Operating income | 1,091 |
Net income | 544 |
Selected Balance Sheet Data (at end of 2007): | |
Cash and cash equivalents | $168 |
Total current assets | 1,374 |
Goodwill, net | 5,220 |
Total assets | 8,566 |
Current liabilities | 1,288 |
Long-term debt | 3,377 |
Selected Quest Diagnostics Acquisitions | |||
Year | Target | Headquarters | Price (in millions) |
2002 | American Medical Laboratories | Virginia | 500 |
2003 | Unilab Corporation | California | 800 |
2005 | LabOne | Kansas | 934 |
2007 | AmeriPath | Florida | 2,000 |
Laboratory Corporation of America Financial Data Year Ended December 31, 2007 (millions) | |
Selected Operations Data: | |
Net revenues | $4,068 |
Operating income | 777 |
Net income | 477 |
Selected Balance Sheet Data (at end of 2007): | |
Cash and cash equivalents | $166 |
Total current assets | 938 |
Goodwill, net | 2,253 |
Total assets | 4,368 |
Current liabilities | 968 |
Long-term debt | 1,667 |
Selected Laboratory Corporation of America Acquisitions | |||
Year | Target | Headquarters | Price (in millions) |
2000 | Dianon Systems | Connecticut | 598 |
2002 | Dynacare | Wisconsin | 488 |
2005 | US Labs | Massachusetts | 155 |
2005 | Esoterix | Texas | 150 |
Exhibit 2: Insurance Company Letter to Physicians

Exhibit 3: CBLPath Market
Specialties by Relative Average Unit Price (AUP) and Volume

Specialists by State | |||||||||||||
---|---|---|---|---|---|---|---|---|---|---|---|---|---|
Colorectal Surgery | Dermatology | Endocrinology | Otolaryngology | Gastroenterology | Gynecologic Oncologists | Hematology | Oncology | Ophthalmology | Surgery | Plastic Surgery | Urology | Radiology | |
New York | 16 | 1092 | 692 | 792 | 1484 | 107 | 862 | 463 | 1785 | 2231 | 601 | 835 | 273 |
New Hampshire | 0 | 58 | 36 | 42 | 80 | 4 | 52 | 49 | 68 | 180 | 25 | 53 | 20 |
Vermont | 0 | 23 | 14 | 28 | 23 | 3 | 17 | 31 | 40 | 84 | 5 | 23 | 5 |
Massachusetts | 6 | 434 | 378 | 287 | 539 | 27 | 346 | 614 | 593 | 1037 | 182 | 281 | 123 |
Rhode Island | 1 | 58 | 31 | 35 | 80 | 11 | 40 | 31 | 71 | 138 | 26 | 44 | 17 |
Connecticut | 5 | 201 | 145 | 132 | 285 | 18 | 141 | 146 | 295 | 382 | 74 | 137 | 71 |
New Jersey | 9 | 398 | 271 | 277 | 587 | 35 | 298 | 213 | 636 | 850 | 231 | 389 | 119 |
Maine | 1 | 29 | 19 | 38 | 59 | 4 | 38 | 44 | 70 | 178 | 17 | 44 | 17 |
Delaware | 0 | 29 | 15 | 29 | 44 | 4 | 25 | 30 | 54 | 98 | 27 | 36 | 6 |
Pennsylvania | 12 | 486 | 312 | 420 | 687 | 49 | 464 | 532 | 880 | 1523 | 263 | 473 | 185 |
Ohio | 11 | 405 | 235 | 384 | 500 | 40 | 310 | 355 | 667 | 1327 | 219 | 396 | 128 |
Washington DC | 5 | 286 | 179 | 210 | 340 | 21 | 204 | 245 | 437 | 596 | 143 | 207 | 74 |
West Virginia | 0 | 37 | 42 | 56 | 62 | 2 | 54 | 31 | 102 | 253 | 26 | 63 | 10 |
Virginia | 3 | 286 | 152 | 265 | 331 | 21 | 190 | 163 | 432 | 754 | 154 | 268 | 97 |
N. Carolina | 4 | 371 | 199 | 327 | 450 | 41 | 231 | 307 | 520 | 882 | 158 | 348 | 121 |
S. Carolina | 3 | 153 | 68 | 142 | 192 | 11 | 99 | 93 | 262 | 540 | 73 | 164 | 43 |
Georgia | 2 | 308 | 145 | 318 | 387 | 21 | 219 | 220 | 444 | 925 | 188 | 275 | 88 |
Florida | 15 | 931 | 408 | 618 | 1042 | 61 | 537 | 551 | 1312 | 1846 | 625 | 747 | 244 |
Tennessee | 1 | 188 | 113 | 217 | 304 | 25 | 170 | 200 | 349 | 680 | 124 | 239 | 81 |
Total | 94 | 5773 | 3454 | 4617 | 7476 | 487 | 4297 | 4318 | 9017 | 14504 | 3161 | 5022 | 1722 |
Exhibit 4: Pathology Billing Codes
The most common billing codes in anatomic pathology were 88305, 88312, and 88342.
- 88305 was the billing code used for a [surgical] tissue exam by a pathologist therefore this code was applied to each biopsy the lab received.
- 88312 was the billing code was used if a biopsy needed a “special stain” in order to help the pathologist diagnose or rule out a specific disease.
- 88342 was the billing code for an immunohistochemical stain, which was used for confirmatory diagnoses of certain diseases.
The 88312 and 88342 codes were used frequently, however not in all pathology cases, unlike the 88305. There were also occasions where all three of these codes as well others for other specialized tests would be needed to describe the work done for a patient's biopsy. The 2007 Medicare reimbursements for each of these codes were:
Code | Used for | Reimbursement Amount (per jar) |
88305 | [Surgical] tissue exam by a pathologist | $128.02 |
88312 | If a biopsy needed a “special stain” in order to help the pathologist diagnose or rule out a specific disease | $108.17 |
88342 | An immunohistochemical (IHC) stain, which was used for confirmatory diagnoses of certain disease states | $112.31 |
Exhibit 5: Photos of CBLPath Lab


Exhibit 6: CBLPath Financials (Data Disguised To Protect Proprietary Information)
Income Statements | |||
---|---|---|---|
FY 2005 | FY 2006 | FY 2007 | |
Revenues | |||
Income - Lab Fees (Gross) | 49,368,617 | 96,995,631 | 166,073,932 |
Lab Fees-Discounts & Write-off | −21,589,863 | −51,340,296 | −94,215,409 |
Interest Income Money Market | 1,595 | 123,854 | 94,864 |
Total Revenues | 27,780,350 | 45,779,189 | 71,953,387 |
Cost of Sales | |||
Salaries & Benefits | 7,727,868 | 12,922,399 | 20,380,617 |
Insurance - Malpractice | 326,380 | 555,104 | 997,787 |
Lab Supplies | 1,058,364 | 1,614,209 | 2,816,277 |
Lab Equipment Repair & Maint. | 46,048 | 74,647 | 188,557 |
Consults & Tech Service | 345,662 | 915,705 | 1,856,026 |
Courier Services | 2,184,487 | 4,569,633 | 6,249,945 |
Waste Disposal | 98,202 | 137,980 | 271,741 |
Printing & Forms | 130,821 | 329,214 | 378,365 |
Occupancy | 306,265 | 563,249 | 1,647,009 |
Other | 61,890 | 98,883 | 124,742 |
Total Cost of Sales | 12,285,987 | 21,781,024 | 34,911,066 |
Gross Profit | 15,494,363 | 23,998,166 | 37,042,320 |
Expenses | |||
Salaries & Benefits | 6,608,242 | 9,972,642 | 12,186,719 |
Professional Services | 404,939 | 419,545 | 585,620 |
Billing Services | 1,221,675 | 2,263,180 | 3,519,919 |
IT & Maintenance | 90,674 | 50,077 | 228,750 |
Depreciation + Amortization | 468,339 | 1,189,407 | 1,912,457 |
Travel | 756,691 | 1,167,989 | 1,624,144 |
Occupancy | 266,961 | 547,376 | 849,031 |
Telephone | 370,237 | 392,572 | 723,935 |
Insurance | 50,728 | 210,321 | 450,923 |
Postage & Shipping | 21,982 | 27,695 | 143,965 |
Sales & Marketing Expenses | 708,372 | 425,907 | 331,851 |
Bad Debt Expense | 1,375,057 | 1,581,786 | 2,536,030 |
Other Expenses | 658,078 | 805,325 | 1,253,072 |
Interest | 887,842 | 358,434 | 406,534 |
Total Expenses | 13,889,818 | 19,412,257 | 26,752,950 |
Income before Income taxes | 1,604,544 | 4,585,909 | 10,289,371 |
Non-Recurring Fees | 442,755 | ||
Provision for Income Taxes | 431,152 | 1,898,868 | 3,896,850 |
Net Income | 1,173,392 | 2,687,041 | 5,949,766 |
EBITDA | 3,010,380 | 6,009,896 | 12,513,498 |
Balance Sheets | |||
---|---|---|---|
FY 2005 | FY 2006 | FY 2007 | |
Assets | |||
Current Assets | |||
Cash & Cash Equivalents | 214,673 | 9,346,490 | 641,598 |
Accounts Receivable - net | 5,979,680 | 7,470,599 | 12,080,454 |
Inventories | 267,895 | 605,312 | |
Taxes Receivable / Def Asset | 352,097 | 160,307 | 459,490 |
Prepaids | 317,042 | 793,540 | 965,512 |
Total Current Assets | 6,863,491 | 18,038,831 | 14,752,368 |
Property, Plant & Equipment | |||
Gross Property and Equipment | 3,239,082 | 6,044,635 | 19,256,272 |
Accumulated Depreciation | 538,591 | 1,272,081 | 3,183,172 |
Net Property, Plant & Equipment | 2,700,491 | 4,772,554 | 16,073,100 |
Other Assets | |||
Loan Origination Fees | 312,898 | ||
Other Deposits & Assets | 37,530 | 158,779 | 58,383 |
Identifiable Intangibles | 9,367,282 | 9,367,282 | 9,367,280 |
Total Other Assets | 9,717,710 | 9,526,060 | 9,425,663 |
Total Assets | 19,281,693 | 32,337,445 | 40,251,131 |
Liabilities and Shareholder Equity | |||
Current Liabilities | |||
Accounts Payable & Accrued Expenses | 2,643,404 | 3,613,560 | 4,875,174 |
Credit Line | 2,498,896 | 284,021 | 1,451,430 |
Preferred Dividends Payable | 1,267,590 | 1,434,284 | |
Income Taxes Payable | 663,487 | ||
Total Current Liabilities | 5,142,299 | 5,828,657 | 7,760,888 |
Long-Term Liabilities | |||
Term Loan | 6,315,942 | ||
Subordinated Debt | 3,077,989 | ||
LT Deferred Taxes Payable | 384,715 | 504,850 | 409,133 |
Deferred Rent | 231,909 | 1,005,454 | |
Capital Leases | 1,222,375 | 1,023,970 | 2,380,905 |
Total Long-Term Liabilities | 4,685,079 | 1,760,729 | 10,111,433 |
Total Liabilities | 9,827,379 | 7,589,386 | 17,872,321 |
Stockholders' Equity | |||
Stock and Paid in Capital | 8,426,399 | 26,632,075 | 26,852,317 |
Retained Earnings | 1,027,916 | 3,503,242 | 6,495,297 |
Dividends | −1,267,590 | ||
Treasury Shares | −4,119,668 | −10,968,805 | |
Total Stockholders' Equity | 9,454,315 | 24,748,060 | 22,378,809 |
Total Liabilities & Stockholders' Equity | 19,281,693 | 32,337,445 | 40,251,131 |
Exhibit 7: CBLPath's Client Distribution
Accessions per Year | Number of Accounts |
1–100 | 1,086 |
100–1,000 | 419 |
1,000–2,000 | 49 |
2,000–3,000 | 17 |
3,000–4,000 | 4 |
4,000–5,000 | 2 |
Exhibit 8: CBLPath Specialties
Specialty | Percent of Total Volume |
General | 6.1 |
Head and Neck | 1.5 |
Breast | 6.4 |
Gastroenterology | 36.0 |
Dermatology | 26.5 |
Endocrinology | 2.4 |
Hematology | 0.4 |
Ophthalmology | 2.3 |
Oral | 0.7 |
Podiatric | 0.8 |
Urology | 9.8 |
Send-Out | 7.2 |
Total | 100.0 |
Exhibit 9: Insourcing Ad


Exhibit 10: Medicare Trends in Pathology Reimbursement 2000–2007

Exhibit 11: PC Only Pro Forma for Medical Practice
Expenses | 1st Year | 2nd Year | |
Start-up | Equipment - All new equipment (i.e. Microscope) | $5,000 | |
Initial Supplies - Slide Storage Containers | $250 | $250 | |
Computer and Printer | $3,000 | ||
Computer Software | $0 | ||
State/CLIA applications | $250 | $100 | |
Start-up Total | $8,500 | $350 | |
Operational | Pathologist's Compensation (Approximately 50% of PC) | $112,000 | $112,000 |
Total Expenses | $120,500 | $112,350 | |
Revenue | |||
Assume: 100% 2007 Medicare Reimbursement * 200 procedures a month * 2 biopsies per procedure* 12 months = 4,800 4,800 (88305.26) + 960 (88312.26) + 960 (88342.26) 4,800($43.50) + 960 ($31.24)+960 ($48.61) | |||
Total Revenues | $285,456 | $285,456 | |
Total Expenses | $120,500 | $112,350 | |
Total Revenue | $285,456 | $285,456 | |
Projected Profit | $164,956 | $173,106 |
Exhibit 12: TC Only Pro Forma for Medical Practice
Expenses | 1st Year | 2nd Year | |
Start-up | Equipment | $93,000 | |
Initial Supplies | $7,000 | ||
Computers | $3,000 | ||
Pathology-specific Computer Software with Support | $5,000 | ||
State/CLIA Application Fees | $2,300 | $100 | |
Construction Cost for Lab | $85,000 | ||
Liability Insurance | $5,000 | $5,000 | |
Start-up Total | $200,300 | $5,100 | |
Operational | Staff Salary/Benefits/Advertisement for FTE Histotechnician | $80,000 | $100,000 |
Medical Director Fee for Pathologist | $10,000 | $10,000 | |
Incidental Shipping | $1,000 | $1,000 | |
Laboratory Consumables | $8,000 | $16,000 | |
Pathologist Comparison Program (Optional) | $1,000 | $1,000 | |
Chemical/Biological Waste Handling | $1,500 | $1,500 | |
Equipment Maintenance Budget (Optional) | $0 | $3,000 | |
Total Expenses | $301,800 | $137,600 | |
Revenue | |||
Assume: 100% 2007 Medicare Reimbursement * 200 procedures a month * 2 biopsies per procedure* 12 months = 4,800 4,800 (88305) + 960 (88312) + 960 (88342) 4,800 ($84.52) + 960 ($76.92) + 960 ($63.69)= | |||
Total Revenues | $540,681 | $540,681 | |
Total Expenses | $301,800 | $137,600 | |
Total Revenue | $540,681 | $540,681 | |
Projected Profit | $238,882 | $403,081 |
Exhibit 13: Global Insourcing Pro Forma for Medical Practice
Expenses | 1st Year | 2nd Year | |
Start-up | Equipment | $93,000 | |
Initial Supplies | $7,000 | ||
Computers and Printer | $3,000 | ||
Pathology-specific Computer Software with Support | $5,000 | ||
State/CLIA Application Fees | $2,300 | $100 | |
Construction Cost for Lab | $85,000 | ||
Liability Insurance | $5,000 | $5,000 | |
Start-up Total | $200,300 | $5,100 | |
Operational | Staff Salary/Benefits/Advertisement for FTE Histotechnician | $80,000 | $100,000 |
Pathologists Compensation (Approximately 50% of the PC) | $112,000 | $112,000 | |
Incidental Shipping | $1,000 | $1,000 | |
Laboratory Consumables | $8,000 | $16,000 | |
Pathologist Comparison Program (Optional) | $1,000 | $1,000 | |
Chemical/Biological Waste Handling | $1,500 | $1,500 | |
Equipment Maintenance Budget (Optional) | $0 | $3,000 | |
Total Expenses | $403,800 | $239,600 | |
Revenue | |||
Assume: 100% 2007 Medicare Reimbursement * 200 procedures a months * 2 biopsies per procedure* 12 months = 4,800 4,800 (88305) + 960 (88312) + 960 (88342) 4,800 ($128.02) + 960 ($108.17) + 960 ($112.31)= | |||
Total Revenue | $826,157 | $826,157 | |
Total Expenses | $403,800 | $239,600 | |
Total Revenue | $826,157 | $826,157 | |
Projected Profit | $422,357 | $586,557 |
This case was prepared for inclusion in Sage Business Cases primarily as a basis for classroom discussion or self-study, and is not meant to illustrate either effective or ineffective management styles. Nothing herein shall be deemed to be an endorsement of any kind. This case is for scholarly, educational, or personal use only within your university, and cannot be forwarded outside the university or used for other commercial purposes.
2025 Sage Publications, Inc. All Rights Reserved