E-submission
Articles
- Page Path
- HOME > J Pathol Transl Med > Volume 57(1); 2023 > Article
-
Review
Perspectives on single-nucleus RNA sequencing in different cell types and tissues -
Nayoung Kim1,2,*
 , Huiram Kang1,2,*, Areum Jo1,2, Seung-Ah Yoo2,3, Hae-Ock Lee1,2,4
 -
Journal of Pathology and Translational Medicine 2023;57(1):52-59.
DOI: https://doi.org/10.4132/jptm.2022.12.19
Published online: January 10, 2023
1Department of Microbiology, College of Medicine, The Catholic University of Korea, Seoul, Korea
2Department of Biomedicine and Health Sciences, Graduate School, The Catholic University of Korea, Seoul, Korea
3Department of Medical Life Sciences, College of Medicine, The Catholic University of Korea, Seoul, Korea
4Precision Medicine Research Center, College of Medicine, The Catholic University of Korea, Seoul, Korea
-
Corresponding Author: Seung-Ah Yoo, PhD, Department of Biomedicine and Health Sciences, Graduate School, The Catholic University of Korea, 222 Banpo-daero, Seocho-gu, Seoul 06591, Korea, Tel: +82-2-3147-8410, Fax: +82-2-532-6537, E-mail: 'youcap78@catholic.ac.kr'
Corresponding Author: Hae-Ock Lee, PhD, Department of Biomedicine and Health Sciences, Graduate School, The Catholic University of Korea, 222 Banpo-daero, Seocho-gu, Seoul 06591, Korea, Tel: +82-2-3147-8365, Fax: +82-2-532-6537, E-mail: 'haeocklee@catholic.ac.kr' - * Nayoung Kim and Huiram Kang contributed equally to this work.
© 2023 The Korean Society of Pathologists/The Korean Society for Cytopathology
This is an Open Access article distributed under the terms of the Creative Commons Attribution Non-Commercial License (https://creativecommons.org/licenses/by-nc/4.0) which permits unrestricted non-commercial use, distribution, and reproduction in any medium, provided the original work is properly cited.
Abstract
- Single-cell RNA sequencing has become a powerful and essential tool for delineating cellular diversity in normal tissues and alterations in disease states. For certain cell types and conditions, there are difficulties in isolating intact cells for transcriptome profiling due to their fragility, large size, tight interconnections, and other factors. Single-nucleus RNA sequencing (snRNA-seq) is an alternative or complementary approach for cells that are difficult to isolate. In this review, we will provide an overview of the experimental and analysis steps of snRNA-seq to understand the methods and characteristics of general and tissue-specific snRNA-seq data. Knowing the advantages and limitations of snRNA-seq will increase its use and improve the biological interpretation of the data generated using this technique.
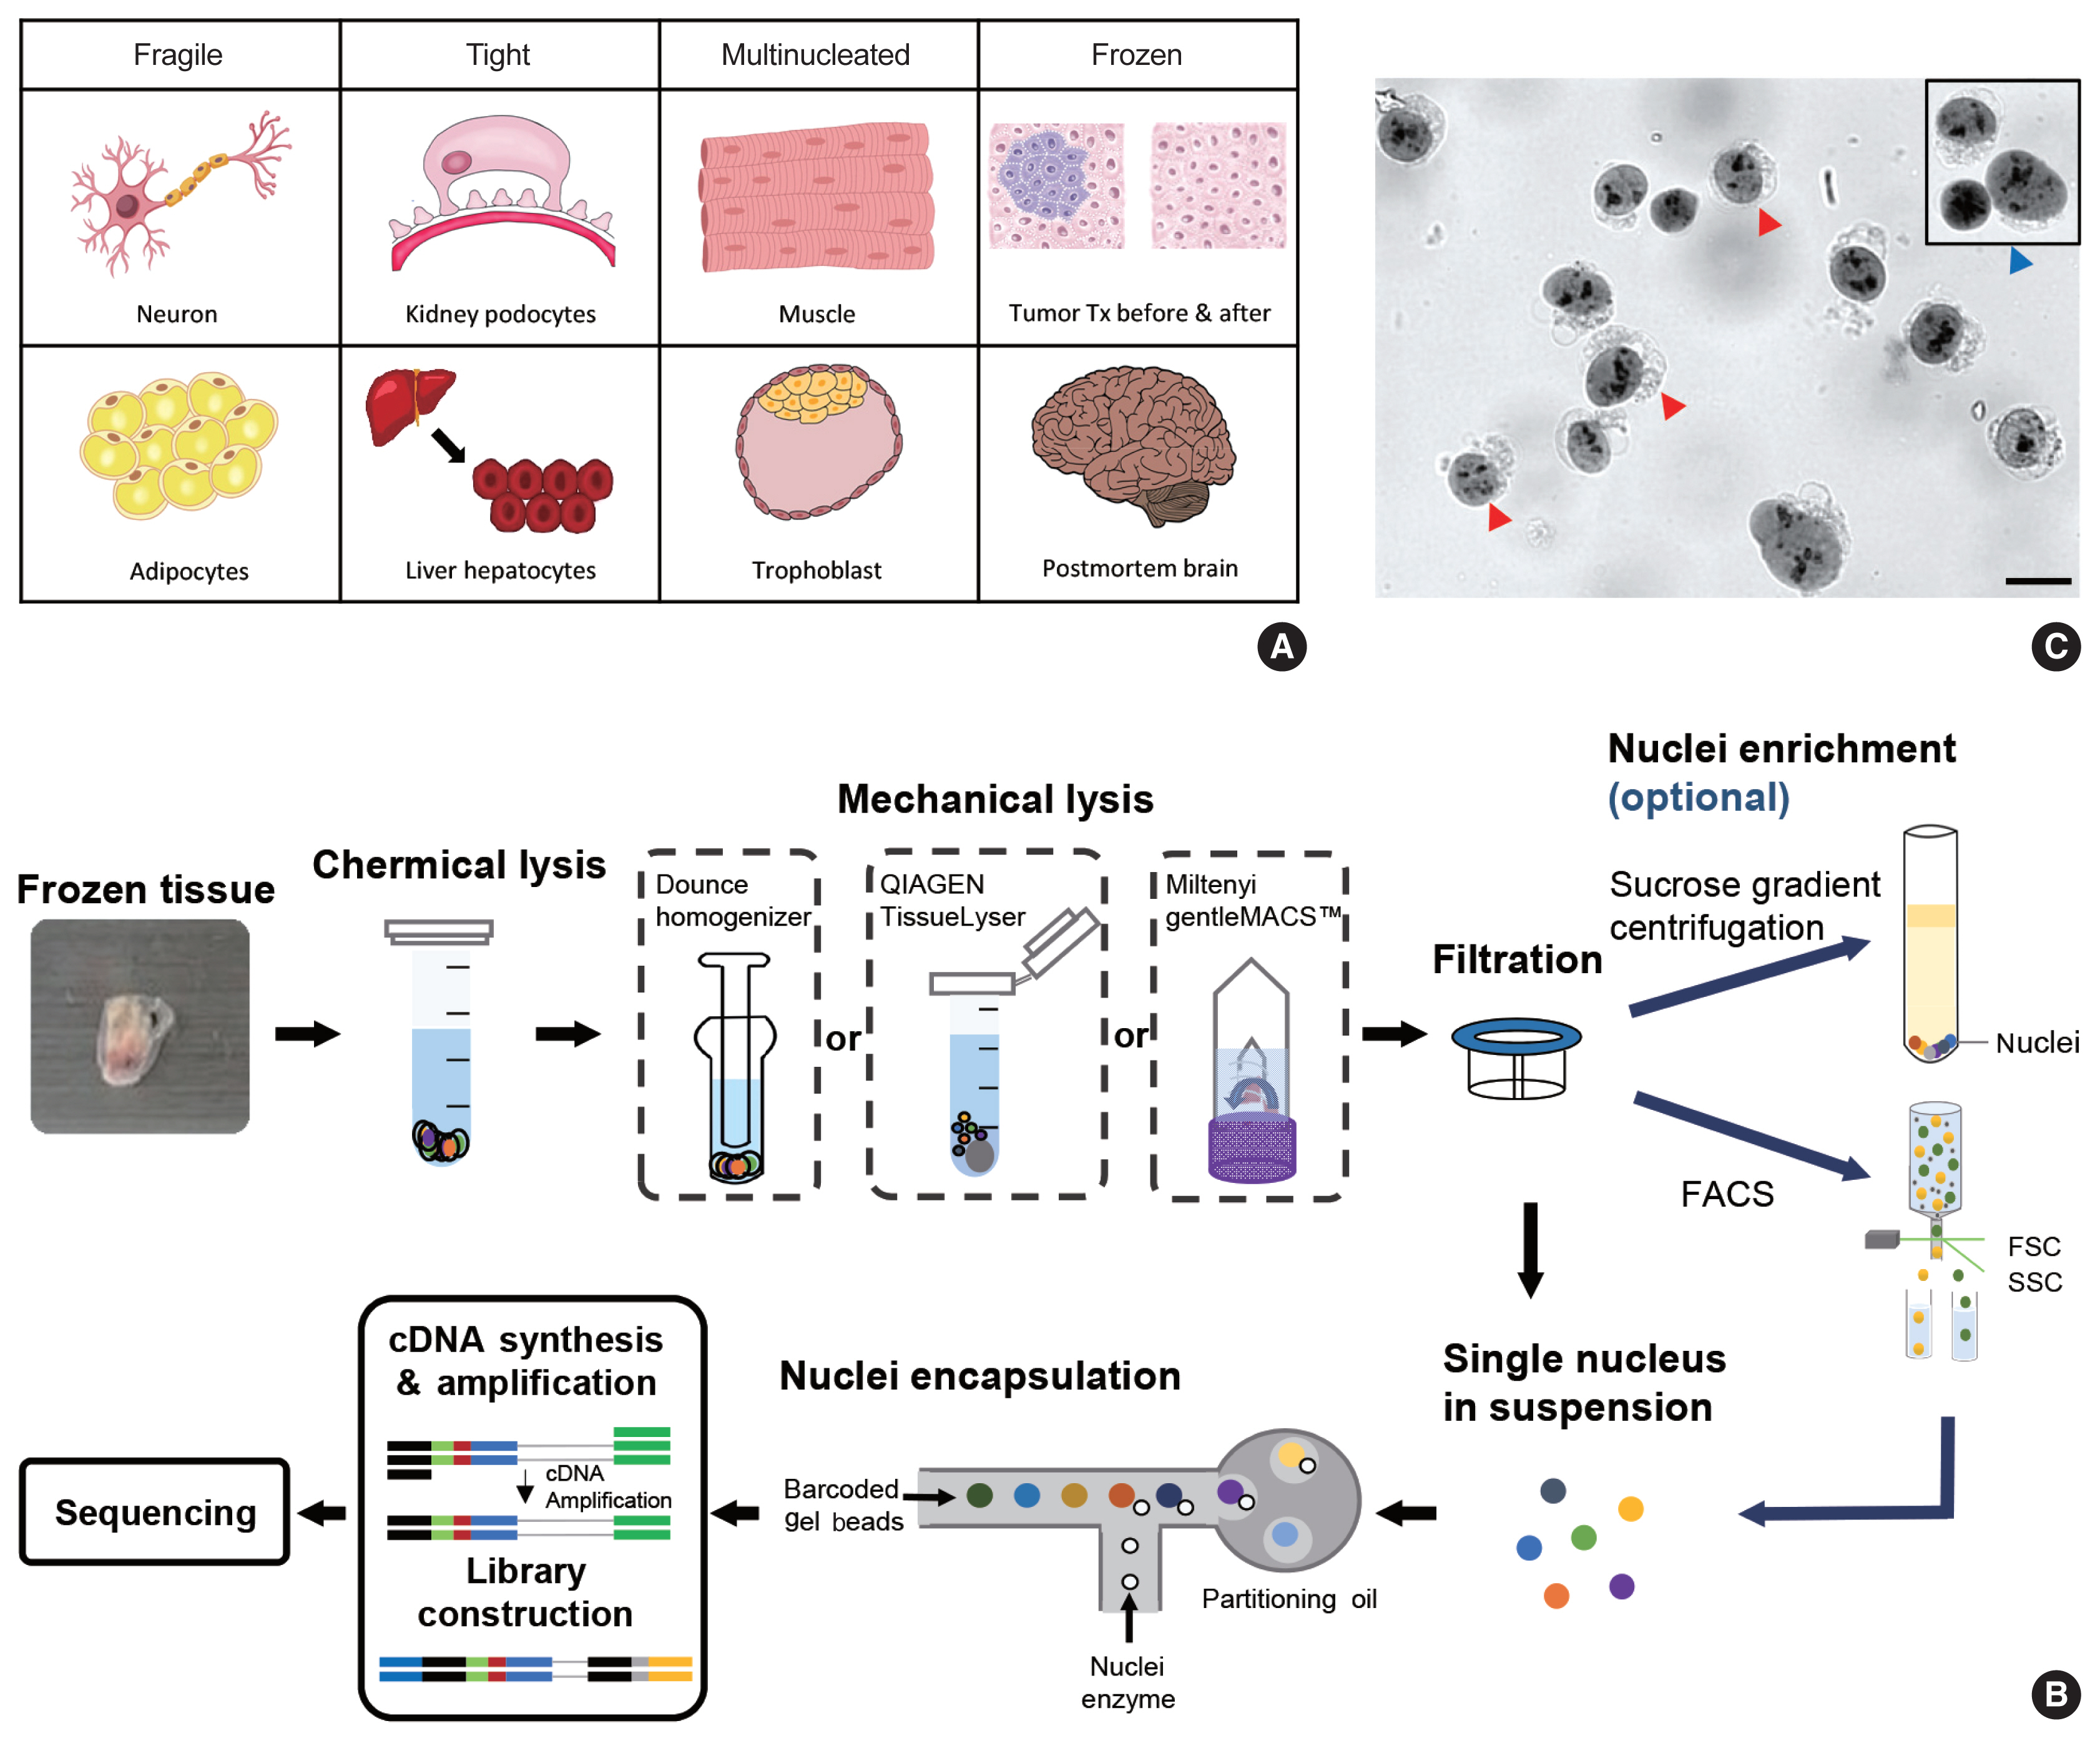
- snRNA-seq was developed as a method to obtain transcriptome data from cells that cannot be successfully dissociated due to their size and/or fragility, such as neurons, adipocytes, and epithelial cell types from the kidney (Fig. 1A). Multi-nucleated cells, such as trophoblasts, osteoclasts, and skeletal myocytes, can be inimitably interrogated using snRNA-seq. Archived frozen tissues with broken cell membranes are also the primary targets of this method. The isolation of single nuclei, instead of whole cells, is achieved by cell membrane lysis, and nuclear transcriptome data are generated using scRNA-seq workflows (Fig. 1B). Both chemical and mechanical forces are used for cell membrane lysis. Competent buffers with nonionic detergents that disrupt cell membranes, but preserve nuclear membranes, have been tested for nuclear isolation [12]. Mechanical force is exerted using a Dounce homogenizer or other types of tissue lysers. To obtain high-quality nuclei containing transcripts, the buffers and wash conditions are important and need to be optimized for different tissue types. The inclusion of bovine serum albumin and a high concentration of RNase inhibitors, during and after the isolation process, is critical. After isolation, nuclear morphology indicative of intact nuclei are confirmed by microscopy at 40–60 × magnification (Fig. 1C). Overlysis results in clumping and poor transcript recovery, whereas under-lysis causes contamination by cytoplasmic RNAs.
- In addition to the isolation of intact nuclei, brain tissues require an additional clean-up process to remove excessive myelin debris. Iodixanol (OptoPrep, San Diego, CA, USA) or a sucrose gradient [15], a myelin removal column (Miltenyi, Bergisch Gladbach, Germany), and sorting by flow cytometry have been used for this extra clean-up process (Fig. 1B). The most frequently used buffer recipe for neurons in the brain is a combination of 250–320 mM sucrose and a low-concentration of non-ionic detergent, whereas the commercial EZ Prep Kit (Sigma, St. Louis, MO, USA) is the method of choice for kidney preparations. Sorting by flow cytometry is not recommended for kidney tissue. The use of commercial buffers other than EZ Prep, such as those from 10 × Genomics (Pleasanton, CA, USA) is also increasing, because of the minimal optimization requirement. Studies providing nuclear isolation protocols for snRNA-seq are listed in Table 1. The details of the buffer recipes and complete protocols can be found in these publications.
EXPERIMENTAL PROCEDURES FOR SINGLE-NUCLEUS RNA SEQUENCING
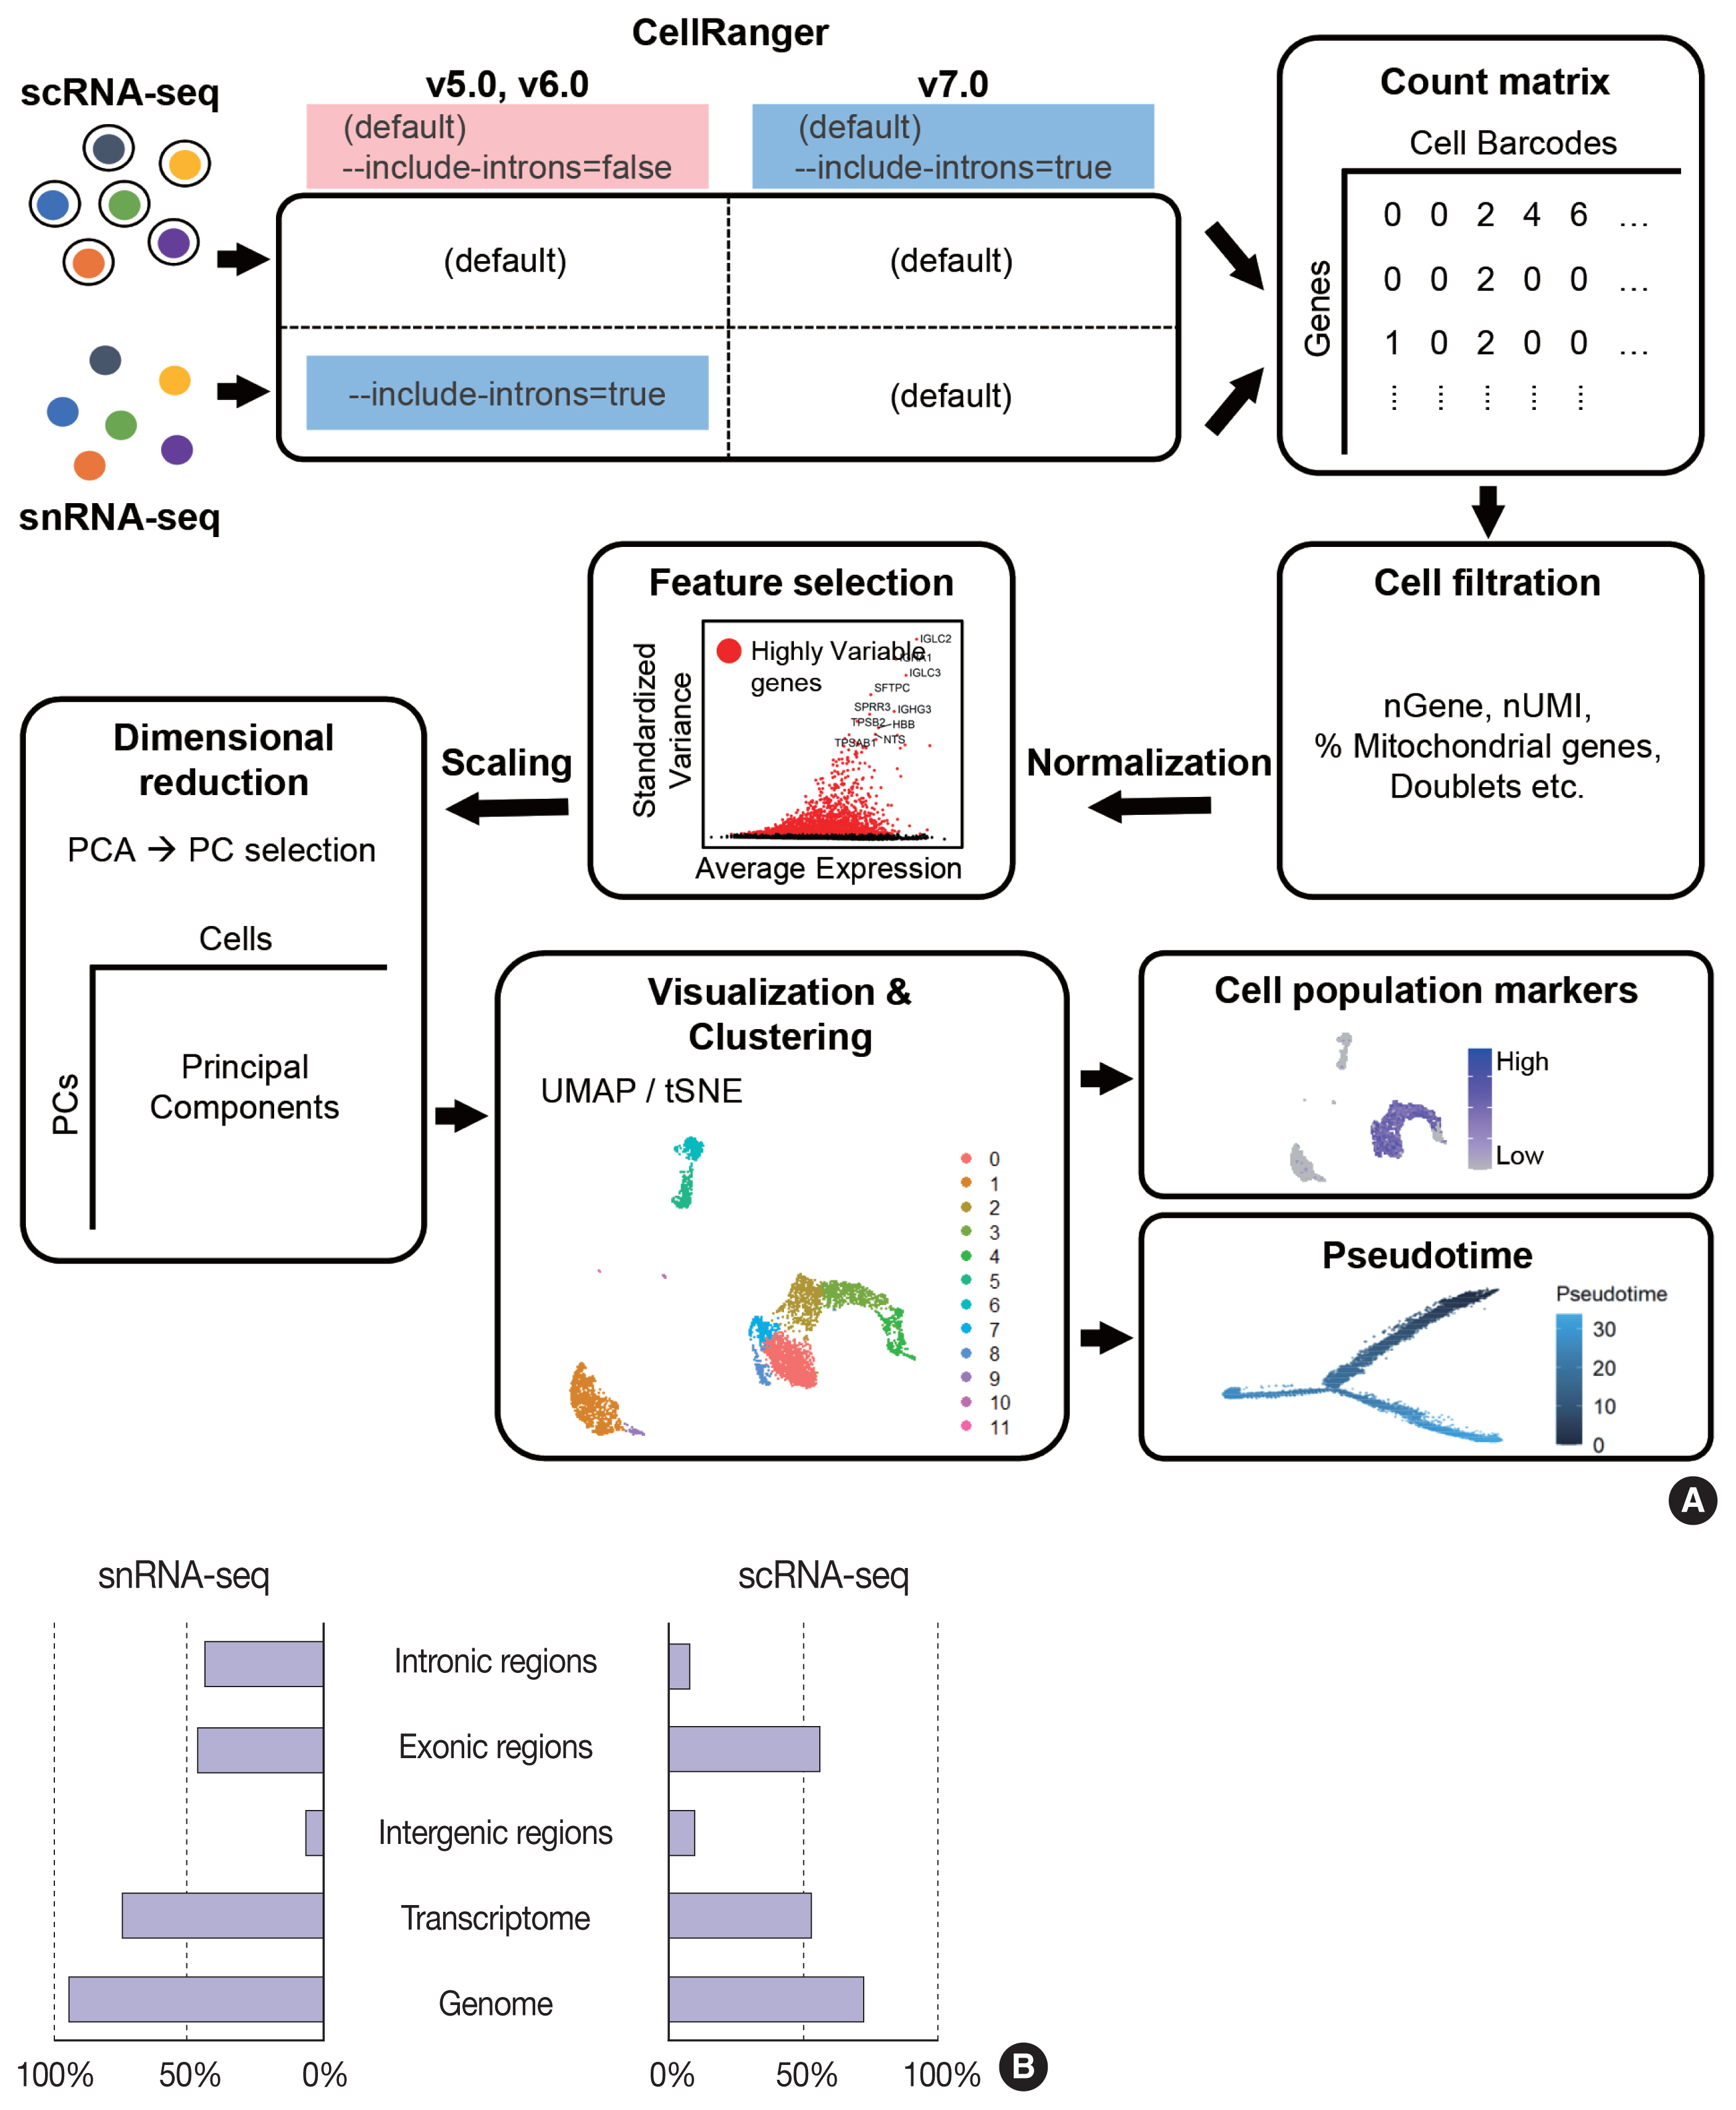
- The data analysis pipeline for snRNA-seq is similar to the pipeline used for scRNA-seq (Fig. 2A). The most frequently used sequencing procedure for snRNA-seq is Chromium 3′ scRNA-seq (10 × Genomics), and the sequencing read mapping process (Cell Ranger 7.0, 10 × Genomics) currently used is identical for scRNA-seq and snRNA-seq. During this process, both exonic and intronic reads that map the sense orientation to a single gene are used for gene counting using the default option. In previous Cell Ranger versions, intronic mapped reads were not used for the default read count option in the scRNA-seq pipeline, and the option parameter, “--include-introns = true” needed to be added for snRNA-seq read counting. The inclusion of intronic reads in snRNA-seq is critical, as more than 50% of nuclear RNAs are typically intronic compared to 15%–25% of total RNAs [13,16]. Immune cell populations such as neutrophils and other granulocytes are more likely to be identified when intronic reads are included. Detection of neutrophils is difficult because of their low RNA content and low gene count [17]. Since neutrophils have a higher amount of introns compared to other cell types [18,19], the inclusion of intronic reads may enhance the recovery of neutrophils. According to the guideline by 10 × genomics, experimental steps are also important to enhance the neutrophil recovery such as immediate processing, sample preparation at room temperature, increasing polymerase chain reaction cycles during cDNA amplification, adding RNase inhibitors in the wash and suspension buffers, and enrichment by fluorescence-activated cell sorting into 0.04% bovine serum albumin solution in scRNA-seq [20].
- From the filtered cell by gene matrices of snRNA-seq data, further quality control (QC) filtering, normalization, feature selection, scaling, dimensional reduction, and clustering can be performed for cell-type annotation, as in scRNA-seq data analyses. Mitochondrial or ribosomal gene contents, which are often used as QC parameters for scRNA-seq, are not robustly used in snRNA-seq, as mitochondria and ribosomes are excluded during the experimental procedure. The differences in sequencing reads between scRNA-seq and snRNA-seq are shown in Fig. 2B.
- Differential expression analysis using bulk RNA sequencing data has demonstrated a high correlation between nuclei and whole-cell samples [21,22]. However, at the single-cell or single-nucleus levels, cell-to-cell or nucleus-to-nucleus correlations decrease and replicate variations become larger than the bulk samples [22]. Direct comparisons of matched scRNA-seq and snRNA-seq data from S1 cortex neurons have demonstrated differences in genomic read mapping to coding sequences, introns, or untranslated regions [23]. Significant gene length bias exists, such that nuclear-biased genes show a length of 17 kb compared with 188 kb for genes detected in both whole cells and nuclei. The total gene expression correlation between single-cell and single-nucleus data ranges from 0.21 to 0.74. In a study of adipocytes, the average gene expression correlation between whole-cell and nuclei data for white cells was found to be 0.5 or 0.6 (after normalization) [24]. Despite the relatively low correlations, diverse batch correction algorithms allow the co-clustering of identical cell types at a global scale in scRNA-seq and snRNA-seq data [24].
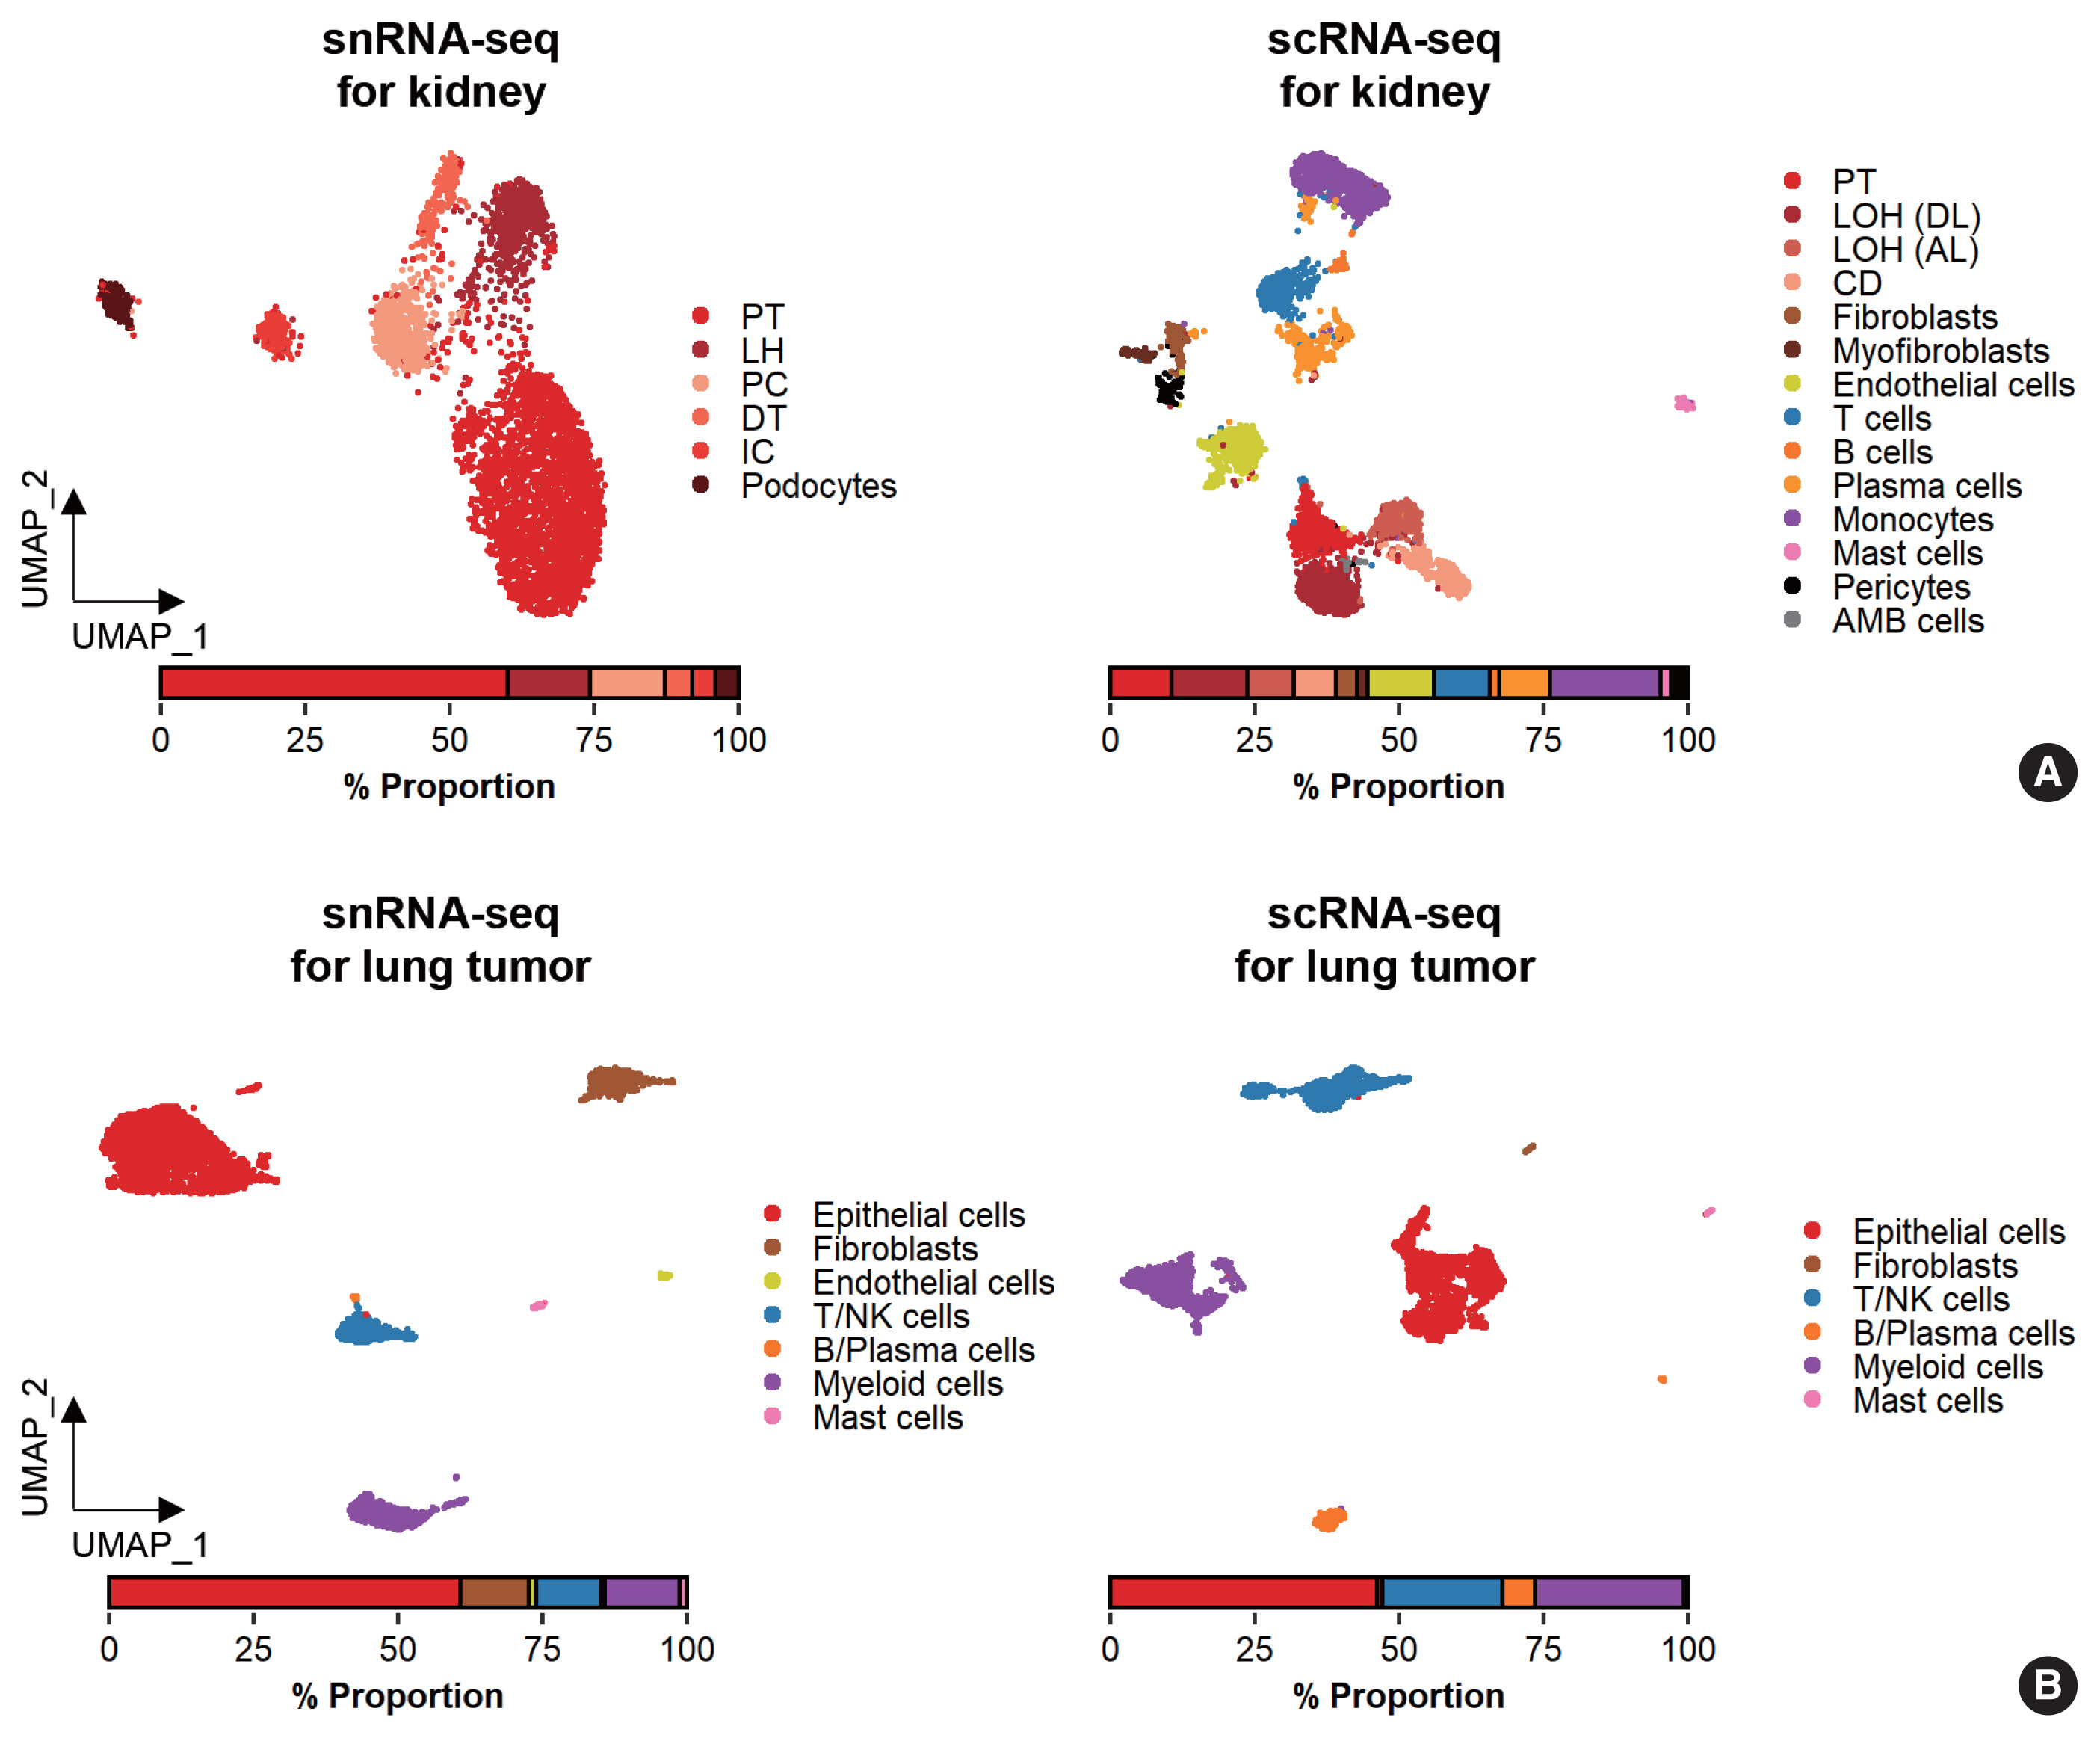
- While data integration allows the combined clustering analysis of scRNA-seq and snRNA-seq data, direct comparisons of the two are difficult because of the differences in cellular and nuclear gene expression patterns. In addition, over-representation of immune cells by scRNA-seq and the superior representation of epithelial cell types by snRNA-seq suggest that complementary analysis is more appropriate than integrated analysis (Fig. 3).
SINGLE-NUCLEUS RNA SEQUENCING DATA PROCESSING AND ANALYSIS
- Neurons in the brain
- A high-throughput snRNA-seq protocol has been described for transcriptomic analysis of individual neurons from archived postmortem human brain tissues [25]. Before the introduction of high-throughput applications, low-throughput methods, such as intracellular tagging by transcription in vivo analysis [26] and extraction of the cytoplasmic contents using a glass microcapillary [27,28] or laser-capture microdissection [29] were explored, along with low-throughput snRNA-seq [22]. Lake and colleagues [4] applied snRNA-seq and identified 16 neuronal subtypes of the cerebral cortex from a postmortem brain.
- Currently, snRNA-seq is extensively used to determine brain cell type complexity. The U.S. government’s Brain Research Through Advancing Innovative Neurotechnologies (BRAIN) Initiative [30] launched a project known as the BRAIN Initiative Cell Census Consortium to pursue a comprehensive human brain cell atlas [31]. These resources will serve as a reference for delineating brain functions and alterations in neurodegenerative and neurological diseases. To construct the brain cell atlas, electrophysiological, morphological, and transcriptional features were used for neuronal cell type specifications, signifying the importance of transcriptome-based cell type annotation in functional and anatomical contexts. Transcriptome-based neuronal identification was accomplished using both scRNA-seq and snRNA-seq [31] after regional dissection. Due to the under-representation of neuronal cell types in scRNA-seq data and the availability of frozen postmortem brains, more recent cell applications have concentrated on snRNA-seq.
- Nonetheless, differences in the nuclear and cytoplasmic gene expression patterns, and limitations of snRNA-seq in the capture and characterization of non-neuronal cell types [32] necessitate the complementary use of scRNA-seq and snRNA-seq for cell type identification in the brain.
- Epithelial cells in the kidney
- Whereas the studies agree that average nephron number is approximately 900,000 to 1 million per kidney, numbers for individual kidneys range from approximately 200,000 to > 2.5 million [33]. Each nephron contains a glomerulus, which is a bundle of vessels through which waste materials are filtered from the blood. The glomerulus is enclosed in Bowman’s capsule, and filtered water, ions, and small molecules are collected in Bowman’s space. Podocytes in the epithelial lining of the Bowman’s capsule wrap around the capillaries of the glomerulus and leave filtration slits between them. Filtered materials leave Bowman’s space through a proximal tubule where reabsorption occurs. Epithelial cells lining the proximal tubule are covered with dense microvilli to facilitate transport. The modular characteristics of the kidney make biopsy an accessible and efficient sampling method for the characterization of the glomerulus.
- Glomerular cell types in the kidney have been characterized using both scRNA-seq and snRNA-seq protocols. For the mouse kidney, an snRNA-seq experimental protocol yielded 20-fold more podocytes than an scRNA-seq protocol [9,34]. The Kidney Precision Medicine Project developed a reference tissue atlas for the human kidney with single-cell resolution and spatial context [35]. Rare epithelial cell types and states can be captured by snRNA-seq; however, immune components in the kidney are not well captured by snRNA-seq (Fig. 3A) [36]. Thus, the kidney atlas data incorporate snRNA-seq and scRNA-seq data for tissue atlas generation [37].
- Tumors from frozen tissues
- A diverse range of solid tumor tissues have been subjected to scRNA-seq, and the biological features of tumor cells and their surrounding microenvironments have been extensively studied. However, scRNA-seq data shows a heavy bias towards immune cell types when compared with bulk tissue data after cell type deconvolution (Fig. 3B). The use of snRNA-seq data may resolve this problem [12]. Side-by-side comparisons of scRNA-seq and snRNA-seq analyses of hepatocellular carcinoma [38] demonstrated the predominant capture of hepatocytes and carcinoma cells in snRNA-seq data compared with the immune cell-dominant landscape in scRNA-seq data. In a pancreatic cancer study, a combination of snRNA-seq and digital spatial profiling revealed that gene expression programs in malignant tumor cells and fibroblasts were enriched after chemotherapy and radiotherapy [39]. In addition to tumor-centric data analysis, snRNA-seq can be performed on longitudinal samples stored as frozen tissues. Similar to brain and kidney examples, immune cells in the tumor microenvironment can be efficiently captured by scRNA-seq.
SPECIFIC TISSUE OR CELL TYPE APPLICATIONS
- Transcriptome-based cell type profiling by scRNA-seq has remarkably enhanced our understanding of cellular diversity. While scRNA-seq shows good performance at capturing immune cell diversity, the cellular landscape depicted is biased against for attached cell types and is missing fragile cells. In most tissues, snRNA-seq can be used to obtain more information about these cell types, including epithelial cells, fibroblasts, neurons, and adipocytes. In addition, snRNA-seq can be used for frozen tissues, such as postmortem brain and archived tumor samples. After the successful isolation of nuclei, experimental and analysis pipelines used for scRNA-seq can be adopted for snRNA-seq. In the analysis, data from the two methods should be combined with caution, considering the differences in cellular and nuclear RNA gene expression patterns.
CONCLUSION
-
Ethics Statement
Not applicable.
-
Availability of Data and Material
The datasets analyzed during the current study are available in the Gene Expression Omnibus repository at GSE137444 [https://www.ncbi.nlm.nih.gov/geo/query/acc.cgi?acc=GSE137444], GSE114156 [https://www.ncbi.nlm.nih.gov/geo/query/acc.cgi?acc=GSE114156], and GSE109564 [https://www.ncbi.nlm.nih.gov/geo/query/acc.cgi?acc=GSE109564].
-
Code Availability
Not applicable.
-
Author Contributions
Conceptualization: SAY, HOL. Data curation: NK. Funding acquisition: HOL. Investigation: NK, HK, AJ. Supervision: SAY, HOL. Visualization: NK, HK, AJ. Writing—original draft: NK, HK, SAY, HOL, AJ. Writing—review & editing: NK, HK, SAY, HOL, AJ. Approval of final manuscript: all authors.
-
Conflicts of Interest
The authors declare that they have no potential conflicts of interest.
-
Funding Statement
This study was supported by the Bio & Medical Technology Development Program of the National Research Foundation, funded by the Ministry of Science and ICT (NRF-2019M3A9B6064691).
Notes


| Tissue type | PMID | Nuclei extraction buffer components and additional nuclei clean up stepsa |
|---|---|---|
| Frozen human brain | 26890679 | 250 mM Sucrose/0.1% Tritonx-100/optional iodixanol gradient/FACS |
| Frozen human brain | 27339989 | 1% NP40 or nuclear extraction buffer (320 mM sucrose, 0.1% Triton X-100)/iodixanol gradient |
| Frozen human/mouse brain | 28846088 | EZ lysis buffer |
| Mouse brain | 29220646 | 250 mM Sucrose/0.1% Tritonx-100/sucrose gradient |
| Frozen human/mouse brain | 31932797 | 0.025% NP-40/sucrose gradient |
| Mouse | 32507042 | 10 × Genomics reagent and protocol |
| Human brain | 32997994 | 320 mM Sucrose/0.1% Igepal (0.1%)/iodixanol gradient |
| Frozen human/mouse brain | 33495627 | 1% Formaldehyde fixation/100 mM sucrose/0.5% Triton-X-100/sucrose gradient |
| Frozen human brain | 33972803 | 0.05% NP-40/iodixanol gradient |
| Human kidney | 31249312 | 320 mM Sucrose/0.1% Triton X-100 |
| Human kidney | 31506348 | EZ lysis buffer |
| Mouse kidney | 30510133 | EZ lysis buffer |
| Mouse kidney | 32571916 | EZ lysis buffer |
| Mouse kidney | 32673289 | EZ lysis buffer |
| Mouse kidney | 33239393 | EZ lysis buffer |
| Mouse kidney | 33444290 | EZ lysis buffer |
| Mouse kidney | 34155061 | EZ lysis buffer |
| Mouse heart | 30939177 | 320 mM Sucrose/0.2% Triton-X-100 |
| Brown adipose tissue | 33116305 | 0.1% CHAPS (human) or EZ lysis buffer (mouse) |
| Human panscreas | 33212097 | 250 mM Sucrose |
| Mouse skeletal muscle | 33311464 | 250 mM Sucrose/0.4% Triton-X100/FACS |
| Mouse skeletal muscle | 34382019 | 0.1% NP-40/FACS |
| Human liver | 34792289 | CST/NST/TST |
| Human liver | 35581624 | 0.1% IGEPAL |
| Human tumor | 32405060 | EZ lysis buffer or ST (salts and tris) with 0.49% CHAPS (CST), with 0.03% Tween20 (TST) or with 0.2% NP-40 (NST) |
- 1. Kolodziejczyk AA, Kim JK, Svensson V, Marioni JC, Teichmann SA. The technology and biology of single-cell RNA sequencing. Mol Cell 2015; 58: 610–20. ArticlePubMed
- 2. Zeisel A, Munoz-Manchado AB, Codeluppi S, et al. Brain structure. Cell types in the mouse cortex and hippocampus revealed by single-cell RNA-seq. Science 2015; 347: 1138–42. ArticlePubMed
- 3. Habib N, Avraham-Davidi I, Basu A, et al. Massively parallel single-nucleus RNA-seq with DroNc-seq. Nat Methods 2017; 14: 955–8. ArticlePubMedPMCPDF
- 4. Lake BB, Ai R, Kaeser GE, et al. Neuronal subtypes and diversity revealed by single-nucleus RNA sequencing of the human brain. Science 2016; 352: 1586–90. ArticlePubMedPMC
- 5. Andrews TS, Atif J, Liu JC, et al. Single-cell, single-nucleus, and spatial RNA sequencing of the human liver identifies cholangiocyte and mesenchymal heterogeneity. Hepatol Commun 2022; 6: 821–40. ArticlePubMedPMCPDF
- 6. Petrany MJ, Swoboda CO, Sun C, et al. Single-nucleus RNA-seq identifies transcriptional heterogeneity in multinucleated skeletal myofibers. Nat Commun 2020; 11: 6374.ArticlePubMedPMCPDF
- 7. Sun W, Dong H, Balaz M, et al. snRNA-seq reveals a subpopulation of adipocytes that regulates thermogenesis. Nature 2020; 587: 98–102. ArticlePubMedPDF
- 8. Tucker NR, Chaffin M, Fleming SJ, et al. Transcriptional and cellular diversity of the human heart. Circulation 2020; 142: 466–82. ArticlePubMedPMC
- 9. Wu H, Kirita Y, Donnelly EL, Humphreys BD. Advantages of single-nucleus over single-cell RNA sequencing of adult kidney: rare cell types and novel cell states revealed in fibrosis. J Am Soc Nephrol 2019; 30: 23–32. ArticlePubMedPMC
- 10. Denisenko E, Guo BB, Jones M, et al. Systematic assessment of tissue dissociation and storage biases in single-cell and single-nucleus RNA-seq workflows. Genome Biol 2020; 21: 130.ArticlePubMedPMCPDF
- 11. Yamawaki TM, Lu DR, Ellwanger DC, et al. Systematic comparison of high-throughput single-cell RNA-seq methods for immune cell profiling. BMC Genomics 2021; 22: 66.ArticlePubMedPMCPDF
- 12. Slyper M, Porter CB, Ashenberg O, et al. A single-cell and single-nucleus RNA-Seq toolbox for fresh and frozen human tumors. Nat Med 2020; 26: 792–802. ArticlePubMedPMCPDF
- 13. Bakken TE, Hodge RD, Miller JA, et al. Single-nucleus and single-cell transcriptomes compared in matched cortical cell types. PLoS One 2018; 13: e0209648.ArticlePubMedPMC
- 14. Eraslan G, Drokhlyansky E, Anand S, et al. Single-nucleus cross-tissue molecular reference maps toward understanding disease gene function. Science 2022; 376: eabl4290.ArticlePubMedPMC
- 15. Zhou Y, Song WM, Andhey PS, et al. Human and mouse single-nucleus transcriptomics reveal TREM2-dependent and TREM2-independent cellular responses in Alzheimer’s disease. Nat Med 2020; 26: 131–42. ArticlePubMedPMCPDF
- 16. La Manno G, Soldatov R, Zeisel A, et al. RNA velocity of single cells. Nature 2018; 560: 494–8. ArticlePubMedPMCPDF
- 17. Hay SB, Ferchen K, Chetal K, Grimes HL, Salomonis N. The Human Cell Atlas bone marrow single-cell interactive web portal. Exp Hematol 2018; 68: 51–61. ArticlePubMedPMC
- 18. Ullrich S, Guigo R. Dynamic changes in intron retention are tightly associated with regulation of splicing factors and proliferative activity during B-cell development. Nucleic Acids Res 2020; 48: 1327–40. ArticlePubMedPMCPDF
- 19. Wong JJ, Ritchie W, Ebner OA, et al. Orchestrated intron retention regulates normal granulocyte differentiation. Cell 2013; 154: 583–95. ArticlePubMed
- 20. Xie X, Shi Q, Wu P, et al. Single-cell transcriptome profiling reveals neutrophil heterogeneity in homeostasis and infection. Nat Immunol 2020; 21: 1119–33. ArticlePubMedPMCPDF
- 21. Barthelson RA, Lambert GM, Vanier C, Lynch RM, Galbraith DW. Comparison of the contributions of the nuclear and cytoplasmic compartments to global gene expression in human cells. BMC Genomics 2007; 8: 340.ArticlePubMedPMC
- 22. Grindberg RV, Yee-Greenbaum JL, McConnell MJ, et al. RNA-sequencing from single nuclei. Proc Natl Acad Sci U S A 2013; 110: 19802–7. ArticlePubMedPMC
- 23. Lake BB, Codeluppi S, Yung YC, et al. A comparative strategy for single-nucleus and single-cell transcriptomes confirms accuracy in predicted cell-type expression from nuclear RNA. Sci Rep 2017; 7: 6031.ArticlePubMedPMCPDF
- 24. Gupta A, Shamsi F, Altemose N, et al. Characterization of transcript enrichment and detection bias in single-nucleus RNA-seq for mapping of distinct human adipocyte lineages. Genome Res 2022; 32: 242–57. ArticlePubMedPMC
- 25. Krishnaswami SR, Grindberg RV, Novotny M, et al. Using single nuclei for RNA-seq to capture the transcriptome of postmortem neurons. Nat Protoc 2016; 11: 499–524. ArticlePubMedPMCPDF
- 26. Lovatt D, Ruble BK, Lee J, et al. Transcriptome in vivo analysis (TIVA) of spatially defined single cells in live tissue. Nat Methods 2014; 11: 190–6. ArticlePubMedPMCPDF
- 27. Citri A, Pang ZP, Sudhof TC, Wernig M, Malenka RC. Comprehensive qPCR profiling of gene expression in single neuronal cells. Nat Protoc 2011; 7: 118–27. ArticlePubMedPMCPDF
- 28. Qiu S, Luo S, Evgrafov O, et al. Single-neuron RNA-Seq: technical feasibility and reproducibility. Front Genet 2012; 3: 124.ArticlePubMedPMC
- 29. Lovatt D, Bell T, Eberwine J. Single-neuron isolation for RNA analysis using pipette capture and laser capture microdissection. Cold Spring Harb Protoc 2015; 2015: pdb prot072439.ArticlePubMed
- 30. Ngai J. BRAIN 2.0: Transforming neuroscience. Cell 2022; 185: 4–8. ArticlePubMed
- 31. Ecker JR, Geschwind DH, Kriegstein AR, et al. The BRAIN Initiative Cell Census Consortium: lessons learned toward generating a comprehensive brain cell atlas. Neuron 2017; 96: 542–57. ArticlePubMedPMC
- 32. Thrupp N, Sala Frigerio C, Wolfs L, et al. Single-nucleus RNA-seq is not suitable for detection of microglial activation genes in humans. Cell Rep 2020; 32: 108189.ArticlePubMedPMC
- 33. Bertram JF, Douglas-Denton RN, Diouf B, Hughson MD, Hoy WE. Human nephron number: implications for health and disease. Pediatr Nephrol 2011; 26: 1529–33. ArticlePubMedPDF
- 34. Park J, Shrestha R, Qiu C, et al. Single-cell transcriptomics of the mouse kidney reveals potential cellular targets of kidney disease. Science 2018; 360: 758–63. ArticlePubMedPMC
- 35. Hansen J, Sealfon R, Menon R, et al. A reference tissue atlas for the human kidney. Sci Adv 2022; 8: eabn4965.ArticlePubMedPMC
- 36. Wu H, Malone AF, Donnelly EL, et al. Single-cell transcriptomics of a human kidney allograft biopsy specimen defines a diverse inflammatory response. J Am Soc Nephrol 2018; 29: 2069–80. ArticlePubMedPMC
- 37. O’Sullivan ED, Mylonas KJ, Hughes J, Ferenbach DA. Complementary roles for single-nucleus and single-cell RNA sequencing in kidney disease research. J Am Soc Nephrol 2019; 30: 712–3. ArticlePubMedPMC
- 38. Wen F, Tang X, Xu L, Qu H. Comparison of single-nucleus and single-cell transcriptomes in hepatocellular carcinoma tissue. Mol Med Rep 2022; 26: 339.ArticlePubMedPMC
- 39. Hwang WL, Jagadeesh KA, Guo JA, et al. Single-nucleus and spatial transcriptome profiling of pancreatic cancer identifies multicellular dynamics associated with neoadjuvant treatment. Nat Genet 2022; 54: 1178–91. ArticlePubMedPMCPDF
References
Figure & Data
References
Citations
- Mapping the cellular landscape of Atlantic salmon head kidney by single cell and single nucleus transcriptomics
Adriana M.S. Andresen, Richard S. Taylor, Unni Grimholt, Rose Ruiz Daniels, Jianxuan Sun, Ross Dobie, Neil C. Henderson, Samuel A.M. Martin, Daniel J. Macqueen, Johanna H. Fosse
Fish & Shellfish Immunology.2024; 146: 109357. CrossRef - Impaired cortical neuronal homeostasis and cognition after diffuse traumatic brain injury are dependent on microglia and type I interferon responses
Jonathan M. Packer, Chelsea E. Bray, Nicolas B. Beckman, Lynde M. Wangler, Amara C. Davis, Ethan J. Goodman, Nathaniel E. Klingele, Jonathan P. Godbout
Glia.2024; 72(2): 300. CrossRef - Adipose tissue macrophage heterogeneity in the single-cell genomics era
Haneul Kang, Jongsoon Lee
Molecules and Cells.2024; 47(2): 100031. CrossRef - Single-cell and spatially resolved transcriptomics for liver biology
Ping Lin, Xi Yan, Siyu Jing, Yanhong Wu, Yiran Shan, Wenbo Guo, Jin Gu, Yu Li, Haibing Zhang, Hong Li
Hepatology.2023;[Epub] CrossRef - Integrated analysis of single-cell and bulk RNA-seq establishes a novel signature for prediction in gastric cancer
Fei Wen, Xin Guan, Hai-Xia Qu, Xiang-Jun Jiang
World Journal of Gastrointestinal Oncology.2023; 15(7): 1215. CrossRef - Placental single cell transcriptomics: Opportunities for endocrine disrupting chemical toxicology
Elana R. Elkin, Kyle A. Campbell, Samantha Lapehn, Sean M. Harris, Vasantha Padmanabhan, Kelly M. Bakulski, Alison G. Paquette
Molecular and Cellular Endocrinology.2023; 578: 112066. CrossRef - Analyzing alternative splicing in Alzheimer’s disease postmortem brain: a cell-level perspective
Mohammad-Erfan Farhadieh, Kamran Ghaedi
Frontiers in Molecular Neuroscience.2023;[Epub] CrossRef - Single-nucleus transcriptome inventory of giant panda reveals cellular basis for fitness optimization under low metabolism
Shangchen Yang, Tianming Lan, Rongping Wei, Ling Zhang, Lin Lin, Hanyu Du, Yunting Huang, Guiquan Zhang, Shan Huang, Minhui Shi, Chengdong Wang, Qing Wang, Rengui Li, Lei Han, Dan Tang, Haimeng Li, Hemin Zhang, Jie Cui, Haorong Lu, Jinrong Huang, Yonglun
BMC Biology.2023;[Epub] CrossRef - Single-cell transcriptomics in thyroid eye disease
Sofia Ahsanuddin, Albert Y. Wu
Taiwan Journal of Ophthalmology.2023;[Epub] CrossRef
 PubReader
 ePub Link
-
 Cite this Article
- Cite this Article
-
- Close
- Download Citation
- Close
- Figure
-