E-submission
Articles
- Page Path
- HOME > J Pathol Transl Med > Volume 47(3); 2013 > Article
-
Original Article
Naked Cuticle Drosophila 1 Expression in Histologic Subtypes of Small Adenocarcinoma of the Lung - Sangjeong Ahn, Won Hwangbo, Hyunchul Kim, Chul Hwan Kim
-
Korean Journal of Pathology 2013;47(3):211-218.
DOI: https://doi.org/10.4132/KoreanJPathol.2013.47.3.211
Published online: June 25, 2013
Department of Pathology, Korea University Anam Hospital, Korea University College of Medicine, Seoul, Korea.
- Corresponding Author: Chul Hwan Kim, M.D. Department of Pathology, Korea University Anam Hospital, Korea University College of Medicine, 73 Inchon-ro, Seongbuk-gu, Seoul 136-705, Korea. Tel: +82-2-920-5991, Fax: +82-2-920-6576, 'chkap@korea.ac.kr'
© 2013 The Korean Society of Pathologists/The Korean Society for Cytopathology
This is an Open Access article distributed under the terms of the Creative Commons Attribution Non-Commercial License (http://creativecommons.org/licenses/by-nc/3.0/) which permits unrestricted non-commercial use, distribution, and reproduction in any medium, provided the original work is properly cited.
Abstract
-
Background
- Naked cuticle Drosophila 1 (NKD1) has been related to non-small cell lung cancer in that decreased NKD1 levels have been associated with both poor prognosis and increased invasive quality.
-
Methods
- Forty cases of lung adenocarcinoma staged as Tis or T1a were selected. Cases were subclassified into adenocarcinoma in situ (AIS), minimally invasive adenocarcinoma (MIA), and small adenocarcinoma (SAD). Immunohistochemical studies for NKD1 were performed.
-
Results
- Forty samples comprised five cases of AIS (12.5%), eight of MIA (20.0%), and 27 of SAD (67.5%). AIS and MIA showed no lymph node metastasis and 100% disease-free survival, whereas among 27 patients with SAD, 2 (7.4%) had lymph node metastasis, and 3 (11.1%) died from the disease. Among the 40 cases, NKD1-reduced expression was detected in 8 (20%) samples, whereas normal expression was found in 15 (37.5%) and overexpression in 17 (42.5%). Loss of NKD1 expression was significantly associated with lymph node metastasis (p=0.001). All cases with predominant papillary pattern showed overexpression of NKD1 (p=0.026).
-
Conclusions
- Among MIA and SAD, MIA had better outcomes than SAD. Down-regulated NKD1 expression was closely associated with nodal metastasis, and overexpression was associated with papillary predominant adenocarcinoma.
- Patient characteristics
- This study included 40 cases of lung adenocarcinoma treated with surgery alone or surgery and postoperative adjuvant therapy at our institute between 2000 and 2011. Selected patients had AIS, MIA, or small adenocarcinoma (SAD) and no other malignant tumors within five years of their diagnosis of lung adenocarcinoma. Patients were defined as ever-smokers if they had smoked >20 packs of cigarettes or 12 oz of tobacco in their lifetime, or smoked >1 cigarette/day or >1 cigar/wk for 1 year.9 The clinical records reviewed included data on age, gender, smoking history, tumor size, pathologic stage, operative mode, and mortality outcomes.
- Histologic analysis
- The tumor sections were examined, with special attention to the following details: classification of the pulmonary adenocarcinoma according to the new IASLC/ATS/ERS classification system, presence or absence of lepidic growth, extent of invasion, predominant invasive pattern including acinar, papillary, solid, or micropapillary growth, presence or absence of solid or micropapillary growth using a 5%-cutoff, presence or absence of lymph node metastasis, lymphatic invasion, and tumor necrosis.
- In accordance with the updated IASLC/ATS/ERS classification system, AIS cases were selected according to the following criteria: localized SAD (≤2 cm) with growth of neoplastic cells along pre-existing alveolar structures; lack of stromal, vascular, or pleural invasion; absence of papillary or micropapillary patterns; and absence of intra-alveolar tumor cells.
- Tumors were subclassified as MIA in cases with a small solitary adenocarcinoma (≤2 cm) with a predominantly lepidic pattern and ≤5 mm invasion in the greatest dimension of any one focus. The invasive component to be measured in MIA was defined as follows: histological subtypes other than a lepidic pattern (i.e., acinar, papillary, micropapillary, or solid) or tumor cells infiltrating myofibroblastic stroma. The invasive component was measured morphometrically and a 5-mm cutoff was used to distinguish MIA from lepidic predominant adenocarcinoma (LPA). For cases that contained multiple tumor foci, only the largest tumor focus was studied. Elastic stains were also performed if necessary. MIA was excluded if the tumor invaded the lymphatics, blood vessels, pleura, or contained tumor necrosis.
- LPA and non-lepidic adenocarcinoma with >5 mm and ≤2 cm invasion in diameter were classified as SAD and were divided further into acinar, papillary, and micropapillary based on their predominant invasive pattern.
- Immunohistochemistry
- Forty cases of lung AIS and adenocarcinoma measuring ≤2 cm in its widest dimension were analyzed for NKD1 expression after selecting one representative section of tumor from each case. For immunohistochemistry, 4 µm-thick sections were deparaffinized using immunoautostainer (Leica BOND-MAX, Leica, Newcastle upon Tyne, UK) hydrated through graded alcohols to water, and washed in distilled water. Antigen retrieval was performed by immersing slides in citrate buffer (pH 6.0), heating for 20 minutes, and cooling for 10 minutes. After washing in distilled water, endogenous peroxidase activity was blocked with 0.5% hydrogen peroxide in methanol. Slides were then washed in distilled water, placed in Tris-buffered saline, incubated for 30 minutes with monoclonal antibody to NKD1 (Epitomics, Burlingame, CA, USA) at a 1:400 dilution, and then washed in buffer. Antigen sensitivity was enhanced by commercial post primary solution for 5 minutes. Slides were washed, incubated with polymers (Bond Polymer Refine kit, Leica) for 30 minutes, washed in buffer again, and counterstained with hematoxylin.
- Evaluation of NKD1 staining
- The expression of NKD1 was classified into five groups according to percentage of positively stained cells: 0, negative; 1, 1-25%; 2, 26-50%; 3, 51-75%; 4, ≥76%. The staining intensity was evaluated as follows: 0, negative; 1, weak; 2, moderate; and 3, strong. Cases with faintly stained cytoplasms were categorized as "weak," whereas deeply stained were considered to be "strong," and intermediate ones "moderate." The proportion and intensity scores were then multiplied to obtain a total score.
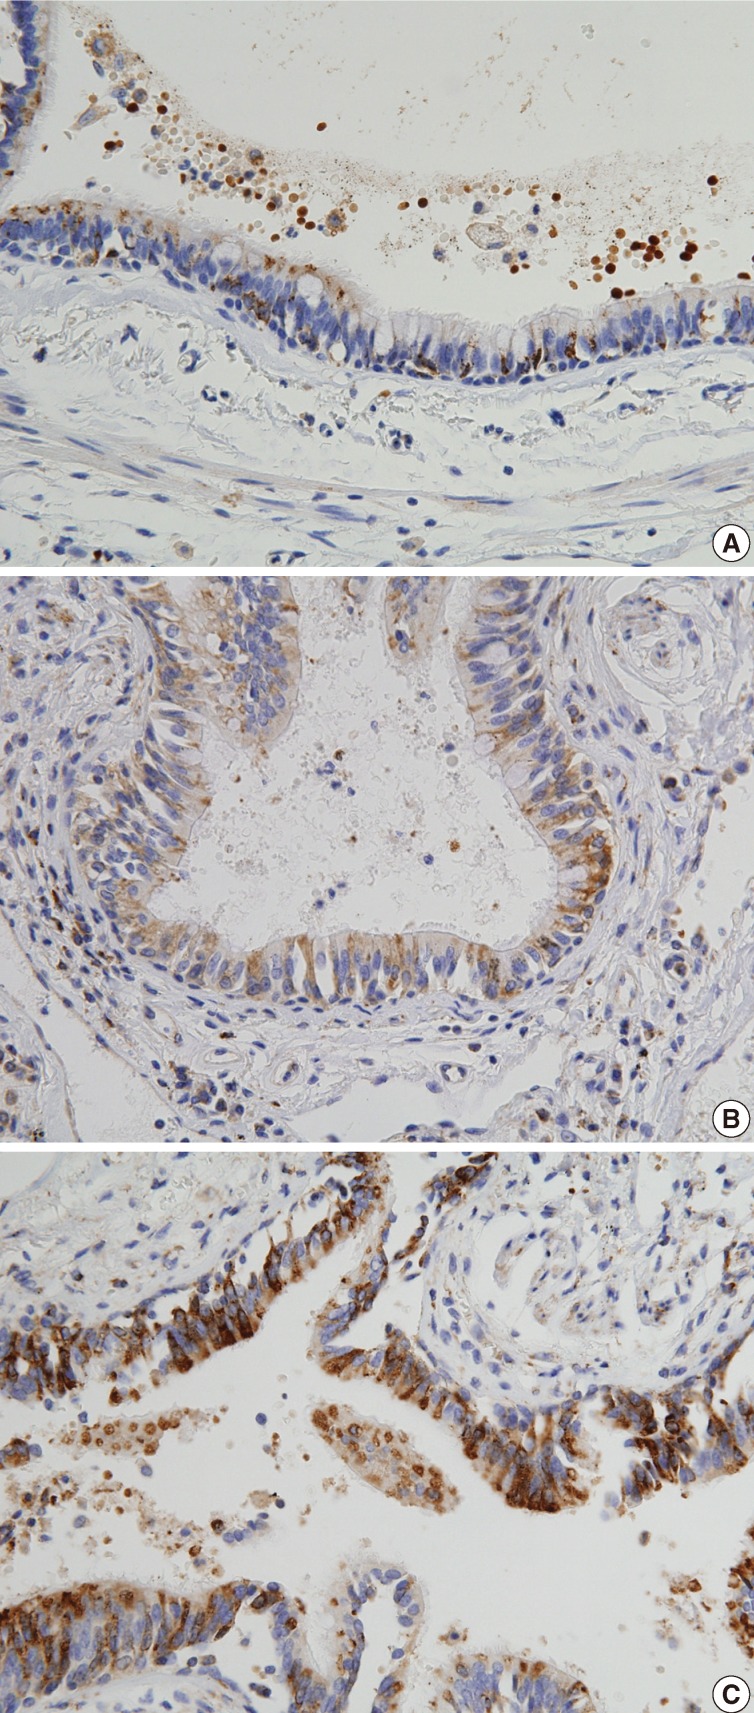
- The expression of NKD1 in normal lung parenchyma was evaluated after randomly selecting ten cases with normal lung tissue with at least 2 cm distance from the tumor. In a normal lung, alveolar pneumocytes were weakly stained in the cytoplasm, whereas bronchial epithelium were weakly to moderately stained in the cytoplasm, especially in the apical portions. Scores from normal lung tissue ranged from 3 to 6 (mean, 4.3) as indicated in Fig. 1. There were two cases with a score of 3, four cases with a score 4, five cases with a score 5, and one case with a score 6. On the basis of these results, a score of 3 or less was considered to be "reduced expression," 4 or 5 were "normal expression," and scores of 6 or more were regarded as "overexpression."
- Statistical analysis
- Relationships between clinicopathologic parameters and NKD1 expression were evaluated using Fisher exact tests. The overall survival rate was evaluated using the Kaplan-Meier method, and statistical differences in survival times were determined using log-rank testing. A p-value of <0.05 was considered statistically significant. All analyses were performed using SPSS ver. 18.0 (SPSS Inc., Chicago, IL, USA).
MATERIALS AND METHODS
- Clinicopathologic characteristics associated with NKD1 expression
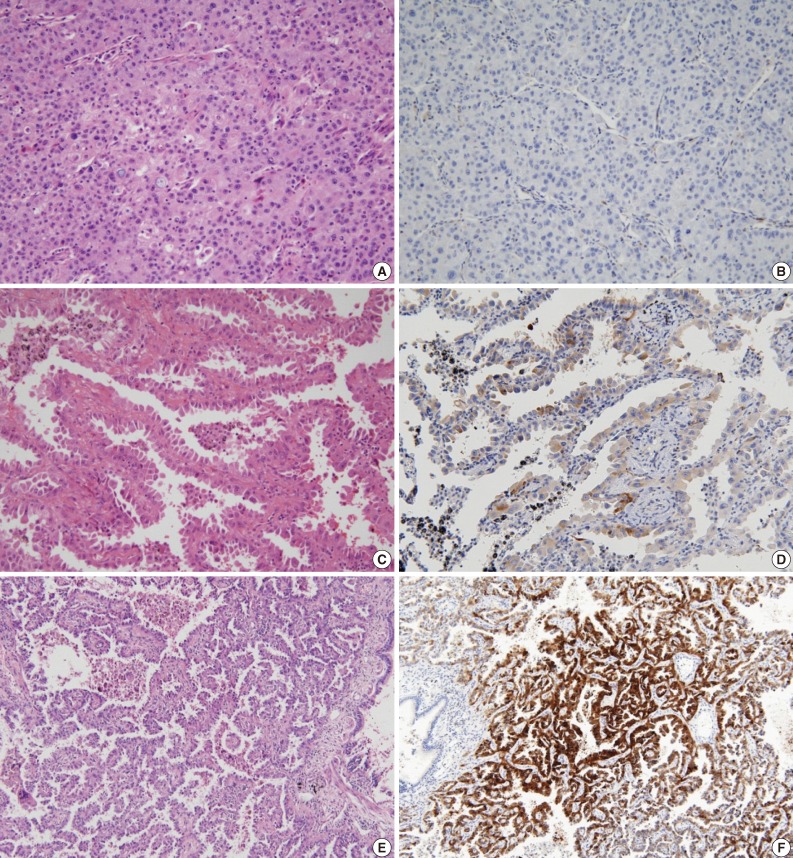
- Our patient population was composed of 17 men and 23 women aged 35-79 years (mean, 56.9 years). Smoking history was available in all 40 patients, with 11 (27.5%) classified as ever-smokers and 29 (72.5%) as never-smokers. The subtypes of lung tumor were as follows: 5 (12.5%) AIS, 8 (20.0%) MIA, and 27 (67.5%) SAD. The clinicopathologic characteristics of each subtype are summarized in Table 1. These various clinicopathologic features were compared according to NKD1 expression (Tables 2, 3). Among the 40 samples, NKD1-reduced expression was detected in 8 (20%) cases (Fig. 2A, B), normal expression in 15 (37.5%) cases (Fig. 2C, D), and overexpression in 17 (42.5%) cases (Fig. 2E, F). Loss of NKD1 expression was significantly associated with lymph node metastases (p=0.003). Overexpression of NKD1 was closely related to the predominant papillary pattern, showing increased expression in all cases of lung adenocarcinoma with papillary pattern (p=0.026).
- Among five samples of AIS staged as Tis, four cases showed normal expression (80%) and one case showed overexpression (20%) with no statistically significant differences (p=0.189). NKD1-reduced expression was observed in 2 out of 8 MIA cases (25%) and in 6 out of 27 SAD cases (22.2%), while no cases of AIS had NKD1-reduced expression (p=0.189).
- The rate of normal or increased NKD1 expression in adenocarcinoma with lepidic predominant growth (11/13, 84.7%) was higher than that without lepidic predominant growth (21/27, 77.8%), but this was not a statistically significant difference (p=0.349). The rate of reduced NKD1 expression in adenocarcinoma with solid predominant growth (1/4, 25%) was higher than that without solid predominant growth (7/36, 19.4%), with no statistical significance (p=0.821).
- Survival analysis
- Follow-up data were available for 40 patients and the mean follow-up period was 33.7 months ranging from 1 to 156 months. Thirty-six patients were alive and free of disease at the mean follow-up period of 35.6 months. Four patients died after a mean follow-up period of 16.3 months. One patient died 14 days after surgery and was excluded from the analysis.
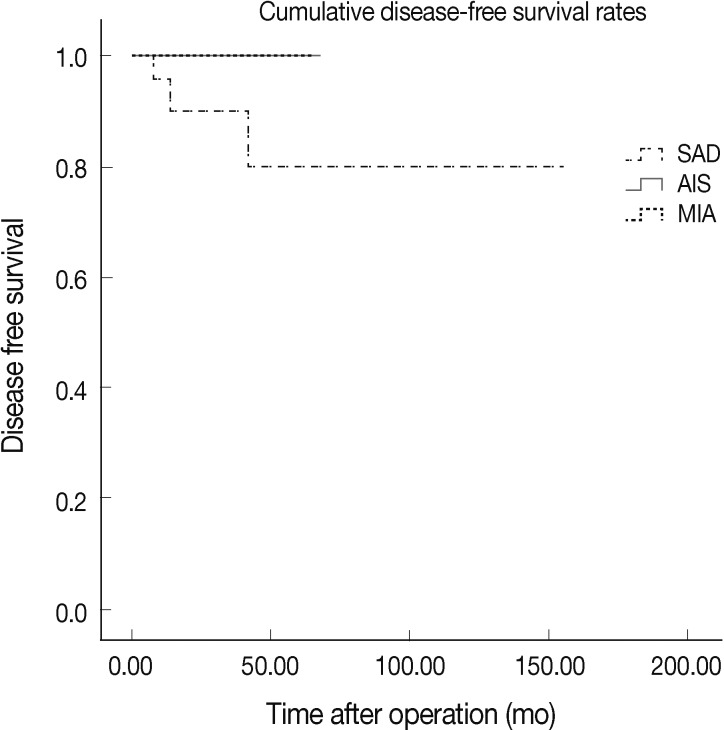
- According to our univariate analysis, factors that statistically influenced survival included presence of lymph node metastasis (p=0.001) and presence of micropapillary pattern (p=0.001) as indicated in Table 4. Regarding histologic subtypes, all patients with AIS and MIA were alive and free of disease, while 3 out of 27 SAD patients had poor prognosis and died from their disease (AIS vs SAD, p=0.453; MIA vs SAD, p=0.296) (Fig. 3). Expected survival time decreased as expression of NKD1 became overexpressed, which was the opposite effect to what had been expected, however there was no statistical significance (reduced vs normal, p=0.763; reduced vs overexpressed, p=0.599; normal vs overexpressed, p=0.550).
RESULTS
- Noguchi et al.10 analyzed the histology of small lung adenocarcinoma and classified it according to the presence or absence of BAC components and other histologic characteristics. This seminal study brought to attention the importance of BAC and its association with excellent prognosis, including 100% 5-year survival. Subsequent studies11-16 elucidated various histologic features of prognostic significance in lung adenocarcinomas with BAC components, including size of scar, percentage of lepidic growth, percentage of papillary growth, vascular invasion, and size or pattern of invasion. Based on these studies, new concepts were introduced, such as including the subgroups of AIS and MIA, according to the new IASLC/ATS/ERS classification system.
- In accordance with earlier studies, our results suggested better tumor behavior in MIA (≤5 mm) compared to SAD, which supports distinguishing these classes of tumors from stage T1a cancers. In this study, MIA outcomes were excellent with no lymph node involvement and 100% disease survival. In contrast, among 27 patients with SAD, 2 (7.4%) had lymph node metastasis, and 3 (11.1%) died of disease. The overall survival curve (Fig. 3) also identified a relationship among AIS, MIA, and SAD that was not statistically significant.
- There are several limitations to this study including its small sample size and short follow-up period, which likely contributed to our statistically insignificant results. As seen in Fig. 3, patients of AIS and MIA had shorter follow-up than those with SAD. This limited data likely reflects a recent increase in the early detection of small lung adenocarcinoma, owing to advances in imaging technique. We reviewed all surgically resected lung adenocarcinomas less than 2 cm in size since 2000, as well as cases of AIS and MIA were observed in our institute only after 2007. There is still a need for future studies to validate these findings based on standardized pathologic criteria.
- Although there was not a large enough sample size to conduct a powerful statistical analysis of MIA cases, our univariate analysis demonstrated, as expected, that lymph node metastasis and micropapillary patterns were indeed unfavorable prognostic markers (Table 4). The aforementioned variables were mostly observed in cases of SAD, supporting the idea that among T1a lung adenocarcinomas, MIA may be distinguished from SAD with obviously different outcomes.
- Increasing reports of NKD1 have demonstrated up-regulation of NKD1 mRNA levels in lung cancer, as well as colorectal adenomas and hepatoblastomas.8,17,18 Conversely, NKD1 protein expression was down-regulated in some gastric cancers and NSCLC. Zhang et al.8 reported NKD1 protein in NSCLC. In their study, 100 cases of NSCLC, including 33 cases of squamous cell carcinoma, and 76 cases of adenocarcinoma, underwent immunohistochemical staining with NKD1 polyclonal antibody; their results demonstrated reduced NKD1 protein levels with elevated NKD1 mRNA associated with poor differentiation, high pTNM stage, lymph node metastasis, and poor prognosis. The authors hypothesized that a post-translational modification of NKD1 or protein degradation may have been involved in the discordance between reduced NKD1 expression and up-regulated NKD1 mRNA. These findings also suggested that NKD1 depletion could up-regulate Dvl-1 and β-catenin protein, enhancing the invasive ability of lung cancer cells.
- A statistically significant association was found between reduced NKD1 expression and nodal metastasis (p=0.003), which was observed in previous studies, and further implies an unfavorable prognosis in lung adenocarcinoma with reduced NKD1 expression. However, all other variables did not show statistical significance. Expected survival time according to NKD1 expression resulted in an opposite effect than anticipated. This discordant result might have been due to a limited experimental group in this study, which included pTis- and pT1a-staged lung adenocarcinoma. Moreover, a monoclonal NKD1 antibody was applied in this study, whereas polyclonal NKD1 antibodies were used in previous studies.
- NKD1 was expressed differently in the papillary subtype compared to non-papillary subtypes, with several possible implications. Hypotheses include that NKD1 protein in the papillary subtype may be less fragile than in the non-papillary subtype, making it less vulnerable to degradation or post-translational modification compared to the non-papillary subtype. Overexpression of NKD1 in the papillary subtype suggests that NKD1 may have a specific role in the pathogenesis of distinct histologic subtypes of lung adenocarcinoma, and may specifically drive different pathways, which remain unidentified.
- Pulmonary adenocarcinoma is histologically heterogeneous and currently, there have been several reports of different molecular or immunohistochemical expressions of distinct histologic subtypes in lung adenocarcinoma.19,20 To the best of our knowledge, this is the first study to investigate the relationship between NKD1 expression and clinicopathological features, with special attention to the histologic pattern in small lung adenocarcinoma.
- Hereafter, a surgical approach to MIA and SAD may change. Though there were several reports on the therapeutic implications of AIS, MIA, and SAD,21-23 the appropriateness of limited resection remains unclear and should be subject to further clinical trials. Ongoing clinical trials should define selection criteria for limited resection in patients with small lung adenocarcinoma, which will encompass not only histologic parameters but also immunohistochemical and molecular aspects of the cancer.
- In conclusion, this study found that MIA is associated with better outcomes than SAD. However, our study was limited by statistically insignificant results likely due to our small sample size and short-term follow-up. Future studies should validate our results, as well as try to verify a favorable prognosis with MIA and to identify selection criteria for limited surgical resection. Based on previous reports investigating the invasive ability of NKD1 in NSCLC, different expressions of NKD1 protein in small lung adenocarcinoma suggest its potential role in invasion assessment. Though having failed to support those speculations, this study demonstrated that down-regulated NKD1 expression was closely associated with nodal metastasis and altered expression was associated with the papillary subtype, suggesting that NKD1 is indeed a likely unfavorable marker.
DISCUSSION
- 1. Jung KW, Park S, Won YJ, et al. Prediction of cancer incidence and mortality in Korea, 2012. Cancer Res Treat 2012; 44: 25–31. PMID: 22500157. ArticlePubMedPMCPDF
- 2. Travis WD, Brambilla E, Noguchi M, et al. International Association for the Study of Lung Cancer/American Thoracic Society/European Respiratory Society international multidisciplinary classification of lung adenocarcinoma. J Thorac Oncol 2011; 6: 244–285. PMID: 21252716. ArticlePubMedPMC
- 3. Dacic S. Minimally invasive adenocarcinomas of the lung. Adv Anat Pathol 2009; 16: 166–171. PMID: 19395880. ArticlePubMed
- 4. Sunaga N, Kohno T, Kolligs FT, Fearon ER, Saito R, Yokota J. Constitutive activation of the Wnt signaling pathway by CTNNB1 (beta-catenin) mutations in a subset of human lung adenocarcinoma. Genes Chromosomes Cancer 2001; 30: 316–321. PMID: 11170292. ArticlePubMed
- 5. Logan CY, Nusse R. The Wnt signaling pathway in development and disease. Annu Rev Cell Dev Biol 2004; 20: 781–810. PMID: 15473860. ArticlePubMed
- 6. Yan D, Wallingford JB, Sun TQ, et al. Cell autonomous regulation of multiple Dishevelled-dependent pathways by mammalian Nkd. Proc Natl Acad Sci U S A 2001; 98: 3802–3807. PMID: 11274398. ArticlePubMedPMC
- 7. Wallingford JB, Habas R. The developmental biology of Dishevelled: an enigmatic protein governing cell fate and cell polarity. Development 2005; 132: 4421–4436. PMID: 16192308. ArticlePubMed
- 8. Zhang S, Wang Y, Dai SD, Wang EH. Down-regulation of NKD1 increases the invasive potential of non-small-cell lung cancer and correlates with a poor prognosis. BMC Cancer 2011; 11: 186PMID: 21599923. ArticlePubMedPMCPDF
- 9. Ferris BG. Epidemiology Standardization Project (American Thoracic Society). Am Rev Respir Dis 1978; 118(6 Pt 2):1–120. PMID: 742764.
- 10. Noguchi M, Morikawa A, Kawasaki M, et al. Small adenocarcinoma of the lung: histologic characteristics and prognosis. Cancer 1995; 75: 2844–2852. PMID: 7773933. ArticlePubMed
- 11. Suzuki K, Yokose T, Yoshida J, et al. Prognostic significance of the size of central fibrosis in peripheral adenocarcinoma of the lung. Ann Thorac Surg 2000; 69: 893–897. PMID: 10750779. ArticlePubMed
- 12. Maeshima AM, Niki T, Maeshima A, Yamada T, Kondo H, Matsuno Y. Modified scar grade: a prognostic indicator in small peripheral lung adenocarcinoma. Cancer 2002; 95: 2546–2554. PMID: 12467069. ArticlePubMed
- 13. Terasaki H, Niki T, Matsuno Y, et al. Lung adenocarcinoma with mixed bronchioloalveolar and invasive components: clinicopathological features, subclassification by extent of invasive foci, and immunohistochemical characterization. Am J Surg Pathol 2003; 27: 937–951. PMID: 12826886. ArticlePubMed
- 14. Sakurai H, Maeshima A, Watanabe S, et al. Grade of stromal invasion in small adenocarcinoma of the lung: histopathological minimal invasion and prognosis. Am J Surg Pathol 2004; 28: 198–206. PMID: 15043309. ArticlePubMed
- 15. Shimosato Y, Suzuki A, Hashimoto T, et al. Prognostic implications of fibrotic focus (scar) in small peripheral lung cancers. Am J Surg Pathol 1980; 4: 365–373. PMID: 7425202. ArticlePubMed
- 16. Yim J, Zhu LC, Chiriboga L, Watson HN, Goldberg JD, Moreira AL. Histologic features are important prognostic indicators in early stages lung adenocarcinomas. Mod Pathol 2007; 20: 233–241. PMID: 17192789. ArticlePubMed
- 17. Yan D, Wiesmann M, Rohan M, et al. Elevated expression of axin2 and hnkd mRNA provides evidence that Wnt/beta-catenin signaling is activated in human colon tumors. Proc Natl Acad Sci U S A 2001; 98: 14973–14978. PMID: 11752446. ArticlePubMedPMC
- 18. Koch A, Waha A, Hartmann W, et al. Elevated expression of Wnt antagonists is a common event in hepatoblastomas. Clin Cancer Res 2005; 11: 4295–4304. PMID: 15958610. ArticlePubMed
- 19. Solis LM, Behrens C, Raso MG, et al. Histologic patterns and molecular characteristics of lung adenocarcinoma associated with clinical outcome. Cancer 2012; 118: 2889–2899. PMID: 22020674. ArticlePubMed
- 20. Yun J, Son CH, Um SJ, et al. A different TRAP220 expression in distinct histologic subtypes of lung adenocarcinoma and the prognostic significance. Lung Cancer 2011; 71: 312–318. PMID: 20650541. ArticlePubMed
- 21. Arenberg D. American College of Chest Physicians. Bronchioloalveolar lung cancer: ACCP evidence-based clinical practice guidelines (2nd edition). Chest 2007; 132(3 Suppl):306S–313S. PMID: 17873176. ArticlePubMed
- 22. Rusch VW, Tsuchiya R, Tsuboi M, Pass HI, Grunenwald D, Goldstraw P. Surgery for bronchioloalveolar carcinoma and "very early" adenocarcinoma: an evolving standard of care? J Thorac Oncol 2006; 1(9 Suppl):S27–S31. PMID: 17409998. ArticlePubMed
- 23. Asamura H, Suzuki K, Watanabe S, Matsuno Y, Maeshima A, Tsuchiya R. A clinicopathological study of resected subcentimeter lung cancers: a favorable prognosis for ground glass opacity lesions. Ann Thorac Surg 2003; 76: 1016–1022. PMID: 14529977. ArticlePubMed
References


| AIS (n = 5) | MIA (n = 8) | SAD (n = 27) | |
|---|---|---|---|
| Mean age (range, yr) | 55.4 (49-60) | 58.5 (43-76) | 60.9 (30-79) |
| Gender (male/female) | 3/2 | 3/5 | 12/15 |
| Smoking status | |||
| Never-smoker | 3 | 6 | 20 |
| Ever-smoker | 2 | 2 | 7 |
| Gross size (mean) | 0.9 ± 0.2 (0.7) | 1.05 ± 1.05 (0.83) | 1.35 ± 0.65 (1.42) |
| Invasive size (mean) | 0 | 0.3 ± 0.15 (0.4) | 1.35 ± 0.65 (1.37) |
| Predominant invasive pattern | |||
| Acinar, papillary | N/A | 6/2 | 19/4 |
| Micropapillary | N/A | 0 | 0 |
| Solid | N/A | 0 | 4 |
| Nodal metastasis | |||
| Yes | 0 | 0 | 2 |
| No | 2 | 6 | 24 |
| Not available | 3 | 2 | 1 |
| Lymphatic invasion | 0 | 0 | 1 |
| Tumor necrosis | 0 | 0 | 1 |
| Follow-up | |||
| Mean time (mo) | 28.2 | 35.0 | 35.6 |
| Range time (mo) | 11-68 | 13-45 | 1-156 |
| DOD | 0 | 0 | 3a |
| AFD | 5 | 8 | 23 |
AIS, adenocarcinoma in situ; MIA, minimally invasive adenocarcinoma; SAD, small adenocarcinoma with >0.5 cm and ≤2 cm invasion; N/A, not available; DOD, died of disease; AFD, alive free of disease.
a Patients who died of SAD were calculated as 3, after exclusion of one patient who died 14 days after surgery.
Figure & Data
References
Citations
- Challenges of the eighth edition of the American Joint Committee on Cancer staging system for pathologists focusing on early stage lung adenocarcinoma
Yu‐Ting Wang, Il‐Chi Chang, Chih‐Yi Chen, Jiun‐Yi Hsia, Frank Cheau‐Feng Lin, Wan‐Ru Chao, Tuan‐Ying Ke, Ya‐Ting Chen, Chih‐Jung Chen, Min‐Shu Hsieh, Shiu‐Feng Huang
Thoracic Cancer.2023; 14(6): 592. CrossRef - Clinical Significance of NKD Inhibitor of WNT Signaling Pathway 1 (NKD1) in Glioblastoma
Lijun Li, Ruiying Gao, Weizhong Huangfu, Fang Zhang, Ruixia Wang, Hongda Liu
Genetics Research.2023; 2023: 1. CrossRef - Naked cuticle homolog 1 prevents mouse pulmonary arterial hypertension via inhibition of Wnt/β-catenin and oxidative stress
Shanwu Wei, Lu Lin, Wen Jiang, Jie Chen, Gu Gong, Daming Sui
Aging.2023;[Epub] CrossRef - MicroRNA‐195‐5p suppresses osteosarcoma cell proliferation and invasion by suppressing naked cuticle homolog 1
Qiang Qu, Xiangdong Chu, Peng Wang
Cell Biology International.2017; 41(3): 287. CrossRef - Downregulation of NKD1 in human osteosarcoma and its clinical significance
Xiang Chen, Ping Xu, Jianwei Zhu, Fan Liu
Molecular Medicine Reports.2017;[Epub] CrossRef - Lung Adenocarcinoma Staging Using the 2011 IASLC/ATS/ERS Classification: A Pooled Analysis of Adenocarcinoma In Situ and Minimally Invasive Adenocarcinoma
Madhusmita Behera, Taofeek K. Owonikoko, Anthony A. Gal, Conor E. Steuer, Sungjin Kim, Rathi N. Pillai, Fadlo R. Khuri, Suresh S. Ramalingam, Gabriel L. Sica
Clinical Lung Cancer.2016; 17(5): e57. CrossRef - The NKD1/Rac1 feedback loop regulates the invasion and migration ability of hepatocarcinoma cells
Jie Li, Sheng Zhang, Qing Hu, Kang Zhang, Jianbin Jin, Xuqing Zheng, Zhenyu Yin, Xiaomin Wang
Scientific Reports.2016;[Epub] CrossRef - NKD1 correlates with a poor prognosis and inhibits cell proliferation by inducing p53 expression in hepatocellular carcinoma
Sheng Zhang, Jie Li, Xiaomin Wang
Tumor Biology.2016; 37(10): 14059. CrossRef - Expression pattern and clinicopathologic significance of NKD1 in human primary hepatocellular carcinoma
Sheng Zhang, Jie Li, Zhen‐Yu Yin, Ping‐Guo Liu, Wen‐Xiu Zhao, Cheng‐Rong Xie, Bi‐Xin Zhao, Xiao‐Min Wang
APMIS.2015; 123(4): 315. CrossRef - Early lung cancer with lepidic pattern
Wilko Weichert, Arne Warth
Current Opinion in Pulmonary Medicine.2014; 20(4): 309. CrossRef - Altered Expression of PTEN and Its Major Regulator MicroRNA-21 in Pulmonary Neuroendocrine Tumors
Hyoun Wook Lee, Seung Yeon Ha, Mee Sook Roh
Korean Journal of Pathology.2014; 48(1): 17. CrossRef - The New 2011 International Association for the Study of Lung Cancer/American Thoracic Society/European Respiratory Society Classification of Lung Adenocarcinoma in Resected Specimens: Clinicopathologic Relevance and Emerging Issues
Seung Yeon Ha, Mee Sook Roh
Korean Journal of Pathology.2013; 47(4): 316. CrossRef
 PubReader
 ePub Link
-
 Cite this Article
- Cite this Article
-
- Close
- Download Citation
- Close
- Figure
-