


Abstract
Brine reservoirs in Europa's icy crust, if they exist, could represent the most accessible liquid water bodies in the outer solar system. Any potential subsurface reservoirs are key for the exploration of ocean worlds and the search for habitability and life beyond Earth. Previous studies have demonstrated that freezing cryoreservoirs might trigger eruptions due to the pressurization associated with volume change as liquid water expands to become water ice, but those studies did not take into account the deformation of the reservoir wall. Viscoelastic deformation of the wall can act to accommodate the growing overpressure and prevent eruptions. Here we utilize a semianalytical numerical approach to calculate the pressure-induced deformation of a freezing cryoreservoir on Europa as a function of the far-field ice temperature. We find that shallow reservoirs located in relatively cold ice deform slightly and can be pressurized by freezing, but that deeper reservoirs located in warmer ice deform more easily and in some cases cannot reach the threshold overpressure required for spontaneous eruption. We identify a transition depth around 4–8 km depending on the reservoir radius, assuming a conductive ice shell structure consistent with current best estimates. Further, we find that shallow lens-shaped reservoirs may store a large volume of cryomagma and can be easily pressurized by freezing; they represent the best candidates for the mobilization of cryovolcanic material at Europa's surface.
Export citation and abstract BibTeX RIS

Original content from this work may be used under the terms of the Creative Commons Attribution 4.0 licence. Any further distribution of this work must maintain attribution to the author(s) and the title of the work, journal citation and DOI.
1. Introduction
Jupiter's icy moon Europa possesses one of the youngest surfaces of the solar system, with an average surface age estimated around 40–90 Myr (Zahnle et al. 2003; Bierhaus et al. 2009). The great variety of geological features observed on Europa's surface demonstrates widespread ongoing or geologically recent activity (Greeley et al. 1998; Doggett et al. 2009; Kattenhorn & Prockter 2014; Howell & Pappalardo 2018). Additionally, it is very likely that Europa hosts a global liquid water ocean that is believed to be in contact with its rocky mantle (Khurana et al. 1998; Kuskov & Kronrod 2005) and situated beneath an ∼20–50 km thick icy crust (Howell 2021). Based on surface observations and subsurface modeling, several studies have also hypothesized the potential presence of liquid reservoirs in the ice crust (e.g., Fagents 2003; Schmidt et al. 2011; Dombard et al. 2013; Craft et al. 2016; Manga & Michaut 2017). These reservoirs, if they exist, could represent the most accessible liquid water bodies in the outer solar system and are key for the exploration of ocean worlds and the search for life beyond Earth.
Europa is the target of the upcoming National Aeronautics and Space Administration (NASA) Europa Clipper mission (Howell & Pappalardo 2020) and one target of the upcoming European Space Agency (ESA) JUICE mission (Grasset et al. 2013). In anticipation of the arrival of these spacecraft, it is important to address the question of whether or not liquid water could reach Europa's surface and to constrain the sources of any potential observed flows.
Some geological features observed in images collected by the Galileo spacecraft, such as domes (Quick et al. 2017) and smooth plains (Fagents 2003), have been interpreted as flows of water-based material. However, the origin and plausibility of ocean-surface water transport and/or in situ melting remain a topic of heavy debate. Previous studies have demonstrated that eruption of liquid water rising directly from the ocean through cracks is unlikely because of the unrealistically high pressure this mechanism requires: oceanic pressure of the order of 105–106 Pa, which may be implausible (Manga & Wang 2007). Even with significant overpressure from global ice shell thickness changes, deep viscoelastic relaxation and significant gravity are likely to prevent any throughgoing crack formation on Europa (Rudolph et al. 2022).
Hydrologically isolated reservoirs of briny liquid water, canonically referred to as cryomagma, are one alternative eruption source (Fagents 2003; Neveu et al. 2015; Lesage et al. 2020). Although the formation and stability of these reservoirs are challenged by the difficulty of melting more than a few percent of ice (Vilella et al. 2020) and a potentially short percolation timescale to the ocean (Kalousová et al. 2014), the eruption of fluid from these reservoirs could be initiated by the freezing of only a few percent of their volume (Neveu et al. 2015; Lesage et al. 2020). This work chiefly addresses whether isolated bodies of liquid water contained within the ice shell are capable of spontaneous eruption due to overpressure induced by freezing, while considering the viscoelastic deformation of their surroundings. Thus, we remain agnostic to the origin of any specific isolated liquid water body and instead focus on their eruptability.
A few authors have studied the pressurization of such cryoreservoirs. Fagents (2003) first proposed that the freezing of a few percent of cryomagma could be sufficient to generate a pressure great enough to overcome the negative buoyancy of liquid water in the ice crust. Neveu et al. (2015) also predicted that the freezing of a small fraction of cryomagma in a reservoir can generate pressures up to several MPa, which is enough to fracture the ice shell and trigger an eruption. Finally, Lesage et al. (2020) proposed a model to simulate the freezing of a briny cryoreservoir and predicted the critical freezing time required to trigger an eruption and the erupted volume of cryolava. Nevertheless, these studies do not take into account the ice viscoelastic rheology, which can allow the reservoirs to accommodate the freezing overpressure. This mechanism may increase the critical freezing time or even prevent the eruption in some cases.
On Earth, the deformation of pressurized magma chambers is well described compared to their planetary counterparts and has been related to surface deflection of the ground before and after an eruption (Folch et al. 2000; Segall 2016) or the formation of volcanic activity–related structures such as calderas (Jellinek & DePaolo 2003). McTigue (1987) first calculated the deformation of a spherical cavity in an elastic medium due to the increase of its internal pressure. Nevertheless, as demonstrated by Hodge (1974), a shell of partially molten material develops around magma reservoirs because of the thermal transfer between magma and the surrounding rock, locally decreasing the parent rock viscosity. Thus, to more realistically model the evolution of pressurized magma reservoirs, Dragoni & Magnanensi (1989) proposed a new analytical model to calculate the deformation and stress fields around pressurized spherical reservoirs surrounded by a viscoelastic shell. However, the model of Dragoni & Magnanensi (1989) was developed in the context of terrestrial magma chambers with a predictable inner pressure source function, which is consistent with sustained magma chamber replenishment from mantle sources.
Sustained sources of pressure, like those invoked for silicate magmatism on Earth, may not represent potential water volcanism on Europa. There, reservoirs might be isolated from the internal ocean, with their inner pressure increasing with time due to freezing. For this case, the pressure evolution and reservoir deformation are intrinsically linked and cannot be decoupled, and it is necessary to adapt the deformation model of Dragoni & Magnanensi (1989) to a different pressure source that takes into account the reservoir deformation. Gregg et al. (2013) proposed a two-dimensional finite element model of magma chamber deformation adapted to increasing inner pressure. To address the first-order controls on the eruption of deformable wall magma chambers, we simplify the approach of Gregg et al. (2013) to a pseudoanalytical, one-dimensional, spherically symmetric finite element model.
Lesage et al. (2020) speculated that, to first order, the ability to erupt was intuitively dependent on the Maxwell time of the viscoelastic ice and the critical freezing time in the case of a nondeformable reservoir wall. Here we improve upon our first cryomagma freezing model, taking into account the viscoelastic deformation of ice. To do so, we use the formulation proposed by Dragoni & Magnanensi (1989) and adapt it to Europa's ice shell and putative cryoreservoirs. We thus refine our predictions regarding the feasibility for cryomagma reservoirs on Europa to erupt and calculate the overpressure needed to overcome the reservoir deformation, as well as its associated critical freezing time and erupted volume. We predict the conditions for which reservoir deformation inhibits the eruption by accommodating the freezing overpressure. We then compare these results to the first-order estimates of Lesage et al. (2020). Finally, we extend the reservoir freezing model to lens-shaped reservoirs with more realistic, horizontally elongated geometries.
2. Model
2.1. Principle
We begin by assuming that a liquid water reservoir is emplaced in Europa's ice shell. Whether emplaced by melting or by fracturing and ascent of oceanic water, it acts as a heat source that warms and decreases the viscosity of the surrounding ice, promoting viscoelastic behavior (further details are given in Section 2.3). For this reason, we use the approach of Dragoni & Magnanensi (1989), which is summarized in Figure 1. We define R1 to be the reservoir radius and R2 the viscoelastic shell radius (see Figure 1).

Figure 1. Schematic model of a cryomagma reservoir surrounded by viscoelastic and elastic ice. The cryomagma reservoir has a radius R1, and the viscoelastic shell has a radius R2. Here K1 and K2 are the bulk moduli of, respectively, the viscoelastic and elastic ice, and G1 and G2 are their respective shear moduli. Here r is the radial coordinate, and η is the viscosity of the viscoelastic ice (where R1 < r < R2). In the reservoir, the overpressure ΔP comes from cryomagma freezing. Adapted from Dragoni & Magnanensi (1989).
Download figure:
Standard image High-resolution imageEach of the physical parameters used below are summarized in Table 1. The Cryoreservoir Freezing-Induced Eruption Simulation (CryoFRIES) code developed and used in this study is available at https://github.com/ElodieLesage/CryoFRIES.git.
Table 1. Parameters Used in This Study
| Parameter | Description | Value |
|---|---|---|
| cp | Specific heat capacity of ice | 2.3 J kg−1 K−1 |
| E | Young modulus | 3 · 109 Pa |
| G | Shear modulus | 3 · 109 Pa |
| H | Reservoir depth | 1–10 km |
| k | Thermal conductivity of ice | 2.3 W m−1 K−1 |
| K | Bulk modulus |

|
| R1 | Reservoir radius | 10 m–5 km for spherical reservoirs, up to 100 km for lens-shaped reservoirs |
| R2 | Viscoelastic shell radius | See Figures 1 and 4 and Equation (9) |
| Tcold | Temperature in the ice crust far from any reservoir | Linear gradient from 110 (surface) to 250 K (bottom of conductive layer, 10 km deep) |
| Tm | Cryomagma melting temperature | 273 K for pure water, 268 K for briny cryomagma (Kargel 1991) |
| T(R2) | Temperature at which ice becomes viscoelastic around a reservoir | See Section 2.3 and Equation (9) |
| Ve | Erupted volume with nondeformable wall approximation | See Equation (6) |
| Vev | Erupted volume taking into account the elastic and viscoelastic deformation | Estimated using the iterative scheme described in Section 2.5 |
| ΔPc | Critical overpressure necessary to fracture the reservoir with the nondeformable wall approximation | 2(σc + ρs gH), see Equation (4) |
| η | Viscosity | See Equation (7) (applies to viscoelastic region only, i.e., R1 < r < R2) |
| κ | Thermal diffusivity of ice | k/(ρs cp ) |
| ν | Poisson ratio | 0.325 |
| ρl | Density of liquid cryomagma | 1000 kg m−3 for pure water, 1180 kg m−3 for briny cryomagma |
| ρs | Density of ice | 920 kg m−3 for pure water ice, 1130 kg m−3 for briny ice |
| σc | Tensile strength of ice | Linear gradient from 1.7 · 106 (surface) to 1 · 106 (10 km deep; Litwin et al. 2012) |
| τ | Viscoelastic deformation time | See Dragoni & Magnanensi (1989), Equation (9) |
| τM | Maxwell time | η/E |
| τc | Critical freezing time necessary to fracture the reservoir with the nondeformable wall approximation | See Equation (5) |
| τcv | Critical freezing time necessary to fracture the reservoir taking into account the ice elastic and viscoelastic deformation | Estimated using the iterative scheme described in Section 2.5 |
| χ | Liquid water compressibility | 5 · 10−10 Pa−1 |
Download table as: ASCIITypeset image
2.2. Critical Freezing Time of a Nondeformable Reservoir
As described in Lesage et al. (2020), we make the assumption that cryomagma reservoirs are pressurized by freezing as the liquid phase transitions to the less dense solid phase. In this model, cryomagma gradually freezes from the reservoir wall as heat is conducted into the surrounding ice. We made, in the first model, the approximation of a nondeformable reservoir wall that does not accommodate the overpressure. We call this the "nondeformable wall approximation" throughout the paper. Under this assumption, the overpressure ΔP in the reservoir is

where χ is the liquid water compressibility, n is the cryomagma frozen fraction, and ρl and ρs are, respectively, the densities of the cryomagma and associated ice. The frozen fraction n is calculated as a function of time by solving the Stefan problem (see Lesage et al. 2020, Appendix A, for further details),

Here R1 is the reservoir radius, and S is the cryomagma frozen layer thickness as a function of time,

with λ being a constant given by solving the Stefan problem and κ the ice thermal diffusivity. Combining Equations (1)–(3), we can calculate the evolution of the overpressure in a freezing reservoir with time, noting that we are still under the nondeformable wall approximation. Figure 2(a) shows the pressure evolution in a 500 m radius reservoir located 2 km beneath the ice shell surface.
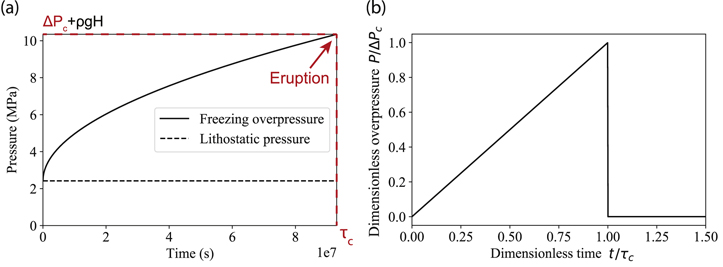
Figure 2. (a) Pressure in the reservoir due to cryomagma freezing as modeled by Lesage et al. (2020) under the nondeformable wall approximation. Here ΔPc is the critical overpressure necessary to trigger an eruption, and τc is the critical freezing time necessary to reach ΔPc . (b) Linear pressure source function used in this model.
Download figure:
Standard image High-resolution imageWe solve the Stefan problem for the mean temperature around a reservoir (calculated by averaging the temperature along the reservoir wall), rather than a discrete approach that allows the wall temperature to vary spatially. This makes the calculation much faster and is a valid approximation, as the overpressure in the reservoir is calculated using the mean thickness of the frozen cryomagma layer, regardless of its spatial distribution. Given that the heat transfer equation is linear as a function of the temperature, this approximation is not expected to impact the freezing rate.
The critical overpressure necessary to break a reservoir wall is (Lesage et al. 2020, Equation (12))

where σc is the ice tensile strength (Litwin et al. 2012), and H is the reservoir depth. By combining Equations (1)–(3) and setting ΔP = ΔPc , we can calculate the critical freezing time τc necessary to trigger an eruption with the nondeformable wall approximation

where  is a constant obtained by solving the Stefan problem (see Lesage et al. 2020 for details) and
 is the ice thermal diffusivity. Then, during an eruptive event, the cryolava erupted volume Ve
corresponds to the cryomagma volume increase in the reservoir due to phase change prior to the eruption. This volume is thus proportional to the solid and liquid densities,
is the ice thermal diffusivity. Then, during an eruptive event, the cryolava erupted volume Ve
corresponds to the cryomagma volume increase in the reservoir due to phase change prior to the eruption. This volume is thus proportional to the solid and liquid densities,

where Vi is the volume of liquid cryomagma before freezing, and nc is the critical frozen fraction of cryomagma.
2.3. Ice Rheology
In this study, we assume a linear thermal gradient in the outermost 10 km of Europa's icy crust, which corresponds to the portion of the ice shell where the dominant mechanism of global heat transfer is thermal conduction. This imposed conductive layer ranges from 250 K at 10 km depth to 110 K at the surface. This corresponds to the current best estimate for the thickness (10.4 km) and basal temperature (∼252 K) spanned by the conductive layer of the ice shell (Howell 2021). This initial ice shell temperature profile does not take into account the presence of a warm reservoir and is called Tcold hereafter. More locally, the ice temperature around a freezing reservoir is calculated by solving the Stefan problem (see Lesage et al. 2020 for details).
Because of the thermal gradients both in the ice crust and around reservoirs, we expect some parts of the ice shell to behave as a viscoelastic, rather than fully elastic, material. To calculate the viscosity η of the viscoelastic ice as a function of its temperature T, we use the Newtonian law of Hillier & Squyres (1991):

At high stresses and strain rates, like those associated with tectonic deformation, the ice will exhibit non-Newtonian behavior that can locally increase the viscosity. At lower stresses and strain rates (such as those associated with convection), Newtonian diffusion creep dominates (Goldsby & Kohlstedt 2001; Howell & Pappalardo 2018). Thus, we capture best the first-order temperature dependence of viscosity, and while incorporating non-Newtonian behavior was beyond the scope of this study's iterative approach, incorporating a more complex rheology may act to mitigate reservoir deformation by increasing the icy viscosity.
As reservoirs may extend vertically across several hundred or even thousand meters, we must calculate the mean viscosity along the wall of a given reservoir. To take into account the maximum deformation possible of each reservoir and thus not overestimate their eruption likelihood, we use a harmonic mean for the viscosity, preferentially weighting the lower viscosity values. The viscosity harmonic mean is defined as

where T1 and Tn are the temperatures, respectively, at the top and bottom of the reservoir. We choose a small temperature step, i.e., Ti+1 − Ti ≪ Tn .
To understand the ice rheology around a reservoir at a given depth, it is necessary to compare two timescales: (i) the Maxwell relaxation time of the ice, τM = η/E, with E being the ice Young modulus and η the temperature-dependent viscosity; and (ii) the critical freezing time τc of the reservoir, which determines the timescale over which the stresses generated by the freezing overpressure are applied to the reservoir wall. A first-order approximation of τc is calculated by making the assumption of a nondeformable reservoir wall (see Lesage et al. 2020, Equation (17)).
Figure 3 shows a comparison between τM and τc for a 500 m radius reservoir. One can see that in the first 6 km of ice extending from the surface, τM ≫ τc (light blue region of Figure 3), which means the viscous component of the strain in response to the freezing stress is negligible in this region. Above 6 km, the ice behaves mostly as an elastic material during the freezing, and for more simplicity, we refer to this region as the elastic ice hereafter. Deeper than 6 km, τM ≪ τc , which means the ice behaves as a viscoelastic material during freezing. We call it viscoelastic ice in the rest of this paper. One should note that the elastic–viscoelastic transition depth is a function of the critical freezing time and thus depends on the reservoir radius. It is also inversely proportional to the reservoir depth and varies between approximately 7 and 5 km for reservoirs of radius ranging from 100 m to 1 km, respectively.

Figure 3. Black line: Maxwell time τM of the ice, far from any reservoir. Blue line: critical freezing time τc of a 500 m radius reservoir. When τM ≫ τc (light blue region), the ice can be approximated as an elastic medium, and the viscous component is negligible. When τM ≲ τc (white region), the ice behaves as a viscoelastic material. The transition takes place at H ≃ 6 km for a 500 m radius reservoir at a temperature T ≃ 194 K.
Download figure:
Standard image High-resolution imageOn a more local scale, the calculation of the Maxwell time around a reservoir allows derivation of the thickness of the viscoelastic shell surrounding a reservoir located in elastic ice, R2 − R1. This can be accomplished by finding the location r = R2, where ice is cold enough to behave as a purely elastic material, i.e., where τM becomes greater than τc . To determine R2, we first find the temperature T(R2) at which τM = τc using Equation (7) to represent the ice viscosity. The radius R2 can then be determined by finding the location where the temperature around the reservoir equals T(R2). An expression for R2 can be obtained by manipulating the solution to the Stefan problem for the temperature around the reservoir (see Lesage et al. 2020, Equation (31) and Figure 12) and substituting T = T(R2),

where κ is the ice thermal diffusivity, Tcold(H) is the far-field temperature, and Tm is the cryomagma melting temperature.
As an example, the thickness of the viscoelastic shell around a 500 m radius reservoir is shown in Figure 4 as a function of the reservoir depth. One can see that the viscoelastic shell is relatively thin, with a maximum thickness of 1.3 · R1. Again, the elastic–viscoelastic transition appears in Figure 4 at around 6 km; deeper than 6 km, the thickness of the viscoelastic shell diverges, as there is no elastic region any more. Thus, for reservoirs located deeper than the transition depth, we adapt the model by considering a fully viscoelastic material.
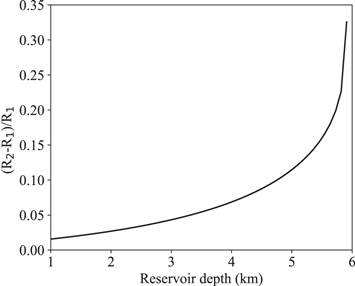
Figure 4. Dimensionless thickness of the viscoelastic shell around a 500 m radius reservoir at the end of the freezing (t = τc calculated with the nondeformable wall approximation) as a function of its depth in the ice crust.
Download figure:
Standard image High-resolution image2.4. Deformable Wall
To predict the response of a cryomagma reservoir to the increase of its inner pressure, we adapt the formulation of Dragoni & Magnanensi (1989). That study calculated an analytical solution for the one radial (σrr (r, t)) and two tangential (σθ θ (r, t) and σϕ ϕ (r, t)) stress fields around a pressurized magma reservoir, as well as the wall displacement (u(r, t)). Each of these quantities is a function of the radial position, r, and time, t. We follow the approach of Dragoni & Magnanensi (1989), whereby we pose these equations for the purely elastic case and then use the correspondence principle (Biot 1954) to generalize the equations to a viscoelastic material. The final expressions we used for u(r, t), σrr (r, t), σθ θ (r, t), and σϕ ϕ (r, t) are the following:


The coefficients A1, A2, B1, B2, C1, C2, and D0 and the two functions f1(t) and f2(t) used in Equations (10)–(12) are provided in Appendix 2 of Dragoni & Magnanensi (1989). One should note that here we used the more common planetary notation for shear modulus, G, referred to as μ in Dragoni & Magnanensi (1989). We use Equation (7) to calculate these coefficients.
Equations (10)–(12) are based on a trapezoidal overpressure function, written as
where t = 0 is the beginning of the pressure increase, t = t1 is the beginning of the pressure plateau, t = t2 is the beginning of the pressure decrease, and t = t3 is the time at which the excess pressure has been fully released. In our case, we assume that the pressure increases linearly during freezing and decreases abruptly at t = τc when the eruption begins. We set t1 = t2 = t3 = τc to obtain a linear pressure source function. By doing so, we adapt the trapezoidal pressure function of Dragoni & Magnanensi (1989) to the simpler pressure function shown in Figure 2(b).
2.5. Pressure Source Function: Iterative Numerical Model
As described above, we improve upon Lesage et al. (2020) by investigating and quantifying the pressure changes induced by (i) the cryomagma freezing and (ii) the reservoir deformation. Because these behaviors are coupled, it is not possible to derive an analytical form of the unique realistic critical freezing time to reach the critical overpressure, ΔPc , and trigger an eruption. To solve this problem and find the critical freezing time, hereafter called τcv (where the index v stands for viscoelastic), we use the following iterative process, illustrated in Figure 5.
- 1.We calculate the critical freezing time, τc , of a reservoir and the associated overpressure, ΔPc , by making the nondeformable wall assumption using the model from Lesage et al. (2020).
- 2.We calculate the corresponding deformation u(R1, τc ) from Equations (10)–(12) at time t = τc and the induced pressure drop, δ P, using the definition of the water compressibility,
 , with χ being the water compressibility, Vi
the reservoir volume before deformation, and Vf
its volume after deformation.
, with χ being the water compressibility, Vi
the reservoir volume before deformation, and Vf
its volume after deformation. - 3.We calculate the critical freezing time necessary to reach an overpressure ΔPc + δ P and simulate new reservoir deformation after this longer freezing time, τc + δ τ. This deformation induces a new pressure drop of δ P2.
- 4.We verify whether δ P − δ P2 <
 , where is an imposed convergence criterion; we use = ΔPc
· 10−5. If the model converges, the algorithm has found the realistic critical freezing time τcv = τc
+ δ
τ to reach the critical overpressure, ΔPc
. If not, the algorithm iterates beginning with step 3, replacing δ
P with δ
P2 and δ
τ with δ
τ2, and then verifies the convergence, and so on.
, where is an imposed convergence criterion; we use = ΔPc
· 10−5. If the model converges, the algorithm has found the realistic critical freezing time τcv = τc
+ δ
τ to reach the critical overpressure, ΔPc
. If not, the algorithm iterates beginning with step 3, replacing δ
P with δ
P2 and δ
τ with δ
τ2, and then verifies the convergence, and so on.

We iterate until the program converges to a realistic critical freezing time, τcv, that takes into account the feedback between pressurization and deformation. As an example, Figure 6 shows the pressure drop, δ P, caused by the reservoir deformation at each iteration for a 500 m radius reservoir located 2 km deep in the ice crust. We can see that the iterative process converges relatively quickly to a realistic pressure function in this case; 17 iterations were sufficient to reach the convergence criterion.
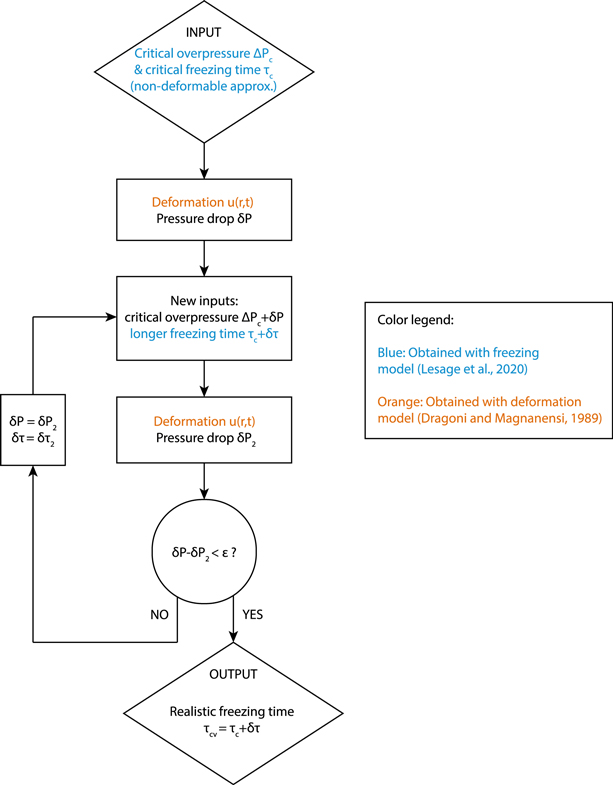
Figure 5. Numerical procedure used to calculate the critical pressure and freezing time in the case of a deformable wall.
Download figure:
Standard image High-resolution image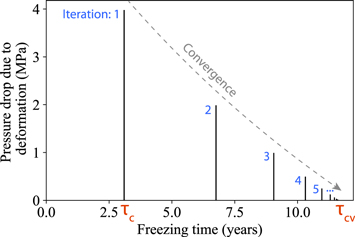
Figure 6. Pressure drop in the reservoir at each iterative step of the algorithm and the associated critical freezing time. The algorithm converges to a realistic critical freezing time τcv in 17 iterations. The results were obtained with a shallow reservoir (see reservoir A in Table 2).
Download figure:
Standard image High-resolution imageIn some cases, the deformation is great enough to completely accommodate the freezing overpressure at each iteration, and the algorithm cannot find a realistic τcv. In this case, the model diverges. This result indicates that the modeled reservoir cannot be pressurized by freezing and thus cannot trigger eruptions. We demonstrate in the Results section (see Section 3.2) that reservoirs for which the algorithm diverges largely correspond to cases where τc > τM. Hence, perhaps intuitively, the Maxwell time of the ice can be used to discriminate reservoirs that can or cannot trigger eruptions.
2.6. Application to Lens-shaped Reservoirs
The model described above is adapted to spherical reservoirs. Nevertheless, as is the case for terrestrial magma chambers (Sigurdsson et al. 1999), cryomagma reservoirs on Europa may have an elongated, lens, or sill shape (Michaut & Manga 2014; Craft et al. 2016; Manga & Michaut 2017). As Europa's conductive upper icy shell is assumed to be 10 km thick in our model (Howell 2021), the assumption of spherical reservoirs limits their radius to 5 km and thus their volume to <1012 m3. Moreover, for reservoirs with a significant vertical extent, the wall viscosity can be several orders of magnitude lower at the reservoir bottom than at the top, so large spherical reservoirs deform mostly from their bottom. This behavior may be very different than that of elongated, shallow reservoirs embedded in high-viscosity ice. For these reasons, we adapted our model to simulate the freezing of elongated lens-shaped reservoirs, which are modeled as ellipsoids with a and b as two equal horizontal semiaxes and c as the vertical semiaxis. For simplicity, we denote the geometry of ellipsoidal reservoirs by calculating a semiaxis aspect ratio, F, where a = b = F · c.
To robustly adapt our model to ellipsoidal reservoirs, we primarily modify the temperature field around the reservoirs to match their new vertical extent. The Stefan problem is solved in Cartesian coordinates in our model, which remains a realistic approximation because the freezing layer is thin compared to the radius of the cavity.
The deformation model of Dragoni & Magnanensi (1989) is formulated in spherical geometry and thus cannot be applied to ellipsoid reservoirs. We demonstrate in Section 3.1 that the deformation of reservoirs located entirely within elastic ice is negligible, and deformation of reservoirs stored in viscoelastic ice prevents their eruption. Hence, we chose to calculate the critical freezing time and erupted volume of ellipsoid reservoirs without taking into account their viscoelastic deformation, and we use the comparison between their critical freezing time τc and Maxwell time τM to determine whether an eruption is possible or not, the efficacy of which is demonstrated in Section 2.5.
3. Results
We first show in Section 3.1 the evolution of the deformation and stress fields around a 500 m radius reservoir. The initial iteration considers the linear pressure source function obtained with the nondeformable wall approximation. Each successive iteration considers coupled changes in the stress and displacement fields. We find that the algorithm never converges for the viscoelastic reservoirs located in warm, low-viscosity ice and justifies the need to study the nondeformable case as a comparison between the elastic and viscoelastic reservoir environments. In Section 3.2, we use the iterative model to calculate the realistic pressure source function, taking into account the feedback between pressure and deformation. We then generalize these results to reservoirs of varying radius and depth and predict the critical freezing time and erupted volume for reservoirs able to trigger eruptions. These results are more realistic than the one predicted by Lesage et al. (2020) and, more importantly, allow us to identify which reservoirs can or cannot trigger eruptions.
3.1. Deformation and Stress Fields around a Freezing Reservoir
The results presented in this section are obtained for a spherical 500 m radius reservoir filled with pure liquid water (see Section 3.2 for results with varying radius, depth, and composition). The elastic–viscoelastic transition for these reservoirs is located approximately 6 km deep within the ice shell for a 10 km thick conductive layer. We model these two different cases as follows and summarized in Table 2.
- 1.The elastic case is modeled with a 2 km deep reservoir located in elastic ice and surrounded by a thin viscoelastic shell, the thickness of which is calculated to be around 10 m (reservoir A).
- 2.The viscoelastic case is modeled as an 8 km deep reservoir located in fully viscoelastic ice (reservoir B). In this case, as there is no elastic ice far from the reservoir, we set R2 equal to half of the thickness of Europa's viscoelastic ice shell (R2 = 2 km here), and we only model the region spanning R1 < r < R2.
Table 2. Parameters Used to Model Spherical Reservoirs A (Shallow) and B (Deep)
| Reservoir | Radius R1 | Depth | Viscoelastic Shell Radius R2 | Temperature Tcold | Critical Freezing Time τc |
|---|---|---|---|---|---|
| A | 500 m | 2 km | 1.025 · R1 | 142 K | 3 yr |
| B | 500 m | 8 km | 4 · R1 | 226 K | 110 yr |
Download table as: ASCIITypeset image
The deformation and stress fields around the reservoirs at t = τc in the elastic and viscoelastic cases are given in Figures 7 and 8, respectively. These results are obtained by applying the linear pressure source function obtained with the nondeformable wall approximation (see Figure 2). We show the solutions at t = τc , which is the critical freezing time under the nondeformable wall approximation calculated at the first iteration of our algorithm.

Figure 7. (a) Deformation and (b) radial and (c) tangential stress fields around a spherical 500 m radius reservoir located 2 km deep within the ice shell (reservoir A; see Table 2). Reservoir A is surrounded by a 10 m viscoelastic ice shell, itself embedded in elastic ice. Results are plotted at time τc , which is the critical freezing time required to reach an eruption under the nondeformable wall approximation calculated at the first iteration of our algorithm. As σθ θ reaches the critical value ΔP/2 (see Equation (4)), an eruption is possible in the case of a nondeformable wall, but in reality, a longer critical freezing time τcv will be necessary to reach the critical overpressure once we take into account the wall deformation.
Download figure:
Standard image High-resolution image
Figure 8. (a) Deformation and (b) radial and (c) tangential stress fields around a spherical 500 m radius reservoir located 8 km deep in the ice shell (reservoir B; see Table 2). Reservoir B is surrounded by viscoelastic ice only. Results are plotted at time t = τc , which is the critical freezing time required to reach an eruption under the nondeformable wall approximation calculated at the first iteration of our algorithm. As σθ θ never reaches the critical value ΔP/2 (see Equation (4)), eruptions cannot be triggered (τcv tends toward ∞).
Download figure:
Standard image High-resolution imageAs shown in Figure 7(a), reservoir A (elastic case) is lightly deformed due to freezing; after the critical freezing time τc , the reservoir radius increases by 30 cm. Figures 7(b) and (c) show that the critical radial and tangential stresses are reached at t = τc . As σθ θ reaches the critical value ΔPc /2, the eruption may be triggered. However, these results do not take into account the pressure drop caused by the wall deformation, so the critical stress required to trigger the eruption will not actually be reached by t = τc but only after a longer critical freezing time τcv. In the particular example of reservoir A, we obtained τcv = 12 yr, constituting a fourfold increase in critical freezing time and thus a significant increase in the intereruption timescale.
Figure 8(a) shows that reservoir B (viscoelastic case) is much more deformed due to the pressure increase; the reservoir radius increases by 200 m over the critical freezing time τc . In this case, the viscous rheology of the ice dominates, and tangential stresses are in an extensional state around the reservoir (Figure 8(c)), which is typical of the viscoelastic rheology (e.g., Dragoni & Magnanensi 1989). The tangential stress, σθ θ , never reaches the critical value, ΔPc /2, necessary to fracture the reservoir. This indicates that the overpressure is accommodated by the reservoir deformation, so reservoir B is unable to trigger an eruption. As the eruption cannot take place, the overpressure continues to increase as long as some liquid remains in the reservoir. We interrupt the algorithm after a few iterations following model divergence to save time and conserve sanity.
3.2. Critical Freezing Time and Erupted Volume
The results presented in this section are calculated with the iterative process introduced in Section 2.5 to calculate realistic critical freezing times τcv that take into account the feedback between pressure and deformation. Figure 9 shows the critical freezing times τc and how they compare with the realistic critical freezing times τcv calculated with the nondeformable wall approximation. We show τc and τcv as functions of the reservoir depth and fixed R = 500 m for this example. Although the critical freezing time is increased because of the wall deformation, it still remains in the same order of magnitude as τc for a given reservoir depth and radius. The same effect is observed for the (first eruption event) erupted volume Ve in our calculations that is of the same order of magnitude as Vev. This demonstrates that the nondeformable wall approximation is acceptable for reservoirs located in elastic ice. This first important result may simplify future studies and further modeling of cryomagmatic reservoirs.
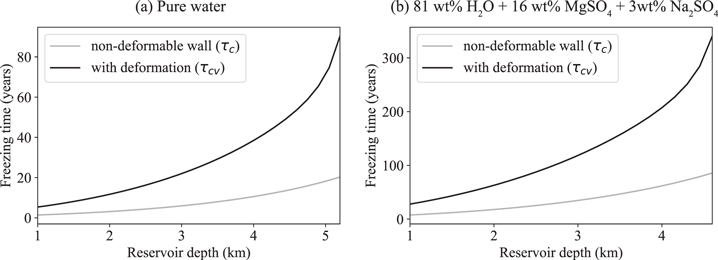
Figure 9. Critical freezing time before eruption of a 500 m radius reservoir as a function of its depth in the nondeformable wall approximation (gray line) and with the wall deformation (black line). Two cryomagma compositions are modeled: (a) pure liquid water and (b) a briny cryomagma (81 wt% H2O + 16 wt% MgSO4 + 3 wt% Na2SO4).
Download figure:
Standard image High-resolution imageFigures 10 and 11 summarize our results in terms of critical freezing timescale and erupted volume for a large range of reservoir radii (from 10 m to a few kilometers) and depth (from 1 to 10 km below the surface, assuming the conductive layer is 10 km thick). Figure 10 shows the critical freezing time necessary to trigger an eruption for reservoirs filled with pure liquid water (panels (a), (c), and (e)) or briny cryomagma sourced from the ocean (81 wt% H2O + 16 wt% MgSO4 + 3 wt% Na2SO4; Kargel 1991; panels (b), (d), and (f)). This ocean composition was obtained with models of brine evolution in CI chondrite bodies and represents an upper bound for oceanic salt concentration. More recent models take into account the possible early differentiation of Europa's interior and expect a lower salt concentration of maximum a few wt% (Melwani Daswani et al. 2021). To model briny cryomagma, we vary the density of the liquid and solid phases, respectively, equal to 920 and 1000 kg m−3 for pure water and 1130 and 1180 kg m−3 for briny cryomagma (Kargel 1991). We also set the freezing temperature to 268 K for the briny solution. Figure 11 shows the initial eruption volume for these two cryomagma compositions.
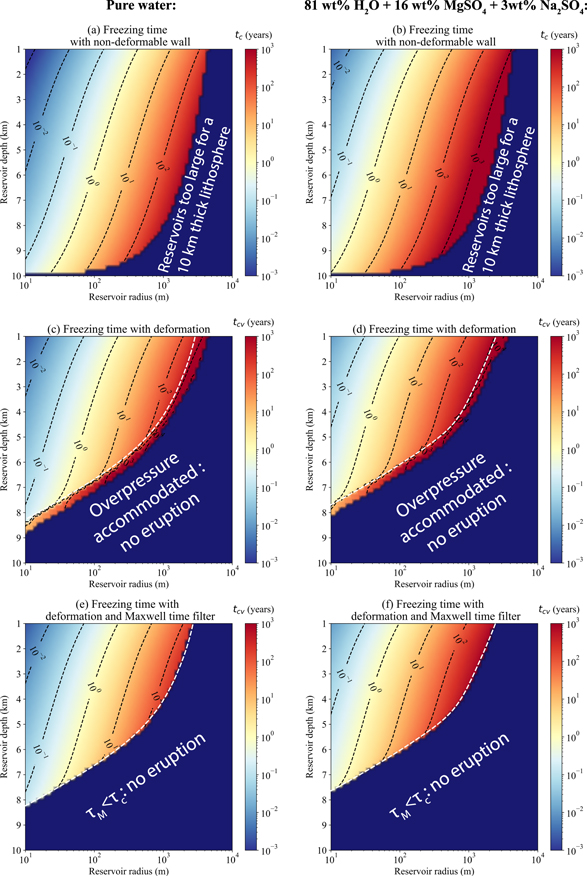
Figure 10. Critical freezing time necessary to trigger an eruption from a reservoir filled with ((a), (c), and (e)) pure liquid water and ((b), (d), and (f)) a mixture of liquid water and salts. The following situations are represented. (a) and (b) The reservoir wall does not deform during freezing (nondeformable wall approximation as in Lesage et al. 2020). The dark blue area represents reservoirs that are too large to be stored in a 10 km thick conductive ice crust. (c) and (d) The reservoir wall deformation is taken into account using the algorithm described in Section 2.5. The algorithm diverges for the reservoirs in the dark blue area; these reservoirs accommodate the overpressure by deformation and cannot trigger eruptions. (e) and (f) We take into account the wall deformation as in panels (c) and (d), but we add a filter using the Maxwell time criterion: the reservoirs for which τM < τc cannot trigger eruptions (dark blue area). The white dashed line corresponds to the limit between the elastic and viscoelastic reservoirs (Maxwell time criterion) in panels (e) and (f). This line is reported in panels (c) and (d) to show the similarity with the reservoirs for which the algorithm converges (eruption possible) or diverges (overpressure accommodated by deformation).
Download figure:
Standard image High-resolution image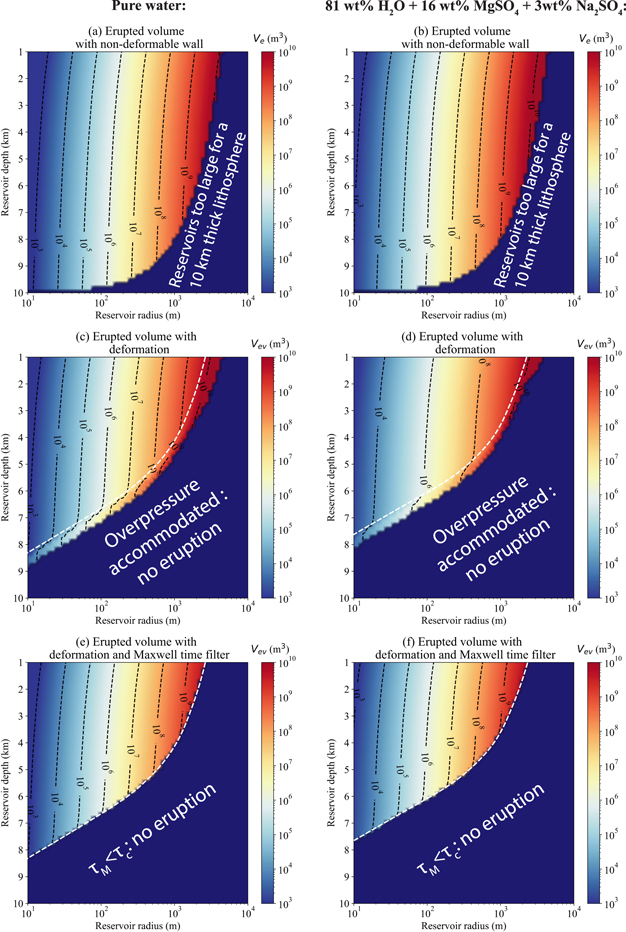
Figure 11. Volume of the first eruption of a reservoir filled with ((a), (c), and (e)) pure liquid water or ((b), (d), and (f)) a mixture of liquid water and salts. See caption of Figure 10 for the three different cases represented.
Download figure:
Standard image High-resolution imageFor these two figures, panels (a) and (b) are obtained with the nondeformable wall approximation as in Lesage et al. (2020). The dark blue areas of these panels simply indicate the reservoirs that are too large to be stored in the 10 km conductive layer. Panels (c) and (d) are obtained using the iterative algorithm described in Section 2.5. The dark blue area of these panels indicates the reservoirs for which the algorithm diverges and thus that cannot be pressurized by freezing according to the algorithm. Finally, panels (e) and (f) of both Figures 10 and 11 are calculated using the iterative model, but reservoirs that cannot trigger eruptions are identified using the Maxwell time criterion; for each reservoir, if τM > τc , then the ice behaves as a viscoelastic material, and the reservoir is considered as unable to erupt.
Here we propose to demonstrate the similarity of the results obtained with the deformation algorithm and the Maxwell time criterion when identifying the reservoirs that can or cannot trigger eruptions. In panels (e) and (f) of both Figures 10 and 11, we use white dashed lines to distinguish between reservoirs that are stored in the elastic ice (τM > τc ) and viscoelastic ice (τM < τc ). These lines are copied in panels (c) and (d). We propose that the comparison between τM and τc demonstrates that a simple viscoelastic analysis is a convenient and efficient method to evaluate the effects of viscoelastic deformation without employing the iterative deformation model. We demonstrate here that for a reservoir of a given radius and depth, if τM < τc , the reservoir deformation is always sufficient to accommodate the freezing overpressure and prevent an eruption.
3.3. Effect of Reservoir Geometry
We finally model the freezing of lens-shaped reservoirs by adapting our model to this new geometry as described in Section 2.6. An ellipsoidal geometry is more realistic to model putative sills or elongated reservoirs, which could better match the extent of the geological features observed on Europa, such as chaos, lenticulae, smooth plains, or double ridges (Michaut & Manga 2014; Craft et al. 2016). For these reservoirs, we cannot use the deformation model from Dragoni & Magnanensi (1989), which only applies to spherical cavities. Nevertheless, as demonstrated in the previous sections, reservoir deformation can be neglected in the elastic part of the ice, and we thus calculate the critical freezing time and erupted volume of lens-shaped reservoirs using the nondeformable wall approximation. This time, the reservoirs are modeled as ellipsoids of horizontal semiaxes a and b and vertical semiaxis c, with an aspect ratio F (a = b = F · c).
Figure 12 shows the results obtained with an aspect ratio F = 500. We consider reservoirs with horizontal extents up to several tens of kilometers. Compared to the spherical approximation, larger volumes can be stored in the elastic part of the ice with elongated reservoirs. We can see in Figure 12 that the erupted volume of cryolava goes up to 1013 m3 for an elongated reservoir with F = 500, compared with 109 m3 for a spherical one (see Figures 11(e) and (f)). This result demonstrates that elongated reservoirs or sills are necessary to explain the emplacement of large cryovolcanic features by freezing.
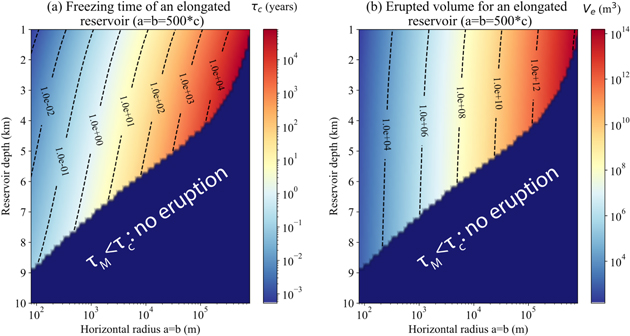
Figure 12. Critical freezing time and erupted volume for an ellipsoidal reservoir filled with pure water. The aspect ratio of the reservoir is 500 (a = b = 500c).
Download figure:
Standard image High-resolution imageFor example, Lesage et al. (2021) measured the volume of four relatively small (a few kilometers wide) smooth plains observed in Galileo images and found associated volumes of erupted cryolava up to 3 · 109 m3. This erupted volume corresponds to the limit of the plausible spherical reservoir volumes but can easily be explained with an elongated reservoir. The upper limit of 3 · 109 m3 of cryolava can be explained by the initial eruption from a 3 km deep or shallower spherical reservoir (Figures 11(e) and (f)) or a 6 km deep or shallower lens-shaped reservoir (Figure 12). The features studied in Lesage et al. (2021) are only a few kilometers wide, and larger potentially cryovolcanic features such as the lobate flows on the west side of Thrace Macula (47°S, 172°W; e.g., Fagents 2003) would thus imply shallower and larger lens-shaped reservoirs.
4. Discussion
If indeed freezing-induced cryolava eruptions have occurred on Europa, our results provide insights into the potential source depths of reservoir formation and eruption mechanisms. Mechanisms leading to the formation of reservoirs in the shallow part of the ice shell (⪅5 km, varies with the reservoir size and shape) could be compatible with freezing-induced eruptions; deeper reservoirs would accommodate the overpressure by viscoelastic deformation of the surrounding ice. Here we discuss those different hypotheses in view of our results, which are summarized in Figure 13.
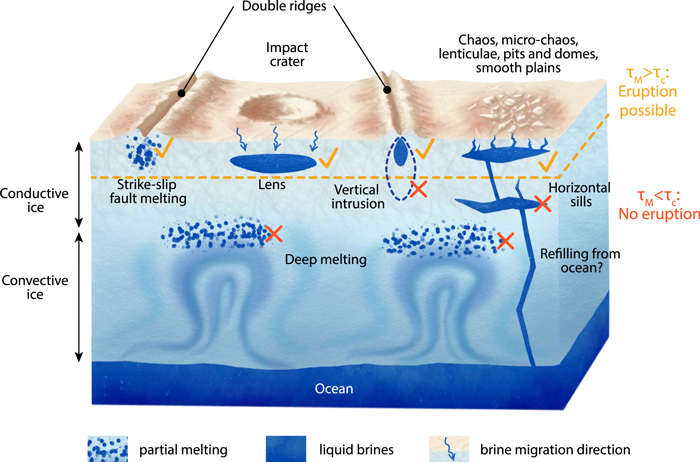
Figure 13. Review of the mechanisms proposed in the literature to explain the emplacement of liquid reservoirs invoked to correspond to a variety of geological features at Europa's surface. Tidally activated strike-slip faults may produce local partial melting and draining, as modeled by Kalousová et al. (2016) and Hammond (2020). Meteorite impacts may generate melted brine that, after percolating, can form shallow lenses per Steinbrügge et al. (2020). Double ridges may form by freezing of shallow liquid water intrusions as modeled by Johnston & Montési (2014) and recently observed in Greenland (Culberg et al. 2022). A wide range of features, such as chaos (Schmidt et al. 2011), microchaos, lenticulae, pits and domes (Manga & Michaut 2017), and smooth plains (Lesage et al. 2021), may be morphologically explained by the presence of water sills or elongated reservoirs in the shallow subsurface. Craft et al. (2016) demonstrated that horizontal sills can propagate in the ice shell (this study is applied to the formation of double ridges but is not represented here for simplicity of the figure), but this mechanism is challenging. Connection between the sills and the subsurface ocean is unlikely, as demonstrated by Walker et al. (2021). Finally, deep in situ partial melting on top of convective ice plumes has been modeled in several studies, e.g., Vilella et al. (2020) and references therein. We indicate with a dashed line the elastic–viscoelastic transition determined by comparing the ice Maxwell time, τM, and the reservoir critical freezing time, τc , assuming that all reservoirs represented have an identical critical freezing time. The figure is not to scale.
Download figure:
Standard image High-resolution image
Several modeling studies have predicted that partial melting occurs below Europa's conductive upper ice shell, in or on top of the convective layer, where the ice is warmer and the dissipation of tidal energy more efficient (Sotin et al. 2002; Tobie et al. 2003; Han & Showman 2010; Vilella et al. 2020). We demonstrate here that reservoirs formed by deep partial melting, if they remain at depth, would be very unlikely to erupt because of the low ice viscosity involved and the large critical freezing time required, even when assuming that tidal heating ceases prior to freezing. 4
Shallower reservoir formation mechanisms have been proposed in the literature, and eruptions from these reservoirs may be consistent with our results. Partial melting may be possible around tidally activated strike-slip faults, as explored by Hammond (2020); cyclic slip around fractures can produce frictional heat in the near surface, potentially enough to locally reach the water melting temperature. Simulations conducted by Kalousová et al. (2016) demonstrated that no more than 10% of the melt volume fraction could be stored in the shallow subsurface because of the efficient downward water percolation through the ice shell. These studies do not take into account antifreezing components like sulfates and chlorides that may be present within Europa's ice. Nevertheless, to allow the freezing of such a partially melted reservoir, heat input through tidal dissipation and advection (recharge from continuing activity) must decline or cease; our model thus only considers areas that are no longer geologically active.
Recent radar observations revealed the presence of a liquid sill beneath a double ridge in Greenland (Culberg et al. 2022). This double ridge may have been formed by freezing-induced fracturation and eruption of the reservoir as demonstrated by Culberg et al. (2022). In Lesage et al. (2021), we studied four smooth plains that are indeed located close to or cross-cutting double ridges. In the view of these new results, implying that elongated reservoirs are more likely to produce large deposits, potential relationships between ridges and long, shallow reservoirs may be of particular interest.
Craft et al. (2016) proposed another formation mechanism of shallow reservoirs that relates to the intrusion of sills in the ice shell. If these sills reach Europa's shallow lithosphere, they could represent good candidates for freezing-induced eruptions. In previous studies, shallow reservoirs have been considered in relation to the formation of several geological structures, including pits, domes and microchaos (Michaut & Manga 2014), and double ridges (Johnston & Montési 2014; Culberg et al. 2022). One challenge still persists with these formation mechanisms, that is the refilling of the sills. A recent study demonstrated that fractures are unable to propagate over sufficient distance to link Europa's ocean and near subsurface (Walker et al. 2021), which makes the shallow sill formation by ocean injection questionable.
Finally, impact-induced melting has also recently been considered on Europa. Steinbrügge et al. (2020) demonstrated that impact craters can cause local melting and brine migration, which could have formed a cryomagma reservoir and triggered an eruption by freezing in Manannán crater, among others. This mechanism is also compatible with our results, as the impact-induced reservoir would be located in shallow elastic ice (around 4 km deep; Steinbrügge et al. 2020). This melting and freezing mechanism has also been invoked on Ceres to explain the lobate deposits observed at the bottom of Occator crater (Hesse & Castillo-Rogez 2019; Raymond et al. 2020).
In Lesage et al. (2021), we investigated the possibility of cyclic cryolava eruptions in the case where reservoir freezing continues after the first eruption. In that case, the erupted cryolava volume can theoretically reach about one-tenth of the reservoir volume. Nevertheless, because the new reservoir radius and the temperature of the ice around the reservoir vary, it would be valuable to recalculate the critical freezing time, τc , before each eruption and compare it with the Maxwell time, τM, in order to know if the next eruption can be triggered. This is particularly true for reservoirs close to the elastic–viscoelastic transition depth corresponding to their radius and shape. We expect that, as the far-field ice temperature surrounding a reservoir increases with depth, viscoelastic relaxation becomes important. The intereruption timescale also increases with temperature (and depth), as observed as an increase in the critical freezing times for a given reservoir volume. The total number of eruptions and total erupted volume thus decrease with depth because more of the ice shell freezes between eruptive episodes. Finally, as the volume of melt required to relieve the overpressure decreases with decreasing reservoir volume, we expect the volumes of individual eruptions to decrease with depth.
5. Conclusion
In the context of the freezing of a cryomagma reservoir of a given depth, volume, and geometry, we demonstrate that we can separate Europa's conductive upper icy shell into two distinct layers:
- 1.The uppermost part of the conductive layer, where the Maxwell time of the ice, τM, is greater than the reservoir critical freezing time, τc , and thus behaves as an elastic material at the critical freezing timescale. This part of the ice shell deforms slightly but not rapidly enough to accommodate the freezing overpressure. It is possible to trigger an eruption by freezing a reservoir stored in this part of the icy shell.
- 2.The lower part of the conductive layer, where τM < τc . This region behaves as a viscous material at the critical freezing timescale. It deforms easily and fully accommodates the freezing overpressure. It is not possible to trigger an eruption from a reservoir stored in this part of the ice shell or anywhere at greater depths.
Our results indicate that the approximation of a nondeformable reservoir wall is realistic to model reservoirs for which τM > τc . These results may simplify further modeling of cryovolcanic eruptions by freezing.
Finally, we demonstrate that spherical reservoirs of more than a few kilometers in radius are unable to trigger eruptions, which limits their erupted volume to 1010 m3 in that case, for the assumed ice shell structure. Elongated ellipsoidal reservoirs may explain larger erupted volumes, up to 1014 m3 for reservoirs with a realistic aspect ratio of 500 between the horizontal and vertical semiaxes, and potentially more for greater aspect ratios. Depending on the reservoir geometry, the maximum depth of active reservoirs is limited to ≲75% of the conductive ice shell thickness.
The upcoming NASA Europa Clipper (Howell & Pappalardo 2020) and ESA JUICE (Grasset et al. 2013) missions will allow for the correlation of potential surface features and plumes, seen in both visible and spectroscopic imagery, and subsurface structures, observed through radar, to better constrain the evolution of potential reservoirs. This study represents a step in constraining the source depth and geometry of subsurface reservoirs using our understanding of the ice shell thermal and mechanical state. If erupting reservoirs are discovered and found to be relegated to the shallow depths predicted in this study, they may represent the most accessible candidate target for the in situ exploration of liquid water environments beyond Earth.
We acknowledge support from the Institut National des Sciences de l'Univers (INSU), France, the Centre National de la Recherche Scientifique (CNRS), France, and the Centre National d'Etudes Spatiales (CNES), France, through the Programme National de Planétologie, France. Portions of this research were carried out at the Jet Propulsion Laboratory, California Institute of Technology, under contract with the National Aeronautics and Space Administration (NASA). This work was partially supported by Scientific Exploration Subsurface Access Mechanism for Europa (SESAME) grant No. 80NSSC19K0614. The code developed and used in this study is available at https://github.com/ElodieLesage/CryoFRIES.
Footnotes
- 4
Nevertheless, as pointed out by Tobie et al. (2003), this first conclusion might be modulated in the case of a highly fractured crust that could produce enhanced tidal heating along preexisting faults and migration of the melt generated deeper.