


Abstract
The Imaging X-ray Polarimetry Explorer (IXPE) observed the black hole X-ray binary 4U 1630–47 in the steep power-law (or very high) state. The observations reveal a linear polarization degree of the 2–8 keV X-rays of 6.8% ± 0.2% at a position angle of 21 3 ± 09 east of north (all errors at 1σ confidence level). Whereas the polarization degree increases with energy, the polarization angle stays constant within the accuracy of our measurements. We compare the polarization of the source in the steep power-law state with the previous IXPE measurement of the source in the high soft state. We find that, even though the source flux and spectral shape are significantly different between the high soft state and the steep power-law state, their polarization signatures are similar. Assuming that the polarization of both the thermal and power-law emission components are constant over time, we estimate the power-law component polarization to be 6.8%–7.0% and note that the polarization angle of the thermal and power-law components must be approximately aligned. We discuss the implications for the origin of the power-law component and the properties of the emitting plasma.
Export citation and abstract BibTeX RIS

Original content from this work may be used under the terms of the Creative Commons Attribution 4.0 licence. Any further distribution of this work must maintain attribution to the author(s) and the title of the work, journal citation and DOI.
1. Introduction
Black hole X-ray binaries (BHXRBs) harbor a stellar mass black hole in close orbit with a companion star. The matter accreting onto the central black hole forms an accretion disk, which is heated by internal frictions to the point of emitting radiation that typically peaks in the X-ray band. BHXRB sources are found in different spectral states. The two main states, the high soft state (HSS) and low hard state (LHS), exhibit a spectrum that can be roughly described as a combination of both a soft thermal component and a harder electron-scattering component with reflection by a cold medium. In the HSS, the X-rays are dominated by the thermal accretion disk emission followed by a nonthermal tail extending beyond 500 keV. This state is often fitted with a multitemperature blackbody model and a power law ∝E−Γ with a photon index of Γ ∼ 2–2.2 (Zdziarski & Gierliński 2004). In the LHS, the X-ray emission is dominated instead by photons that Compton scatter in a hot coronal plasma, although a low-temperature disk component can still be detected (McClintock & Remillard 2006). In this state, BHXRB spectra consist of a cutoff power-law component with a typical photon index of 1.5 ≤ Γ ≤ 2.0 and an exponential cutoff at high (∼100 keV) energies as well as reflected emission from the corona off the disk (George & Fabian 1991; Done et al. 2007). BHXRBs can also be found in the steep power-law (SPL) state also known as the very high state, which generally occurs during the transition between hard and soft states. The SPL state is characterized by competing thermal and power-law components where the power-law component has a photon index of Γ > 2.4 (Remillard & McClintock 2006). The SPL state differs from the HSS by the amount of Comptonization of the disk spectrum where inverse Compton emission from hybrid (thermal and nonthermal) plasma is required to explain the spectra (Gierliński & Done 2003).
The Imaging X-ray Polarimetry Explorer (IXPE; Weisskopf et al. 2022) is a space-based observatory launched on 2021 December 9. IXPE has measured the linear polarization of the 2–8 keV X-rays from several BHXRBs, giving new insights into the configuration and properties of their emitting plasmas. The IXPE observations of the BHXRB Cyg X-1 in the LHS revealed a 4% polarization aligned with the black hole radio jet, supporting the hypothesis that the jet might be launched from the black hole inner X-ray emitting region (Krawczynski et al. 2022). These results also revealed that the hot coronal plasma is extended parallel to the accretion disk plane and is seen at a higher inclination than that of the binary. IXPE observed a high polarization degree (PD) of ∼20% perpendicular to radio ejections of the black hole candidate Cyg X-3 suggesting that the primary source is inherently highly luminous but obscured so that only the reflected emission can be observed (Veledina et al. 2023). The IXPE observations of the low-inclination high-mass BHXRB LMC X-1 in the HSS gave only an upper limit on the total PD of <2.2% (Podgorny et al. 2023) for a combination of two main spectral components: dominant thermal emission with a modest contribution of Comptonization.
Observations of the transient low-mass X-ray binary (LMXRB) 4U 1630–47 with the Uhuru satellite were first reported in Forman et al. (1976), Jones et al. (1976), describing four outbursts occurring every ∼600 days. The X-ray spectral and timing properties of the LMXRB during an outburst in 1984 suggest the compact object of 4U 1630–47 is a black hole (Parmar et al. 1986) albeit with unusual outburst behavior (Chatterjee et al. 2022) indicative of a more complex system. The source spectrum tends to show strong, blueshifted absorption lines corresponding to Fe xxv and Fe xxvi transitions during the soft accretion states (Pahari et al. 2018; Gatuzz et al. 2019). Previous measurements of the 4U 1630–47 dust-scattering halo were used to estimate a distance range of 4.7–11.5 kpc (Kalemci et al. 2018). From the detection of short-duration dips in its X-ray light curve during outburst, a relatively high inclination of 60°–75° has been inferred (Kuulkers et al. 1998). Various reflection spectral modeling efforts have consistently measured a high spin:  (King et al. 2014), a = 0.92 ± 0.04 (Pahari et al. 2018), and a ≳ 0.9 (Connors et al. 2021).
IXPE previously observed 4U 1630–47 in the HSS where the detected emission was primarily from the thermal accretion disk (Ratheesh et al. 2023, henceforth Paper I; and Kushwaha et al. 2023; Rawat et al. 2023). That observation revealed that the PD increased with energy from ∼6% at 2 keV to ∼10% at 8 keV. The high PD and its energy dependence cannot be explained in terms of a standard geometrically thin accretion disk with a highly or fully ionized accretion disk atmosphere (Chandrasekhar 1960; Sobolev 1949, 1963). While a standard thin disk viewed at inclinations ≳85° would produce a sufficiently high energy-integrated PD, relativistic effects would lead to a decrease of the PD with energy contrary to the observed increase. Such a high inclination would also lead to eclipsing of the source, which has not been detected. In Paper I, we argue that a geometrically thin disk with a partially ionized, outflowing emitting plasma can explain the observations. The absorption in the emitting plasma leads to escaping emission that is more likely to have scattered only once and ends up being highly polarized parallel to the disk surface (Loskutov & Sobolev 1979, 1981; Taverna et al. 2021). A vertically outflowing emitting plasma leads to increased emission angles in the local disk frame due to relativistic aberration resulting in a higher PD (e.g., Beloborodov 1998; Poutanen et al. 2023). Including absorption effects and the relativistic motion in the models achieves proper fits of the data for a thin accretion disk of a slowly spinning (a ≤ 0.5) black hole seen at inclination i ≈ 75° when the emitting plasma has an optical thickness of τ ∼ 7 and moves with a vertical velocity v ∼ 0.5 c.
In this letter, we report on the first measurement of the polarization properties of a BHXRB in the SPL state. The letter is organized as follows. We describe the IXPE, NICER, and NuSTAR observational results of 4U 1630–47 in Section 2 and present a comparison of the polarization of the source in the HSS and the SPL states. In Section 3, we examine our results in the context of previous IXPE X-ray polarization measurements of BHXRBs and discuss scenarios that could explain the observed polarization signature.
2. Data Sets, Analysis Methods, and Results
IXPE performed a target of opportunity observation of 4U 1630–47 between 2023 March 10 and 14 for ∼150 ks after daily monitoring of the source by the Gas Slit Camera on the Monitor of All-sky X-ray Image (MAXI; Matsuoka et al. 2009) reported a significant increase in flux, as shown in Figure 1(a). The MAXI flux was about 0.62 photons s−1 cm−2 during the gray highlighted region of the figure, which coincides with the Paper I observation—hereby referred to as the HSS data. The blue and green highlighted regions have a higher flux of approximately 2.24 and 2.77 photons s−1 cm−2, respectively, signaling a change in the emission state of the source. During these later time intervals, the 4–20 keV flux shown in purple in Figure 1(a) increases more drastically than the 2–4 keV flux shown in orange indicating an increase in the spectral hardness over this time. Figure 1(b) shows the IXPE, NICER (Gendreau et al. 2012), and NuSTAR (Harrison et al. 2013) 2–8, 0.2–12, and 3–78 keV count rates during these later intervals. We see the source flux increased dramatically around the time marked in the figure by the vertical dashed line: the IXPE, NICER, and NuSTAR count rates increased by ∼23%, ∼25%, and ∼63%, respectively. The blanket IXPE coverage reveals that this increase was very sudden (about ∼2.6 ks). Owing to the drastic change, we divided our IXPE, NICER, and NuSTAR observations into Period 1 (blue) to Period 2 (green) before and after 13:42:53 UTC on 2023 March 11. For a description of the IXPE, NICER, and NuSTAR data reduction, see Appendix A.
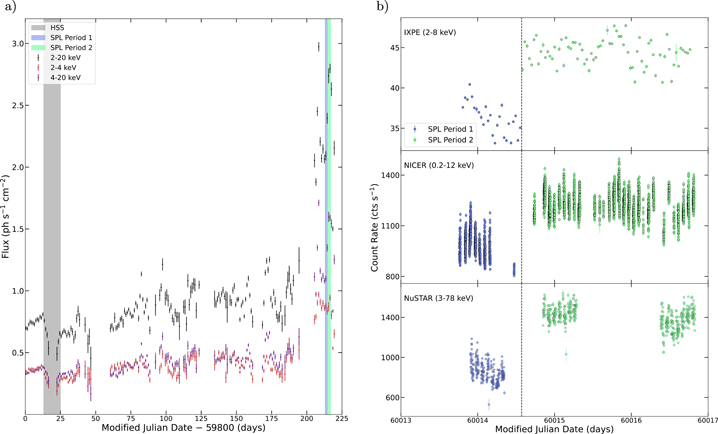
Figure 1. X-ray light curves of 4U 1630–47. (a) MAXI light curve between MJD 59800 (2022 August 9) and MJD 60025 (2023 March 22). The flux in the 2–20, 2–4, and 4–20 keV energy bands are reported in black, orange, and purple, respectively. The gray-shaded region corresponds to the observation reported in Paper I when the source was in the HSS while the regions shaded in blue (Period 1) and green (Period 2) correspond to the observation reported in this paper when the source was in the SPL state. (b) From top to bottom: IXPE, NICER, and NuSTAR light curves from 2023 March 10 to March 14. Observations of Periods 1 and 2 are shown by the blue and green data points, respectively, with a sudden flux increase at around MJD 60014.57 indicated by the vertical dashed line.
Download figure:
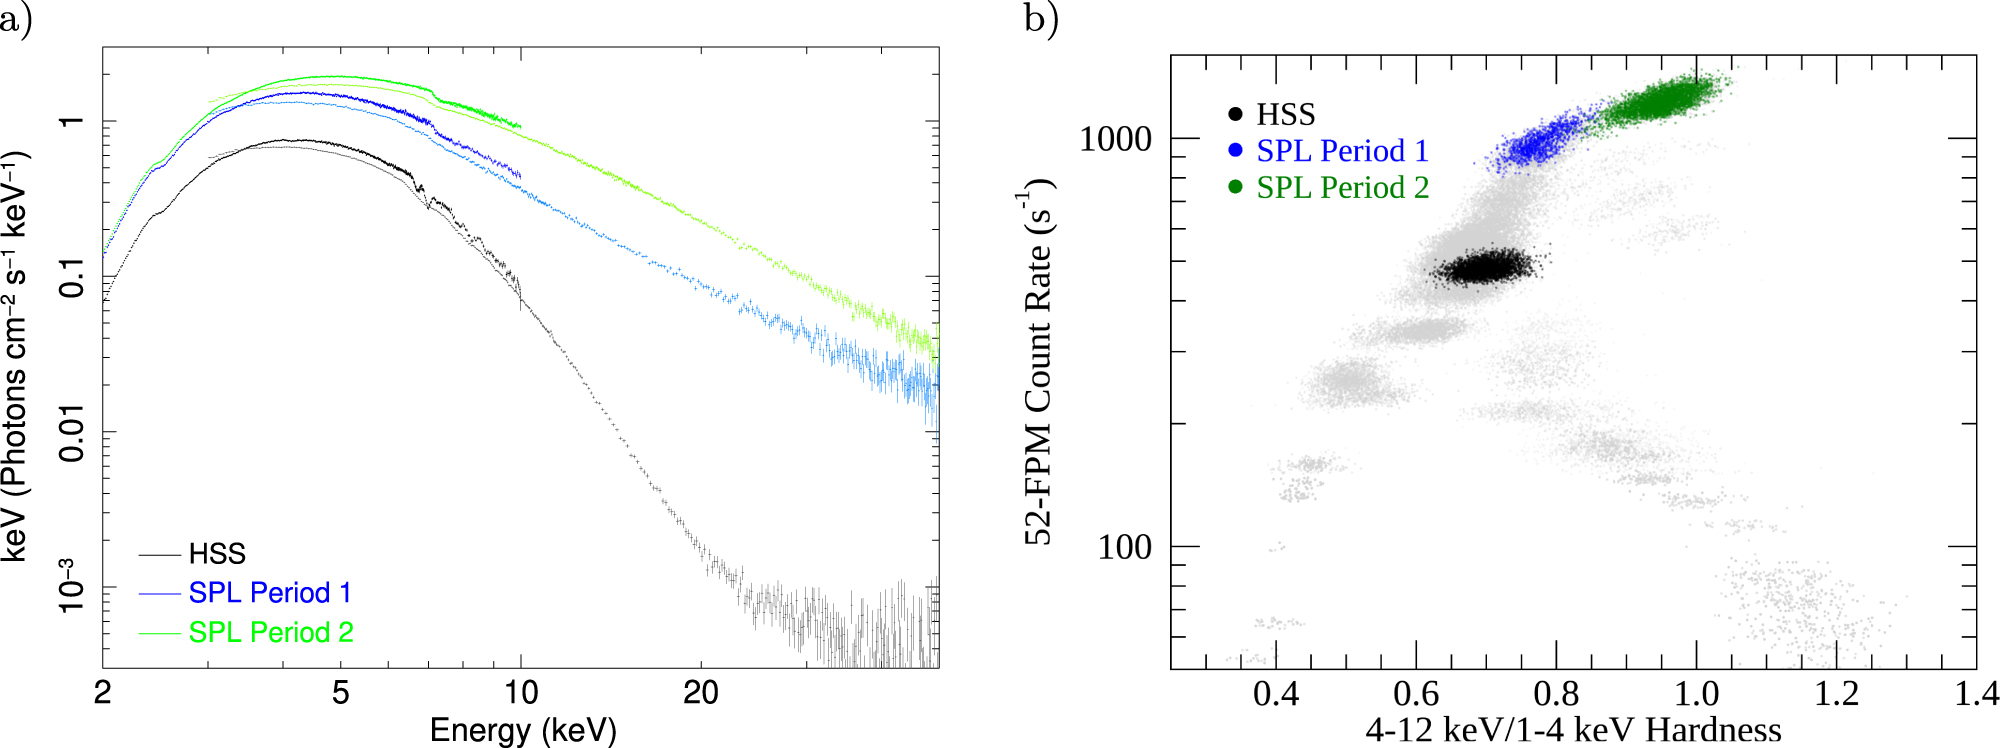
Standard image High-resolution imageA comparison of the NICER and NuSTAR spectra in Figure 2(a) for the HSS observation (black) and Periods 1 and 2 (blue and green) reveals that the source transitioned from the HSS to the SPL state. In Paper I, the power-law component of the spectra contributed ∼3% of the energy flux in the IXPE energy band. In contrast, our spectral fitting (see Appendix B) reveals that in Period 1 of the SPL state the power-law emission contributed ∼17%–46% of the 2–8 keV emission while in Period 2 this contribution increased to ∼40%–92%. The soft HSS spectra are almost completely thermal in the form of a multitemperature blackbody while the SPL spectra show an additional SPL component. From Figure 2(a), we can see the SPL state shows an increase in 2–50 keV flux and a change in the spectral shape at energies above 5 keV. Only the HSS spectra exhibit prominent blueshifted Fe xxv and Fe xxvi lines as previously seen in past outbursts and explained in terms of overionization of the wind (Díaz Trigo et al. 2014) or of an intrinsic change of the physical properties of the wind itself (Hori et al. 2014) in the SPL state. Figure 2(b) shows a hardness–intensity diagram (HID) of 4U 1630–47 NICER data including the HSS (black) and SPL (blue and green) observations contemporaneous with the IXPE measurements, and archival data. Period 2 exhibits the highest rate corresponding to the largest relative contribution of the power-law flux. The energy flux in the 1–12 keV band increases with hardness during the transition from the HSS to the SPL state saturating at ∼1500 s−1. Most astrophysical black hole candidates move through an HID counterclockwise during outbursts (see Figure 7 of Fender et al. 2004; and Figure 1 of Homan & Belloni 2005). However, Figure 2(b) shows 4U 1630–47 evolving in a clockwise direction near the apex of the HID consistent with previous Suzaku observations of the source in the SPL state (Hori et al. 2014). We note that the variable motion of the source along the HID (see Figure 11 of Tomsick et al. 2005) makes it unclear if the source transitions from the HSS to the LHS through a high-intensity SPL regime or if we caught the source in an unusual pattern of motion. Furthermore, Figure 2(b) shows no evident bright hard state, consistent with the results of Capitanio et al. (2015), which could indicate a deviation from the standard HID "Q" shape proposed in Fender et al. (2004). Alternatively, Tomsick et al. (2014) suggest that a low large-scale magnetic field in the disk could delay the transition to the LHS.
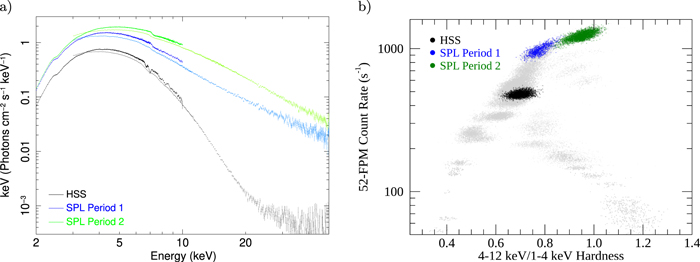
Figure 2. (a) NICER (2–10 keV) and NuSTAR (3–50 keV) spectra of the HSS (black) from Paper I and from the current SPL Period 1 (blue) and Period 2 observations (green). The spectra were unfolded using a unit constant model for both instruments. (b) Hardness–intensity diagram from NICER data of the HSS (black) and SPL state Period 1 (blue) and Period 2 (green), in 8 s intervals. Data from all previous NICER observations of 4U 1630–47 are shown in gray. Rates have been normalized as if all 52 of NICER's FPMs were pointing at the source.
Download figure:
Standard image High-resolution imageDuring the entire SPL state observation, IXPE measured an energy-averaged 2–8 keV linear PD of 6.8% ± 0.2% at a polarization angle (PA) 213 ± 09 (east of north) with a statistical confidence of over 30σ. The SPL state observation has a 1.5% smaller PD than the 8.32% ± 0.17% HSS PD reported in Paper I at a PA 35 higher with respect to the previously observed 178 ± 06. Figure 3 shows the time-averaged polarization signature during both states in 5 logarithmic energy bands. The PA is constant within <3σ during the HSS and SPL observations. The summary of measured PD and PA in different spectral states is given in Table 1. These values have been computed using the PCUBE algorithm of the ixpeobssim analysis software (Baldini et al. 2022). Figure 4 shows linear and constant fits of PD and PA, respectively, obtained using xspec (Arnaud 1996). The HSS and SPL state observations have a similar linear dependence of the PD on the photon energy E, with a linear model PD = p0 + α(E/1 keV). For the HSS, the reported values are p0 = 3.47% ± 0.54%, α = 1.12% ± 0.13% with the null hypothesis probability of 3.55 × 10⁻¹⁶ for a constant function. For the SPL state Period 1 observation, these parameters change to p0 = 2.7% ± 1.3%, α = 1.08% ± 0.32% with the null hypothesis probability of 1.42 × 10⁻² for a constant function. For the SPL state Period 2 observation, these parameters are p0 = 2.44% ± 0.70%, α = 0.88% ± 0.16% with the null hypothesis probability of 4.56 × 10⁻⁷ for a constant function. Both the HSS and SPL Period 1 and Period 2 observations show relatively energy-independent PA in the IXPE band, with the fitted value of PA being 180 ± 05, 214 ± 18, and 215 ± 09 with the null hypothesis probability of 0.607, 0.854, and 0.877, respectively.
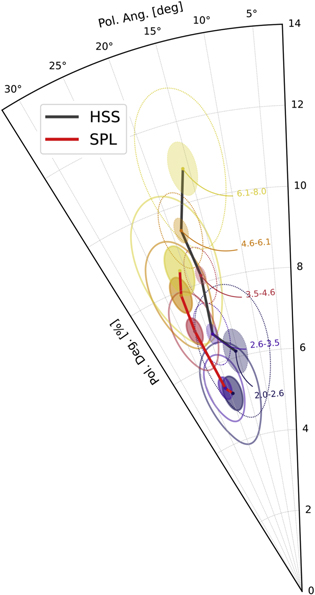
Figure 3. Measured PD and PA of 4U 1630–47 in 5 logarithmic energy bins: 2.0–2.6, 2.6–3.5, 3.5–4.6, 4.6–6.1, and 6.1–8.0 keV. The black line and transparent contours show the polarization in the HSS reported in Paper I. The red solid line and solid contours show the polarization in the SPL state (this paper). The shaded and unshaded ellipses show their 68.3% and 99.7% confidence regions, respectively. Errors on PD and PA computed by ixpeobssim are derived from the Q and U Gaussian errors according to the formalism developed by Kislat et al. (2015).
Download figure:
Standard image High-resolution image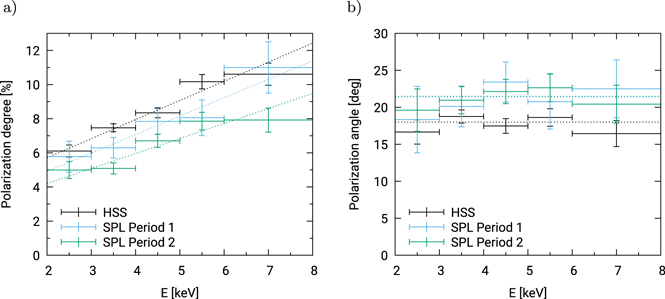
Figure 4. (a) PD and (b) PA as a function of energy in the IXPE 2–8 keV energy range. Comparison of the 4U 1630–47 polarization properties in the HSS (black), reported in Paper I, and in the SPL Period 1 (blue) and Period 2 (green) discussed in this paper. Linear fits for PD and constant fit for PA are also shown in dotted lines (see the text for the fit details).
Download figure:
Standard image High-resolution imageTable 1. Polarization Properties in Different Spectral States of 4U 1630–47
| Spectral State | Polarization Degree | Polarization Angle | Thermal Contribution | Power-law Contribution | ||
|---|---|---|---|---|---|---|
| (%) | (deg) | Fit 1 | Fit 2 | Fit 1 | Fit 2 | |
| HSS | 8.32 ± 0.17 | 17.8 ± 0.6 | 0.97 | 0.03 | ||
| SPL Period 1 | 7.55 ± 0.44 | 21.7 ± 1.7 | 0.54 | 0.83 | 0.46 | 0.17 |
| SPL Period 2 | 6.52 ± 0.24 | 21.3 ± 1.1 | 0.08 | 0.60 | 0.92 | 0.40 |
| SPL Total | 6.75 ± 0.21 | 21.3 ± 0.9 | ⋯ | ⋯ | ||
Note. The estimated fractions of the thermal and power-law flux contributing to the 2–8 keV energy band are also given. Flux contributions are parameter-dependent. See Appendix B for more details on the model used. Contributions are calculated using either disk blackbody seed radiation (Fit 1) or blackbody seed radiation (Fit 2) for the power-law component of the spectra in the SPL Period 1 and 2 cases.
Download table as: ASCIITypeset image
To study the polarization properties of the power-law component, we performed a polarimetric fit of the data starting from the spectral analysis described in Appendix B. We included the IXPE Q and U spectra in the spectral fit and convolved the thermal and power-law spectral components with two pollin models.
56
This allowed us to attribute polarization to each component separately assuming that the PD depends linearly on the photon energy E: PD = p0 + α(E/1 keV). In Paper I, we found that the only spectral component contributing significantly to the HSS emission is the thermal one. We assumed that the polarization of this thermal component remains constant between the HSS and SPL states requiring that  , and αThermal = 1.12% as per the HSS fit shown in Figure 4(a). Due to the relatively constant PA during the HSS, SPL Period 1, and SPL Period 2 observations (Figure 4(b), we further assumed that the thermal and nonthermal components have equal PA and allowed it to vary between SPL periods. Additionally, the PA appears to be energy-independent, so our fits take the PA to be constant with energy: PA = ψ. As shown in Table 1, the estimates of the power-law component flux contribution depend on the model parameters used and will therefore also affect the estimate of the polarization properties of the power-law component. Figure 5 summarizes the results of our linear fits for the nonthermal component PD resulting from Fits 1 and 2 as well as the assumed thermal component PD for comparison. For Fit 1, we assumed a multicolor blackbody as the Comptonized component input radiation (Figure 6(a). For the PD of the power-law component, we found that αFit1 = 1.05% ± 0.45%, and we set an upper limit on
  of 2.7%. The
  upper limit tells us that the Comptonization component could be unpolarized at 0 keV, but this is just an extrapolation—the power-law PD in the 2–8 keV energy range (Figure 5) shows that the component is polarized. The computed PAs for Period 1 and Period 2 are ψFit1–P1 = 210 ± 34, and ψFit1–P2 = 217 ± 22. For Fit 2 (Figure 6(b)), we assume a simple blackbody as a seed for the power-law radiation. In this case, the thermal emission is the main source of flux in the 2–8 keV energy range for both Periods 1 and 2. The PD of the power-law component can be fitted with αFit2 = 0.96% ± 0.26%, and we were only able to set an upper limit on
  of 1.3%. The corresponding PAs for Period 1 and Period 2 are ψFit2−−P1 = 210 ± 35, and ψFit2–P2 = 217 ± 21. We also calculated the 2–8 keV average PD of the power-law component from the IXPE I, Q, and U fluxes. For Fit 1, we get 7.0% ± 3.2% and 6.8% ± 2.6% in Periods 1 and 2, respectively. For Fit 2, we get 6.8% ± 3.9% and 7.0% ± 2.2% in Periods 1 and 2, respectively.
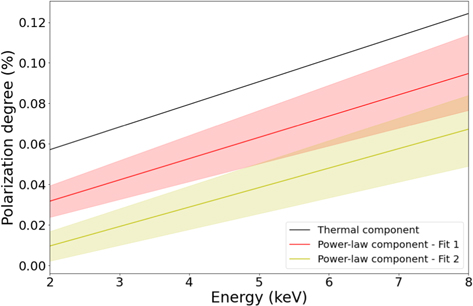
Figure 5. Best linear fits with respect to energy of thermal component (black), power-law component for Fit 1 (red), and power-law component for Fit 2 (yellow). The shaded regions show the 1σ confidence intervals.
Download figure:
Standard image High-resolution image3. Discussion
IXPE observed 4U 1630–47 in the HSS (Paper I) and in the SPL state (this paper). We find that the HSS and SPL exhibit surprisingly similar polarization properties despite their very different energy spectra. Although the PD of the HSS (increasing from 6% to 10% between 2 and 8 keV) exceeded that of the SPL observations (increasing from 5% to 8% between 2 and 8 keV), and Figure 4(a) shows that the PD of Period 2 decreases with respect to Period 1, we note that the PD varied as much during the HSS observations (Figure M 3 of Paper I) as it did between the HSS and the SPL observations. The change in polarization direction ∼35 is not statistically significant (<3σ). While the HSS spectrum was dominated by the thermal component, our spectral analysis shows that the Comptonization component increased by a large factor between the HSS, Period 1 of the SPL state, and Period 2 of the SPL state, although its exact flux contribution is model parameter-dependent. Since the PA stays almost the same with vastly different flux contributions of the power-law component, this component has to be polarized in a similar direction as the thermal component. Our polarimetric analysis reveals that the power-law component has an energy-integrated PD of 6.8%–7.0% in both cases analyzed, i.e., using either multicolor disk blackbody or single temperature blackbody as seed photons for Comptonization. Since both cases suggest substantially different contributions of this component to the total flux, we consider this estimate to be quite independent of the model assumptions. Note that the dominating thermal component in HSS had a PD of 8.3%; thus the Comptonized component is slightly less polarized than the thermal one by approximately 1.3%–1.5%.
This congruence of the PD and directions is puzzling if the emission comes from spatially distinct regions and is produced by different physical emission mechanisms. Direct thermal emission from the disk tends to be polarized parallel to the accretion disk except for close to the innermost stable circular orbit where strong gravitational effects rotate the PA by about 10°(Connors & Stark 1977; Loktev et al. 2022). Gravitationally lensed photons that scatter off the disk (known as returning radiation) are polarized perpendicular to the direct thermal radiation (Schnittman & Krolik 2009). Comptonization, commonly invoked to explain the power-law component, gives rise to a polarization perpendicular to the spatial extent of the Comptonizing plasma (Poutanen & Svensson 1996; Schnittman & Krolik 2010; Krawczynski & Beheshtipour 2022). The apparent alignment of the polarization directions of the thermal and power-law emission could imply that the Comptonizing plasma of the SPL state is extended perpendicular to the accretion disk—contrary to what we inferred for the hard state of Cyg X-1 (Krawczynski et al. 2022). However, it is worth noting that, for a slab corona geometry, polarization is parallel to the disk at photon energies where the first Compton scattering dominates the flux (Poutanen et al. 2023).
Based on the IXPE results, we posit that the HSS and SPL states could exhibit similar disk geometries and involve similar emission processes. In the scenario discussed in Paper I, an outflowing, partially ionized accretion disk atmosphere produces the observed high PD as a result of Thomson scattering. The electrons in the outflow attain Compton temperature (a few keV) if efficient heating and acceleration mechanisms, such as shocks, magnetic reconnection, and turbulence, do not operate. An instantaneous increase of electron heating and acceleration may lead to a change in the effect of the scattering on the photon energies, from predominantly elastic scatterings in which the energies of the photons stay roughly constant, to inverse Compton scatterings in which the photons gain energy in the plasma frame. During the transitions between the soft and hard states, the observed spectra are known to be well fitted with Comptonization from low-temperature thermal or hybrid (thermal and nonthermal) electrons (Gierliński et al. 1999; Zdziarski et al. 2001; Życki et al. 2001), with a typical temperature of the Maxwellian part ∼10 keV. Increased electron temperature, in general, causes the reduction of the PD (e.g., Figure 2 of Poutanen 1994); however, for these low electron temperatures, the effect is rather small, and the polarization signatures remain similar to (albeit not exactly the same as in) the Thomson-scattering case. The observed variations of the PD during the HSS and SPL states could result from changes in the scattered fraction and/or the outflow velocities.
As described in Paper I, our standard thin disk models failed to account for the high PD and the rise of the polarization degree with energy for all values of the assumed black hole spin and observer inclination. We used kerrC (Krawczynski & Beheshtipour 2022) to refit the energy spectra of the SPL state. Increasing the vertical optical depth of the coronal gas between the accretion disk and the upper end of the corona from 0.000 (HSS) to between 0.039 (SPL Period 1) and 0.063 (SPL Period 2) generates power-law components similar to the observed one. However, the added coronal optical depth has little impact on the predicted PDs. The PD of our best-fit model decreases from 3% at 2 keV to <1% at 8 keV. We thus confirm the findings from Paper I that standard models fail to explain the high PD of 4U 1630–47.
As mentioned in Paper I and in West & Krawczynski (2023), nonvanishing accretion disk geometrical thicknesses may play a role in explaining the high polarization fractions of the source. Spectral fitting indicates that the disk temperature kTbb increased between the HSS (in Paper I) and the SPL state. This increase in temperature is expected if a thicker accretion disk is present in the SPL state (Tomsick et al. 2005). As higher energy photons originate closer to the black hole and are more likely to scatter, this scenario naturally explains PD increasing with photon energy. In contrast, the reflection off distant features (e.g., off a wind) would give rise to rather energy-independent PD. The similar polarization properties of the emission from both states confirm our conclusion from Paper I that scattering off the wind is most likely not the dominant mechanism explaining the high polarization of the X-ray emission.
On the other hand, we note that spectral timing studies of black hole LMXRBs suggest that their coronae contract in the hard state and then expand during the hard-to-soft state transition (Wang et al. 2022). The soft reverberation lag modeling employing a lamppost corona estimates that the corona height increases by an order of magnitude during the state transition (Wang et al. 2021). If this increase in height were to be accompanied by a decrease in width, we could expect a change in the shape of the corona from laterally extended in the LHS to vertically extended—and hence giving rise to large reverberation lags—in the intermediate states. Our polarization results could then be explained by a cone or lamppost-shaped corona in the SPL state. We note, however, that De Marco et al. (2021) explain these reverberation lags in terms of a decrease in the disk truncation radius during transitions into and in the hard state in line with a steady increase in the inner disk temperature.
Alternative scenarios propose that the power-law component could originate as synchrotron emission from a jet perpendicular to the accretion disk threaded by a magnetic field aligned with the jet (Markoff et al. 2001). However, the resulting synchrotron emission does not reproduce the sharp energy cutoff seen in the power-law component of the spectra during harder states (Zdziarski et al. 2003). Hankla et al. (2022) suggest that synchrotron emission from nonthermal electrons accelerated in the plunging region, gyrating in a magnetic field perpendicular to the accretion disk, could reproduce a power-law component. We note that this model would require the power-law contribution to the total spectra to be ∼2 orders of magnitude lower than the thermal component contribution, which does not apply to the SPL state data.
Acknowledgments
The Imaging X-ray Polarimetry Explorer (IXPE) is a joint US and Italian mission. The US contribution is supported by the National Aeronautics and Space Administration (NASA) and led and managed by its Marshall Space Flight Center (MSFC), with industry partner Ball Aerospace (contract NNM15AA18C). The Italian contribution is supported by the Italian Space Agency (Agenzia Spaziale Italiana, ASI) through contract ASI-OHBI-2022-13-I.0, agreements ASI-INAF-2022-19-HH.0 and ASI-INFN-2017.13-H0, and its Space Science Data Center (SSDC) with agreements ASI-INAF-2022-14-HH.0 and ASI-INFN 2021-43-HH.0, and by the Istituto Nazionale di Astrofisica (INAF) and the Istituto Nazionale di Fisica Nucleare (INFN) in Italy. This research used data and software products or online services provided by the IXPE Team (MSFC, SSDC, INAF, and INFN) and distributed with additional software tools by the High-Energy Astrophysics Science Archive Research Center (HEASARC), at NASA Goddard Space Flight Center (GSFC). N.R.C. and H.K. acknowledge NASA support through the grants NNX16AC42G, 80NSSC20K0329, 80NSSC20K0540, NAS8-03060, 80NSSC21K1817, 80NSSC22K1291, and 80NSSC22K1883 as well as support from the McDonnell Center for the Space Sciences. M.D., J.S., V.K., and J.P. acknowledge the support from the Czech Science Foundation project GACR 21-06825X and the institutional support from the Astronomical Institute of the Czech Academy of Sciences RVO:67985815. A.I. acknowledges support from the Royal Society. M.N. acknowledges the support by NASA under award number 80GSFC21M0002. P.O.P. acknowledges financial support from the French High Energy Programme (PNHE) of the CNRS as well as from the French Space Agency (CNES).
Appendix A: Data Reduction
IXPE (Weisskopf et al. 2022) observed 4U 1630–47 for ∼141 ks between 2023 March 10 19:21:04 UTC and 2023 March 13 19:02:48 UTC under observation ID 02250601. The IXPE processed level-2 data were obtained from the HEASARC archive. The data are publically available from the website https://heasarc.gsfc.nasa.gov/docs/ixpe/archive/. The analysis of the IXPE data was performed using the ixpeobssim software version 28.4.0 (Baldini et al. 2022) based on the level-2 processed data. The source region was chosen in SAOImage DS9 software (Joye & Mandel 2003) as a circular area with a 60'' radius centered at (16h34m03 3, −47°23'16
 8). We did not extract the background due to possible contamination of source photons (Di Marco et al. 2023). The PD and PA were computed using the PCUBE algorithm incorporated in ixpeobssim to calculate the polarization signature of the observation independent of a model. Version 11 of the IXPE response functions was used to process the data.
NICER (Gendreau et al. 2012) is a soft X-ray spectral-timing instrument covering the 0.2–12 keV energy band. NICER observed the source from 2023 March 10 18:09:24 UTC to March 13 19:35:58 UTC under observation IDs 6557010XXX (101,102,201,202,301,302) for a total of ∼32.81 ks of useful time among the 6 observations. The data were reduced using nicerdas v10 software and the xti20221001 release of NICER CALDB products. The SCORPEON background model was adopted. Observations were filtered for hot detectors, corrected for detector deadtime, and screened to remove candidate good-time intervals with substantially elevated background or candidate intervals less than 100 s long. In the paper, we show the NICER spectra combined according to Period 1 or Period 2 of the IXPE observation. We have used addspec tool from the heasoft package (Nasa High Energy Astrophysics Science Archive Research Center (Heasarc) 2014) for this purpose.
The NuSTAR (Harrison et al. 2013) spacecraft observed the source under observation IDs 8090231300#(2,4,6) and collected a total of ∼28.35 ks of net exposure. The data were processed with the NuSTARDAS software (version 2.1.2) of the heasoft package (version 6.31.1). The source events were selected with a circular region of 60'' radii centered at the source coordinates (16h34m016101, −47°23'34806) for both focal plane modules (FPMA/FPMB). The background region was selected as a circular region with a radius ∼916 centered at (16h34m466422, −47°24'03752). The first observation was taken during the Period 1 with lower flux, while the other two observations correspond to the Period 2. We compared the spectra and combined the second or third spectra for each FPM using addspec from ftool to have one representative spectra per FPM for the Period 2.
Appendix B: Spectral Fit
In order to study the polarization properties of the thermal and Comptonized component, we performed a joint fit on the NICER and NuSTAR spectra of the SPL state observation. Since our aim here is only to give an estimate of the polarization degree and angle of the two spectral components, we performed our analysis on the two instruments' time-averaged spectra, subdivided into two groups each, corresponding to Periods 1 and 2 of the SPL state IXPE observation. Moreover, to further simplify our approach, we restricted our study to the 2–10 keV energy range for NICER data and to the 8–70 keV range for NuSTAR ones in order to reduce cross-calibration uncertainties between the two instruments. The choice to analyze NuSTAR data starting from 8 keV, in particular, belongs to the large inconsistencies between the NICER and NuSTAR data below this energy—although some cross-calibration residuals can still be observed in the 8–9 keV range. We used the NuSTAR spectra up to 70 keV since above that the background was comparable to the data. A complete, time-resolved spectral analysis, as well as the study of the low energy inconsistencies between NICER and NuSTAR data, is beyond the scope of this paper and will be addressed in a future publication. We used the xspec package (v12.13.0c) and employed the following model in the analysis:

The model comprises of thermal thin accretion disk emission accounting for relativistic effects (kerrbb, Li et al. 2005), thermally Comptonized continuum emission (nthcomp, Zdziarski et al. 1996; Życki et al. 1999), and absorption by the interstellar medium (tbabs, Wilms et al. 2000). Following the approach from Paper I, we fixed the distance of the source in the kerrbb model to the value of D = 11.5 kpc; moreover, we kept the system inclination fixed at the value of i = 75°, leaving only the black hole spin, mass, and accretion rate free to vary in the fitting procedure. A cloudy (Ferland et al. 2017) absorption table was used in Paper I to model the absorption lines detected in the observation of the source in HSS, likely produced by a highly ionized outflowing plasma (i.e., with ionization parameter ξ ≈ 105 and hydrogen column density NH
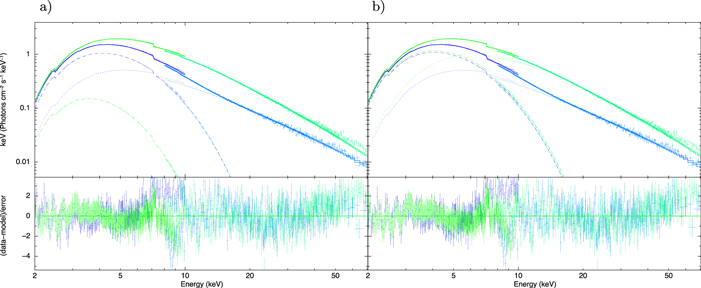
≈ 1024 cm−2). If we use the cloudy component and assume the same ionization parameter of the HSS observation, it is possible to obtain an upper limit of NH ≤ 1022 cm−2 on the wind column density along the line of sight. However, if the ionization parameter is allowed to vary freely, it is usually fitted to unrealistically high values. Additionally, the SPL state observation shows no prominent absorption lines, so this component was no longer used in the fitting procedure. We used the nthcomp component assuming either disk blackbody or blackbody seed radiation. For Fit 1, we assumed multicolor disk blackbody seed radiation (inp_type parameter = 1) and fixed its temperature to the values obtained from initial modeling using diskbb ( keV in Period 1 and 2, respectively). For Fit 2, we used a single blackbody as the input radiation (inp_type parameter = 0) and instead left the temperature free to vary in the fitting procedure. The nthcomp input radiation modified the fluxes contributions, as presented in Table 1, and consequently the polarization properties of the power-law component. This is due to the different low energy contributions of nthcomp when using a multicolor blackbody in place of a single blackbody, which influences the kerrbb accretion rate in the fitting procedure and consequently the thermal radiation contribution to the total flux. Figure 6 shows the unfolded spectra and data residuals for both fits. Note that, while both fits show similar trends in the residuals, in Period 2 (green), the kerrbb contribution to the total flux in Fit 2 is significantly larger than in Fit 1 as denoted by the dashed lines.
Figure 6. Fits of 4U 1630–47 NICER and NuSTAR X-ray spectra for Period 1 (blue) and Period 2 (green): (a) Disk blackbody assumed as seed radiation for the power-law component (Fit 1). (b) Single temperature blackbody assumed as seed radiation for the power-law component (Fit 2). Unfolded spectra around the best-fitting model in FE representation, the total model (solid), the kerrbb contribution (dashed), and nthcomp (dotted) contribution for each data set are shown in the top panels while the data-model residuals in σ are shown in the bottom panels.
Download figure:
Standard image High-resolution image
Additionally, following Paper I, an empirical absorption edge model was used at 2.42 and 9.51 keV to account for reported instrumental features in the NICER and NuSTAR spectra, respectively (Wang et al. 2021; Podgorny et al. 2023). While both edge models are used for both NICER and NuSTAR data, the selected energy ranges mean that the first edge only effectively applies to the NICER data while the higher edge is relevant for modeling NuSTAR data (due to being close to the end of the NICER data energy range). The cross-calibration model MBPO employed in Krawczynski et al. (2022) was used to account for cross-calibration uncertainties between NICER and NuSTAR allowing the spectral slope and normalization to vary. For the NuSTAR focal plane module A (FPMA), we fixed the normalization to 1 for all fitting groups, corresponding to the recommended value in Madsen et al. (2022) and kept the slope fixed to zero. Table 2 shows the best-fitting parameters of the combined NICER and NuSTAR spectral fit. It is worth noting that in our simplified approach the data are consistently above the model in the high energy tail of the spectra (45–70 keV) with both models further motivating the need for a more detailed analysis of the spectral properties of this source.
Table 2. NICER and NuSTAR Spectral Fit Parameters
| Component | Parameter (unit) | Description | Value Fit 1 | Value Fit 2 | ||
|---|---|---|---|---|---|---|
| SPL Period 1 | SPL Period 2 | SPL Period 1 | SPL Period 2 | |||
| tbabs | NH (1022 cm−2) | Hydrogen column density |

|

|

|

|
| kerrbb | a | black hole spin |

| ⋯ |

| ⋯ |
| i (deg) | Inclination | 75.00 (frozen) | ⋯ | ⋯ | ⋯ | |
| Mbh (M⊙) | black hole mass |

| ⋯ |

| ⋯ | |
| Mdd (1018 g s−1) | Effective mass accretion rate |

|

|

|

| |
| D (kpc) | Distance | 11.5 (frozen) | ⋯ | ⋯ | ⋯ | |
| hd | Hardening factor | 1.7 (frozen) | ⋯ | ⋯ | ⋯ | |
| rflag | Self-irradiation | Yes | ⋯ | ⋯ | ⋯ | |
| lflag | Limb-darkening | No | ⋯ | ⋯ | ⋯ | |
| norm | Normalization | 1.0 (frozen) | ⋯ | ⋯ | ⋯ | |
| nthcomp | inp_type | Seed photon shape | Disk blackbody | Blackbody | ||
| Γ | Photon index |

|

|

|

| |
| kTe (keV) | Electron temperature | 500.00 (frozen) | ⋯ | ⋯ | ⋯ | |
| kTbb (keV) | Seed photon temperature |

|

|

|

| |
| norm | Normalization |

|

|

|

| |
| edge 1 | edgeE (keV) | Threshold energy |

| ⋯ | ⋯ | ⋯ |
| MaxTau (10−2) | Absorption depth at threshold energy |

| ⋯ | ⋯ | ⋯ | |
| edge 2 | edgeE (keV) | Threshold energy |

| ⋯ | ⋯ | ⋯ |
| MaxTau (10−2) | Absorption depth at threshold energy |

| ⋯ | ⋯ | ⋯ | |
| mbpo | NNICER | Normalization | 1.035 ± 0.002 | ⋯ | ⋯ | ⋯ |
| NFPMB | Normalization | 0.994 ± 0.001 | ⋯ | ⋯ | ⋯ | |
| ΓNICER | Power-law index | 0.0664 ± 0.0033 | ⋯ | ⋯ | ⋯ | |
| ΓFPMB | Power-law index | 0.0095 ± 0.002 | ⋯ | ⋯ | ⋯ | |
| χ2/d. o. f | 2502.68/2399 | 2470.75/2399 | ||||
Note. Best-fitting parameters for joint NICER and NuSTAR spectral fitting for SPL Period 1 and SPL Period 2. We assume a zero-torque inner boundary condition. Uncertainties are stated at the 90% confidence level.
Download table as: ASCIITypeset image
As a following step, we included IXPE spectra in the fitting procedure, dividing them into two groups corresponding to the periods of the SPL state observation. We allowed all the parameters of the MBPO model to vary independently for each of the three IXPE detector units in both periods as shown in Table 3. The reduced χ2 is greater than 1 even accounting for 1% systematic uncertainties for the NICER data sets, within the mission's recommendations. 57 This result is likely due to our simplified approach of performing a time-averaged analysis on a highly variable source.
Table 3. IXPE MBPO Cross-calibration Parameters
| Detector | Parameter (unit) | Description | Value Fit 1 | Value Fit 2 | ||
|---|---|---|---|---|---|---|
| SPL Period 1 | SPL Period 2 | SPL Period 1 | SPL Period 2 | |||
| 1 | N | Normalization | 0.7361 ± 0.0046 | 0.7204 ± 0.0042 | 0.8437 ± 0.0119 | 0.8335 ± 0.0081 |
| Ebr (kev) | Energy breaking point | 4.43 ± 0.38 | 5.47 ± 0.25 | 4.23 ± 0.41 | 5.48 ± 0.23 | |
| Γ1 | Power-law index | 0.118 ± 0.033 | 0.013 ± 0.011 | 0.129 ± 0.042 | 0.029 ± 0.021 | |
| Γ2 | Power-law index | 0.27 ± 0.11 | 0.59 ± 0.15 | −0.23 ± 0.09 | −0.59 ± 0.14 | |
| 2 | N | Normalization | 0.7036 ± 0.0054 | 0.7184 ± 0.0033 | 0.8073 ± 0.0121 | 0.8284 ± 0.0096 |
| Ebr (kev) | Energy breaking point | 4.79 ± 0.45 | 4.64 ± 0.20 | 4.65 ± 0.44 | 4.72 ± 0.18 | |
| Γ1 | Power-law index | 0.073 ± 0.032 | 0.075 ± 0.018 | 0.079 ± 0.034 | 0.085 ± 0.021 | |
| Γ2 | Power-law index | 0.41 ± 0.19 | 0.416 ± 0.063 | −0.35 ± 0.16 | −0.43 ± 0.07 | |
| 3 | N | Normalization | 0.6786 ± 0.0049 | 0.6843 ± 0.0029 | 0.7778 ± 0.0084 | 0.7906 ± 0.0079 |
| Ebr (kev) | Energy breaking point | 5.46 ± 0.34 | 5.00 ± 0.26 | 5.63 ± 0.38 | 5.06 ± 0.21 | |
| Γ1 | Power-law index | 0.099 ± 0.019 | 0.076 ± 0.016 | 0.101 ± 0.025 | 0.089 ± 0.023 | |
| Γ2 | Power-law index | 0.77 ± 0.31 | 0.458 ± 0.097 | −0.73 ± 0.31 | −0.48 ± 0.09 | |
| χ2/d. o. f | 3693.90/3293 | 3693.29/3293 | ||||
Note. Best-fitting MBPO cross-calibration parameters for IXPE spectra corresponding to SPL Periods 1 and 2 for both disk blackbody (Fit 1) and blackbody (Fit 2) seed photons. Uncertainties are stated at the 90% confidence level.
Download table as: ASCIITypeset image
Footnotes
- 56
For a description of the linearly dependent polarization model, see https://heasarc.gsfc.nasa.gov/xanadu/xspec/manual/node213.html. Note that these equations have been modified to the form described in the text.
- 57
NICER calibration recommendations can be found at https://heasarc.gsfc.nasa.gov/docs/nicer/analysis_threads/cal-recommend/.