


Abstract
The J = 2 → 1 transition of CO near 230 GHz and the J = 3 → 2 line of HCN at 265 GHz have been imaged in the envelope of the red hypergiant star, VY Canis Majoris (VY CMa), using the Atacama Large Millimeter Array (ALMA) with angular resolutions 0 2–15; single-dish data were added to provide sensitivity up to 30''. These images reveal a far more complex envelope, with previously unseen outflows extending 4''–9'' from the star. These new structures include an arc-like outflow with an angular separation of ∼9'' northeast from the stellar position ("NE Arc"), twin fingerlike features approximately 4'' to the north/northeast ("NE Extension"), and a roughly spherical region observed ∼7'' E of the star ("E Bubble"). The NE Arc appears to be decelerating from base (VLSR ∼ 7 km s−1) to tip (VLSR ∼ 18 km s−1), while the NE Extension is blueshifted with VLSR ∼ −7 km s−1. Among the new features, HCN is only detected in the NE Arc. In addition, known structures Arc 1, Arc 2, and NW Arc, as well as other features closer to the star, are closely replicated in CO, suggesting that the gas and dust are well mixed. The CO spectra are consistent with the kinematic picture of VY CMa derived from HST data. Arc 2, however, has added complexity. Preliminary results from CO suggest 12C/13C ∼ 22–38 across the envelope. The additional presence of at least three major episodic mass ejection events significantly broadens the current perspective of the envelope structure and mass-loss history of VY CMa.
Export citation and abstract BibTeX RIS

Original content from this work may be used under the terms of the Creative Commons Attribution 4.0 licence. Any further distribution of this work must maintain attribution to the author(s) and the title of the work, journal citation and DOI.
1. Introduction
Evolved stars with initial masses between 9 and 40 M⊙ are considered to end their lives as Type II-P or Type II-L supernovae (SNe) on the red supergiant (RSG) track. However, 20 yr of observations have shown a lack of RSGs above 18 solar masses among SNe progenitors (Smartt et al. 2009; Smartt 2015), which suggest a different outcome for these stars. With their enhanced mass loss, such RSGs could collapse directly to black holes or evolve back to warmer temperatures. With its uniquely explored history of high mass-loss events, the red hypergiant VY Canis Majoris (VY CMa) is the ideal candidate for understanding this puzzle.
VY CMa is one of the most massive (∼40 M⊙) and most luminous (5 × 10⁵ L ⊙) RSGs known with a variable mass-loss rate of ∼ 2–4 × 10⁻⁴ M⊙ yr −1 (Shenoy et al. 2016; Dinh-V-Trung et al. 2022). Mass-loss events occurring over the course of several hundred years (e.g., Humphreys et al. 2007, 2021) have created an irregular circumstellar envelope consisting of numerous clumps, knots, arcs, and filaments (e.g., Monnier et al. 1999; Smith et al. 2001; Humphreys et al. 2005,2007, 2021). Recent Hubble Space Telescope (HST) observations probed scattered light from dust and KI emission (e.g., Humphreys et al. 2007, 2019, 2021). Doppler shifts of KI lines and proper motions of the dust knots were critical in assigning velocities to the structures and demonstrated that the various winds in VY CMa are spatially and kinematically distinct, tracing a complex mass-loss history.
The envelope of VY CMa has also been explored at millimeter/submillimeter wavelengths. A 1 mm spectral survey (214–285 GHz) of VY CMa was conducted using the Submillimeter Telescope (SMT) of Arizona Radio Observatory (ARO) by Tenenbaum et al. (2010). This and other studies revealed a rich chemical inventory in the envelope, with exotic molecules TiO, VO, and AlOH (e.g., Tenenbaum & Ziurys 2010; Kamiński et al. 2013b). Atacama Large Millimeter Array (ALMA) observations at an angular resolution of 01–02 revealed clumpy structures in TiO2 and NaCl in the inner wind close to the dust formation zone and emission ∼ 220 R* from the star, in the "SW clump" (De Beck et al. 2015; Decin et al. 2016). Images of continuum emission at Band 6 and Band 7 (O'Gorman et al. 2015; Kamiński 2019) show five dusty clumps forming an elongated structure near the star, including bright "Clump C" (Richards et al. 2014). More recently, Quintana-Lacaci et al. (2023) imaged lines of SiO, H2S, SO, and NaCl with 0025 resolution, showing collimated ejecta in different directions disrupting a slower wind, as suggested by Ziurys et al. (2007).
Single-dish observations of CO, on the other hand, suggested that the outflows in VY CMa extend to much larger spatial scales ∼12'' in extent (Ziurys et al. 2007). Furthermore, molecular images of VY CMa, made with the Submillimeter Array (SMA) showed emission extending well beyond 2'' but resolved out about half the flux on larger scales (Kamiński et al. 2013a). The 37 μm image of Shenoy et al. (2016) also revealed a larger envelope size of ∼15''.
To further investigate the extent of the envelope, ALMA has been used to image VY CMa in 1 mm molecular emission with resolutions between 02 and 15. Combined with previous single-dish spectra, the images are sensitive to scales as large as ∼30''. For the first time, the complete envelope of VY CMa has been revealed. New winds have been discovered in CO that extend northeast and east of the star as far as ∼9'', increasing the extent imaged in detail by a factor of ∼2. In the Letter, we present these new, comprehensive images of VY CMa in CO and HCN.
2. Observations and Data Reduction
VY CMa was observed using ALMA at Band 6 for the project 2021.1.01054.S between 2021 December and 2022 June. A total of 43 12 m antennas were used, covering frequencies 216–270 GHz in two array configurations, yielding high- and low-angular resolutions around 02 and 15, which were used separately and in combination to produce continuum-subtracted image cubes at ∼1.3 km s−1 spectral resolution. The maximum recoverable scale was 11'' with a full width half maximum field of view (FOV) of 26''. Data taken using the ARO SMT (Tenenbaum et al. 2010) were added to provide sensitivity to angular scales up to 30''. The rms noise per channel was <1 mJy. Velocities are in the kinematic local standard of rest (LSR) convention relative to the rest frequency of the given line, assuming VLSR= 19.0 km s−1 for the star. The astrometric accuracy is 15 mas for high-resolution cubes and ≤30 mas for the combined data; the absolute flux scale accuracy is better than ∼10%. The position used for VY CMa (α = 07h22m58 324; δ = −25°46
 0301 J2000 ICRS) was estimated from our highest-resolution 1 mm continuum image by fitting a 2D Gaussian component, with an uncertainty of 002 in each coordinate (see the ALMA Technical Handbook and ALMA Memo 620). More information on data reduction, resolution, sensitivity, and other parameters of the cubes used are given in Appendix A.
While many spectral lines were observed in the ALMA bandpass (see Appendix
Spectra arising from certain features in the CO maps were fitted with the non-LTE radiative transfer code ESCAPADE (Adande et al. 2013; also, Singh et al. 2021, 2022). The code, based on the Sobolev approximation, employs the escape probability formalism, considering collisional and infrared dust excitation. The code was used to model the orientation of collimated outflows with respect to the plane of the sky [(x, y) plane], and the outflow velocity perpendicular to this plane or Vxz . Model fits are shown in Figure 3 as overlays (in red or gray scale).
3. Results
Images for the 12CO, J = 2 → 1 and HCN, J = 3 → 2 lines are shown in Figures 1 and 2, respectively (left panel: high-resolution data; right panel: composite image). The red contours in the left panels indicate the approximate position of the star. In the combined image, all the flux has been recovered, as verified by the close resemblance of the ALMA-combined CO and HCN line profiles with those from the SMT (see Figure 3 versus Tenenbaum et al. 2010).

Figure 1. Peak intensity (moment 8) images of J = 2 → 1 transition of 12CO at 230 GHz. Left: ALMA Image at 02 resolution. Right: combined ALMA and SMT image. Synthesized beam sizes are shown at lower left. Flux scale (Jy beam−1) is indicated on the figure.
Download figure:
Standard image High-resolution image
Figure 2. Peak intensity (moment 8) images of J = 3 → 2 transition of HCN at 265 GHz. Left: ALMA Image at 02 resolution. Right: combined ALMA and SMT image. Synthesized beam sizes are shown at lower left. Flux scale (Jy beam−1) is indicated in the figure.
Download figure:
Standard image High-resolution image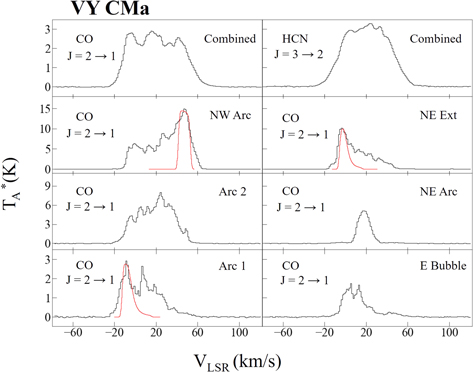
Figure 3. ALMA spectra of the J = 2 → 1 transition of 12CO, showing the combined profile for the entire envelope, and those extracted for individual outflows Arc 1, Arc 2, NW Arc, NE Arc, NE Extension, and E Bubble (see Section 4). The combined profile of the J = 3 → 2 transition of HCN is also shown. ESCAPADE fits are shown for select profiles (in red or gray scale).
Download figure:
Standard image High-resolution imageFigure 1 shows the distinctive new structure in the molecular envelope in VY CMa. There are clear features to the southwest (Arc 1 and Arc 2) and northwest (NW Arc), observed previously in HST images of VY CMa (Humphreys et al. 2007). In addition, there are newly revealed outflows to the east and northeast, one extending as far as ∼9'' from the star. The total extent of the CO emission is ∼14'' in diameter, as noted previously by Ziurys et al. (2007). These regions were not detected earlier by HST because of high obscuration in this direction (Smith et al. 2001), while past ALMA measurements were insensitive to large-scale structure (Decin et al. 2016; Kamiński 2019; Quintana-Lacaci et al. 2023). HCN emission (Figure 2) is primarily located near the star and appears only faintly in some extended features (Arc 2, NW Arc and NE Arc). It is absent from Arc 1 and other E structures.
Table 1 summarizes the features observed in the ALMA images, approximate average positions, and LSR velocities in CO, and when observed, in HCN, assuming VLSR = 19 km s−1 for the star. These velocities are determined from the strongest emission peaks in composite spectra generated for each region; see Figure 3. In certain cases, a strong secondary peak was also visible in the data and is listed in the table. Other, less intense emission appear in some of the spectra, which could also arise in part from contaminating regions. From the ESCAPADE modeling of line profiles, rough estimates of expansion velocities Vxz and their approximate angle with respect to the plane of the sky for Arc 1, NE Extension, and NW Arc were derived. These values are listed in Table 1. The table also contains preliminary 12C/13C ratios for specific outflows.
Table 1. Characteristics of the Molecular Outflow Structures in VY CMa a
| Feature | Figure 4 | α | δ | VLSR CO b | VLSR HCN | 12C/13C | Vxz | Outflow Angle c | |
|---|---|---|---|---|---|---|---|---|---|
| (hour, minute, second) | (° ' '') | (km s−1) | (km s−1) | (km s−1) | |||||
| Arc 1 | a | 07:22:58.10 | −25.46.08.1 | −9 | 11 | − | - | 39 ± 5 | −50 ± 10° |
| Arc 2 | b | 07:22:58.29 | −25.46.07.2 | 23 | ⋯ | 25 | 38 | ||
| South Arc | c | 07:22:58.31 | −25.46.05.4 | 23 | −10, 50 | ⋯ | ⋯ | ||
| SE Loop | g | 07:22:58.56 | −25.46.04.1 | −5 | 25 | ⋯ | ⋯ | ||
| S Knots | f | 07:22:58.45 | −25.46.03.5 | −7 | ⋯ | ||||
| NW Arc | e | 07:22:58.06 | −25.46.01.8 | 48 | ∼40 | 23 | 40 ± 5 | 80 ± 10° | |
| SW Clump | d | 07:22:58.26 | −25.46.04.1 | 19 | −11, 50 | ⋯ | 22–33 | ||
| NE Arc | j | 07:22:58.65 | −25.45.55.1 | 18 | ⋯ | 17 | 30 | ||
| E Bubble | h | 07:22:58.80 | −25.46.05.0 | 5, −5 | ⋯ | ⋯ | ⋯ | ||
| NE extension | i | 07:22:58.60 | −25.46.00.6 | −7 | ⋯ | ⋯ | 29 | 29 ± 5 | −50 ± 10° |
Notes.
a Stellar velocity: VLSR = 19 km s−1 (Tenenbaum et al. 2010); coordinates are approximate (J2000 ICRS). b Primary (left) and secondary (right) emission peaks (see Section 4). c Angle with respect to the plane of the sky; positive angle indicates behind the plane (redshifted); negative sign implies in front of the plane (blueshifted).Download table as: ASCIITypeset image
4. Discussion
4.1. ALMA View of Previously Observed Features
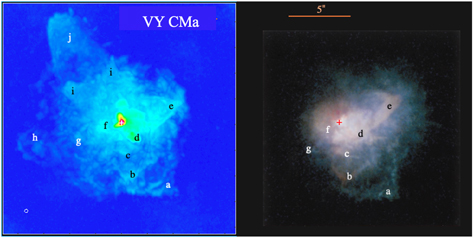
The features observed by ALMA in CO almost have a one-to-one correspondence to those seen in the HST image of dust-scattered starlight, as shown in Figure 4. Here the high-resolution ALMA map and the HST image (Humphreys et al. 2007) are shown on the same spatial scale. Individual structures are indicated by letters. Arc 1, Arc 2, and the NW Arc (a, b, e) appear to have virtually identical structures in both CO and HST images. This result suggests that the dust and gas are well mixed in these outflows. CO is likely to be excited by collisions, such that the rims of these arcs may represent shocked material. The less conspicuous S Arc (c), SW Clump (d), S Knots (f), and SE Loop (g) also are present in both images. The NW Arc and Arc 2 are visible in the HCN image, while weaker features are less apparent, and Arc 1 is absent. Such variation likely occurs because HCN requires higher densities for collisional excitation than CO (107 versus 104 cm−3 for the observed lines). Individual features are discussed below.
Figure 4. Comparative images of VY CMa: emission of 12CO (J = 2 → 1) at high resolution (left) and composite color HST image (right), displayed on the same scale, indicated by the 5'' bar on the top right. The approximate position of the star is given by a cross (white: ALMA; red: HST). The synthesized beam size is indicated in the lower left corner of the ALMA image. Individual features are labeled (a)–(j): (a) Arc 1, (b) Arc 2, (c) S Arc, (d) SW Clump, (e) NW Arc, (f) S Knot, (g) SE Loop, (h) E Bubble, (i) NE Extension, and (j) NE Arc (see Table 1). Some features appear in both images ((a)–(h)), but some are new ALMA detections ((i)–(j)).
Download figure:
Standard image High-resolution image
Arcs 1 and 2
Initially detected in the near-IR by Monnier et al. (1999), Arcs 1 and 2 lie ∼7'' and ∼ 5'' southwest from the star. Arc 1 was thought to trace blueshifted gas (Humphreys et al. 2007; Ziurys et al. 2007). The ALMA CO spectrum shows that Arc 1 has a prominent, blueshifted velocity component near VLSR = −9 km s−1 (Figure 3 and Table 1), strongest near the tip of the arc. A second blueshifted component is also present near 11 km s−1, more obvious in the arc "wings." HCN was not observed in Arc 1 as the density is too low, as noted. Modeling the strongest peak in the profile suggests that the most blueshifted material is moving at an angle ∼ −50° relative to the plane of the sky, with an expansion velocity Vxz ∼ 40 km s−1. These estimates are in good agreement with the HST results, which suggested an angle of ∼ −33° and Vxz ∼ 48 km s−1, averaging over Arc 1 positions A, C, and D. Note that the total expansion velocity for Arc 1 from the HST analysis is Vtot = 68.2 ± 2.5 km s−1 (Humphreys et al. 2007).
Arc 2 has a complicated line profile of six "sub-peaks" with the maximum near VLSR ≈ 24–25 km s−1, seen both in CO (Figure 3) and HCN. The redshifted gas is observed toward the eastern part of the arc, while the blueshifted material lies to the west. This complex velocity structure suggests that Arc 2 is composed of multiple outflows or is even a bubble. The KI profile for Arc 2 traces the more western region and exhibits two velocity components near VLSR ∼ 5 and 50 km s−1 (Humphreys et al. 2005), also seen in CO at this position.
NW Arc
One of the brightest features in the HST images, the NW Arc is observed in both CO and HCN. The CO and HCN peak velocities of 48 and 40 km s−1 do not entirely agree and suggest a density gradient. The NW Arc is also known to have a velocity gradient (Humphreys et al. 2005), which is also apparent in the broad CO line profile. This spectrum extends from −10 to 60 km s−1, east to west, and the intensity decreases to negative velocities (Figure 3). The primary peak in the CO line profile suggests that the NW Arc is behind the star, as previously surmised (Humphreys et al. 2005), but is tilted ∼ 80° with respect to the plane of the sky, with Vxz ∼ 40 km s−1 (Table 1). Humphreys et al. (2007) placed the arc at an angle of 22° with respect to the plane of the sky, based on sampling the eastern half of the structure. (There are no proper motion data for the western edge). Polarimetry data suggest an angle that varies from 35° to 45° from east to west (Jones et al. 2007). The CO spectrum, which preferentially samples the western material, indicates that the NW Arc may curve even further away from the plane. Humphreys et al. (2007) suggested the tip may eventually curve back toward the star. Humphreys et al. (2007) found a total expansion velocity of Vtot = 46 ± 4 km s−1 and Vxz = 39.5 km s−1, in good agreement with the CO-derived velocity.
South Features
While the SW Clump is prominent in CO (d), the SE Loop, S Knots, and S Arc ((g,), (f), and (c)) appear as weak features. None of these regions are clearly defined by HCN emission. These structures will be discussed in a later paper; only a cursory summary will be given here.
The "SW Clump," which is actually multiple features, has been the subject of several studies (e.g., Decin et al. 2016; Kamiński 2019; Humphreys et al. 2021). This composite clump has a complex velocity structure in CO with three distinct peaks at 19, 50, and −11 km s−1, the first being the most intense. This result is consistent with the multiple component "bubble" structure identified by Kamiński (2019). The SE Loop has notable velocity structure, with strongest CO emission near 5 km s−1, most apparent toward the ends of the loop. Another weaker component is near 25 km s−1, lying at the loop center. The S Knots, the brightest structures in the SE envelope, are blueshifted, with a peak velocity in CO near −7 km s−1. A weaker, redshifted tail is also apparent in the spectrum. The S Arc is kinematically complex with three components: the strongest near 23 km s−1; a major, blueshifted feature at −10 km s−1; and a less distinct, redshifted peak at ∼50 km s−1.
4.2. Newly Discovered Outflows
The most striking result from the ALMA maps is the appearance of previously unknown outflows, the E Bubble (h), NE Extension (i), and the NE Arc (j); see Figure 4. The E Bubble and the NE Extension are only visible in CO, while the NE Arc is also faintly traced in HCN. These outflows are major ejection events and certainly impact the overall mass-loss history of VY CMa and the understanding of the overall envelope structure.
NE Arc
The thimble-shaped NE Arc is located about 9'' northeast of the star and extends over 3''. Both CO and HCN spectra show a single velocity component with a maximum near 17–18 km s−1, as shown in Figure 3. This sharp line profile may be a result of the feature's distance from the star, which avoids confusion from other outflows. There is a velocity gradient radially along the structure, starting about 7 km s−1 near the base of the arc, and increasing to 18 km s−1 at the tip, where the line intensity is highest. Some residual gas is seen on the eastern edge of the arc in the range ∼ 20–27 km s−1. HCN is most visible at the tip of the arc as well (Figure 2), indicative of a density enhancement at the outflow edge, perhaps caused by shocks. The shift from blueshifted gas at the arc base to the stellar velocity at the tip suggests considerable deceleration of the material or a significant transverse velocity or both.
NE Extension
A two-pronged structure is prominent in the channel maps for velocities ∼ −14 to −3 km s−1 approximately 4'' northeast and 3'' north of the star, the NE Extension. The northeast prong is obvious in the CO map (Figures 1 and 4 (i)), while the north twin is less so. The two narrow fingers appear to be part of the same material and are characterized by a strong, blueshifted velocity component with VLSR ≈ −7 km s−1 (see Figure 3). (The weaker redshifted wing on the spectrum may be contamination.) The NE Extension is only visible in CO. The twin structure has an expansion velocity of Vxz ∼ 29 km s−1, oriented approximately −50° in front of the plane of the sky.
East Bubble
The East Bubble has a diffuse spherical structure ∼ 7'' east and slightly south from the star. It is the most distant feature in the east envelope and is only obvious in CO. The "bubble" has a diameter of approximately 1'' with an east and west rim LSR velocities of ∼5 km s−1 and −5 km s−1, respectively. The weak emission in the center of the bubble has VLSR ∼ 12 km s−1 and may be a separate structure.
4.3. Preliminary 12C/13C Ratios in Select Features
The line intensities of 12CO and 13CO were used to estimate the 12C/13C ratio in regions where the emission of both isotopologues was well defined: Arc 2, NW Arc, SW Clump, NE Arc, and NE Extension (see Appendix A). As shown in Table 1, the ratios fall in the range 12C/13C ∼ 22–38. The highest value is found in Arc 2 at 38, and the lowest ratio of 22 in the SW Clump. The SW Clump has three distinct velocity components at 19, −11, and 50 km s−1 with corresponding ratios: 12C/13C = 22, 26, and 33. The NW Arc and NE Extension exhibit 12C/13C ∼ 30, while the NW Arc has a ratio of 23. The scatter in values may result from the features representing different mass-loss events with varying degrees of dredge-up (see Milam et al. 2009). Both CO and H2O have been found in clumpy, asymmetric, and non-cospatial layers in the atmosphere of VY CMa (Wittkowski et al. 2012), suggesting that convection cells may vary in composition.
From single-dish observations of CO, Milam et al. (2009) found 12C/13C ≈ 25-46 in VY CMa, with the range reflecting values for a simplified central, blue and redshifted components in the 30'' SMT beam. These ratios are in good agreement with the ALMA measurements. Singh et al. (2021) found 12C/13C ≈ 33 for another supergiant, NML Cyg. The 12C/13C ratios in high luminosity supergiant envelopes therefore appear somewhat larger than those of lower-mass, asymptotic giant branch (AGB) O-rich stars, which have 12C/13C ∼ 5–15 (e.g., Ramstedt & Olofsson 2014). The extreme surface activity of hypergiant stars may cause deeper mixing into the helium-burning shell and the dredging up of additional 12C.
Acknowledgments
This work is supported by NSF Grant AST-1907910. The following data were used: ADS/JAO.ALMA#2021.1.01054.S. ALMA is a partnership of ESO, NSF, and NINS, with NRC, MOST, ASIAA, and KASI, in cooperation with the Republic of Chile. The Joint ALMA Observatory is operated by ESO, AUI/NRAO and NAOJ. NRAO is a facility of the NSF operated under cooperative agreement by Associated Universities, Inc.
Appendix A: Data Reduction and Imaging
Three separate tunings were observed (each covering four spectral windows, SPWs, of 1.875 GHz bandwidth) between 216 and 270 GHz, at 1.25–1.45 km s−1 velocity resolution (depending on frequency). The calibration for the bandpass, flux, and pointing was done using J0538-4405, while the phase calibrator was J0725-2640. Two configurations individually provided ∼02–04 or ∼10–15 resolutions and ∼34 or ∼11'' maximum recoverable scales, hereafter high and low resolution. Observations followed standard ALMA procedures (ALMA Technical Handbook
6
), and details of conditions and calibrators are given in the ALMA archive. All data reduction was performed in CASA 6 (2022 PASP, 134k4501C). The data were pipelined, followed by extraction of the calibrated VY CMa data and identification of line-free channels for each tuning and configuration to allow phase and amplitude self-calibration of the continuum. The solutions were applied to all data. We followed procedures similar to those outlined in Gottlieb et al. (2022) to ensure a consistent stellar position and flux scale for all ALMA data.
From the ALMA Technical Handbook, the expected astrometric accuracy at least ∼18 (60) mas for the high- (low-) resolution data for features with a signal-to-noise ratio > 20 (as for the continuum peaks). The recovered positions of the check source were accurate to <∼15 mas in the three high-resolution tunings, and the positions of the low-resolution continuum peaks agreed with each high-resolution peak within 30 mas so we conservatively take this as the astrometric accuracy of the combined images.
The flux scale of ALMA standard calibrators is accurate to ∼5% in Band 6, but flux density errors increased in transferring amplitude corrections to the target and combining data from different epochs. We checked by comparing the high- and low-resolution flux densities for continuum emission on the same scales at each frequency. This showed that the flux scale uncertainties were <10% except for the lowest-frequency low-resolution data which were discrepant by 11%; we scaled these to make the flux scale more consistent.
From O'Gorman et al. (2015) Table A1, the flux-weighted mean of spectral indices for the two main continuum sources (clump C and the star VY) is α = 2.15. We measured the flux densities for the continuum in each separate tuning of the combined ALMA data in an ellipse of full-width axes 21 × 24 (E × N), giving α = 2.1 (0.1) showing that the relative flux density across our band is accurate to ∼5%. The predicted combined flux density at our intermediate frequency is 293 mJy, compared with an observed 263 mJy, or 11% discrepancy, which includes the earlier observations uncertainty and possibly genuine variability.
Table A1. Imaging Parameters of the Continuum-subtracted Cubes a
| Line | Image Size | Resolution | MRS | Peak | Rms Noise | Velocity Resolution |
|---|---|---|---|---|---|---|
| (arcsec) | (mas, mas, position angle deg) | (arcsec) | (Jybeam−1) | (mJy) | (km s−1) | |
| CO: High | 36 | 0.26, 0.24, 11 | 3.46 | 0.8204 | 0.9 | 1.27 |
| CO: Combined | 40 | 0.70, 0.63, 72 | 30 | 2.2106 | 0.7 | 1.27 |
| HCN: High | 36 | 0.26, 0.24, 76 | 3.32 | 1.4007 | 0.8 | 1.10 |
| HCN: Combined | 40 | 0.68, 0.59, −87 | 30 | 3.6246 | 1.0 | 1.10 |
Note.
a Line rest frequencies given in Section 2. "High" indicates ALMA high-resolution configuration and "Combined" indicates both ALMA configurations and SMT data combined. The resolution is the major and minor axes and position angle of the full width half maximum of the Gaussian restoring beam. MRS stands for maximum recoverable scale. The peak is the maximum flux in the cube, and the rms noise is measured in quiet channels around the center of the primary beam.Download table as: ASCIITypeset image
After subtracting the continuum, image cubes were made for each SPW for separate configurations and for combined configurations. Spectra taken using the ARO SMT were added to the combined ALMA data using feathering to provide sensitivity to angular scales up to 30''. All image cubes used here have had the primary beam correction applied. Velocities are in the kinematic LSR convention relative to the rest frequency of the line shown.
The 12CO/13CO ratios were estimated after smoothing the data cubes to the lower resolution of the 13CO images and blanking both at the level where the weaker 13CO emission fell below 3× local rms noise.
Appendix B
A table of molecular lines, frequencies, and intensities, observed in the dataset, is given in Table B1.
Table B1. Molecular Transitions Observed in Dataset
| Molecule | Frequency | Transition | Intensity |
|---|---|---|---|
| (GHz) | (mJybeam−1) | ||
| CO | 230.538 | J = 2 → 1 | 33.4 |
| HCN | 265.886 | J = 3 → 2 | 38.8 |
| 13CO | 220.399 | J = 2 → 1 | 1.3 |
| H13CN | 259.012 | J = 3 → 2 | 0.6 |
| SO2 | 251.200 | Jka,kc = 131,13 → 120,12 | 13.0 |
| SiO | 260.518 | J = 6 → 5 | 14.2 |
| PO | 239.954 | J = 11/2 → 9/2, e; Ω=1/2 | 11.6 |
| PN | 234.936 | J = 5 → 4 | 5.0 |
| NaCl | 234.252 | J = 18 → 17 | 1.9 |
| Na37Cl | 267.366 | J = 21 → 20 | 1.1 |
Download table as: ASCIITypeset image