


Abstract
Establishing the abundance of the extinct radionuclide 60Fe (half-life 2.62 Ma) in the early solar system is important for understanding the astrophysical context of solar system formation. While bulk measurements of early solar system phases show a low abundance consistent with galactic background, some in situ measurements by secondary ion mass spectrometry (SIMS) imply a higher abundance, which would require injection from a nearby supernova (SN). Here we present in situ nickel isotopic analyses by resonance ionization mass spectrometry (RIMS) in a chondrule from the primitive meteorite Semarkona (LL3.00). The same chondrule had been previously analyzed by SIMS. Despite improved precision compared to SIMS, the RIMS nickel isotopic data do not reveal any resolved excesses of 60Ni that could be unambiguously ascribed to in situ 60Fe decay. Linear regression of 60Ni/58Ni versus 56Fe/58Ni yields an initial 60Fe/56Fe ratio for this chondrule of (3.8 ± 6.9) × 10−8, which is consistent with both the low initial value found by bulk measurements and the low end of the range of initial ratios inferred from some in situ work. The same regression also gives a solar initial 60Ni/58Ni ratio, which shows that this sample was not disturbed by nickel mobilization, thus agreeing with a low initial 60Fe/56Fe ratio. These findings agree with a re-evaluation of previous SIMS measurements of the same sample. Supernova injection of 60Fe into the solar system or its parental cloud material is therefore not necessary to account for the measured solar system's initial amount of 60Fe.
Export citation and abstract BibTeX RIS
1. Introduction
Iron-60 is a short-lived radionuclide (T1/2 = 2.62 ± 0.04 Ma; Rugel et al. 2009), and its abundance in the early solar system is highly debated. The initial value is generally defined as the 60Fe/56Fe ratio at the time of condensation of the first solar system solids, hereafter (60Fe/56Fe)0, and is determined by finding excesses of 60Ni due to in situ 60Fe decay in minerals with a known Fe/Ni elemental ratio. Measurements of bulk chondrules, mineral separates, and bulk measurements of achondrites by inductively coupled plasma mass spectrometry give an initial (60Fe/56Fe)0 ratio of (1.01 ± 0.27) × 10−8 (Tang & Dauphas 2012, 2015). In situ analyses by secondary ion mass spectrometry (SIMS) of early solar system phases, however, give (60Fe/56Fe)0 ratios between 5 × 10⁻⁸ and 3 × 10⁻⁷ (Telus et al. 2012, 2018), and values up to 1 × 10⁻⁶ have been reported (Mishra & Goswami 2014; Mishra & Chaussidon 2014; Mishra et al. 2016). Because 56Fe is a primary isotope with respect to nucleosynthesis, while 60Fe is a secondary isotope made from 56Fe, first-order galactic chemical evolution models indicate that the 60Fe/56Fe ratio should be constant over time (e.g., Huss et al. 2009). From γ-ray observations (Wang et al. 2007) we expect an average 60Fe/56Fe ratio in the interstellar medium (ISM) of ∼3 × 10⁻⁷. However, the initial solar system (60Fe/56Fe)0 ratio is likely lower, as 60Fe ejected from a supernova (SN) goes primarily into a hot phase and thus cannot mix with a cold protostellar cloud without first cooling down (see, e.g., Dwarkadas et al. 2017). The measurements by Tang & Dauphas (2012), Tang & Dauphas (2015), as well as some SIMS measurements (e.g., by Telus et al. 2012, 2018; Mishra & Goswami 2014; Mishra & Chaussidon 2014; Mishra et al. 2016) are in agreement with the expectation of an (60Fe/56Fe)0 ratio from galactic background (hereafter called "low"). Some SIMS measurements by the same authors, however, show a "high" 60Fe/56Fe level, i.e., larger than galactic background. The most likely stellar source to contribute such high amounts of 60Fe is a core-collapse SN (Wasserburg et al. 1998; Hester & Desch 2005; Huss et al. 2009; Ouellette et al. 2009; Mishra & Goswami 2014). Such an injection event could have also triggered the collapse of the protosolar nebula to form the solar system (e.g., Boss & Keiser 2010). A high 60Fe abundance in the early solar system would also have provided a significant heat source for the first ∼10 Ma and would thus have contributed significantly to planetesimal differentiation and core formation (Moskovitz & Gaidos 2011).
Here we present new resonance ionization mass spectrometry (RIMS) measurements of the nickel isotopic composition of chondrule DAP1 from the unequilibrated ordinary chondrite Semarkona (LL3.00) and a re-evaluation of previous SIMS measurements of the same chondrule. While SIMS cannot measure 58Ni and 64Ni due to interferences with 58Fe and 64Zn, respectively, the selective ionization method of RIMS allows accurate measurements of these isotopes with minimal isobaric interferences.
Tang & Dauphas (2015) reported an 60Fe/56Fe ratio of (5.4 ± 3.3) × 10−9 at the time of chondrule formation, based on an isochron consisting of several individual Semarkona chondrules. Chen et al. (2013) measured DAP1 by thermal ionization mass spectrometry (TIMS) and reported a solar 60Ni/58Ni ratio, which translates to an upper limit on the initial 60Fe/56Fe ratio of 9.1 × 10⁻⁸ (2σ).
Previous SIMS measurements of chondrule DAP1 by Huss et al. (2010) and Telus et al. (2011) found high 60Fe/56Fe ratios. A re-evaluation of these measurements (Telus et al. 2012), accounting for a previously unappreciated statistical bias (Ogliore et al. 2011; Coath et al. 2013), gave a corrected 60Fe/56Fe ratio of (2.1 ± 1.2) × 10−7. Using synchrotron X-ray fluorescence to map the iron and nickel distribution in DAP1, Telus et al. (2016) concluded that only minor nickel mobilization took place in this sample and that it therefore could be used to study the initial (60Fe/56Fe)0 ratio. Recently, Telus et al. (2018) re-analyzed the previously measured SIMS isochrons and their significance. Based on the large scatter of the SIMS isotope measurements, Telus et al. (2018) concluded that DAP1 is disturbed due to nickel mobilization, and therefore its 60Fe/56Fe ratio is not significantly different from zero. Despite these disturbances, Telus et al. (2018) argued that the significant excesses in 60Ni measured by SIMS meant that the initial 60Fe/56Fe ratio at chondrule formation was higher than 5 × 10⁻⁸, which, by correcting for the age of Semarkona chondrules (Kita & Ushikubo 2012) relative to calcium–aluminum rich refractory inclusions (CAIs), translated into an initial (60Fe/56Fe)0 ratio of (0.8–5.0) × 10−7.
2. Samples and Methods
2.1. Sample and Standards
A fragment of the millimeter-sized DAP1 Semarkona radial pyroxene chondrule mounted in epoxy had been previously measured by SIMS (Telus et al. 2012, 2018). Prior to RIMS analysis, the mount was coated with gold to ensure electrical conductivity. As a standard, we used a synthetic pyroxene with known iron and nickel concentrations (Telus et al. 2018). We assume that the isotope ratios in the standard are representative of the bulk solar system. This is certainly true at the achieved level of precision (Elliott & Steele 2017).
2.2. RIMS Measurements
RIMS measurements were performed with the Chicago Instrument for Laser Ionization (CHILI; Stephan et al. 2016; Trappitsch et al. 2018). In brief, a 351 nm laser pulse focused to ∼1 μm was used to desorb material from the sample surface. After this desorption event, secondary ions were removed by applying a high-voltage pulse and ejecting them from the ionization region. The residual cloud of neutral particles was then resonantly ionized using tunable Ti:sapphire lasers and subsequently separated according to the ion's mass-to-charge ratio in a time-of-flight mass spectrometer. Ions were detected using a microchannel plate detector, and the arrival time of every individual ion was recorded. The measurement protocol and data evaluation followed the one described by Trappitsch et al. (2018). However, the ionization process was slightly different; i.e., we used four lasers to resonantly ionize nickel from the ground state as well as from the lowest-lying excited state. This increased the nickel signal by approximately a factor of two compared to Trappitsch et al. (2018). In order to attenuate the large iron signal, we only fired the first laser of the iron ionization scheme (Trappitsch et al. 2018) at the same time as the nickel lasers. This ionization process is not resonant, thus we recorded a highly suppressed iron signal. Corrections to 58Ni from contributions of 58Fe by assuming solar 56Fe/58Fe (Taylor et al. 1992) were at most 4‰. We used 58Ni for normalization to the standard and 62Ni/58Ni to correct our measurements for mass-dependent fractionation. These isotopes are not influenced by the odd–even effect during ionization, which only affects the here-unused 61Ni (Trappitsch et al. 2018). The mass spectra were processed as described by Trappitsch et al. (2018), and isotope ratios were subsequently calculated from cumulative counts. Uncertainties of isotope ratios are based on counting statistics. All results and regressions are given with 2σ uncertainties.
We first measured spots on the surface of DAP1 for their nickel isotopic composition and tried to measure the Fe/Ni elemental ratio at the same time. This, however, was not possible by laser desorption: we observed large fractionations in the elemental ratios when changing the focus of the desorption laser. This is a well-known problem of laser desorption (e.g., Anderson et al. 2015), but only affects the elemental ratios and not the isotopic measurements. The measurements on DAP1 presented here were thus acquired inside the SIMS pits, as the Fe/Ni ratio in these pits can be derived from the SIMS measurements. Measurements of spots on the surface give the same isotopic results as measurements inside the SIMS pits (no fractionation due to sample geometry and no statistically significant excess of 60Ni). We do not report surface measurements here because no Fe/Ni elemental ratios were available. Standard measurements were acquired inside SIMS pits as well as on the surface of the synthetic pyroxene standard. No difference could be found, so we do not distinguish between these two settings.
2.3. Notation and Regression
The following notation is used throughout this Letter to discuss the isotopic results. For measurements that were standard-corrected, but uncorrected for mass-dependent fractionation in the sample, we use δ-notation (Equation (1)), which represents the deviation of the sample measurement (Smp) from a measured standard (Std) in permil:
Thus, instrumentally induced fractionations, e.g., isotope fractionation due to the odd–even effect in photoionization, are removed. We assess the precision of δ-values by examining the reproducibility of standard measurements.
The isotopic variations that we are primarily interested in are 60Ni excesses that would show up as departures from the law of mass-dependent isotopic fractionation. Correction for natural and laboratory-induced mass fractionation is accomplished by internal normalization and 60Ni excess is reported as Δ60Nix/y, where x and y indicate the normalizing ratio. As is commonly done (e.g., Dauphas & Schauble 2016) mass-dependent fractionation is corrected for using the exponential law, which takes the form
Other mass-fractionation laws might be more appropriate, depending on the processes responsible for nickel mass fractionation (Dauphas & Schauble 2016), but the differences in calculated Δ60Ni62/58 values between those laws and the exponential law are negligible at the precision of our nickel isotopic analyses. The uncertainties on Δ-values reflect counting errors propagated in the internal normalization scheme through a Monte Carlo approach (Bevington & Robinson 2003).
All weighted, linear regressions are done using the method from Mahon (1996). This method is an updated and corrected calculation following York (1969), which had underestimated the uncertainties in slope and intercept.8
3. Results
Table 1 shows the isotope ratios for all RIMS measurements as well as the 56Fe/58Ni ratios that we determined from the SIMS measurements.
Table 1. RIMS Measurements of Semarkona Chondrule DAP1 and 2σ Uncertainties
| Name | δ60Ni58(‰) | δ61Ni58(‰) | δ62Ni58(‰) | δ64Ni58(‰) | Δ60Ni62/58(‰) | 56Fe/58Ni |
|---|---|---|---|---|---|---|
| Pit 1 | −3 ± 3 | −3 ± 11 | −9 ± 6 | −20 ± 13 | 2 ± 4 | 16639 ± 6930 |
| Pit 2 | −2 ± 3 | 1 ± 12 | −2 ± 6 | −24 ± 13 | 0 ± 4 | 10916 ± 3762 |
| Pit 3 | −1 ± 3 | 6 ± 13 | −13 ± 8 | −13 ± 15 | 6 ± 5 | 7856 ± 2440 |
| Pit 4 | −1 ± 3 | 14 ± 15 | −6 ± 7 | 4 ± 15 | 3 ± 5 | 21151 ± 5787 |
| Pit 5 | 1 ± 3 | 5 ± 14 | 5 ± 8 | 2 ± 15 | −1 ± 5 | 11577 ± 3015 |
| Pit 6 | −1 ± 3 | −7 ± 13 | −2 ± 7 | −17 ± 15 | 1 ± 5 | 15674 ± 9559 |
| Pit 7 | 13 ± 3 | 26 ± 10 | 22 ± 6 | 36 ± 12 | 2 ± 4 | 7342 ± 2985 |
| Pit 8 | 10 ± 3 | 22 ± 13 | 27 ± 7 | 21 ± 14 | −4 ± 5 | 5491 ± 1006 |
| Pit 9 | 3 ± 3 | 19 ± 11 | 2 ± 7 | −5 ± 13 | 3 ± 4 | 21378 ± 5788 |
| Pit 10 | 0 ± 3 | −8 ± 13 | −1 ± 7 | −14 ± 14 | 1 ± 5 | 6419 ± 1788 |
| Pit 11 | 1 ± 4 | −14 ± 14 | −3 ± 8 | −2 ± 16 | 3 ± 5 | 11288 ± 6028 |
| Pit 12 | 4 ± 3 | 19 ± 14 | 9 ± 7 | 14 ± 16 | 0 ± 5 | 3341 ± 1226 |
| Pit 13 | 6 ± 3 | 15 ± 13 | 10 ± 7 | −1 ± 15 | 1 ± 5 | 18654 ± 8473 |
| Pit 14 | −9 ± 3 | −5 ± 12 | −13 ± 7 | −26 ± 14 | −1 ± 4 | 5483 ± 2102 |
| Pit 15 | 14 ± 4 | 42 ± 15 | 24 ± 8 | 28 ± 16 | 2 ± 5 | 600 ± 393 |
| Pit 16 | 14 ± 4 | 41 ± 16 | 23 ± 8 | 35 ± 17 | 2 ± 5 | 29153 ± 15019 |
Note. The 56Fe/58Ni ratio is determined from the SIMS data (see the text).
Download table as: ASCIITypeset image
3.1. Mass-dependent Fractionation
Figure 1 shows δ60Ni58 versus δ62Ni58 for all RIMS measurements of Semarkona chondrule DAP1, along with the mass-dependent fractionation line (MFL). The total observed range in mass fractionation in the two isotope ratios is 23‰ and 40‰, respectively, which corresponds to a mass-dependent fractionation of up to ∼10‰/amu. A weighted regression through all measurements results in a mass-fractionation relationship exponent of 0.5 ± 0.1, which encompasses the range of 0.506–0.516 for commonly used mass-dependent fractionation laws for nickel atoms (exponential, equilibrium, Rayleigh; Davis et al. 2015; Dauphas & Schauble 2016).
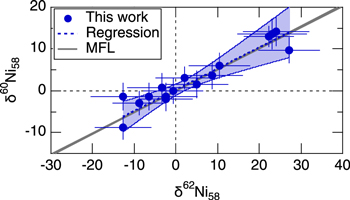
Figure 1. Isotope ratios in δ-notation for all RIMS measurements of DAP1. The MFL line gives the mass dependence for commonly used exponential mass-fractionation laws for kinetic, equilibrium, and Rayleigh fractionation (cf. Davis et al. 2015). A regression (uncertainty given as shaded area) through the data shows near-perfect agreement with the MFL. Uncertainties are 2σ.
Download figure:
Standard image High-resolution image3.2. Internally Normalized Measurements
Figure 2 shows the internally normalized Δ60Ni62/58 versus the standard-corrected δ62Ni58, along with the SIMS measurements of Δ60Ni61/62 versus δ61Ni62 by Telus et al. (2012, 2018). For the SIMS measurements, we distinguish between the mono- and multicollector data sets as described in Telus et al. (2018). Correlated uncertainties for SIMS and RIMS data were calculated using Monte Carlo error propagation, starting with the uncorrelated uncertainties that are given in the supplementary material of Telus et al. (2018). The mass-dependent fractionation discussed in Section 3.1 shows variations up to 10‰/amu, which are effectively corrected for using internal normalization. Only one out of 16 RIMS measurements shows an excess in Δ60Ni62/58 at the 2σ level, consistent with statistical noise (Bevington & Robinson 2003). The SIMS measurements (Telus et al. 2012, 2018) show a similar spread in δ61Ni62 (∼10‰/amu), however, they have excess Δ60Ni61/62 of up to 23‰. Uncertainties in the SIMS measurements are larger and more correlated than those of the RIMS measurements, primarily due to the low abundance of the normalizing isotopes in SIMS. Nickel-61 and 62Ni used in SIMS are 1.34% and 3.63% of the total nickel, while 62Ni and 58Ni, as used in RIMS, have abundances of 3.63% and 68.08%, respectively. Normalizing to 62Ni/58Ni, as was done here for the RIMS measurements, is not an option in SIMS because of a major interference of 58Fe on 58Ni that cannot be resolved or eliminated.

Figure 2. Internally normalized values Δ60Ni62/58 vs. the standard-corrected δ62Ni58 for RIMS measurements (panel a) and Δ60Ni61/62 vs. the standard-corrected δ61Ni62 for the SIMS measurements (panel b) by Telus et al. (2012, 2018). The SIMS measurements are highly correlated and show no excess outside of 2σ in Δ60Ni61/62. One out of 16 RIMS data point shows an excess in Δ60Ni62/58 within the 2σ limit. All correlated uncertainties are 2σ and were calculated by Monte Carlo error propagation (Bevington & Robinson 2003).
Download figure:
Standard image High-resolution imageBecause Figure 2 does not contain any information on the elemental Fe/Ni ratio, an excess in 60Ni due to in situ decay of 60Fe would show in this representation in the form that the measurements would be randomly distributed at Δ60Ni62/58 or Δ60Ni61/62 values ≥0. The SIMS measurements, however, show a strong correlation. Within the newly calculated correlated uncertainties, however, no individual SIMS spot has a statistically significant excess or deficit in 60Ni.
4. Discussion
Figure 3 shows the isochron diagram for DAP1 as determined in this study, the solid lines show the linear relation
Here, (60Fe/56Fe)0 is the slope and (60Ni/58Ni)0 the intercept of the linear relation if all measurements corresponded to a single Fe/Ni fractionation event from a homogeneous reservoir; a valid assumption for a chondrule formed by rapid crystallization of a molten droplet. To compare the RIMS and SIMS data, we start with the 62Ni-normalized mono- and multicollector SIMS measurements of Telus et al. (2018). We measured the same pits by RIMS that were previously measured by multicollector SIMS (Telus et al. 2012, 2018). These SIMS measurements are also shown in Figure 3 using red triangles. As the elemental 56Fe/58Ni ratio could not be determined by RIMS, the corresponding SIMS values were used in the isochron diagram. However, the Fe/Ni ratios changed with depth in the SIMS pit, and these measurements show up to a factor of 30 variation in the Fe/Ni ratio, likely due to sample heterogeneity, i.e., small metal inclusions that cannot be avoided by SIMS due to the large spot size. Because the RIMS measurements were performed at the bottom of the SIMS pits, we determined the Fe/Ni ratio for the RIMS measurements by only considering the last 20 cycles of the SIMS measurements, which represent the bottom ∼10% of the depth of the SIMS pits. The RIMS pits were also much smaller and shallower than the SIMS pits, further justifying this approach. This results in different Fe/Ni ratios for the RIMS (see Table 1) compared to the SIMS data. For the uncertainty of the Fe/Ni ratio, we use the standard deviation of these 20 cycles. We note that the slope and intercept calculated from the isochron diagram do not change if we use the same Fe/Ni ratios that were used for interpreting the SIMS results.

Figure 3. Isochron diagram for the RIMS and multi- and monocollector SIMS measurements (Telus et al. 2012, 2018). The results of the regressions are given in the plot. The shaded areas give the 2σ uncertainties of the regressions. The (60Ni/58Ni)* isotope ratios were internally normalized to remove mass-dependent fractionation effects (see Equation (3)). The dashed line represents the solar 60Ni/58Ni value (Gramlich et al. 1989). Note that the SIMS measurements were renormalized to 58Ni in order to directly compare them with the RIMS measurements, which does not affect the relative uncertainties.
Download figure:
Standard image High-resolution image
The linear regression of the RIMS measurements is shown in Figure 3. We find that the initial 60Fe/56Fe ratio of DAP1 is (3.8 ± 6.9) × 10−8, with a 2σ upper limit of 60Fe/56Fe = 1.1 × 10⁻⁷, which agrees with the mono- and multicollector SIMS measurements by Telus et al. (2018) and is consistent with the low (60Fe/56Fe)0 ratio as measured by bulk techniques (Tang & Dauphas 2012, 2015) for other samples. However, it is inconsistent with high (60Fe/56Fe)0 values as found in some in situ studies (Telus et al. 2012; Mishra & Goswami 2014; Mishra & Chaussidon 2014; Mishra et al. 2016). In addition, we find a solar initial (60Ni/58Ni)0, which translates to Δ60Ni62/58 value of +0.1 ± 2.4‰.
The SIMS measurements show a larger spread and larger uncertainties than the RIMS measurements (see Figure 3). All uncertainties were calculated using the described Monte Carlo error propagation. A linear regression through the SIMS measurements results in a mean square weighted deviation (MSWD) of 0.99 for the monocollector measurements and 0.86 for the multicollector measurements, which are acceptable values for the given degrees of freedom. The regressions of the mono- and multicollector SIMS measurements are given in Figure 3. The initial (60Ni/58Ni)0 translates to Δ60Ni61/62 ratios of −1 ± 4‰ and +11 ± 9‰ for the mono- and multicollector SIMS measurements, respectively.
Telus et al. (2018) found a large MSWD when fitting an isochron and concluded that DAP1 represents a disturbed system. However, this argument does not hold true when correlated uncertainties are considered, as the MSWD values are near one. Furthermore, the initial 60Fe/56Fe SIMS ratios agree well with the RIMS measurement. The initial 60Ni/58Ni ratio of the multicollector SIMS measurements, however, agrees neither with RIMS nor the monocollector SIMS measurements. Telus et al. (2018) pointed out that this discrepancy could be due to different experimental conditions, which seems highly likely when compared with the new measurements of the same pits. The measured 60Ni/58Ni intercept thus agrees with Telus et al. (2016), which concluded the nickel isotopes in DAP1 are undisturbed.
5. Conclusion
Using RIMS, we re-measured the Semarkona chondrule DAP1, which had been previously analyzed by SIMS and used as evidence that the initial solar system abundance of 60Fe was high (Telus et al. 2012). The RIMS data, as well as the re-evaluation of the SIMS measurements, reveal no statistically significant excesses in 60Ni outside of 2σ. Using the Fe/Ni elemental ratios determined by SIMS and the isotope ratios determined by RIMS, we derive an initial 60Fe/56Fe of (3.8 ± 6.9) × 10−8 (2σ). Using a formation age of 2.0 ± 0.8 Ma for Semarkona chondrules (based on Al-Mg systematics for other Semarkona chondrules; Kita & Ushikubo 2012), we calculated an (60Fe/56Fe)0 ratio of (6.4 ± 11.9) × 10−8 for the time of CAI condensation. The initial Δ60Ni62/58 of DAP1 measured by RIMS is +0.1 ± 2.4‰ (2σ) and is therefore consistent with terrestrial Ni isotope ratios (Gramlich et al. 1989; Elliott & Steele 2017).
The improvement in precision for RIMS relative to SIMS can be explained by the fact that the SIMS measurements were internally normalized for mass-dependent fractionation using 61Ni, a task that is especially difficult as 61Ni is a minor isotope with an abundance of only 1.14%. RIMS avoids this issue as the more abundant 58Ni (68.08%) can be measured, because 58Fe ionization is suppressed in the resonance ionization scheme employed here.
The RIMS measurements of DAP1 do not provide any evidence for live 60Fe in the early solar system. From these results, an injection of material into the early solar system by an SN is unlikely. As shown above, the solar system initial (60Fe/56Fe)0 inherited from galactic background is expected to be lower than ∼3 × 10⁻⁷. Our new measurements agrees with such a low value for DAP1. Other short-lived radionuclides that were present in the early solar system, e.g., 26Al, which was present at a canonical level of 26Al/27Al = 5.2 × 10⁻⁵ (Jacobsen et al. 2008), thus require a different origin than a SN injection event. These radionuclides could be, e.g., the result of stellar winds from a Wolf–Rayet star (Gaidos et al. 2009; Gounelle & Meynet 2012; Young 2014; Dwarkadas et al. 2017). Recently, Dwarkadas et al. (2017) showed that such a scenario can explain the amounts of 26Al as well as the low amounts of 60Fe simultaneously, thus agreeing with the measurements Tang & Dauphas (2012, 2015), the low SIMS measurements, as well as our new RIMS measurements.
We would like to acknowledge helpful comments from an anonymous reviewer as well as from the editor Richard de Grijs. This work was performed under the auspices of the U.S. Department of Energy by Lawrence Livermore National Laboratory under Contract DE-AC52-07NA27344 and was supported by the Laboratory Directed Research and Development Program at LLNL under project 17-ERD-001, by the University of Chicago through the Chamberlin Postdoctoral Fellowship (to P.B.), by NASA through grants NNX15AF78G, 80NSSC17K0250, and 80NSSC17K0251 (to A.M.D.), grants NNX17AE86G, NNX17AE87G, NNX15AJ25G (to N.D.), grants NNX11AG78G, NNX14AI19G (to G.R.H.), and by the NSF through grants EAR1502591 and EAR1444951 (to N.D.). LLNL-JRNL-740364.
Footnotes
- 8
We provide an open-source tool to determine regressions after Mahon (1996) on github: https://github.com/LLNL/MahonFitting (Trappitsch 2018).