


Abstract
We report a survey of excited-state hydroxyl (ex-OH) masers at the 4.7 and 6.0 GHz transitions toward a sample consisting of 3348 massive star-forming region candidates selected from the all-sky Wide-field Infrared Survey Explorer point-source catalog. The survey was conducted with the Shanghai Tianma Radio Telescope. In total, 6, 9, and 30 sources were detected with the ex-OH masers at the 4766, 6031, and 6035 MHz transitions, respectively. Among them, one 4766 MHz, one 6031 MHz, and five 6035 MHz ex-OH maser sources are newly identified. A series of statistical analyses derived that the ex-OH masers were detected efficiently toward the subsamples associated with both the 6.7 GHz CH3OH maser and radio recombination lines (RRLs), whereas compared to the CH3OH masers, the ex-OH masers are more likely to be produced toward the sources with stronger 22 μm band emission. A significant luminosity correlation is found between the ex-OH masers and RRLs. In addition, we found that the magnetic field strength of most sources with the 6.7 GHz CH3OH maser was stronger relative to that of sources without the CH3OH maser. Combined with these, it demonstrates that the ex-OH maser is associated with more evolved star-forming regions, likely associated with thicker dust envelopes. Meanwhile, the ex-OH masers might be a potential tracer for measuring the Galactic magnetic field information on the large-scale views using their Zeeman pairs.
Export citation and abstract BibTeX RIS

Original content from this work may be used under the terms of the Creative Commons Attribution 4.0 licence. Any further distribution of this work must maintain attribution to the author(s) and the title of the work, journal citation and DOI.
1. Introduction
High-mass stars, also known as OB stars, are a class of stars with luminosities higher than 103 L☉ and spectral types of B3 or earlier. Their stellar masses range from 8 up to possibly more than 150 M☉ (Martins et al. 2008). These stars make up a small percentage of galaxies, usually about 3% of the total number of stars, or about 15% of the total mass (Kroupa 2001; Chabrier 2003). It is well known that high-mass stars play a major role in the energy budget of galaxies via their radiation, wind, and supernova events from their births to deaths. But it is still rarely known for their formation relative to low-mass stars. Interstellar masers such as methanol (CH3OH), hydroxyl (OH), and water (H2O) are common in massive star-forming regions (MSFRs) and thus useful tools to study the formation of high-mass stars. In particular, based on the evolutionary sequences of the interstellar maser species during the high-mass star formation evolution (Ellingsen 2006; Breen et al. 2010), the evolutionary phase of the interstellar OH maser is contemporaneous with the evolution of an ultracompact (UC) H ii region around central high-mass young stars (Reid 2002) and dies out rapidly when the size of the H ii region has enlarged to greater than 0.03 pc (Caswell 2001). Thus, the interstellar OH maser could serve as a tool to pinpoint high-mass young stars that are obscured by dust in the molecular cloud.
The first detection of the OH maser was made from the ground-state transition (2∏3/2, J = 3/2 state, its mainline frequencies at 1665 and 1667 MHz) toward several Galactic H ii regions (e.g., W3(OH)) by Weaver et al. (1965) and Gundermann (1965). The ground-state OH transitions are usually the strongest OH maser ones in the MSFRs. The weaker excited-state OH (ex-OH) masers (e.g., 2∏1/2, J = 1/2 and 2∏3/2, J = 5/2) are generally accompanied by the ground-state OH masers. The first detection of ex-OH (2∏1/2, J = 1/2 state) at 4765 MHz was made from the sources W3(OH) and W49N (Zuckerman et al. 1968), and the ex-OH (2∏3/2, J = 5/2 state) at 6035 MHz was detected by Yen et al. (1969) toward W3. The high-state ex-OH (2∏3/2, J = 7/2 state, F = 4–4) at 13,441.417 MHz was first detected in W3(OH) by Turner et al. (1970). As supplements to the ground-state OH maser observations, the ex-OH masers are helpful for us to understand the maser pumping process and investigate the physical conditions where masers are present (Caswell 2001).
In the past few decades, the extensive ex-OH maser surveys have been undertaken toward color- (or magnitude-) selected infrared (IR) sources or known MSFRs associated with the 6.7 GHz Class II CH3OH masers (e.g., Cohen et al. 1991; Smits 1994; Caswell & Vaile 1995; Cohen et al. 1995; Baudry et al. 1997; Szymczak et al. 2000; Dodson & Ellingsen 2002; Smits 2003; Edris et al. 2007). Caswell (2001) used the Australia Telescope Compact Array (ATCA) to measure the positions with subarcsecond accuracy for more than 50 6035 MHz OH maser sources. Then, Caswell (2003) used the Parkes radio telescope to study ex-OH maser polarizations using the right-and left-hand circular polarization (RHCP and LHCP) spectra of the 6035 and 6031 MHz ex-OH masers toward 91 previously cataloged ex-OH masers. Qiao et al. (2014) collected the published data of the ex-OH masers before 2014 and compiled a sample of the 5 cm ex-OH masers containing 119 sources and the 6 cm ex-OH masers containing 40 sources. In 2016, Avison et al. (2016) reported the first complete unbiased survey of the Galactic plane (186° ≤ ℓ ≤ 60°, including the Galactic center) for the 6035 MHz ex-OH masers as part of the methanol multibeam (MMB) survey. A total of 127 ex-OH maser sources were detected from this survey, of which 47 were newly detected. The accurate positions of these new masers were also determined from interferometric observations with the ATCA (Avison et al. 2016).
Ellingsen (2006) proposed that the stellar mass range associated with the 6.7 GHz CH3OH masers is lower than that for the ground-state OH masers, or, alternatively, these OH masers may be generally associated with a later evolutionary phase by examining the mid-IR (MIR) properties of Spitzer Galactic Legacy Infrared Mid-Plane Survey Extraordinaire (GLIMPSE) sources. The all-sky Wide-field Infrared Survey Explorer (WISE) catalog provided an entire-sky up-to-date database that observes at four MIR bands, 3.4, 4.6, 12, and 22 μm, with resolutions of 6 1, 64, 65, and 12'', respectively (Wright et al. 2010). It can provide us with more information about the environment at longer MIR wavelengths for the study of interstellar OH masers. Combined with GLIMPSE and WISE data, Qiao et al. (2014) did not find obvious differences in the color–color or color–magnitude properties for the associated GLIMPSE or WISE point sources through a comparison in different subsamples (e.g., those associated with OH masers only, both OH masers and Class II CH3OH masers, and Class II CH3OH masers only).
At present, there is still little analysis of the above evolutionary phase or MIR environment for the ex-OH maser sources by combining the other MSFR tracers (e.g., CH3OH masers). The ex-OH masers are likely able to trace different environmental regions compared to the ground-state masers. In particular, the ground-state OH masers are typically produced in regions with gas densities in the range of 104 < nH < 108.3 (Cragg et al. 2002), whereas the ex-OH masers trace somewhat higher-density regions (106.5 < nH < 108.3; Cragg et al. 2002; Green et al. 2007). Therefore, it is possible that the ex-OH masers trace different regions and so have different MIR environments with regard to the ground-OH masers. In this work, a new survey of the interstellar masers (CH3OH and OH) and radio recombination lines (RRLs) was simultaneously made for a sample consisting of 3348 MSFR candidates selected from the WISE point-source catalog (for details, see Section 2). WISE will help us to understand the similarities and differences in the MIR environment of the CH3OH masers, RRLs, and ex-OH masers. The aim of this survey is to enlarge the number of ex-OH masers and then investigate the environments of the ex-OH masers and compare them with the CH3OH masers and RRLs. In addition, the significant Zeeman splitting of the ex-OH maser lines caused by the large Landé g factor allows us to study the magnetic field in its local environment by observing the RHCP and LHCP spectra of the ex-OH masers (Fish 2007, and references therein).
The rest of this paper is organized as follows. In Section 2, we describe the selection of the survey sample, observation, and data processing. In Section 3, we present the observational results of the survey. In Section 4, we discuss the ex-OH maser properties, including their evolutionary stage, the luminosity relationships between ex-OH masers and other tracers of MSFRs, and their variabilities, as well as the magnetic field information traced by the ex-OH maser Zeeman pairs. Finally, we make a summary of this research.
2. Sample and Observation
2.1. Sample Selections
Since the 6.7 GHz CH3OH masers are considered to be a definite tracer of MSFRs (e.g., Minier et al. 2003; Xu et al. 2008), we selected the sources from the WISE point catalog, which satisfies the color–color or color–magnitude criteria of sources having the 6.7 GHz CH3OH masers as the MFSR candidates to be observed. The MMB survey is an unbiased survey of the 6.7 GHz CH3OH maser conducted with the Parkes telescope in a relatively wide region of the Galactic plane (186° ≤ ℓ ≤ 60°,  ; Green et al. 2009, 2010, 2012; Caswell et al. 2010, 2011; Breen et al. 2015). We used the 6.7 GHz CH3OH maser sources detected from the MMB survey as initial samples to identify candidate MSFRs from the WISE point-source catalog (for details, see Yang et al. 2017). We cross-matched the 6.7 GHz CH3OH masers from the MMB survey and the WISE point sources within an angular separation of 7'' (e.g., Caswell 2009). We found that most of the WISE sources associated with the 6.7 GHz CH3OH masers (in total, 473 sources having the four WISE band data) satisfy the criteria of magnitudes and colors.
- 1.Magnitude criteria: [3.4] <14, [4.6] <12, [12] <11, and [22] <5.5 mag.
- 2.Color criteria: [3.4]–[4.6] >2 and [12]–[22] >2.
We used these criteria to match the sources in the all-WISE point-source catalog and selected ∼13,000 candidates that are possibly associated with the CH3OH masers. Considering the resolution (∼3') of the Shanghai Tianma Radio Telescope (TMRT) at 6.7 GHz and excluding the known 6.7 GHz CH3OH maser sources from the MMB survey and the sources with decl. below −30°, we finally obtained 3348 sources as our targeted sample of MSFR candidates to search the 6.7 GHz methanol and the ex-OH masers. The source samples and related source parameters are given in Table 1 of Yang et al. (2017, 2019).
2.2. Observations and Data Reduction
The survey was conducted by the TMRT from 2015 September to 2018 January (Yang et al. 2017, 2019; Chen et al. 2020). Table 1 summarizes the related observation parameters for the ex-OH maser lines in this work. A cryogenically cooled C-band receiver covering the frequency range of 4–8 GHz and the Digital Backend System were used to receive and record signals in LHCP and RHCP polarization simultaneously. The four ex-OH maser transitions at the frequencies of 4750.656, 4765.562, 6030.747, and 6035.092 MHz were covered with four individual spectral windows, each having a bandwidth of 23.4 MHz with 16,384 channels corresponding to the channel width of 1.431 kHz (or a velocity spacing of 0.07–0.09 km s−1 for these ex-OH transitions). The system temperature of the receiver is about 20–30 K, the aperture efficiency of the TMRT is ∼55%, and the corresponding sensitivity is 1.5 Jy K−1. The half-power beamwidth (HPBW) of these observed lines is about  at 6.0 GHz.
Table 1. Summary of the Ex-OH Line Observations
| Spectral Line | Frequency | HPBW | Velocity Resolution |
|---|---|---|---|
| (MHz) | (arcmin) | (km s−1) | |
| OH 2∏1/2, J−1/2, F = 1−1 | 4750.656 | 3.34 | 0.09 |
| OH 2∏1/2, J−1/2, F = 1−0 | 4765.562 | 3.33 | 0.09 |
| OH 2∏3/2, J−5/2, F = 2−2 | 6030.747 | 2.63 | 0.07 |
| OH 2∏3/2, J−5/2, F = 3−3 | 6035.092 | 2.63 | 0.07 |
Download table as: ASCIITypeset image
We used the position-switching mode to observe each source with two ON–OFF cycles. The ON and OFF positions have an integration time of 2 minutes for each cycle. The noise diode was used to carry out the prior flux calibration. As part of the 6.7 GHz methanol maser survey (Yang et al. 2017, 2019), W3(OH) and NGC 7538 were observed as further flux density calibrators of the 6.7 GHz methanol maser line during the observations in this project. A flux density uncertainty of the 6.7 GHz line is less than 20% even though the elevation effect was not calibrated during the observation time, which is also deemed the overall uncertainty for all spectral windows in the C-band receiver. Object 3C 147 is used to calibrate polarization because it is known to have low polarization below 10 GHz (Perley & Butler 2017). The LHCP and RHCP spectra were calibrated separately, with flux density uncertainties in both polarizations of less than 20%.
The GILDAS/CLASS 9 package was used to process the observed spectral data. In this work, the maser line is considered to be detected only when the peak of the flux density is stronger than the 3σ rms noise level (the typical rms noise level was approximately ∼60 mJy) and the emissions appear from more than two spectral channels and can be inspected simultaneously in both ON–OFF observation cycles. We directly determined the peaks of the maser flux density from their spectra, and the integrated flux densities of the masers were determined by integrating the maser emission over the velocity range of the emission.
3. Result
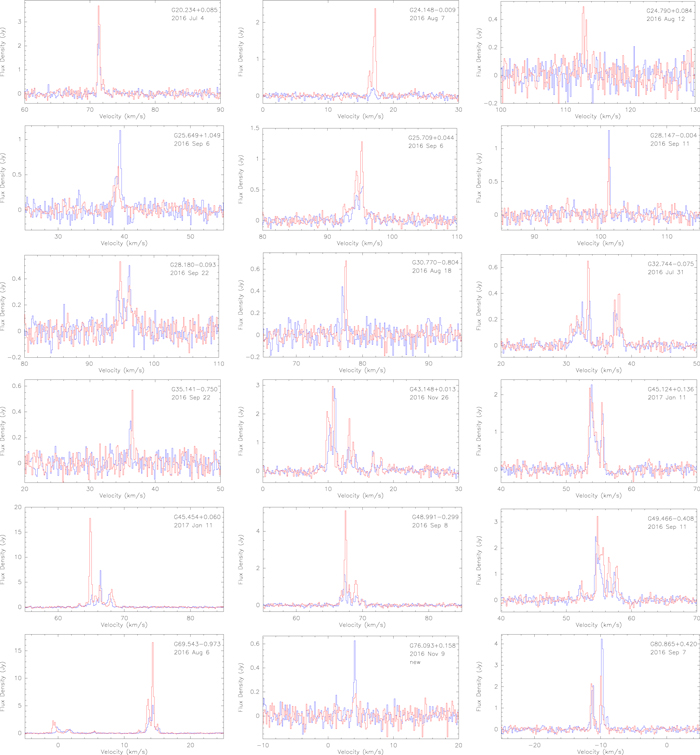
Six, nine, and thirty ex-OH masers in the transitions of 4765.56, 6030.75, and 6035.09 MHz were detected from our survey, with their spectra presented in Figures 1–3, respectively. Table 2 presents the line parameters of these ex-OH masers. Meanwhile, the detections of other tracers (6.7 GHz methanol masers and RRLs) related to these sources and the corresponding references are also shown in Table 3. Notably, the radio frequency interference around the frequency of about 4750 MHz is very serious; we cannot process the OH line signal at the 4750.66 MHz transition.
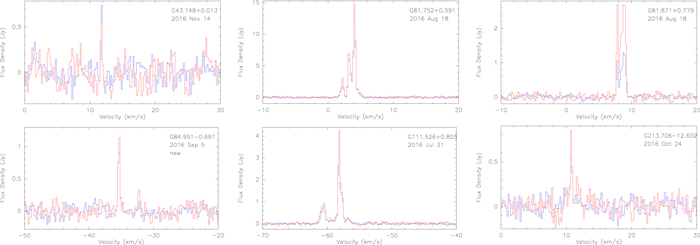
Figure 1. Spectra of the 4765.56 MHz (2∏1/2, J−1/2, F = 1−0) OH masers detected in the TMRT survey. Blue and red lines denote the spectra on the LHCP and RHCP, respectively.
Download figure:
Standard image High-resolution image
Figure 2. Spectra of the 6030.75 MHz (2∏3/2, J−5/2, F = 2−2) OH masers detected in the TMRT survey. Blue and red lines denote the spectra on the LHCP and RHCP, respectively.
Download figure:
Standard image High-resolution imageTable 2. The Line Properties of the Ex-OH Masers Detected in Our Survey
| LHCP | RHCP | |||||||||
|---|---|---|---|---|---|---|---|---|---|---|
| Source | R.A. | Decl. | Frequency | ΔV | Sp | Si | Vp | Sp | Si | Vp |
| (l, b) | (J2000) | (J2000) | (MHz) | (km s−1) | (Jy) | (Jy km s−1) | (km s−1) | (Jy) | (Jy km s−1) | (km s−1) |
| (deg, deg) | (h m s) | (° ' '') | ||||||||
| (1) | (2) | (3) | (4) | (5) | (6) | (7) | (8) | (9) | (10) | (11) |
| G20.234+0.085 | 18:27:39.94 | −11:14:32.30 | 6035 | 71–72.3 | 2.81 | 1.24 | 71.34 | 3.67 | 1.75 | 71.34 |
| G24.148−0.009 | 18:35:21.02 | −07:48:54.1 | 6035 | 15.9–17.9 | 0.22 | 0.06 | 16.94 | 2.38 | 1.3 | 17.22 |
| G24.790+0.084 | 18:36:12.45 | −07:12:10.70 | 6035 | 111.8–113.8 | 0.49 | 0.35 | 112.78 | |||
| G25.649+1.049 | 18:34:20.91 | −05:59:42.50 | 6035 | 37.9–40.1 | 1.13 | 0.68 | 39.38 | 0.62 | 0.46 | 39.1 |
| G25.709+0.044 | 18:38:03.16 | −06:24:15.50 | 6035 | 92.2–98.2 | 0.55 | 0.82 | 95.48 | 1.28 | 1.54 | 95.34 |
| G28.147−0.004 | 18:42:42.59 | −04:15:35.00 | 6035 | 101–101.8 | 1.27 | 0.3 | 101.25 | 0.85 | 0.22 | 101.25 |
| G28.180−0.093 | 18:43:05.13 | −04:16:14.20 | 6035 | 94–98 | 0.5 | 0.62 | 96.21 | 0.53 | 0.65 | 94.79 |
| G30.770−0.804 | 18:50:21.51 | −02:17:27.50 | 6035 | 75.2–77.8 | 0.44 | 0.21 | 76.96 | 0.68 | 0.19 | 77.52 |
| G32.744−0.075 | 18:51:21.80 | −00:12:05.00 | 6035 | 30.1–39.2 | 0.34 | 0.7 | 33.6 | 0.65 | 0.96 | 33.32 |
| G35.141−0.750 | 18:58:08.43 | +01:37:22.80 | 6035 | 35.7–37.6 | 0.33 | 0.14 | 36.24 | 0.57 | 0.22 | 36.53 |
| G43.148+0.013 | 19:10:10.98 | +09:05:18.10 | 4765 | 11.2–12.2 | 0.74 | 0.13 | 11.82 | 0.55 | 0.11 | 11.82 |
| 6030 | 13–15 | 0.19 | 0.1 | 13.43 | 0.33 | 0.11 | 13.99 | |||
| 6035 | 8–8.6 | 2.89 | 3.48 | 11 | 2.97 | 4.15 | 10.72 | |||
| G45.124+0.136 | 19:13:27.22 | +10:53:49.00 | 6030 | 53–58 | 0.33 | 0.27 | 54.09 | |||
| 6035 | 52.5–56.3 | 2.27 | 2.19 | 53.9 | 2.18 | 2.46 | 53.61 | |||
| G45.454+0.060 | 19:14:21.07 | +11:09:13.70 | 6030 | 64.5–69 | 1.17 | 0.8 | 65.46 | 1.21 | 0.31 | 65.18 |
| 6035 | 63–69 | 7.35 | 6.14 | 66.4 | 17.79 | 12.45 | 64.84 | |||
| G48.991−0.299 | 19:22:26.22 | +14:06:42.10 | 6030 | 67.8–71 | 0.35 | 0.28 | 68.2 | 0.73 | 0.59 | 68.2 |
| 6035 | 66.2–70.6 | 1.66 | 1.53 | 67.29 | 5.11 | 3.39 | 67.43 | |||
| G49.466−0.408 | 19:23:45.73 | +14:28:45.10 | 6030 | 51.9–53.2 | 0.84 | 0.37 | 52.43 | 0.82 | 0.2 | 52.71 |
| 6035 | 51.8–58.6 | 2.44 | 3.4 | 54.51 | 3.22 | 4.6 | 54.8 | |||
| G69.543−0.973 | 20:10:08.98 | +31:31:48.90 | 6030 | 13.4–15 | 1.87 | 0.8 | 14.18 | 3.19 | 1.2 | 13.9 |
| 6035 | −1 to 15.8 | 5.1 | 5.54 | 14.31 | 16.52 | 10.51 | 14.31 | |||
| G76.093+0.158 | 20:23:23.65 | +37:35:34.30 | 6035 | 3.2–4.7 | 0.63 | 0.15 | 4.1 | 0.19 | 0.13 | 4.24 |
| G80.865+0.420 | 20:36:52.18 | +41:36:24.50 | 6030 | −11.9 to −10 | 1.38 | 0.46 | −10.96 | 1.66 | 0.38 | −11.11 |
| 6035 | −12.2 to −8.4 | 4.23 | 2.47 | −9.83 | 2.5 | 1.74 | −9.97 | |||
| G81.752+0.591 | 20:39:02.00 | +42:24:59.20 | 4765 | 1.5–5.8 | 12.91 | 10.42 | 4.02 | 14.84 | 11.92 | 4.02 |
| 6035 | −9.8 to −2 | 1.32 | 0.85 | −2.47 | 1.93 | 1.15 | −2.61 | |||
| G81.871+0.779 | 20:38:36.66 | +42:37:30.50 | 4765 | 7.8–9.5 | 1.29 | 1.3 | 8.78 | 2.69 | 3.08 | 7.88 |
| 6035 | 6–9.6 | 2.25 | 2.31 | 7.24 | 10.75 | 7.43 | 6.67 | |||
| G84.951−0.691 | 20:55:32.50 | +44:06:10.20 | 4765 | −36 to −31 | 0.91 | 0.3 | −35.29 | 1.14 | 0.45 | −35.29 |
| G85.394−0.024 | 20:54:17.21 | +44:52:21.00 | 6035 | −34 to −26 | 0.22 | 0.08 | −32.95 | 0.66 | 0.23 | −33.24 |
| G90.921+1.487 | 21:09:12.87 | +50:01:02.60 | 6035 | −71 to −69 | 0.57 | 0.37 | −69.27 | |||
| G97.527+3.184 | 21:32:11.30 | +55:53:39.60 | 6035 | −76 to −71.8 | 1.42 | 0.73 | −72.13 | 7.72 | 2.3 | −72.13 |
| G98.036+1.446 | 21:43:01.44 | +54:56:19.70 | 6035 | −65.6 to −61 | 1.47 | 0.48 | −61.67 | 1.26 | 0.48 | −61.53 |
| G108.758−0.986 | 22:58:47.49 | +58:45:01.80 | 6035 | −56.3 to −54.8 | 0.26 | 0.17 | −45.52 | 0.93 | 0.48 | −46.09 |
| G111.526+0.803 | 23:13:33.11 | +61:29:15.20 | 4765 | −61.6 to −56 | 3.49 | 2.86 | −58.12 | 4.26 | 3.4 | −58.12 |
| 6030 | −60 to −57 | 0.15 | 0.13 | −58.74 | 0.12 | 0.14 | −59.17 | |||
| G111.532+0.759 | 23:13:43.86 | +61:26:55.70 | 6035 | −60.3 to −58.8 | 1.21 | 0.67 | −59.62 | 1.5 | 1.04 | −59.47 |
| G141.918+1.902 | 03:27:28.62 | +58:53:48.10 | 6030 | −9 to −7 | 0.25 | 0.19 | −7.57 | 0.22 | 0.12 | −8 |
| 6035 | −9 to −7 | 0.73 | 0.48 | −8.14 | 0.36 | 0.31 | −8.14 | |||
| G163.078−1.926 | 04:49:46.66 | +41:39:05.50 | 6035 | −17 to −12 | 0.19 | 0.44 | −13.99 | 0.4 | 0.8 | −14.13 |
| G183.349−0.575 | 05:51:11.03 | +25:46:15.90 | 6035 | −6.4 to −5 | 0.73 | 0.23 | −5.43 | 0.4 | 0.15 | −6.14 |
| G211.567−19.295 | 05:39:56.00 | −07:30:27.7 | 6035 | 1.5–2.9 | 8.2 | 2 | 2.42 | 0.91 | 0.33 | 1.99 |
| G213.706−12.602 | 06:07:46.80 | −06:23:08.30 | 4765 | 10–12.2 | 0.53 | 0.46 | 10.73 | 0.85 | 0.59 | 10.73 |
Note. Column (1): source name. Columns (2) and (3): targeted positions for the TMRT observations. Column (4): denotation for the ex-OH transitions. Column (5): velocity ranges for line emission. Columns (6)–(11): peak and integrated flux densities and velocities at peaks of the LHCP and RHCP.
Download table as: ASCIITypeset image
Table 3. Whether the Detected Ex-OH Maser Sources in Our Survey Were Associated with Other Tracers
| Source | 4765 | 6030 | 6035 | 6668 | RRLs |
|---|---|---|---|---|---|
| (l, b) | OH | OH | OH | CH3OH | |
| (deg, deg) | (MHz) | (MHz) | (MHz) | (MHz) | |
| (1) | (2) | (3) | (4) | (5) | (6) |
| G20.234+0.085 | N | N | Y1 | Y | N |
| G24.148−0.009 | N | N | Y2 | Y | N |
| G24.790+0.084 | N | N | Y3 | Y | Y |
| G25.649+1.049 | N | N | Y2 | Y | N |
| G25.709+0.044 | N | N | Y3 | Y | Y |
| G28.147−0.004 | N | N | Y4 | Y | Y |
| G28.180−0.093 | N | N | Y5 | Y | N |
| G30.770−0.804 | N | N | Y2 | Y | N |
| G32.744−0.075 | N | N | Y1 | N | N |
| G35.141−0.750 | N | N | Y2 | Y | N |
| G43.148+0.013 | Y6 | Y7 | Y1 | Y | Y |
| G45.124+0.136 | N | Y7 | Y1 | N | Y |
| G45.454+0.060 | N | Y7 | Y7 | Y | Y |
| G48.991−0.299 | N | Y7 | Y7 | Y | Y |
| G49.466−0.408 | N | Y7 | Y7 | Y | Y |
| G69.543−0.973 | N | Y7 | Y7 | Y | N |
| G76.093+0.158 | N | N | Ynew | Y | N |
| G80.865+0.420 | N | Y7 | Y7 | Y | Y |
| G81.752+0.591 | Y6 | N | Y7 | Y | Y |
| G81.871+0.779 | Y8 | N | Y7 | Y | Y |
| G84.951−0.691 | Ynew | N | N | Y | Y |
| G85.394−0.024 | N | N | Y4 | Y | N |
| G90.921+1.487 | N | N | Y4 | Y | N |
| G97.527+3.184 | N | N | Ynew | Y | Y |
| G98.036+1.446 | N | N | Y7 | Y | N |
| G108.758−0.986 | N | N | Y4 | Y | N |
| G111.526+0.803 | Y6 | Y9 | N | Y | Y |
| G111.532+0.759 | N | N | Y7 | Y | Y |
| G141.918+1.902 | N | Ynew | Ynew | N | N |
| G163.078−1.926 | N | N | Ynew | N | N |
| G183.349−0.575 | N | N | Y4 | Y | N |
| G211.567−19.295 | N | N | Ynew | N | N |
| G213.706−12.602 | Y6 | N | N | Y | Y |
Note. Column (1): source name. Columns (2)–(6): information on whether the source was detected by other tracers: Y, detected; N, not detected. The references for the previously known ex-masers are given as 1 (Caswell 2001), 2 (Avison et al. 2016), 3 (Ouyang et al. 2019), 4 (Szymczak et al. 2020), 5 (Caswell & Vaile 1995), 6 (Harvey-Smith & Cohen 2005), 7 (Baudry et al. 1997), 8 (Palmer et al. 2004), and 9 (Fish et al. 2006). The new masers detected in our survey are marked with the superscript "new." The 6668 MHz methanol maser information is from Yang et al. (2017, 2019), and the RRL information is from Chen et al. (2020).
Download table as: ASCIITypeset image
3.1. The Newly Detected Sources
Compared with the ex-OH maser catalog compiled by Qiao et al. (2014), the survey of the 6035 MHz ex-OH maser (e.g., Avison et al. 2016; Szymczak et al. 2020), and those referred to in the SIMBAD Astronomical Database,
10
we identified one, one, and five new ex-OH masers at the transitions of 4765.56, 6030.75, and 6035.09 MHz, respectively. They are labeled in Table 3 and Figures 1–3 with "new." It should be noted that two new 6035 MHz ex-OH masers are detected at higher latitudes ( >3°): G97.527+3.184 and G211.567−19.295. The WISE IR three-color images of these newly detected ex-OH maser sources are shown in Figure 4. The figure shows that these sources are located in relatively simple IR environments, suggesting that they do not belong to complicated clusters. Remarks for these new ex-OH maser sources are as follows.
Download figure:
Standard image High-resolution image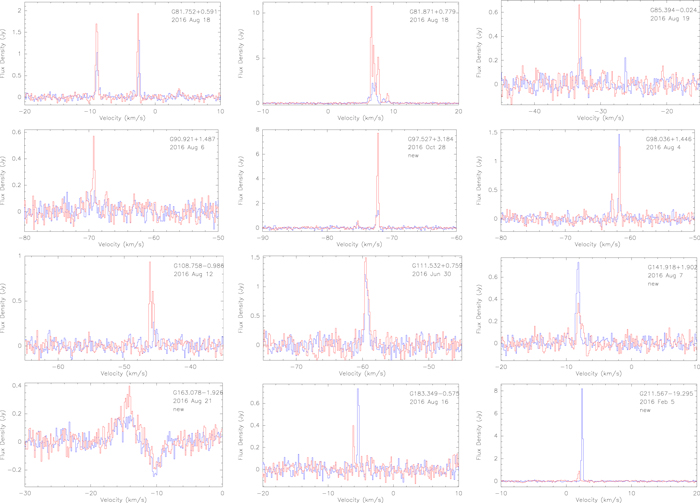
Figure 3. Spectra of the 6035.09 MHz (2∏3/2, J−5/2, F = 3−3) OH masers detected in the TMRT survey. Blue and red lines denote the spectra on the LHCP and RHCP, respectively.
Download figure:
Standard image High-resolution image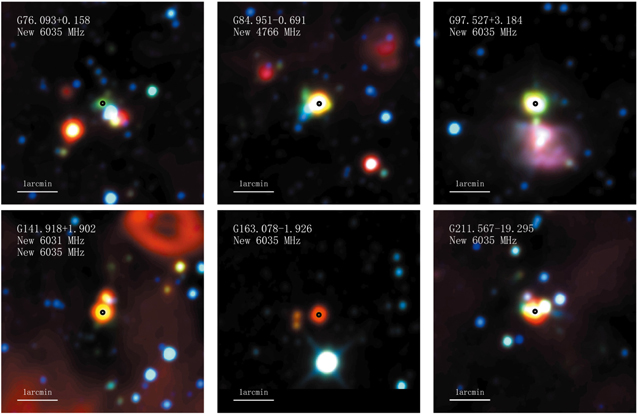
Figure 4. The IR three-color images around the newly detected ex-OH maser sources. Blue, green, and red represent the 3.4, 4.6, and 12 μm band emission in WISE, respectively. The circle in the center of each panel represents the maser targeted positions in our observations (Table 2). The newly detected transitions are given in the upper left corner of each source.
Download figure:
Standard image High-resolution image3.1.1. 4766 MHz Ex-OH Maser
G84.951−0.691. We detected a feature of the 4766 MHz OH maser at −35.91 km s−1. The 6.7 GHz CH3OH maser has four features in the velocity range of −37.0 to −25.0 km s−1 (Yang et al. 2019), and Chen et al. (2020) detected emission of RRLs at this position. In addition, the emissions of NH3(1, 1), NH3(2, 2), NH3(3, 3), and the H2O maser have been detected by the Green Bank Telescope (GBT) in this source (Urquhart et al. 2011); the water maser has two features in the velocity range of −34.5 to −29.6 km s−1.
3.1.2. 6031 MHz Ex-OH Maser
G141.918+1.902. At this location, we detected new 6031 and 6035 MHz ex-OH masers (see also below) in the velocity range of −9 to −7 km s−1. No other maser species was found within 5' at this position.
3.1.3. 6035 MHz Ex-OH Maser
G76.093+0.158. We detected a new 6035 MHz OH maser, and Yang et al. (2019) reported the detection of a 6.7 GHz CH3OH maser at this location. The 6035 MHz OH maser has one feature peaked at ∼4 km s−1, while the 6.7 GHz CH3OH maser has two spectral features in the velocity range of 4.3–6.9 km s−1. Urquhart et al. (2011) detected the emissions of NH3 (1, 1) and NH3 (2, 2) but without the H2O maser at this location with the GBT.
G97.527+3.184. A new 6035 MHz OH maser was detected at this location. A significant feature at −72.2 km s−1 and a weaker feature near −75.2 km s−1 were detected. The 6.7 GHz CH3OH maser with three spectral features peaked at −73.0, −70.9, and −69.7 km s−1 was detected by Yang et al. (2019). In addition, Chen et al. (2020) also detected emission from RRLs at this location. Argon et al. (2000) used the Very Large Array to map the ground-state OH maser in this region. Urquhart et al. (2011) detected the emission of the H2O maser and NH3 lines with the GBT. The emission of the water maser is in a wider velocity range from −111.5 to −52.6 km s−1.
G141.918+1.902. This location only has the 6031 and 6035 MHz ex-OH masers, and no other maser species has been reported. Compared with the 6031 MHz maser, the 6035 MHz has a stronger flux density in both LHCP and RHCP.
G163.078−1.926. At this location, broad line profiles (with a line width of a few kilometers per second) of the 6035 MHz OH were detected with peaks at −14.0 km s−1 in both the LHCP and RHCP. No other maser species has been reported in this position.
G211.567−19.295. We detected the emission of the 6035 MHz ex-OH maser at this position, with one feature peaked at around 2.4 and 2.0 km s−1 for the LHCP and RHCP, respectively. The emission in LHCP is 1 order of magnitude stronger than that in RHCP. Wouterloot & Walmsley (1986) detected a H2O maser at the velocity range of 2–7 km s−1.
3.2. The Previously Detected Sources
3.2.1. 4766 MHz Ex-OH Maser
G43.148+0.013. This maser is close to the well-known MSFR W49SW, which is one of three clusters in W49. Harvey-Smith & Cohen (2005) detected the 4766 MHz OH maser, with the peak at 8.6 km s−1, somewhat different from our observations (peak at 11.8 km s−1), but their flux densities are similar. This maser site is associated with the 6.7 GHz CH3OH maser and the emission of RRLs (Yang et al. 2019; Chen et al. 2020).
G81.752+0.591. This maser site is associated with the 6.7 GHz CH3OH maser and the emission of RRLs (Yang et al. 2019; Chen et al. 2020). The 4766 MHz maser was first detected by Harvey-Smith & Cohen (2005). Compared with our observations, the velocity at the peak of this maser varied from 5 to 4 km s−1.
G81.871+0.779. This maser site is near W75N. The 4766 MHz maser with a feature peaked at 9.4 km s−1 was reported by Palmer et al. (2004). In contrast, our observation detected the features peaked at 8.8 and 7.9 km s−1 for LHCP and RHCP, respectively. In addition, the 6.7 GHz CH3OH maser and the emission of RRLs were detected in this position (Yang et al. 2019; Chen et al. 2020).
G111.526+0.803. This maser is located close to NGC 7538. There are many maser species in this source, such as H2CO (Forster et al. 1980), H2O (Kameya et al. 1990), CH3OH (Wilson et al. 1984, 1985; Batrla et al. 1987; Yang et al. 2019), and ground-state OH masers (Downes 1970; Dickel et al. 1982; Hutawarakorn & Cohen 2003). The emission of RRLs was also detected in this source (Chen et al. 2020). The 4766 MHz OH maser with two features in the velocity range from −60 to −56 km s−1 was previously detected by Harvey-Smith & Cohen (2005), which is similar to our observations; we also detected a new feature at the velocity of −61 km s−1.
G213.706−12.602. This maser site is close to Mon R2. It is associated with the 6.7 GHz CH3OH maser and the emission of RRLs, and it is identified as an MSFR located at high latitude (Yang et al. 2019; Chen et al. 2020). The 4766 MHz ex-OH maser was detected by Harvey-Smith & Cohen (2005) with the peak at 10.6 km s−1, which is similar to our observation.
3.2.2. 6031 MHz Ex-OH Maser
G43.148+0.013. Baudry et al. (1997) and Szymczak et al. (2020) detected the 6031 MHz ex-OH maser at this location. Szymczak et al. (2020) detected the peak at 1.3 Jy at 13.2 km s−1 in 2019 April, stronger than our detection of 0.35 Jy in 2016 November. The separation of the targeted positions between the two observations is less than  , suggesting that the increase of the 6031 MHz OH maser emission from 2016 November to 2019 April is reliable.
G45.124+0.136. The ex-OH maser at 6031 MHz was detected by Baudry et al. (1997) with the peak at 53.7 km s−1, which is similar to our observations with the peak at 54.1 km s−1. But only the LHCP for this source was detected in our observation. Meanwhile, the emission of RRLs was detected by Chen et al. (2020) in this position.
G45.454+0.060. The 6031 MHz OH maser was reported by Baudry et al. (1997) and Avison et al. (2016). The 6.7 GHz CH3OH maser and RRLs were also detected in this maser site (Yang et al. 2019; Chen et al. 2020). Comparing with Avison et al. (2016), the ex-OH spectral profiles are stable.
G48.991−0.299. The 6031 MHz OH maser of this source was detected by Baudry et al. (1997). Compared with their detections, there is no significant change in the peak velocity but a significant change in the spectral profile. Meanwhile, the 6.7 GHz CH3OH maser and the emission of RRLs were detected by Yang et al. (2019) and Chen et al. (2020) in this position.
G49.466−0.408. This maser site is close to source W51. The 6031 MHz ex-OH maser was detected by Baudry et al. (1997) and Avison et al. (2016). Notably, the targeted position in our observation has an offset of  from their targeted positions; thus, our detection is actually covered by the side lobe of the telescope. Compared with the observation of Avison et al. (2016), the peak velocity has not changed, but the spectral profile has changed; both the LHCP and RHCP were detected in our observations, but only the RHCP was detected in their observations. The 6.7 GHz CH3OH maser and RRLs were also detected in this maser site (Yang et al. 2019; Chen et al. 2020).
G69.543−0.973. This source detected the 6031 MHz ex-OH maser (Baudry et al. 1997), with a similar velocity range to our observations. It is also found to be associated with the 6.7 GHz CH3OH masers (Yang et al. 2019).
G80.865+0.420. Baudry et al. (1997) detected the 6031 MHz ex-OH maser. This maser has a narrow feature in the velocity range of −12 to −10 km s−1. The 6.7 GHz CH3OH maser and RRLs were also detected in this location (Yang et al.2019; Chen et al. 2020).
G111.526+0.803. The 6031 MHz ex-OH maser was reported by Fish et al. (2006). Both Baudry et al. (1997) and Szymczak et al. (2020) made observations of the 6031 MHz ex-OH maser from this source, but neither of them detected this transition. Compared with the results of Fish et al. (2006), the peak velocity is similar to our observation (LHCP and RHCP peaked at −58.7 and −59.2 km s−1, respectively).
3.2.3. 6035 MHz Ex-OH Maser
G20.234+0.085. The 6035 MHz OH spectrum of this source detected in our observations is similar to that measured by Caswell (2001) and Avison et al. (2016). Notably, the 6031 MHz ex-OH maser with the peak flux density of ∼0.2 Jy was previously detected by Caswell (2003) and Avison et al. (2016), but this transition was not detected in our observation. Compared with the observation result of Avison et al. (2016), the spectral profiles are stable with the peak at 71.34 km s−1. The 6.7 GHz CH3OH maser was also detected in this location (Yang et al. 2019).
G24.148−0.009. The ex-OH maser at 6035 MHz was previously detected by Avison et al. (2016), and a 6.7 GHz CH3OH maser was also detected in this location (Yang et al. 2019), but no 6031 MHz OH maser was detected from our survey. Compared with the survey of Avison et al. (2016), the flux density of the 6035 MHz OH maser decreases greatly from 6.7 to 2.4 Jy on the RHCP, while the flux density on the LHCP is relatively stable (from 0.27 to 0.22 Jy).
G24.790+0.084. The 6035 MHz OH maser was detected by Ouyang et al. (2019). The 6.7 GHz CH3OH maser and RRLs were also detected from this source (Yang et al. 2019; Chen et al. 2020). The emission of the 6035 MHz OH maser is completely polarized and has two narrow features in the velocity range from 112 to 114 km s−1 that are only seen on the RHCP.
G25.649+1.049. The ex-OH maser at 6035 MHz was previously detected by Avison et al. (2016). Compared with their results, this maser shows a similar and stable spectral profile with a narrow feature peaked at 39.4 km s−1. In addition, the 6.7 GHz CH3OH maser was also detected in this location (Yang et al. 2019).
G25.709+0.044. The 6035 MHz ex-OH maser was first detected by Ouyang et al. (2019). Compared with their results, this maser is stable between the two observations and has three features in the velocity range from 92 to 96 km s−1. The 6.7 GHz CH3OH maser and RRLs were also detected in this source (Yang et al. 2019; Chen et al. 2020).
G28.147−0.004. The 6035 MHz ex-OH maser was first detected by Szymczak et al. (2020) in 2020 January with a narrow feature peaked at 101.5 km s−1; this is consistent with our observation. In addition, the 6.7 GHz CH3OH maser and RRLs were detected at this location (Yang et al. 2019; Chen et al. 2020).
G28.180−0.093. The ex-OH maser at 6035 MHz was previously detected by Caswell & Vaile (1995) and Caswell (2001). Our observations detected two spectral features in the velocity range from 94 to 98 km s−1, which is similar to that of Caswell (2001). Yang et al. (2019) detected the 6.7 GHz CH3OH maser in this source.
G30.770−0.804. The 6035 MHz ex-OH maser was detected by Avison et al. (2016) in this position, along with a 6.7 GHz CH3OH maser (Yang et al. 2019). This OH maser only has a narrow feature.
G32.744−0.075. This 6035 MHz ex-OH maser was detected by Caswell (2001, 2003) and Avison et al. (2016). Our observations detected many features in the range of 30–40 km s−1, which is consistent with the observation of Avison et al. (2016).
G35.141−0.750. The 6035 MHz ex-OH maser was reported by Avison et al. (2016). Unlike the two spectral features detected by Avison et al. (2016), only a single narrow feature was detected in our observations. But the velocity at peak is similar in both observations, peaking around 36 km s−1. Meanwhile, a 6.7 GHz CH3OH maser was also detected in this location (Yang et al. 2019).
G43.148+0.013. Caswell (2001) and Avison et al. (2016) detected the 6035 MHz ex-OH maser at this position. There are many features in the velocity range from 9 to 19 km s−1 detected in our observations, which is similar to that in Avison et al. (2016).
G45.124+0.136. The 6035 MHz ex-OH maser was detected by Baudry et al. (1997), Caswell (2001), and Avison et al. (2016). Our observations show that the OH spectrum has a similar velocity at the peak to that in Caswell (2001), both peaking at ∼54 km s−1. However, it is mysterious that the OH maser spectrum changed toward the redshifted side, with the peak moving to ∼67 km s−1 detected in the Avison et al. (2016) observations. Such a phenomenon may suggest a binary protostar system in this region. De la Fuente et al. (2020) reported four UC H ii regions detected at least in this location, and G45.12+0.13 showed extended emission.
G45.454+0.060. The 6035 MHz ex-OH maser was detected by Baudry et al. (1997) and Avison et al. (2016). There are many features in the velocity range from 62 to 69 km s−1 in our detections. Compared with the result of Avison et al. (2016), the spectral profile was changed, and the flux density at peak (∼65 km s−1) was increased from 7.5 to 17.8 Jy.
G48.991−0.299. The ex-OH maser at 6035 MHz was detected by Baudry et al. (1997) and Avison et al. (2016). There are many features in the velocity range from 65.4 to 71.2 km s−1, which is similar to the result of Avison et al. (2016). The 6.7 GHz CH3OH maser and RRLs were also detected at this position (Yang et al. 2019; Chen et al. 2020).
G49.466−0.408. This maser site is near the famous MSFR W51. The 6035 MHz ex-OH maser was detected by Baudry et al. (1997) and Avison et al. (2016). There are many features in the velocity range from 50 to 60 km s−1, which is similar to the results of Avison et al. (2016).
G69.543−0.973. The ex-OH maser at 6035 MHz was detected by Szymczak et al. (2020). Compared with their results, the ex-OH spectral profiles and flux densities are similar, with many features in a large velocity range from −2 to 16 km s−1 in both observations, suggesting that the OH maser was stable during the two observations from 2016 August (our observations) to 2019 March (observations of Szymczak et al. 2020). It is also associated with the 6.7 GHz CH3OH masers (Yang et al. 2019).
G80.865+0.420. The 6035 MHz ex-OH maser was detected by Baudry et al. (1997) and Szymczak et al. (2020). Our observations show that the spectral profile and peak flux density of the OH maser are similar to that in Baudry et al. (1997). However, the narrow feature near −1 km s−1 detected by Szymczak et al. (2020) was not detected in our observations, possibly due to different targeted positions with an angular separation of ∼2 5 in these observations. The 6.7 GHz CH3OH maser and RRLs were also detected in this location (Yang et al. 2019; Chen et al. 2020).
G81.752+0.591. The 6035 MHz ex-OH maser was detected by Baudry et al. (1997). Similar to their results, our detection shows the maser spectrum with two features in the range from −10 to −2 km s−1. This maser site is also associated with the 6.7 GHz CH3OH maser and RRL emission (Yang et al. 2019; Chen et al. 2020).
G81.871+0.779. The 6035 MHz ex-OH maser was detected by Baudry et al. (1997) and Szymczak et al. (2020). This maser has many spectral features in the velocity range from 5 to 10 km s−1. Compared with the recent detections in 2019 April by Szymczak et al. (2020), the spectral profiles have obviously changed in both the RHCP and LHCP, but the velocity range is similar in the two observations. This maser site is also associated with the 6.7 GHz CH3OH maser and RRL emission (Yang et al. 2019; Chen et al. 2020).
G85.394−0.024. The 6035 MHz maser was detected by Szymczak et al. (2020) and Patoka et al. (2021). A similar narrow spectrum peaked at −33.1 km s−1 was detected in these observations. However, the peak flux densities are different in these observations, possibly due to the different targeted positions used. This maser site is also associated with the 6.7 GHz CH3OH maser and H ii (Urquhart et al. 2009; Szymczak et al. 2012; Hu et al. 2016; Yang et al. 2019).
G90.921+1.487. The 6035 MHz ex-OH maser was detected by Szymczak et al. (2020) and Patoka et al. (2021). Compared to the observation of Szymczak et al. (2020), the spectral profile is stable, with a narrow feature peaked at −69.3 km s−1. However, the peak flux densities changed from ∼0.6 Jy (in our observations; 2016 August) to ∼2 Jy (in the observations of Szymczak et al. 2020; 2020 April). Such variability should be real because the targeted positions are spatially coincident, with a separation of less than 5'' between the two observations. This maser site is also associated with the 6.7 GHz CH3OH maser and H ii region (Szymczak et al. 2012; Hu et al. 2016; Yang et al. 2019).
G98.036+1.446. The 6035 MHz ex-OH maser was detected by Baudry et al. (1997) and Szymczak et al. (2020). Compared with the results of Baudry et al. (1997), a new feature near 63 km s−1 was detected in our observation and that of Szymczak et al. (2020). The spectral profiles and flux densities are also similar in both recent observations. This maser site is also associated with the 6.7 GHz CH3OH maser (Yang et al. 2019).
G108.758−0.986. The 6035 MHz maser was detected by Szymczak et al. (2020). We detected the double features around the velocity of −46.1 km s−1, which is similar to the spectral profile in Szymczak et al. (2020). However, the OH maser intensity is different (∼1 Jy in our observations versus ∼2 Jy in the observations of Szymczak et al. 2020), possibly due to the different targeted positions with an angular separation of ∼1' used in the two observations. This maser site is also associated with the 6.7 GHz CH3OH maser (Szymczak et al. 2012; Yang et al. 2019).
G111.532+0.759. The 6035 MHz ex-OH maser close to NGC 7538 was detected by Guilloteau et al. (1984), Baudry et al. (1997), and Szymczak et al. (2020). The spectral profile and intensity of our detection are similar to the recent detection by Szymczak et al. (2020), with two narrow features peaking at −60.3 and −58.5 km s−1. In addition, the 6.7 GHz CH3OH maser and RRLs were also detected in this location (Yang et al.2019; Chen et al. 2020).
G183.349−0.575. The 6035 MHz ex-OH maser was detected by Szymczak et al. (2020). Compared to their results, we found that the peak flux densities changed strangely, from ∼0.7 Jy in 2016 August (our observations) to ∼3.5 Jy in 2019 March (the observations of Szymczak et al. 2020) on the LHCP and from ∼0.4 Jy in our observation to ∼0.8 Jy in their observation on the RHCP. In addition, the single spectral feature seen in the RHCP moved from −6.1 to −5.3 km s−1 in the two observations. Such changes should be real, since the separation of the targeted positions between the two observations is less than 2''. This maser site is also associated with the 6.7 GHz CH3OH maser (Szymczak et al. 2012; Yang et al. 2019).
3.3. Variability of Ex-OH Masers
To investigate the variabilities of the detected ex-OH masers more accurately, we compared our ex-OH maser detections with the 6035 MHz ex-OH maser catalog, which was observed at a high position accuracy with the ATCA observations by Avison et al. (2016). We matched the sources detected in our observations to their catalog using a criterion of angular separation of less than 26 (corresponding to the TMRT beam size). A total of 12 maser sources were matched (see Table 3, marked with superscript 2). In Figure 5, we compared the changes in the peak flux densities of these 12 sources between our observations and the Avison et al. (2016) observations. The observations of these masers were made in 2009 and 2013 by Avison et al. (2016), while ours were made between 2016 and 2017. It was found that the majority of them show significant flux density changes in both the LHCP and RHCP, even with different variability behaviors in the two circular polarization spectra. The 6035 MHz ex-OH maser emissions are relatively stable (with flux changes of less than 30%) in only three sources (G30.770−0.804, G32.744−0.075, and G43.148+0.013) during the two observations.

Figure 5. Flux density variations of the 12 6035 MHz ex-OH masers that have high positional accuracy measurements with the ATCA provided in Avison et al. (2016).
Download figure:
Standard image High-resolution imageWe also collected the observational data of Caswell (2001) and Caswell & Vaile (1995) using ATCA, and there are three sources that have 6035 MHz ex-OH maser data reported over these years. Figure 6 shows the variability of the 6035 MHz OH maser during the past 23 yr for the three sources. We found that the flux density of ex-OH masers changed significantly but did not show a periodic trend.

Figure 6. Long-term variability of the peak flux densities of the 6035 MHz ex-OH masers on the LHCP and RHCP for the three sources that have high positional accuracy measurements.
Download figure:
Standard image High-resolution image3.4. Detection Rates of the Ex-OH Maser
In general, the detection rates of the ex-OH masers in our observed samples are very low, with an overall detection rate of less than 1%. In order to check the properties of the ex-OH masers in a limited number of maser detections (less than or equal to 30), we divided the observed data into three different subsamples for statistical analysis of the ex-OH maser detections. These subsamples are as follows: those associated with the 6.7 GHz CH3OH masers only (137), those associated with RRLs only (414), and those associated with both the 6.7 GHz CH3OH masers and RRLs (103; see Table 4 of Chen et al.2020 for more detailed information). The RRL data we used were the emission from MSFRs observed with TMRT by Chen et al. (2020). As shown in Table 4, all of the ex-OH maser transitions have the highest detection rates in the subsamples associated with both the 6.7 GHz CH3OH masers and RRLs (4.85%, 3.88%, and 11.65% for 4766, 6031, and 6035 MHz, respectively). It is a possibility that sources associated with both the CH3OH maser and RRL emission are more likely to be at the relatively late evolutionary stage of high-mass star formation, when the ex-OH maser is easily pumped. These results are consistent with the interstellar maser evolutionary sequence proposed by Breen et al. (2010) that OH masers are generally excited at more evolved stages of high-mass star formation. We will further discuss the evolutionary stage of the ex-OH masers in Section 4.1.
Table 4. Summary of Detections
| Subsample | Sample Size | 4765.562 | 6030.747 | 6035.092 |
|---|---|---|---|---|
| (1) | (2) | (3) | (4) | (5) |
| CH3OH only | 137 | 0(0.00%) | 1(0.73%) | 10(7.30%) |
| RRLs only | 414 | 1(0.24%) | 3(0.72%) | 2(0.48%) |
| CH3OH and RRLs | 103 | 5(4.85%) | 4(3.88%) | 12(11.65%) |
| All sources | 3348 | 6(0.18%) | 9(0.27%) | 30(0.90%) |
Note. Column (1): subsamples associated with different tracers. Column (2): size of subsample. Columns (3)–(5): detected number (rate) of the line ex-OH masers.
Download table as: ASCIITypeset image
4. Discussion
4.1. Evolutionary Stage of Ex-OH Masers
In Figure 7 (left panel), we plotted the [3.4]–[4.6] versus [12]–[22] color–color diagram of the observed WISE sources with and without ex-OH maser detections. Because the sources we selected were themselves redder in the IR wavelength ([3.4]–[4.6] > 2 and [12]–[22] > 2), we did not find a significant distribution difference in the color–color diagram between the sources associated with and without the ex-OH masers. Qiao et al. (2014) reported that the colors of the WISE sources associated with the ground-state OH masers are much redder than those associated with the 6.7 GHz CH3OH masers. In the right panel of Figure 7, we present the [3.4]–[4.6] versus [12]–[22] color–color diagram of WISE point sources associated with the CH3OH masers, ex-OH masers, and RRLs. However, we did not find obvious distribution differences between the WISE point sources associated with the ex-OH maser and those associated with the CH3OH maser or RRLs.

Figure 7. Color–color diagram of the WISE point sources associated with different MSFR tracers. The red dots in the left panel represent the 3348 WISE point sources we selected to be observed. The WISE point sources associated with different tracers of MSFR are shown in the legend. The dashed lines represent the WISE color criteria: [3.4]–[4.6] = 2 and [12]–[22] = 2 (see Yang et al. 2017).
Download figure:
Standard image High-resolution imageFigure 8 shows the [3.4]–[4.6] versus 22 μm color–magnitude diagram for sources associated with CH3OH masers, ex-OH masers, and RRLs. Overall, no significant differences can be clearly seen in the color–magnitude distributions of the WISE point sources associated with CH3OH masers, ex-OH masers, and RRLs. In the top panel of Figure 8, we plot the 22 μm magnitude distributions and find that the 22 μm mean magnitude of the WISE point sources associated with the ex-OH masers is generally smaller than that of those associated with the CH3OH masers. This may suggest that the sources associated with ex-OH masers are more evolved or have thicker dust envelopes compared to those associated with CH3OH masers. Meanwhile, the 22 μm magnitudes of WISE point sources only associated with RRLs are located toward a larger magnitude direction. It suggests that the majority of these sources compared to those associated with ex-OH and CH3OH masers may be produced at a more evolved stage of high-mass star formation, on the basis that the MIR emission will be decreased as the young stellar objects evolve. In the right panel of Figure 8, the distributions of WISE [3.4]–[4.6] color associated with CH3OH masers, ex-OH masers, and RRLs are shown as comparisons. It can be seen that the majority of the RRL sources have smaller [3.4]–[4.6] color than the CH3OH and OH maser sources, further supporting that the RRL sources may be at more evolved stages.

Figure 8. WISE [3.4]–[4.6] vs. 22 μm color−magnitude diagram for sources associated with the 6035 MHz ex-OH masers, 6.7 GHz CH3OH masers, and RRLs. WISE point sources associated with different maser species are shown in the legend. The distributions of sources associated with RRLs are given with red histograms, those with 6.7 GHz CH3OH masers are given with green histograms, and those with ex-OH masers are given with blue histograms. The red, green, and blue lines mark the average positions of the corresponding distributions.
Download figure:
Standard image High-resolution imageWe plot the RRL luminosity distributions for the sources associated with RRLs only, both RRLs and CH3OH masers, and both RRLs and ex-OH masers in Figure 9. It can be seen that the emission of CH3OH and ex-OH masers is likely to be produced toward the sources with higher RRL luminosity. In addition, we also found that among the detected 30 6035 MHz ex-OH masers, the average peak luminosity of the 13 ex-OH masers associated with RRL emission was about 63 Jy kpc2, which is 1 order of magnitude stronger than that of the remaining 17 ex-OH masers without RRL emission (∼6 Jy kpc2). This further supports that the luminous ex-OH masers are usually produced from sources with luminous RRL emission. Ouyang et al. (2019) pointed out that the 6.7 GHz CH3OH maser is more likely produced in the regions with brighter RRLs and higher radio continuum emission. Similar to the CH3OH masers, from the above results, we can conclude that the regions with stronger RRL emission are conducive to the production of ex-OH masers.
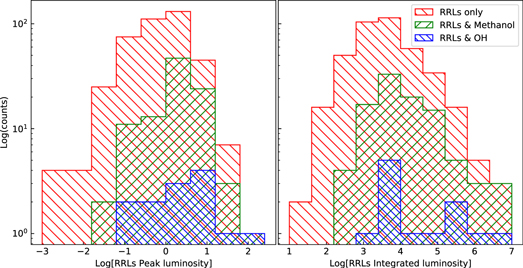
Figure 9. Statistical histograms of the RRL luminosities in different subsamples. The red, green, and blue histograms represent the RRL luminosity distributions for sources associated with RRLs only, CH3OH masers, and ex-OH masers, respectively. The RRL luminosity is in units of K kpc2 km s−1 (for integrated luminosity) or K kpc2 (for peak luminosity).
Download figure:
Standard image High-resolution imageIt is also worth noting that, as shown in Table 3, among the 33 sources with the ex-OH maser detected (including the 4766, 6031, and 6035 MHz transitions), 28 sources were also detected with the 6.7 GHz CH3OH masers, and 16 were also detected with RRLs. This indicates that the ex-OH maser is more likely related to the CH3OH maser compared to the RRL. This also suggests that the ex-OH masers may be produced at evolutionary stages associated with CH3OH masers, and both are earlier than those only associated with RRLs.
The RRL line FWHM distributions for the sources associated with RRLs only, CH3OH masers, and ex-OH masers are given in Figure 10. Only the brightest RRL component is considered if there are multiple RRL velocity components detected in the same source. It was found that the median FWHM line widths of RRLs are similar for these sources, with 23.5, 25.2, and 25.1 km s−1 for the sources associated with RRLs only, CH3OH masers, and ex-OH masers, respectively. A large sample study showed that the typical RRL line width is ∼24 km s−1 (Wenger et al. 2021), which is overall similar to our results. However, it can be seen from Figure 10 that the RRL line widths for the sources associated with the ex-OH masers are usually smaller than 40 km s−1. In addition, the RRL line widths have a wider range for sources associated with RRLs only. This also supports that the RRL-only sources may be at a more evolved stage on the assumption that, with the expansion of the H ii region, stronger turbulence will lead to an increase in the RLL line widths. The Cragg et al. (2002) model suggested that the 6035 MHz ex-OH maser is more likely to appear in the region with a low temperature and high density. With the evolution toward a more expanded H ii region, it is possible that the gas temperature would increase and gas density decrease in this region, so the ex-OH maser would gradually disappear in such an environment.
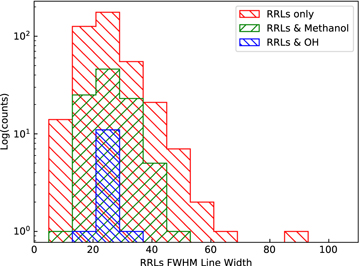
Figure 10. The RRL FWHM line width distributions for different subsamples. The red, green, and blue histograms represent the sources associated with RRLs only, CH3OH masers, and ex-OH masers, respectively.
Download figure:
Standard image High-resolution image4.2. Distance and Galactic Distribution
In this work, we calculate the distances of the ex-OH maser sites and their distributions in the Milky Way using the Parallax-Based Distance Calculator V2 (PBDCV2 11 ; Reid et al. 2019), which is an updated version from the old version presented by Reid et al. (2016). The median velocities derived from the 6035, 6030, or 4765 MHz ex-OH maser spectra were used to calculate the distances and spiral arm assignments of the sources in the Milky Way. We adopted the distances and spiral arm assignments with the best probability from the PBDCV2. The distance parameters and their associated spiral arms are presented in columns (3)–(6) of Table 5. Notably, for six sources (G32.744−0.075, G43.148+0.013, G45.454+0.060, G69.543−0.973, G111.526+0.803, and G111.532+0.759) with distances determined through maser trigonometric parallax measurements, we adopted their trigonometric parallax distances. These sources are marked with a numerical superscript in column (1) of Table 5.
Table 5. Distance and Luminosity Properties of the Ex-OH Maser Sources in Our Survey
| Source | Frequency | Distance | Error | Arm | Prob. | log(Lp ) | log(Li ) |
|---|---|---|---|---|---|---|---|
| (1) | (2) | (3) | (4) | (5) | (6) | (7) | (8) |
| G20.234+0.085 | 6035 | 4.33 | 0.41 | N1N | 0.91 | 1.78 | 1.44 |
| 6669 | 1.61 | 2.84 | |||||
| G24.148−0.009 | 6035 | 1.69 | 0.27 | SgN | 0.59 | 0.57 | 0.29 |
| 6669 | 1.12 | 1.74 | |||||
| G24.790+0.084 | 6035 | 6.68 | 0.99 | N1F | 0.92 | 1.34 | 1.19 |
| 6669 | 2.59 | 3.73 | |||||
| RRL | 0.51 | 1.9 | |||||
| G25.649+1.049 | 6035 | 3.52 | 1.25 | ... | 0.53 | 1.04 | 0.85 |
| 6669 | 2.82 | 2.86 | |||||
| G25.709+0.044 | 6035 | 5.81 | 0.58 | N1N | 0.76 | 1.49 | 1.60 |
| 6669 | 2.96 | 4.05 | |||||
| RRL | −0.07 | 1.34 | |||||
| G28.147−0.004 | 6035 | 8.24 | 0.44 | ScF | 0.58 | 1.86 | 1.25 |
| 6669 | 1.90 | 3.13 | |||||
| RRL | 0.17 | 1.60 | |||||
| G28.180−0.093 | 6035 | 8.22 | 0.44 | ScF | 0.58 | 1.54 | 1.63 |
| 6669 | 0.11 | 1.31 | |||||
| G30.770−0.804 | 6035 | 3.68 | 0.36 | ScN | 0.77 | 0.88 | 0.43 |
| 6669 | 1.52 | 2.48 | |||||
| G32.744−0.0751 | 6035 | 2.17 | 0.26 | 0.37 | 0.59 | ||
| G35.141−0.750 | 6035 | 2.35 | 0.24 | SgN | 1 | 0.40 | 0.00 |
| 6669 | 1.33 | 2.36 | |||||
| G43.148+0.0132 | 6035 | 10.86 | 0.38 | 2.54 | 2.65 | ||
| 6031 | 1.49 | 1.11 | |||||
| 6669 | 2.09 | 3.89 | |||||
| RRL | 2.21 | 3.69 | |||||
| G45.124+0.136 | 6035 | 7.55 | 0.55 | SgF | 2.10 | 2.12 | |
| 6031 | 0.99 | 0.90 | |||||
| RRL | 0.85 | 2.40 | |||||
| G45.454+0.0603 | 6035 | 6.82 | 0.73 | 2.77 | 2.64 | ||
| 6031 | 1.74 | 1.42 | |||||
| 6669 | 1.10 | 2.30 | |||||
| RRL | 0.99 | 2.45 | |||||
| G48.991−0.299 | 6035 | 5.49 | 0.46 | SgF | 1 | 2.01 | 1.87 |
| 6031 | 1.21 | 1.12 | |||||
| 6669 | 0.04 | 1.07 | |||||
| RRL | 0.83 | 2.35 | |||||
| G49.466−0.408 | 6035 | 5.47 | 0.32 | SgF | 0.89 | 1.93 | 2.08 |
| 6031 | 1.40 | 0.94 | |||||
| 6669 | 2.49 | 3.65 | |||||
| RRL | 1.43 | 2.91 | |||||
| G69.543−0.9734 | 6035 | 4.02 | 0.61 | 2.24 | 2.11 | ||
| 6031 | 1.61 | 1.21 | |||||
| 6669 | 2.43 | 2.85 | |||||
| G76.093+0.158 | 6035 | 3.26 | 0.4 | Loc | 0.98 | 0.64 | 0.17 |
| 6669 | −0.12 | 0.52 | |||||
| G80.865+0.420 | 6035 | 2.38 | 0.57 | Loc | 0.39 | 1.28 | 1.08 |
| 6031 | 0.93 | 0.38 | |||||
| RRL | −0.78 | 0.68 | |||||
| G81.752+0.591 | 6035 | 1.56 | 0.12 | Loc | 0.48 | 0.60 | 0.39 |
| 6669 | 0.46 | 1.70 | |||||
| RRL | −0.94 | 0.48 | |||||
| G81.871+0.779 | 6035 | 2.18 | 0.4 | Loc | 0.55 | 1.49 | 1.36 |
| 6669 | 2.47 | 3.29 | |||||
| RRL | −0.72 | 0.51 | |||||
| G84.951−0.691 | 4765 | 5.06 | 0.45 | Per | 1 | 1.42 | 0.98 |
| G85.394−0.024 | 6035 | 4.98 | 0.48 | Per | 1 | 1.04 | 0.58 |
| 6669 | 1.72 | 2.48 | |||||
| G90.921+1.487 | 6035 | 7.71 | 1.09 | Out | 1 | 1.53 | 1.34 |
| 6669 | 2.58 | 3.29 | |||||
| G97.527+3.184 | 6035 | 7.54 | 0.85 | Out | 1 | 2.41 | 1.94 |
| 6669 | 0.88 | 1.97 | |||||
| RRL | 0.19 | 1.62 | |||||
| G98.036+1.446 | 6035 | 6.59 | 1.07 | ... | 0.88 | 1.77 | 1.32 |
| 6669 | 1.20 | 1.63 | |||||
| G108.758−0.986 | 6035 | 2.8 | 0.22 | Per | 0.6 | 0.67 | 0.41 |
| 6669 | 0.68 | 1.53 | |||||
| G111.526+0.8035 | 6030 | 2.69 | 0.13 | −0.01 | −0.01 | ||
| G111.532+0.7595 | 6035 | 2.69 | 0.13 | 0.99 | 0.79 | ||
| 6669 | 1.78 | 3.39 | |||||
| RRL | −0.35 | 1.12 | |||||
| G141.918+1.902 | 6035 | 0.5 | 0.16 | ... | 0.82 | −0.86 | −1.00 |
| 6031 | −1.22 | −1.39 | |||||
| G163.078−1.926 | 6035 | 1.91 | 0.39 | Per | 0.75 | 0.03 | 0.35 |
| G183.349−0.575 | 6035 | 1.59 | 0.03 | Per | 0.75 | 0.15 | −0.32 |
| 6669 | −0.15 | 1.50 | |||||
| G211.567−19.295 | 6035 | 0.86 | 0.02 | ... | 0.5 | 0.53 | −0.06 |
| G213.706−12.602 | 4765 | 0.84 | 0.12 | ... | 1 | −0.31 | −0.43 |
Note. Column (1): source name. Column (2): denotation for tracers. Columns (3) and (4): distances of sources with their uncertainties in units of kiloparsecs. Column (5): spiral arm assignment of the source: ... (no assignment), Loc (Local Arm), Out (Outer arm), Per (Perseus arm), ScF (Scutum far), ScN (Scutum near), SgF (Sagittarius far), SgN (Sagittarius near), N1N (Norma near), and N1F (Norma far). Column (6): probability of sources in the spiral arms. Columns (7) and (8): integrated and peak luminosities (maser luminosity in units of Jy kpc2 and Jy km s−1 kpc2, RRL in units of K kpc2 and K km s−1 kpc2). The numerical superscripts in column (1) indicate that we adopted the trigonometric parallax distances for them: 1 (Wu et al. 2019), 2 (Zhang et al. 2013), 3 (Wu et al. 2014), 4 (Xu et al. 2013), and 5 (Moscadelli et al. 2009).
In addition to the ex-OH maser sources detected in our survey, we also collected the known ex-OH maser sources from the catalogs of Qiao et al. (2014), Avison et al. (2016), and Szymczak et al. (2020). We recalculated the distances and spiral arm assignments of these maser sources using PBDCV2.
Figure 11 shows the Galactic distributions of the 6031 and 6035 MHz ex-OH masers detected in our survey and collected from previous works. As shown in the top panel, most of the ex-OH maser sites were distributed at lower latitudes with  , while at higher latitudes with
  , only five ex-OH maser sites were detected. From the overall Galactic plane distributions shown in the bottom panel of Figure 11, the majority of the ex-OH maser sources are distributed on the spiral arms of the Milky Way. Notably, the 6031 MHz OH masers (blue plus signs) are mostly distributed in the regions close to us, which may be due to the relatively low luminosities of the 6031 MHz OH masers themselves. Most of the sources we detected in this work (blue plus signs and circles) are located in the first and second quadrants of the Milky Way and associated with the Perseus and Sagittarius arms.

Figure 11. Galactic distributions of the 6031 and 6035 MHz ex-OH masers. Top panel: Galactic coordinate distribution of the ex-OH maser sources detected in our observations and collected from other maser catalogs. The dotted lines define the Galactic latitude range of ±2°. Bottom panel: Galactic plane distributions of the corresponding ex-OH maser sources. (Background image of the Milky Way credit: Xing-Wu Zheng and Mark Reid BeSSeL/NJU/CFA.) The yellow circle represents the position of the Sun, and the red cross represents the Galactic center.
Download figure:
Standard image High-resolution image4.3. The Relation of Luminosity
Based on the distance calculated by PBDCV2 described in Section 4.2, we can derive the peak and integrated luminosities of the ex-OH masers detected in our survey (calculated by averaging the peaks and integrated flux densities of the LHCP and RHCP), and the results are given in columns (7) and (8) of Table 5. We compared the luminosity relations among those of the 4766, 6031, and 6035 MHz ex-OH masers; the 6.7 GHz CH3OH masers; and the RRLs. Figure 12(a) shows a strong luminosity correlation between the 6035 and 6031 MHz ex-OH masers, with a correlation coefficient of 0.98 in both the peak and integrated luminosity relations. The fitting results of the luminosity relationships are summarized in Table 6. Such a luminosity correlation between the two transitions is theoretically reasonable because they have a similar excitation environment as their pumping models (Cragg et al. 2002). In this work, the 6031 and 6035 MHz OH masers were simultaneously observed at eight sources, and the peak flux density (the mean of RHCP and LHCP) of the 6035 MHz maser was higher by a factor of ∼2 than that of the 6031 MHz maser in all of these sources. This result supports the ex-OH maser model results (Cragg et al. 2002) and is also consistent with the majority of the previous observation results (Gray et al. 1992; Baudry et al. 1997; Desmurs & Baudry 1998; Caswell 2003).
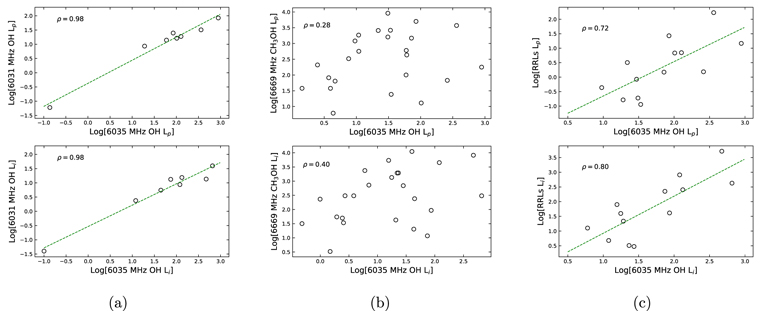
Figure 12. Correlation analysis for luminosities of different MFSR tracers. (a) Log–log relations of luminosities between the 6035 and 6031 MHz OH masers. (b) Log–log relations of luminosities between the 6035 MHz OH masers and 6669 MHz CH3OH masers. (c) Log–log relations of luminosities between the RRLs and 6035 MHz OH masers. Maser luminosity is in units of Jy kpc2 km s−1 (for integrated luminosity) or Jy kpc2 (for peak luminosity); RRL luminosity is in units of K kpc2 km s−1 (for integrated luminosity) or K kpc2 (for peak luminosity).
Download figure:
Standard image High-resolution imageTable 6. The Results of the Best Linear Fits to the Log–Log Luminosity Relations of Different Tracers
| Plot (log–log) of Luminosity | Sample Size | ρ | Slope | Error | y-intercept | Error |
|---|---|---|---|---|---|---|
| (1) | (2) | (3) | (4) | (5) | (6) | (7) |
| 6035 MHz peak vs. 6031 MHz peak | 8 | 0.98 | 0.81 | 0.06 | −0.37 | 0.12 |
| 6035 MHz integrated vs. 6031 MHz integrated | 8 | 0.98 | 0.75 | 0.06 | −0.53 | 0.12 |
| 6035 MHz peak vs. 6669 MHz peak | 24 | 0.28 | 0.35 | 0.25 | 2.02 | 0.39 |
| 6035 MHz integrated vs. 6669 MHz integrated | 24 | 0.40 | 0.48 | 0.23 | 1.92 | 0.32 |
| 6035 MHz peak vs. RRL MHz peak | 13 | 0.72 | 1.19 | 0.35 | −1.84 | 0.68 |
| 6035 MHz integrated vs. RRL MHz integrated | 13 | 0.80 | 1.26 | 0.29 | −0.34 | 0.52 |
Download table as: ASCIITypeset image
It can be seen from Figure 12(b) that there is no significant luminosity correlation between the 6035 MHz OH maser and the 6.7 GHz CH3OH maser. Avison et al. (2016) compared spatial separations between CH3OH and ex-OH maser pairs and found that the majority of their separations are larger than 0.03 pc. Due to a typical size of the UC H ii region of 0.03 pc (Kurtz 2005), this may indicate that the majority of the CH3OH and ex-OH maser pairs we matched do not originate from the same UC H ii regions. Therefore, it is not surprising to find no luminosity correlation between them in our work.
We plotted the luminosity dependence between the 6035 MHz ex-OH masers and the RRLs in Figure 12(c). It can be seen that there is also a strong luminosity correlation between the 6035 MHz OH masers and RRLs, with peak and integrated luminosity correlation coefficients of 0.72 and 0.80, respectively. This result is consistent with our previous work (Ouyang et al. 2019), further supporting that such a correlation is due to the fact that both the ex-OH masers and RRLs are excited at a more evolved stage of the high-mass star formation.
4.4. Magnetic Field Strength
The polarimetric observations of the ground-state OH masers have been proven as the potential tracer for the large-scale interstellar magnetic field (Green et al. 2012). The ex-OH masers are expected to be closer to the massive young star than the ground-state OH masers, so they may be more sensitive to tracing the magnetic field environments closer to the star than the ground-state OH masers. We can use the following relation to estimate the magnetic field strength derived from the ex-OH maser velocity separation of each Zeeman pair: ΔV km s−1/H (mG) = 0.056 and 0.079 at 6035 and 6031 MHz, respectively (Baudry et al. 1997). In this relation, a magnetic field directed away from the observer is defined as positive; it is also expressed as that the velocity of the RHCP component is toward the redshifted side relative to that of the LHCP. For some masers with multiple features, the Zeeman pair we identified is only for the prominent and easily distinguishable ex-OH maser spectral features. For the identification of the Zeeman pair, we directly use the CLASS command to accurately obtain the peak value and its corresponding center velocity for both the RHCP and LHCP. In this work, we have identified 52 Zeeman pair features in 31 sources (see Table 7), among which two maser sources are fully polarized (G24.790+0.084 and G90.921+1.487). The directions and strengths of the magnetic fields were determined for all of the identified Zeeman pairs and are listed in column (7) of Table 7. For the cases with multiple Zeeman pairs identified in the same source, we present multiple magnetic measurements that are generally coincident in their directions, even with different strengths, except for G45.454+0.060. The magnetic fields have been detected in both positive and negative directions simultaneously in G45.454+0.060 from our observations and Szymczak et al. (2020). We derived the strength of the magnetic field in the range from −6.4 to +6.3 mG and did not find any cases where the strength of the magnetic field is beyond ±10 mG, which is consistent with the results of Caswell (1997).
Table 7. The Ex-OH Zeeman Pairs Identified in Our Survey Sample
| LHCP | RHCP | ||||||
|---|---|---|---|---|---|---|---|
| Source | Vf (km s−1) | Sf (Jy) | Vf (km s−1) | Sf (Jy) | Vd (km s−1) | B (mG) | Reference |
| (1) | (2) | (3) | (4) | (5) | (6) | (7) | (8) |
| G20.234+0.085 | 71.34 | 2.81 | 71.34 | 3.67 | 71.34 | ... | <0.52 |
| G24.148−0.009 | 16.94 | 0.22 | 17.22 | 2.38 | 17.08 | +2.5 | |
| ... | ... | 16.51 | 0.71 | ... | ... | ||
| G24.790+0.084 | ... | ... | 112.78 | 0.49 | ... | ... | |
| G25.649+1.049 | 39.38 | 1.13 | 39.1 | 0.62 | 39.24 | −2.5 | −5.41 |
| G25.709+0.044 | 95.48 | 0.55 | 95.34 | 1.28 | 95.41 | −1.3 | |
| 94.49 | 0.41 | 94.49 | 0.85 | 94.49 | ... | ||
| G28.147−0.004 | 101.25 | 1.27 | 101.25 | 0.85 | 101.25 | ... | |
| G28.180−0.093 | 94.5 | 0.33 | 94.79 | 0.53 | 94.65 | +2.7 | +7.11, +9.02, +6.23, +7.53 |
| 96.21 | 0.5 | 96.21 | 0.35 | 96.21 | ... | ||
| G30.770−0.804 | 76.96 | 0.44 | 77.52 | 0.68 | 77.24 | +5 | |
| G32.744−0.075 | 33.6 | 0.34 | 33.32 | 0.65 | 33.46 | −2.5 | −3.32 |
| G35.141−0.750 | 36.24 | 0.33 | 36.53 | 0.57 | 36.39 | +2.7 | |
| G43.148+0.013 | 11 | 2.89 | 10.72 | 2.97 | 10.86 | −2.5 | −5.51, −4.32 |
| G45.124+0.136 | 53.9 | 2.27 | 53.61 | 2.18 | 53.76 | −2.5 | −2.52 |
| 55.51 | 1.57 | 55.5 | 1.81 | 55.51 | −0.2 | ||
| 54.09 | 0.33 | ... | ... | ... | ... | ||
| G45.454+0.060 | 65.2 | 2.5 | 64.84 | 17.79 | 65.02 | −3.2 | [−3.9, +6.0]1, −3.23 |
| 66.4 | 7.34 | 66.35 | 4.3 | 66.38 | −0.4 | ||
| 67.7 | 2.8 | 68.1 | 3.5 | 67.9 | +3.6 | ||
| 65.46 | 1.17 | 65.18 | 1.21 | 65.32 | −1.8 | ||
| G48.991−0.299 | 67.29 | 1.66 | 67.43 | 5.11 | 67.36 | +1.3 | +2.11 |
| 69.1 | 0.5 | 69.1 | 1.4 | 69.1 | ... | ||
| 68.2 | 0.35 | 68.2 | 0.73 | 68.2 | ... | ||
| G49.466−0.408 | 54.51 | 2.44 | 54.8 | 3.22 | 54.66 | +2.7 | [+2.9, +5.3]1, +5.02, +3.93 |
| 52.2 | 0.5 | 52.5 | 0.72 | 52.35 | +2.7 | ||
| 56.2 | 0.7 | 56.5 | 1.6 | 56.35 | +2.7 | ||
| 57.5 | 1.1 | 57.9 | 1.22 | 57.7 | +3.6 | ||
| 52.43 | 0.84 | 52.71 | 0.82 | 52.57 | +1.8 | ||
| G69.543−0.973 | 14.31 | 5.1 | 14.31 | 16.52 | 14.31 | ... | [−10.1, −0.9]1, [−4.2, −2.7]3 |
| 13.98 | 3.1 | 13.6 | 6.1 | 13.79 | −3.4 | ||
| 14.18 | 1.87 | 13.9 | 3.19 | 14.04 | −1.8 | ||
| G76.093+0.158 | 4.1 | 0.63 | 4.24 | 0.19 | 4.17 | +1.3 | |
| G80.865+0.420 | −9.83 | 4.13 | −9.97 | 2.5 | −9.9 | −1.3 | [−2.9, +1.6]1, [−4.3, −2.7]3 |
| −11.1 | 2 | −11.26 | 2.2 | −11.18 | −1.4 | ||
| −10.96 | 1.38 | −11.11 | 1.66 | −11.04 | −1.0 | ||
| G81.752+0.591 | −2.47 | 1.32 | −2.61 | 1.93 | −2.54 | −1.3 | |
| −9 | 1.02 | −9.14 | 1.7 | −9.07 | −1.3 | ||
| G81.871+0.779 | 8.5 | 0.59 | 9.2 | 1.06 | 8.85 | +6.3 | +7.41, +8.31, +7.83, +7.53 |
| G85.394−0.024 | −32.95 | 0.22 | −33.24 | 0.66 | −33.1 | −2.7 | −1.21 |
| G90.921+1.487 | ... | ... | −69.27 | 0.57 | −34.64 | ... | |
| G97.527+3.184 | −72.13 | 1.42 | −72.13 | 7.72 | −72.13 | ... | |
| G98.036+1.446 | −61.67 | 1.47 | −61.53 | 1.26 | −61.6 | +1.3 | +3.41, +1.11 |
| −62.65 | 0.33 | −62.5 | 0.42 | −62.58 | +1.3 | ||
| G108.758−0.986 | −45.52 | 0.26 | −46.09 | 0.93 | −45.81 | −5.2 | −11.21, −11.41 |
| G111.526+0.803 | −58.74 | 0.15 | −59.17 | 0.12 | −58.96 | −2.8 | |
| G111.532+0.759 | −59.62 | 1.21 | −59.47 | 1.5 | −59.55 | +1.3 | +0.61 |
| G141.918+1.902 | −8.14 | 0.73 | −8.14 | 0.36 | −8.14 | ... | |
| −7.57 | 0.25 | −8 | 0.22 | −7.79 | −2.8 | ||
| G163.078−1.926 | −13.99 | 0.19 | −14.13 | 0.4 | −14.06 | −1.3 | |
| G183.349−0.575 | −5.43 | 0.73 | −6.14 | 0.4 | −5.79 | −6.4 | |
| G211.567−19.295 | 2.42 | 8.2 | 1.99 | 0.91 | 2.21 | −3.8 | |
Note. Column (1): source name. Columns (2)–(5): velocities and flux densities at the peaks of the Zeeman pairs on the LHCP and RHCP. Column (6): demagnetized velocities. Column (7): magnetic field strength measured in this work. Column (8): magnetic field strengths measured previously with references: 1 (Szymczak et al. 2020), 2 (Caswell 2003), and 3 (Baudry et al. 1997).
Download table as: ASCIITypeset image
Compared to the magnetic field strengths measured in previous works from the same sources (see Table 7), our results are within the range of previous measurements but with some changes that are likely caused by the varied velocities in the LHCP and RHCP components. In particular, for source G80.865+0.420, the feature near −1 km s−1 was used to derive the positive magnetic field in the Szymczak et al. (2020) observation but was not detected in our and Baudry et al.'s (1997) observations.
When there are multiple magnetic field strengths determined by multiple Zeeman pairs in the same source, all of the absolute magnetic field strengths are taken as for the subsequent analysis and discussion. Figure 13 shows the Galactic plane distributions of the 48 OH masers with the magnetic field direction measurements from our observations and those extracted directly from other published works (Green et al. 2012, 2015) for the OH masers. Notably, the sources shown in this figure are not a subset of those presented in Figure 11 because it also consists of six additional ground-state OH masers from the published samples. It can be clearly seen from this figure that the sources with negative directions are preferably distributed closer to us (most of them coming from the Local Arm and the tail of the Perseus arm). On the Local Arm and the tail of the Perseus arm, 11 out of 13 Zeeman pairs are negative magnetic fields, while on the other arms, many more sources with positive magnetic fields are presented. Therefore, this suggests that they may be somehow coincident in the direction of the magnetic fields in MSFRs near the solar circle. In contrast, in the tangent of the Sagittarius–Carina spiral arm, Green et al. (2012) found a consistency in the magnetic field directions on the spiral arm (the majority directed away from us, i.e., positive direction; see Figure 6 in their work) using the ground-state OH masers. Linked to our results, we found that the magnetic fields may have a uniform "positive" direction along the Sagittarius–Carina spiral arm from the current measurement data, whereas the Scutum–Centaurus arm seems likely to show a random behavior of the magnetic field directions, seen from combining this work and the Green et al. (2015) results (see Figure 9 in their work) using the ex-OH maser Zeeman measurements. These results suggest that magnetic fields have different properties on each Galactic arm from large-scale views, and the ex-OH masers might be an important supplement to the ground-state OH masers for exploring magnetic field information on the Galactic large scale. Nevertheless, only 48 OH maser sources with magnetic field measurements are included, meaning that the above statistics may be biased. Many more locations with magnetic field measurements using ex-OH or ground-OH masers are required to confirm the large-scale property of the Galaxy magnetic fields.

Figure 13. Galactic plane distributions of sources that have magnetic field direction measurements from ground-state or ex-OH masers. The data include our measurements for the ex-OH masers (red filled circles and blue crosses) and those extracted from Figure 6 of Green et al. (2012) for the ground-state OH masers and Figure 9 of Green et al. (2015) for the ex-OH masers (red open circles and blue plus signs). Red represents a source whose magnetic field direction is positive, and blue represents negative. (Background image of Milky Way credit: Xing-Wu Zheng & Mark Reid BeSSeL/NJU/CFA.) The yellow circle represents the position of the Sun, and the red cross represents the Galactic center.
Download figure:
Standard image High-resolution image
We also compared the absolute magnetic field strengths of the ex-OH maser sources associated with or without the 6.7 GHz CH3OH masers. The relevant statistical results are given in Table 8. It shows that among 30 Zeeman pairs associated with CH3OH masers, the magnetic field strengths are in a range from 0.4 to 6.4 mG, with an average of 2.6 mG. Among 10 Zeeman pairs without CH3OH masers, the magnetic field strengths are in a range from 0.2 to 3.8 mG, with an average of 1.9 mG. Therefore, it can be derived that the sources with CH3OH masers generally have stronger magnetic field strengths than those without CH3OH masers. All of these sources are associated with the ex-OH masers, so they as a whole are at a late stage of high-mass star formation. However, the sources associated with CH3OH masers may be at an earlier stage compared to those without them. With the evolution of star formation, the source will expand (such as an expanding H ii region), and the magnetic field strength will decrease due to the conservation of magnetic flux; in the meantime, the CH3OH maser will gradually disappear. Therefore, it is reasonable to expect that the magnetic field strength of the ex-OH sources without CH3OH masers is weaker.
Table 8. Statistical Results for Magnetic Field Strengths Associated with and without CH3OH Masers
| Subsample | Number of Zeeman Pairs | Range | Median | Average |
|---|---|---|---|---|
| (mG) | (mG) | (mG) | ||
| With CH3OH | 30 | 0.4–6.4 | 2.6 | 2.6 |
| Without CH3OH | 10 | 0.2–3.8 | 2.0 | 1.9 |
Download table as: ASCIITypeset image
5. Summary
We used the Shanghai TMRT to perform an ex-OH maser survey toward a sample of 3348 targets selected from the WISE point sources. Combined with the WISE IR data and the CH3OH masers and RRLs we observed simultaneously from the same survey, we investigated the IR environments of these ex-OH masers; the luminosity relationships between the ex-OH masers, CH3OH masers, and RRLs; and the magnetic field information traced by the ex-OH masers. The main conclusions are summarized as follows.
- 1.We detected a total of 45 ex-OH maser sources from this survey. Six, nine, and thirty sources were detected in the 4765.56, 6030.75, and 6035.09 MHz transitions, respectively, including one new source at 4765.56 MHz, one new source at 6030.75 MHz, and five new sources at 6035.09 MHz.
- 2.Obvious ex-OH maser variabilities, but without either period characteristics or similar variable behaviors, were found in both the LHCP and RHCP for the majority of sources that were detected in previous surveys with time separations of a few to more than 20 yr from our observation time.
- 3.The highest detection rate of ex-OH masers (but only ∼12% for the 6035 MHz transition) was found toward the sources associated with both the 6.7 GHz CH3OH masers and RRLs. Statistical analysis reveals that the WISE point sources associated with the ex-OH masers have generally brighter 22 μm emission than those with the CH3OH masers. Moreover, a strong luminosity correlation was found between the 6035 and 6031 MHz ex-OH masers, as well as between the 6035 MHz ex-OH masers and RRLs. But such a correlation does not exist between the ex-OH and CH3OH masers. Combining these, it can be demonstrated that the ex-OH masers are more likely to be produced toward the more evolved star-forming regions, wherein thicker dust envelopes are stored, compared to the CH3OH masers.
- 4.The magnetic field direction of MSFRs measured by the Zeeman pairs of ex-OH masers somehow suggest a coincidence near the solar circle. In contrast, by combining previous works, the magnetic field shows a uniform positive direction in the Sagittarius–Carina arm and random directions in the Scutum–Centaurus arm. The ex-OH masers might provide an ideal tracer for exploring magnetic field information on the Galactic large-scale views.
We are thankful for the assistance from the operators of the TMRT during the observations. This work was supported by the National Natural Science Foundation of China (11873002, 12011530065, and 11590781). X.C. is thankful for the Guangdong Province Universities and Colleges Pearl River Scholar Funded Scheme (2019).
Facilities: Shanghai Tianma Radio Telescope - , WISE. -
Footnotes
- 9
http://www.iram.fr/IRAMFR/GILDAS; see Pety (2005) for more detailed information.
- 10
- 11