


Abstract
We present JWST NIRCam nine-band near-infrared imaging of the luminous z = 10.6 galaxy GN-z11 from the JWST Advanced Deep Extragalactic Survey of the GOODS-N field. We find a spectral energy distribution (SED) entirely consistent with the expected form of a high-redshift galaxy: a clear blue continuum from 1.5 to 4 μm with a complete dropout in F115W. The core of GN-z11 is extremely compact in JWST imaging. We analyze the image with a two-component model, using a point source and a Sérsic profile that fits to a half-light radius of 200 pc and an index n = 0.9. We find a low-surface-brightness haze about 0 4 to the northeast of the galaxy, which is most likely a foreground object but might be a more extended component of GN-z11. At a spectroscopic redshift of 10.60 (Bunker et al. 2023), the comparison of the NIRCam F410M and F444W images spans the Balmer jump. From population-synthesis modeling, here assuming no light from an active galactic nucleus, we reproduce the SED of GN-z11, finding a stellar mass of ∼109M⊙, a star formation rate of ∼20 M⊙ yr−1, and a young stellar age of ∼20 Myr. Since massive galaxies at high redshift are likely to be highly clustered, we search for faint neighbors of GN-z11, finding nine galaxies out to ∼5 comoving Mpc transverse with photometric redshifts consistent with z = 10.6, and a tenth more tentative dropout only 3'' away. This is consistent with GN-z11 being hosted by a massive dark-matter halo (≈8 × 10¹⁰M⊙), though lower halo masses cannot be ruled out.
Export citation and abstract BibTeX RIS

Original content from this work may be used under the terms of the Creative Commons Attribution 4.0 licence. Any further distribution of this work must maintain attribution to the author(s) and the title of the work, journal citation and DOI.
1. Introduction
Measuring the abundance and physical properties of the highest-redshift galaxies is crucial to understand and constrain the earliest stages of galaxy formation and evolution, including the formation of the first stars and black holes (Stark 2016; Dayal & Ferrara 2018; Robertson 2022). The first galaxies are a sensitive probe for a range of baryonic processes (gas cooling and energetic feedback from stars and black holes), structure formation, and the nature of dark matter (Dayal et al. 2015; Khimey et al. 2021; Gandolfi et al. 2022).
Before the advent of JWST, these early galaxies at redshift z > 10 had been selected using a combination of Hubble Space Telescope (HST) and Spitzer measurements (e.g., Ellis et al. 2013; Oesch et al. 2013; Finkelstein et al. 2015; McLeod et al. 2016; Bouwens et al. 2019, 2021; Finkelstein et al. 2022a). One of the most distant galaxies found in this way is the spectroscopically confirmed GN-z11 (Oesch et al. 2016; Jiang et al. 2021), pushing the limits to z ∼ 11. JWST has rapidly increased the number of z > 10 discoveries, finding luminous z = 10–12 galaxy candidates (Naidu et al. 2022a; Finkelstein et al. 2022b; Adams et al. 2023; Atek et al. 2023; Donnan et al. 2023; Harikane et al. 2023) and four spectroscopically confirmed 10.3 ≤ z ≤ 13.2 galaxies (Robertson et al. 2023a; Curtis-Lake et al. 2023).
Using data from the deep GOODS NICMOS Survey (Conselice et al. 2011), GN-z11 was initially identified by Bouwens et al. (2010) under the designation GNS-JD2, located at 12:36:25.44, +62:14:31.3.
28
There was no evidence that GN-z11 was detected at wavelengths other than 1.6 μm (H band), but it was unclear if it was detected redward of 2 μm from the IRAC data because it is close to another source. Therefore, Bouwens et al. (2010) concluded that GN-z11 could be a z ∼ 9 galaxy, but considered it unlikely because it could also be a transient source or spurious given its brightness (apparent magnitude of ≈26 in HST H band). GN-z11 was then again identified as a z ∼ 9–10 candidate by Oesch et al. (2014) with designation GN-z10-1. Its redshift was later determined by HST grism spectroscopy to be  (Oesch et al. 2016).
GN-z11 is unusually bright with MUV = −21.6 AB mag (F200W = 144.4 ± 2.7 nJy, see Table 1). For comparison, the other recent z = 10–13 spectroscopically confirmed galaxies have MUV in the range of −18.4 to −19.3 AB mag (F200W = 6–14 nJy; Robertson et al. 2023a). GN-z11's brightness makes ground-based observations feasible. Based on the probable detections of three UV emission lines ([C iii]λ λ1907, 1909 doublet and O iii]λ1666), Jiang et al. (2021) found it to be at z = 10.957 ± 0.001. By modeling the spectral energy distribution (SED) using the photometry in five bands (HST F140W, F160W, ground-based K band and Spitzer channels 1 and 2), Jiang et al. (2021) constrained the stellar mass, dust attenuation, and stellar age. They found that GN-z11 hosts a young stellar population with an age of 70 ± 40 Myr, stellar mass of (1.3 ± 0.6) × 109 M⊙, a UV continuum slope of β = −2.4 ± 0.2, and essentially no dust attenuation. Therefore, this surprisingly bright object has a relatively large stellar mass at this epoch (∼420 Myr after the Big Bang), which suggests a rapid build-up of stellar mass, but is consistent with recent JWST-based measurements of other spectroscopically confirmed galaxies at z > 10 (Robertson et al. 2023a; Curtis-Lake et al. 2023).
Table 1. Data and Aperture Photometry of GN-z11
| Filter | Exposure | 07 Flux | 02 Flux |
|---|---|---|---|
| (ks) | (nJy) | (nJy) | |
| F090W | 6.18 | −2.9 ± 4.1 | −1.0 ± 1.7 |
| F115W | 9.92 | 1.2 ± 3.1 | 1.2 ± 1.5 |
| F150W | 6.18 | 115.9 ± 3.3 | 99.2 ± 1.6 |
| F200W | 6.18 | 144.4 ± 2.7 | 135.2 ± 1.5 |
| F277W | 6.18 | 121.7 ± 4.2 | 112.0 ± 1.0 |
| F335M | 3.09 a | 132.9 ± 6.3 | 107.2 ± 1.9 |
| F356W | 6.18 | 123.5 ± 3.9 | 106.7 ± 1.0 |
| F410M | 6.83 | 114.9 ± 4.8 | 109.9 ± 1.4 |
| F444W | 6.18 | 133.8 ± 4.5 | 121.0 ± 1.3 |
| F435W | 7.3 ± 10.7 | ||
| F606W | 1.4 ± 1.5 | ||
| F775W | −1.3 ± 6.5 | ||
| F814W | −2.8 ± 7.4 | ||
| F850LP | 5.5 ± 16 | ||
| F105W | −5.1 ± 5.5 | ||
| F125W | 2.2 ± 4.2 | ||
| F140W | 49.5 ± 4.9 | ||
| F160W | 112.2 ± 4.9 | ||
Notes. Photometry is presented here in 07 and 02 diameter apertures, with point-source aperture corrections. The best-fit ForcePho centroid is used as the center of the aperture photometry. The last nine bands of HST ACS and WFC3 photometry are 07 diameter aperture photometry from the HST Hubble Legacy Field v2.5 images of GOODS-N.
Download table as: ASCIITypeset image
Here, we present new JWST observations of GN-z11 in the GOODS-N field. These observations have been conducted as part of the JWST Advanced Deep Extragalactic Survey (JADES). In this paper, we focus on the nine-band JWST/NIRCam imaging, providing constraints on the SED, morphology, and large-scale environment of GN-z11. The JWST/NIRSpec observations are presented in a companion paper (Bunker et al. 2023). The NIRSpec spectrum definitively measures a redshift, zspec = 10.60, and provides a rich set of diagnostics of the physical properties of the galaxy. In the listing of JADES confirmed redshifts, GN-z11 is given the designation JADES-GN-z10-0.
We present the details of the observations, data reduction, and photometry measurement in Section 2. We present a detailed analysis of the morphology of GN-z11 in Section 3, while we perform the SED analysis and present key results on the stellar populations in Section 4. Section 5 discusses the large-scale environment of GN-z11. The conclusions are presented in Section 6. Throughout this work, we use the AB magnitude system and assume the Planck18 flat Lambda cold dark matter (ΛCDM) cosmology (Planck Collaboration et al. 2020) with Ωm = 0.315 and H0 = 67.4 km s−1 Mpc−1. It is useful to note that in this cosmology 1'' corresponds to a transverse distance of 4.08 proper kpc and 47 comoving kpc at z = 10.6.
2. Data and Photometry
2.1. Observations
The NIRCam observations presented here come from the JWST Advanced Deep Extragalactic Survey (JADES), which is conducting deep JWST imaging and spectroscopy of the GOODS-S and GOODS-N fields. The nine-band imaging of GN-z11 results from the combination of two NIRCam pointings, observations 2 and 3, from program 1181 (PI: Eisenstein) taken on UT2023-02-03. Each pointing is a six-point dither, conducted with a two-point subdither with the MIRI F1800W pattern 29 in a three-part IntramoduleX dither. The two pointings intentionally overlap on GN-z11, but in opposite portions of NIRCam module B (detectors B3 and B2). Hence, in most filters, GN-z11 was placed on 12 distinct and well-separated pixels. Both pointings include eight filters: F090W, F115W, F150W, F200W, F277W, F356W, F410M, and F444W. One pointing additionally includes F335M, paired with an extra six exposures of F115W. The exposure times are listed in Table 1.
2.2. Data Reduction
The details of the data reduction of the NIRCam data will be presented as part of the JADES program in S. Tacchella et al. (2023, in preparation). We give here a brief overview of the main steps. We use the JWST Calibration Pipeline v1.9.2 with the CRDS pipeline mapping (pmap) context 1039. We process the raw images (uncal frames) with the JWST Stage 1, which performs detector-level corrections and produces count-rate images (rate frames). We run this step with the default parameters, including masking and correction of "snowballs" in the images caused by charge deposition following cosmic ray hits.
Stage 2 of the JWST pipeline performs the flat-fielding and applies the flux calibration (conversion from counts per second to megajanskys per steradian; Boyer et al. 2022). For the long-wavelength (LW) filters, we find that the current pipeline flats (ground flat corrected for in-flight performance) introduce artifacts in the background that become visible in the final mosaics. We therefore construct sky-flats for the Stage 2 step by stacking, separately for each LW filter and module, 80–200 uncal frames from PID 1180, 1210 1286, and the public program JEMS (JWST Extragalactic Medium-band Survey; PID 1963; Williams et al. 2023). Since we do not have enough exposures to construct a robust sky-flat for the F335M and F410M filters, we have effectively interpolated those flat fields via a linear combination of flat field "components" determined from a non-negative factorization of the wide-band sky-flats (i.e., F227W, F356W, and F444W). The rest of Stage 2 is run with the default values.
Following Stage 2, we perform several custom corrections to account for several features in the NIRCam images (Rigby et al. 2022), including the 1/f noise (Schlawin et al. 2020), scattered-light effects ("wisps"), and the large-scale background. Since all of those effects are additive, we fit and subtract them. We assume a parametric model for the 1/f noise, a scaled wisp template (only for the SW channel detectors A3, A4, B3, and B4), and a constant, homogeneous large-scale background. We have constructed wisp templates by stacking all images from our JADES (PID 1180, 1210, 1286) program and several other programs that are publicly available (PIDs 1063, 1345, 1837, 2738).
The final mosaics are constructed using Stage 3 of the JWST Pipeline. Before combining the individual exposures into a mosaic, we perform an astrometric alignment using a custom version of JWST TweakReg. We calculate both the relative and absolute astrometric correction for images grouped by visit and band by matching sources to a reference catalog constructed from HST F814W and F160W mosaics in the GOODS-N field with astrometry tied to Gaia Early Data Release 3 (Gaia Collaboration et al. 2021; G. Brammer 2023, private communication). We then run Stage 3 of the JWST pipeline, combining all exposures of a given filter and a given visit. We choose a pixel scale of 003 pixel−1 and drizzle parameter of pixfrac = 1 for the SW and LW images.
30
A careful analysis of the astrometric quality reveals an overall good alignment with relative offsets between bands of less than 0.1 short-wavelength pixel (<3 mas).
The resulting thumbnail images together with the SED are shown in Figure 1. These thumbnails show a compact source at α = 189.106042°, δ = + 62.242042° that is an obvious F115W dropout, with a faint haze to the northeast. The haze is seen in several bands, including in both the SW and LW detectors, establishing it as a true on-sky signal.

Figure 1. The spectral energy distribution and thumbnail images of GN-z11 from 9 JWST NIRCam bands. Each thumbnail square is 15 on a side. The blue points show the seven detected NIRCam bands ("Galaxy" in Table 2), while the 2σ upper limits for F090W and F115W are indicated as downward pointing arrows. The orange squares mark the photometry from the best-fit SED model. The red-solid line and the shaded region shows the median the 16th–84th percentile of the SED posterior from the Prospector modeling (Section 4).
Download figure:
Standard image High-resolution image2.3. Photometry
Using an inverse-variance-weighted stack of the F277W, F335M, F356W, F410M, and F444W images, a signal-to-noise ratio (S/N) image is constructed to provide a detection image. Contiguous regions of greater than five pixels with signal-to-noise ratio (S/N) ≥ 3 were selected as potential sources. For every source location, forced photometry was performed in 01 and 035 radius circular apertures on the JADES/NIRCam and the 30 mas pixel scale HST Legacy Fields mosaics (Illingworth et al. 2013; Whitaker et al. 2019) for the ACS F435W, F606W, F775W, F814W, F850LP and WFC3/IR F105W, F125W, F140W, and F160W filters. We used photutils to perform the force photometry measurements (Bradley et al. 2022). An annular aperture of width Δr = 01 and inner radius r = 04 about each source is used to measure and remove the local background. The subtracted background fluxes 1–9 nJy, i.e., roughly 3%–5% of the source flux (maximum of 8% in F150W). No PSF matching was performed on the HST and JWST bands for the forced photometry, but we perform a point-source (PS) aperture correction. The 01 (035) aperture corrections for F090W, F115W, F150W, F200W, F277W, F335M, F356W, F410M, and F444W amount to 1.37 (1.11), 1.31 (1.10), 1.33 (1.11), 1.38 (1.10), 1.63 (1.15), 1.74 (1.14), 1.79 (1.15), 1.88 (1.13), and 2.07 (1.17), respectively.
We note that in the JWST SW images, GN-z11 lies directly on a diffraction spike from an F115W∼18.4 AB star at [α, δ] ≃ [189.10568, 62.2458] that necessitates the local background correction. We report the aperture photometry in Table 1, which includes both sky and source photon contributions. The uncertainties are computed by adding in quadrature the contribution from the sky measured by placing random apertures on the images and the Poisson uncertainty from the source counts. For the long-wavelength bands, these uncertainties are larger than those measured at the source locations in the JWST pipeline ERR mosaics, which also include both sky and source photon contributions, because the random aperture sky uncertainties include the effects of correlated noise from resampling the mosaics. Our quoted uncertainties do not include any contribution from photometric zero-point uncertainties or from large-scale gradients in the instrument flat fields. We include an error floor of 5% in our SED and photometric redshift fits to hedge against these.
The SED of GN-z11 is displayed in Figure 1 and shows the classic shape of a high-redshift Lyα dropout. The continuum is strong and blue, roughly zero color in the AB system, before plummeting shortward of the break. Bunker et al. (2023) provides a robust determination of z = 10.60 through the detection of many well-detected narrow lines. The photometric measurements are wholly consistent with this redshift. Lyα is shifted to 1.41 μm, lying in the F150W filter. We observe a rest-UV flux density of 144.4 ± 2.7 nJy in F200W. The F115W filter lies entirely shortward of the Lyα wavelength and is indeed observed as a complete dropout, with a flux of 1.2 ± 3.1 nJy. This is a very strong suppression of a factor of at least ∼20 (95% confidence), nearly three magnitudes.
The last nine bands of Table 1 are the ACS and WFC3 07 diameter aperture photometry from the HST Hubble Legacy Field v2.5 images of GOODS-N. Oesch et al. (2014) reported −7 ± 9 nJy, 11 ± 8 nJy, 64 ± 13 nJy and 152 ± 10 nJy for HST WFC3 F105W, F125W, F140W, and F160W, respectively. Our measurements are in agreement with those of Oesch et al. (2014), excepting F160W for which we measure a flux lower by about 25% (3σlower). The Spitzer IRAC photometry of 139 ± 20 and 122 ± 21 nJy at 3.6 and 4.5 μm (Ashby et al. 2013; Oesch et al. 2014) are also in good agreement.
Longward of Lyα, the ratio between the fluxes measured in F200W and F356W indicates a rest-UV slope of  , where the flux density scales as fν
∝ λβ+2. This is consistent with the value determined from the prism spectrum of β = −2.36 ± 0.10 (Bunker et al. 2023). At the longest NIRCam wavelengths, the F410M filter corresponds to 3360–3700 Å in the rest frame, just blueward of the Balmer jump, while the F444W filter extends to 4300 Å. Hence, the comparison of these two filters can be sensitive to the presence of older stars.
, where the flux density scales as fν
∝ λβ+2. This is consistent with the value determined from the prism spectrum of β = −2.36 ± 0.10 (Bunker et al. 2023). At the longest NIRCam wavelengths, the F410M filter corresponds to 3360–3700 Å in the rest frame, just blueward of the Balmer jump, while the F444W filter extends to 4300 Å. Hence, the comparison of these two filters can be sensitive to the presence of older stars.
3. Morphological Results
3.1. Fitting Methods
To investigate the morphology of GN-z11, we need to assess the PSF and then fit models to our multiband images. We do this in several ways.
We perform fits using ForcePho (B. D. Johnson et al. 2023, in preparation), which fits multiple Sérsic components to our individual exposures across all filters, producing a Markov Chain of joint parameter fits. This method was used and is described further in Tacchella et al. (2022a), Robertson et al. (2023a), and Robertson et al. (2023a). ForcePho uses Gaussian mixtures and graphics processing units to accelerate the convolution of Sérsic models with the point-spread function, taken from WebbPSF (Perrin et al. 2014). We note that the Gaussian mixture model of the PSF is designed to reproduce the inner core and smoothed light profile, but does not have enough flexibility to capture the Airy rings of the PSF. In our analysis, we require that each component have the same light profile in all bands; only the amplitude changes per filter. However, because all components are fitted simultaneously in the Markov Chain, ForcePho captures the covariance between components, e.g,. how the flux might be differently assigned to different components. Multiple components of the same object can have their flux co-added in the Markov Chain outputs to yield total photometry that is more stable than each component separately. Because ForcePho runs on the individual exposures, it avoids issues of how mosaicking smooths the PSF or introduces covariance between pixels.
We also analyze the mosaics. For this, we need an estimate of the PSF after image combination. We build the empirical PSF (ePSF) from bright stars in the NIRCam mosaic with the Photutils package (Bradley et al. 2022). We first select bright stars from the public CANDELS catalog in the GOODS-N field (Barro et al. 2019), restricting to those with CLASS_STAR > 0.75 and FLAGS = 0. Through visual inspection, we end up with 10 and 9 unsaturated stars that have the highest S/N in the individual SW (F090W, F115W, F150W, and F200W) and LW (F277W, F335M, F356W, F410M, and F444W) mosaics, respectively. The HST H-band magnitudes for these stars range from 19.2 to 22.4 AB mag. We use the EPSFBuilder module in Photutils to model ePSF from the stars, which follows the prescription of Anderson & King (2000) and Anderson (2016). As expected, the resulting ePSF is mildly broader (see Figure 2) than the WebbPSF, which is oversampled and un-mosaicked. We then fit both single Sérsic and PS models to the combined mosaicked data using ProFit (Robotham et al. 2017) and Lenstronomy (Birrer & Amara 2018). Both ProFit and Lenstronomy are configurable codes that produce consistent results, similar to the commonly used GALFIT fitting software (e.g., Kawinwanichakij et al. 2021; Robertson et al. 2023b).

Figure 2. Encircled light profiles for GN-z11 in F277W, F200W, and F150W. The thumbnail on the left-hand shows the image in F277W. The three panels to the right-hand plot the surface brightness profiles in red. The thin-black line shows the decline of the empirical PSF (ePSF) profiles, while the orange and green shaded regions (indicating the 16–84th percentile) show the PSF from WebbPSF and ForcePho, all normalized to the flux in the central pixel (marked as a gray region). We find that GN-z11 is only marginally extended in the inner ≈02. We model this central region with two components: a PS and an "Extended" component (see Figure 3 and 4). To investigate the haze at a distance of 04, we isolate the quadrant containing the haze and compare its profile to that of the other three. The haze is considerably less prominent in F150W.
Download figure:
Standard image High-resolution image3.2. Results
The first JWST images revealed a diversity of morphological and structural properties of high-z galaxies (e.g., Ferreira et al. 2022; Jacobs et al. 2023; Suess et al. 2022; Robertson et al. 2023b; Kartaltepe et al. 2023; Nelson et al. 2023), including compact and clumpy structures (e.g., Tacchella et al. 2023; Chen et al. 2023). GN-z11 is not an exception and the images are morphologically complex because of the haze to the northeast. Furthermore, it quickly became clear that the core of GN-z11 is extremely compact. Fitting a single Sérsic component yielded very large Sérsic indices using Forcepho, ProFit, and Lenstronomy, raising concerns that a combination of diffuse light and a bright core might be at play.
In Figure 2, we show the encircled flux as a function of radius, both for full annuli and for wedges on and off the haze. The haze causes a clear excess at angular separations of 0.2–06. We therefore introduce an off-center Sérsic component to fit this source; we call this the "Haze." For the light near the core, the profile is mildly more extended than either PSF estimate. We opt to fit a central PS and a separate Sérsic component, the latter being named "Extended." We also include a Sérsic component for the brighter galaxy just over 1'' away to the northeast. All four components are varied simultaneously by ForcePho, resulting in a Markov Chain that incorporates the joint covariances of the fits to these components.
The model photometry results are presented in Table 2. The PS and Extended component are both well detected. As expected, the fluxes from these two very close components are anti-correlated, so that the sum, called "Galaxy," has substantially smaller errors than the quadrature sum. Both components show a sharp Lyα dropout. The summed Galaxy photometry is a close match to the 02 diameter aperture photometry. The model images and residuals for the best-fit model are shown in Figure 3, from which one can see that the three components substantially explain the images in all filters.

Figure 3. The scene fitting from ForcePho. We model the immediate region of GN-z11 with three components (in addition to the bright source on the left-hand side): a PS, an extended Sérsic component near that source, and a second Sérsic centered on the haze. The two elliptical Sérsic components are free in index n, half-light radius, position angle, axis ratio, and centroid. All three components vary freely in amplitude in each band. A fourth Sérsic component is used to model the brighter galaxy on the left-hand side of the thumbnails. ForcePho fits to the individual exposures, producing a Markov Chain sampling of the likelihood of the scene. To display these residuals, we subtracted the model from the data exposures and then combined the exposures into a mosaic for each band. The residuals are very weak, indicating that the three component model has explained most of the scene. We note that these images are displayed in pixel coordinates, unlike other images in this paper, which use the north-up mosaic. All maps show flux in nanojansky (see color bar) in each pixel.
Download figure:
Standard image High-resolution imageTable 2. Model Photometry of GN-z11
| Filter | Galaxy | PS | Extended | Haze |
|---|---|---|---|---|
| (nJy) | (nJy) | (nJy) | (nJy) | |
| F090W | −3.5 ± 1.2 | 1.2 ± 1.0 | −4.6 ± 5.1 | −5.0 ± 5.5 |
| F115W | −2.6 ± 1.1 | 1.5 ± 0.8 | −4.1 ± 4.5 | −4.4 ± 4.9 |
| F150W | 106.5 ± 1.9 | 64.5 ± 2.2 | 42.0 ± 2.7 | 3.0 ± 3.0 |
| F200W | 143.4 ± 1.8 | 99.0 ± 2.9 | 44.4 ± 3.4 | 6.5 ± 2.4 |
| F277W | 109.8 ± 2.0 | 66.3 ± 3.9 | 43.5 ± 4.8 | 19.6 ± 2.8 |
| F335M | 112.8 ± 4.0 | 63.7 ± 7.9 | 49.1 ± 9.5 | 3.7 ± 4.4 |
| F356W | 108.6 ± 1.8 | 71.6 ± 3.9 | 37.0 ± 4.7 | 15.7 ± 2.3 |
| F410M | 113.7 ± 2.9 | 85.9 ± 7.2 | 27.9 ± 8.7 | −2.9 ± 3.2 |
| F444W | 122.9 ± 2.7 | 75.8 ± 7.0 | 47.2 ± 8.5 | 12.5 ± 3.3 |
Notes. Photometry from ForcePho simultaneous PSF-convolved modeling of the scene (Figure 3). The Galaxy consists of the combination of a PS and a extended Sérsic profile (Extended) component. The mean of the Markov Chain of the latter yields a Sérsic index n of 0.9 ± 0.1 with a half-light radius of 49 ± 3 mas and an axis ratio of q = 0.67 ± 0.05, slightly offset from the PS by 21 mas. The Haze is a separate Sérsic component, which yields a mean result of n = 0.9 ± 0.1, a half-light radius of 011 ± 001, and an axis ratio of q = 0.57 ± 0.15, offset by 041 from the PS.
Download table as: ASCIITypeset image
The centroid of the Extended component is allowed to shift from the PS, and the best fit gives a small shift of 21 mas, less than one pixel. The best fit has a Sérsic index n = 0.9 ± 0.1 and half-light radius along the major axis of 49 ± 3 mas, corresponding to 200 pc at z = 10.6. The combined sizes (Point and Extended source) are 0016 ± 0005 (64 ± 20 pc), which we obtain by flux-weighting the sizes of both models and taking into account the 21 mas spatial offset between the PS and extended components. For the Extended component we find an axis ratio of q = 0.67 ± 0.05 and a position angle PA of 34° ± 5°. The two components have similar SEDs, but it is interesting to note the variations at F410M and F444W, which straddle the Balmer break. The Extended component shows a redder F410M–F444W color, while the PS is mildly blue. This will be discussed in more detail in the next section.
The Haze component also fits to n = 0.9 ± 0.1 and a half-light radius of 011 ± 001, offset 041 from the PS. Its axis ratio is q = 0.57 ± 0.15 at a PA of −55° ± 16°. The Haze clearly differs in its spectrum from the other two components. It is much redder in F200W–F277W color and is not detected in F150W. We also find notable drops in flux in the two medium-band filters, F335M and F410M, which might be indicative of strong emission lines in the SED. Photometric redshift fits with EAZY and Prospector substantially favor 4 < z < 5 solutions compared to those at z = 10.6. From this, we conclude that it is more likely that the Haze is a chance projection with a lower redshift low-surface-brightness galaxy. The nature of the 4 < z < 5 solution is probably that of a young star-bursting galaxy with emission lines and a high dust attenuation, similar to the recently discussed high-z interlopers (Naidu et al. 2022b; Zavala et al. 2023). That said, given the low S/N ratio, there remains some chance that the Haze could be associated with GN-z11, e.g., as the tidal spray from a merger, with a cessation of star formation dropping the far-UV emission.
To investigate whether the second Extended component is indeed present, we plot in Figure 4 the ForcePho posterior distribution of the fraction of F200W flux in the Extended component as a function of its half-light size (i.e., major axis radii). There is a covariance between this fraction and the size: the larger the Extended component, the less flux it contributes. Importantly, there is no tail toward zero size or zero flux, emphasizing that the Extended component is clearly detected and indeed extended. Based upon a Bayesian Information Criterion model selection, the two-component fit is preferred.

Figure 4. Posterior distribution of the fraction of F200W flux in the Extended component as a function of its half-light size (i.e., major axis radii). We obtain this directly from the ForcePho modeling. We find an interesting covariance: the larger the Extended component, the less flux it contributes. Importantly, there is no tail toward zero size or zero flux, emphasizing that the Extended component is clearly detected and indeed extended. We find the same qualitative behavior for all other bands.
Download figure:
Standard image High-resolution imageWe confirm the compact size of GN-z11 by fitting both single Sérsic and PS models to the mosaic using Lenstronomy (Birrer & Amara 2018). To ensure that we account for the extended background from the bright neighbor ∼1'' to the NE, we fit GN-z11 and the bright neighbor simultaneously using single Sérsic profiles for both galaxies. In all bands, the best-fit model for GN-z11 has an intrinsic half-light radius < 1 pixel and a Sérsic index of >7.8, which indicates a source that is not significantly resolved with respect to the ePSF. Fitting GN-z11 with a PS model instead of a Sérsic profile yields slightly lower residuals, further indicating the compact nature of the source.
Using ProFit, we analyze the structure of GN-z11 in the F277W mosaic using a multicomponent fit including the central PS, the central extended source, and the Haze. Given the number of components, a nominal ProFit model would involve optimizing 24 free parameters. Unlike our ForcePho method, in using ProFit we are limited to the information provided by a single filter in the mosaic (see the discussion above), and hence we restrict the number of free parameters to the centroids of each component, their brightnesses, the Sérsic indices, and the effective radii. The axis ratios and position angles are kept fixed at the value found in our ForcePho models, and we set the isophotal boxiness to be negligible in each case. Importantly, we find a better fit including a three component model (PS, extended component, and Haze) than for a PS + Haze two-component model. We see no evidence that the PSF adopted by ForcePho is artificially inflating the size of Extended component or the Haze because we can find independently a good quality fit for the extended component and the Haze with ProFit with an effective radius of 004 ± 001 and 011 ± 006, respectively. The Sersic indexes of both the extended component and the Haze are consistent with n = 1. Similarly, the relative brightnesses of the Extended component and the Haze to the PS are very similar to the ForcePho fit (about two magnitudes for the latter). In summary, ProFit allows us to confirm the presence of the Extended component, albeit with less constraining power than what we can do with ForcePho. This is expected given the limited amount of data used in the fitting (single band and mosaic).
We note that our modeled size of GN-z11 is noticeably smaller than the 0.6 ± 0.3 kpc half-light radius reported in Holwerda et al. (2015) fitting HST WFC3 data using a Sérsic index n = 1.5. Indeed, even at JWST resolution, the unresolved component has over half of the total light (Figure 4). We do not think that the difference can be due to the Haze because that component is very weak in F150W. Clearly the angular resolution of JWST will be very important in probing the physical sizes of these very small high-redshift galaxies (e.g., Wu et al. 2020; Ono et al. 2023; Suess et al. 2022; Tacchella et al. 2023; Costantin et al. 2023).
4. Interpretations of the Spectral Energy Distribution
We now move to interpret the measured SEDs of GN-z11, its subcomponents and the Haze. Importantly, we model the SEDs assuming that the emission is powered by starlight, either through direct stellar emission or reprocessed via gas (i.e., nebular emission) and dust. With regard of a possible AGN contribution, we can therefore only assess whether the SED is consistent with such stellar powered emission.
4.1. Methods
We analyze the SEDs with three different spectral synthesis codes, fixing the redshift to the spectroscopic redshift of 10.60 throughout. The first is Prospector (Johnson et al. 2021), which we use for the figures in this paper. Prospector computes stellar population synthesis combined with a model of nebular line and continuum emission, as well as dust attenuation, comparing to the data with a Bayesian formalism and using Markov Chain Monte Carlo to quantify the posterior. Here, we utilize a similar setup as in Tacchella et al. (2022, see also Tacchella et al. 2023; Whitler et al. 2023). Specifically, we assume a nonparametric star formation history with six time bins and a bursty continuity prior. We put them at 0–5 Myr and 5–10 Myr, and the four bins are logarithmically spaced up to z = 20. We adopt a single metallicity for both stars and gas, assuming a truncated log-normal centered on  with width of 0.5, minimum of −2.0, and maximum of 0.0. We model dust attenuation using a two-component dust attenuation model with a flexible attenuation curve. The first component is a birth-cloud component in our model that attenuates nebular emission and stellar emission only from stars formed in the last 10 Myr (the attenuation law is a power law with a slope of −1). The second component is a diffuse component that has a variable attenuation curve and attenuates all stellar and nebular emission from the galaxy. The variation in the attenuation law is modeled as a multiplicative factor of the Calzetti et al. (2007) law to account for uncertainties in the geometry of dust extinction. For the stellar population synthesis, we adopt the MIST isochrones (Choi et al. 2016) that include effects of stellar rotation but not binaries, and assume a Chabrier (2003) initial mass function (IMF) between 0.08 and 120 M⊙. A No Lyα emission line is added to the model to account for resonant absorption effects. This assumption might be too simplistic given the Lyα detection in the spectrum (Bunker et al. 2023). However, we estimate that this will not affect our SED fits significantly because this line contributes only at the 0.05 mag level, while we put an error floor of 5% on the photometry. The rest of the nebular emission (emission lines and continuum) is self-consistently modeled (Byler et al. 2017) with two parameters, the gas-phase metallicity (tied to the stellar metallicity), and the ionization parameter (uniform prior in
  ).
).
Since these data for GN-z11 fall mostly in the rest-UV, the broadband photometry is less sensitive to the presence of very strong emission lines. In particular, the strong [O iii], Hβ, and Hα lines fall redward of our wavelength range. However, some contribution from bluer lines in the F444W band is expected; this will be quantified in Bunker et al. (2023).
A key component that is not included in this modeling is the possibility of luminosity from an AGN. Clearly, the very compact morphology of GN-z11, with about two-thirds of the emission coming from an unresolved nucleus, permits this. Since the SED from an AGN component is highly flexible, we opt here to present results based on the null hypothesis that the light is dominated by stars. Clearly, a luminous AGN would decrease the inferred star formation rate and stellar mass. Whether or not GN-z11 contains a luminous AGN is a question that will be investigated with the spectroscopy Bunker et al. (2023) and Maiolino et al. (2023).
In addition to the effects of metallicity, dust attenuation, and star formation history on the stellar mass-to-light ratio, several other model assumptions may affect the stellar mass inferred from the SED (e.g., Conroy 2013). We highlight some of these, while noting that the effects on the inferred masses can be complex because other inferred parameters may compensate to predict the same SED with a similar stellar mass under different assumptions. If the IMF had fewer very low mass stars than we assume, then the inferred stellar masses would be overestimated (e.g., Steinhardt et al. 2022). The slope of the upper IMF affects the UV-optical color and mass-to-light ratio for a given star formation history. The evolution of high-mass stars at low metallicity is important to the UV and ionizing continuum of galaxies, but is not well constrained from observations in the local universe (Eldridge & Stanway 2022). Binary stellar evolution and stellar rotation may increase the lifetimes of massive UV bright stars, leading to lower mass-to-light ratios for a given star formation history (e.g., Choi et al. 2017). Furthermore, non-solar abundance ratios may be common in the early universe (e.g., Steidel et al. 2016), leading to changes in stellar evolutionary tracks and stellar SEDs at a variety of ages. Our nebular emission models may not capture the effects of complex geometries on the emergent nebular continuum and nebular line ratios (e.g., Jin et al. 2022), which is important for the shape of the Balmer break and hence mass-to-light ratios (e.g., Papovich et al. 2023). We do not include potential contributions from Population III stars.
We compared the Prospector results to those from BEAGLE (Chevallard & Charlot 2016) and BAGPIPES (Carnall et al. 2018), which provide similar functionality but differ in numerous modeling aspects. We fit the observed ForcePho flux with both BEAGLE and BAGPIPES using a delayed exponential star formation history, fixing the redshift to the spectroscopic value. For both BEAGLE and BAGPIPES, we use the Bruzual & Charlot (2003, with the 2016 update) stellar templates and Kroupa's (2001) IMF. We assume the Charlot & Fall (2000) and the Calzetti et al. (2000) dust attenuation law for BEAGLE and BAGPIPES, respectively.
4.2. Results
We first focus on the combined photometry of the PS and the Extended Component, which we refer to as "Galaxy" GN-z11 (Table 2). We show the resulting posterior distributions of several key stellar population parameters in Figure 5, including the stellar mass, specific SFR, stellar age, dust attenuation, and stellar metallicity (see also Table 3). We find a formed stellar mass of 109.1±0.3
M⊙. We find that GN-z11 is actively forming stars with  (
( ) and a specific SFR of sSFR30Myr = 10−7.7±0.3 yr−1, indicating that this galaxy is doubling its stellar mass roughly every ∼50 Myr. (s)SFR30Myr refers to the (specific) SFR averaged over the past 30 Myr. Consistent with this, we find that the galaxy has a stellar age (half-mass time: lookback time at which 50% of the stellar mass formed) of
  Myr. The inset on the top right-hand side of Figure 5 shows the posterior of the star formation history. We find that the SFR has increased ∼60 Myr ago (z ≈ 12), peaked at a lookback time of 10–20 Myr, and has slightly decreased in the recent 10 Myr.

Figure 5. Corner plot of the two-dimensional projections of the posterior of the Markov Chain from the Prospector fits, along with an inset of the reconstructed star formation history. These posterior distributions are obtained by fitting the combined SED of the PS and Extended Source ("Galaxy" in Table 2). The posterior of the SED is shown in Figure 1. We find that GN-z11 has a stellar mass of 109.1±0.3
M⊙, is actively forming stars (sSFR = 10−7.7±0.3 yr−1) with a young stellar age (half-mass time—lookback time at which 50% of the stellar mass formed—is  Myr). The SED of GN-z11 is consistent with being dust-free (
 ) and with a low stellar metallicity (about 10% solar metallicity).
Download figure:
Standard image High-resolution imageTable 3. Properties of GN-z11
| Property | Galaxy | PS | Extended |
|---|---|---|---|
Stellar mass 
|

|

|

|
| Observed MUV (AB mag) |

|

|

|
| Intrinsic MUV (AB mag) |

|

|

|
| UV continuum slope β |

|

|

|
| SFR (M⊙ yr–1) |

|

|

|
 (yr−1) (yr−1) |

|

|

|
| Stellar age t⋆ (Myr) |

|

|

|
| Attenuation AV (mag) |

|

|

|
| Half-light size Re (arcsec) | 0.016 ± 0.005 | Point-like | 0.049 ± 0.003 |
| Half-light size Re (pc) | 64 ± 20 | Point-like | 196 ± 12 |
Notes. The stellar population properties quoted here (median and 16th–84th percentiles) come from the SED modeling with Prospector of the combined photometry of the PS and Extended component (i.e., "Galaxy" in Table 2), the PS photometry and the Extended component photometry. The average half-light size (and its standard deviation) for the combined GN-z11 is derived by flux-weighting the sizes of both the PS and Extended models.
Download table as: ASCIITypeset image
These Prospector-inferred parameters are in overall good agreement with the parameters inferred with BEAGLE and BAGPIPES. Specifically, using BEAGLE with a parametric star formation history, we find log(M⋆,BEAGLE/M⊙) = 8.9 ± 0.1, SFR10Myr= 22 ± 5 M⊙ yr–1, and attenuation AV
= 0.09 ± 0.08 mag. With BAGPIPES, we obtain log(M  , SFR10Myr= 16 ± 6 M⊙ yr–1, and attenuation
  mag. All inferred parameters are consistent with previous inferences in Jiang et al. (2021), who used a single stellar population to model the broadband HST+Spitzer photometry. Our results are also within ∼1σ of those obtained in Bunker et al. (2023) by fitting the NIRSpec spectroscopy with BEAGLE. We consider this to be a good agreement given the differences in the parameterization of the star formation histories and associated priors (e.g., Leja et al. 2019; Whitler et al. 2023).
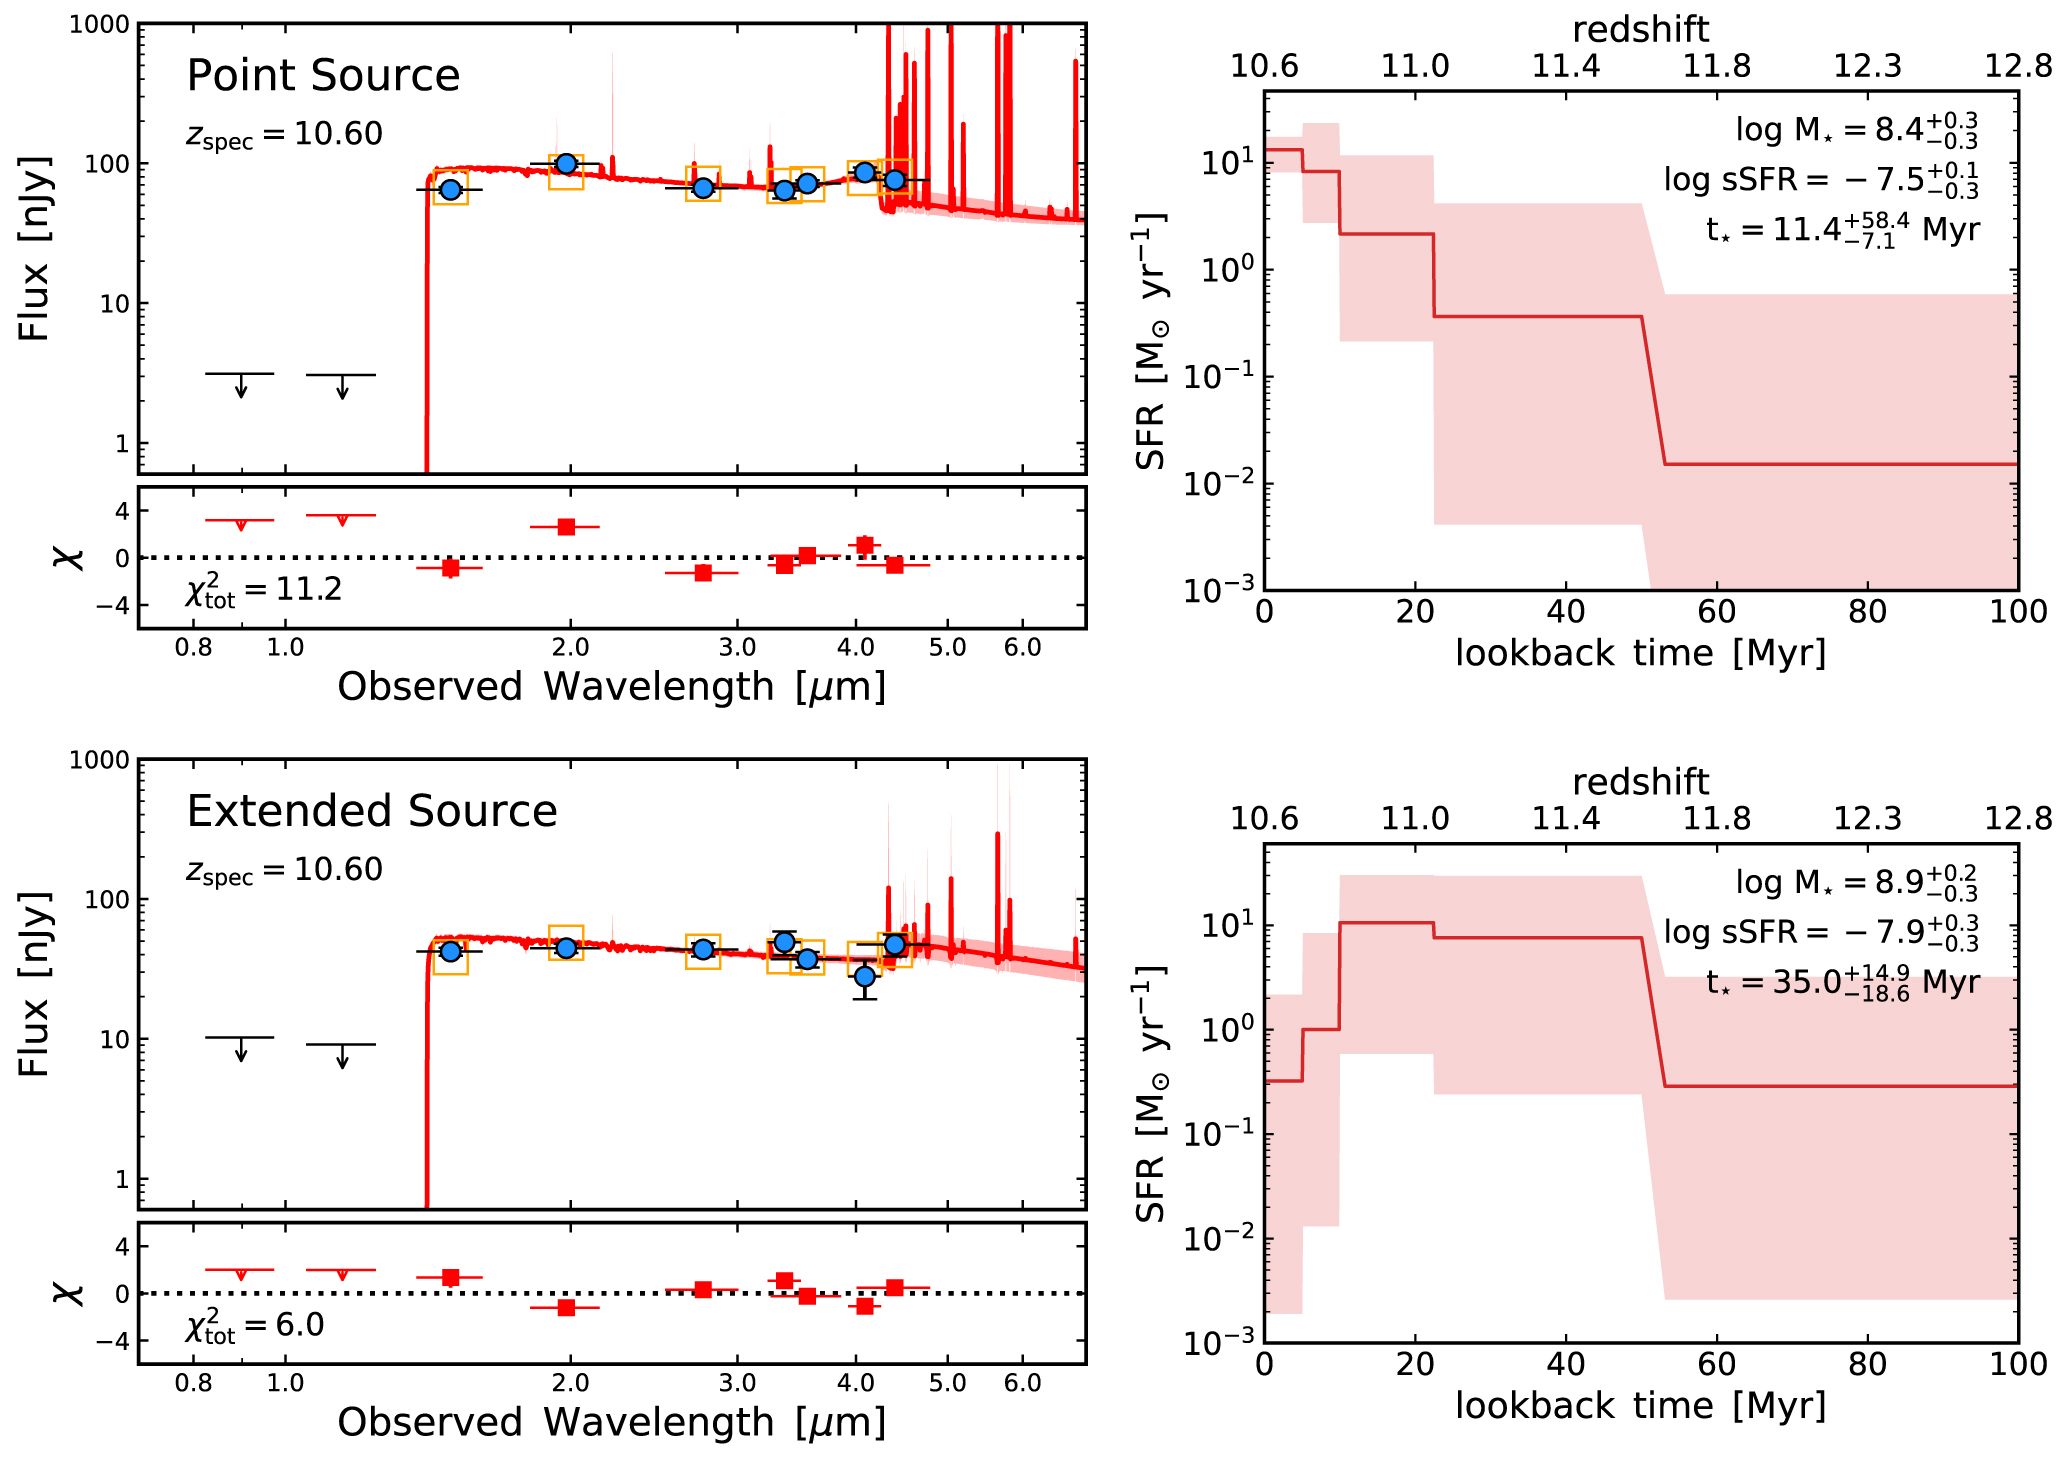
Figure 6 shows the Prospector results for the two components of GN-z11 (PS and Extended) individually. The top panels are the results for the PS, while the bottom panels are for the Extended Source. The individual component (PS and Extended) stellar population parameters agree between Prospector, BEAGLE, and BAGPIPES.

Figure 6. Prospector fits of stellar population models to the photometry of the central PS (upper two panels) and of the Extended component (bottom two panels), see also Table 3. The left-hand panels show the SED of the best-fit model and the residuals, following the same layout as Figure 1. The right-hand panels plot the reconstructed star formation history from the SED modeling: the solid line and shaded regions mark the median and 16–84th percentiles of the posterior distribution, respectively. One sees that the central PS, if dominated by starlight, is consistent with a young, low-metallicity, and unreddened stellar population of about 108.4±0.3
M⊙; note the nebular continuum just blueward of the Balmer break in the fitted model. Specifically, the stellar age, as defined by the lookback time when 50% of the stellar mass was formed, is  ). For the extended component, the star formation history is more extended (
 ), even dropping at the most recent time, due to the increased flux in F444W compared to F410M. The fitted stellar mass is somewhat larger, 108.9±0.3
M⊙, despite this component contributing only one-third of the combined rest-UV flux.
), even dropping at the most recent time, due to the increased flux in F444W compared to F410M. The fitted stellar mass is somewhat larger, 108.9±0.3
M⊙, despite this component contributing only one-third of the combined rest-UV flux.
Download figure:
Standard image High-resolution imageThe SEDs of those two components show an important difference around the observed wavelength of 4 μm, which is around the rest-frame Balmer jump. The PS shows a blue F410M–F444W color and a red F356W–F410M color, indicating strong nebular emission. In contrast, the Extended component shows a red F410M–F444W and blue F356W–F410M color, consistent with less strong nebular emission and weak Balmer/4000 Å break. From the ForcePho Markov Chains, we find that the F410M–F444W color of the Extended component is redder than that of the PS in 95% of cases, with a median color difference of 0.7 mag. Not surprisingly, Prospector prefers a younger age and an increasing star formation history for the central PS, while the Extended Source is consistent with a more extended star formation history (even decreasing in the recent 10 Myr). The Extended Source is slightly more massive than the PS (108.9±0.3 M⊙ versus 108.4±0.3 M⊙), even though this component is only one-third of the combined rest-UV flux.
In summary, the SED modeling presented here does not reveal a strong support for the AGN scenario. We find that that the central emission can be powered by intense and compact star formation, thereby outshining the underlying extended emission of the galaxy. However, we cannot rule out the presence of a luminous AGN, and we expect that detailed analysis of the NIRSpec spectroscopy (Bunker et al. 2023 and Maiolino et al. 2023) will be needed to fully explore this scenario.
5. The Environment of GN-z11
Massive galaxies at high redshift are expected to be substantially clustered (e.g., Larson et al. 2022; Leonova et al. 2022; Tang et al. 2023), and therefore we looked for neighbors of GN-z11 in our faint multiband imaging. The discovery of Lyα emission from GN-z11 (Bunker et al. 2023) further motivates the search for neighbors that might impact the photoionization of the surrounding intergalactic medium. We use the code EAZY (Brammer et al. 2008), which estimates photometric redshifts using a template-fitting approach. We fit the 02 aperture JADES NIRCam photometry for the full catalog of detected sources across the JADES GOODS-N footprint. For the fits, we let redshift vary uniformly between z = 0.01–22, assuming a uniform redshift prior and adopted as the final EAZY photometric redshift the value corresponding to the minimum χ2 fit at all redshifts, za
. To select potential neighbors of GN-z11, we chose galaxies with za
= 9.5–11.5, required that the object had a flux S/N > 5 in either the F200W or F277W filters, and that the summed probability of the galaxy being at a redshift above 7, P(z > 7), is greater than 0.7. We focus here on candidates that lie within the Figure 7 footprint, which is a 10 comoving Mpc (212'') square centered on GN-z11.

Figure 7. The region around GN-z11. This image is 210'' on a side, which is 10 comoving Mpc at z = 10.6. It uses F115W, F200W, and F444W as the blue, green, and red colors. The location and redshift of the nine nearest objects with photometric redshifts around z ∼ 10 are marked.
Download figure:
Standard image High-resolution imageIn this footprint, we find a population of nine objects with photometric redshifts consistent with 10.6 in the vicinity of GN-z11. These are shown in Figure 7, and the astrometry and photometry are reported in Tables 4 and 5. Figure 8 shows the SEDs, thumbnail images in each filter, and photometric redshift probability versus redshifts (computed from the χ2 of the EAZY fit, with a uniform redshift prior). These candidates are much fainter than GN-z11, typically around 10 nJy (AB mag 29). JADES-GN-189.07357+62.23749 (ID 4155) is notably brighter, around 30 nJy. JADES-GN-189.05413+62.21795 (ID 62240) is probably the most tentative physical association. We have conducted a preliminary search using JADES imaging of the larger GOODS-N JADES footprint, about 50 square arcminutes at this writing, finding many other candidates, which we will report on in a future paper. However, we do note that this region has more candidates than other portions of the footprint, despite being mildly shallower imaging. Hence, there is an indication of angular clustering.

Figure 8. Spectral energy distributions, photometric redshift probabilities, and thumbnail images of candidates near to GN-z11 and consistent with its redshift. The photometric redshift probability distributions are based on ![$\exp [-{\chi }^{2}(z)/2]$](https://content.cld.iop.org/journals/0004-637X/952/1/74/revision3/apjacdbc6ieqn40.gif) assuming a uniform redshift prior. Arrows correspond to 2σ upper limits on negative flux measurements. The thumbnails are 10 on a side.
assuming a uniform redshift prior. Arrows correspond to 2σ upper limits on negative flux measurements. The thumbnails are 10 on a side.
Download figure:
Standard image High-resolution image
Table 4. Galaxy Candidates with Photometric Redshifts Consistent with z = 10.6
| ID | Name | R.A. | Decl. | Distance ('') | S/NF200W | zphot |
|---|---|---|---|---|---|---|
| 465 | JADES-GN-189.11621+62.22008 | 189.116208 | 62.220076 | 81 | 4.7 | 10.45 |
| 544 | JADES-GN-189.07604+62.22072 | 189.076035 | 62.220716 | 92 | 5.0 | 9.57 |
| 4155 | JADES-GN-189.07357+62.23749 | 189.073566 | 62.237487 | 57 | 15.6 | 10.80 |
| 4418 | JADES-GN-189.12549+62.23826 | 189.125491 | 62.238263 | 35 | 5.7 | 9.58 |
| 4811 | JADES-GN-189.08668+62.23957 | 189.086676 | 62.239566 | 34 | 8.2 | 10.45 |
| 6862 | JADES-GN-189.05971+62.24572 | 189.059714 | 62.245717 | 79 | 8.2 | 9.57 |
| 8597 | JADES-GN-189.05166+62.25070 | 189.051657 | 62.250698 | 96 | 10.2 | 10.34 |
| 13453 | JADES-GN-189.07537+62.26988 | 189.075370 | 62.269878 | 113 | 5.5 | 11.40 |
| 62240 | JADES-GN-189.05413+62.21795 | 189.054128 | 62.217950 | 123 | 3.0 | 10.00 |
Notes. The angular distance from GN-z11 is given, along with the S/N ratio in the F200W band and the photometric redshift. The ID number provides a short name for cross-referencing the tables and figures. The photometric redshift we report is EAZY za , the value at the minimum χ2 across all redshifts. We recall that 1'' is 47 comoving kpc at z = 10.6.
Download table as: ASCIITypeset image
Table 5. Aperture Photometry for the Candidates Listed in Table 4
| ID | F090W | F115W | F150W | F200W | F277W | F335M | F356W | F410M | F444W |
|---|---|---|---|---|---|---|---|---|---|
| 465 | 1.7 ± 3.0 | 0.8 ± 2.2 | 7.5 ± 2.4 | 9.9 ± 2.1 | 10.5 ± 1.5 | 8.4 ± 2.1 | 6.9 ± 1.3 | 13.1 ± 2.3 | 9.3 ± 1.9 |
| 544 | −2.0 ± 3.0 | −0.2 ± 2.4 | 14.9 ± 2.4 | 10.1 ± 2.0 | 11.9 ± 1.5 | − | 12.4 ± 1.4 | 10.1 ± 2.0 | 13.1 ± 1.8 |
| 4155 | 6.0 ± 3.3 | 0.7 ± 2.2 | 26.7 ± 2.5 | 36.3 ± 2.3 | 28.5 ± 1.2 | − | 20.7 ± 1.1 | 19.4 ± 1.7 | 22.2 ± 1.6 |
| 4418 | −1.6 ± 2.2 | −1.4 ± 1.6 | 7.1 ± 1.8 | 8.8 ± 1.5 | 5.7 ± 1.2 | 2.5 ± 1.9 | 4.8 ± 1.1 | 5.4 ± 2.1 | 4.1 ± 1.5 |
| 4811 | 1.6 ± 2.0 | 1.6 ± 1.5 | 8.3 ± 1.5 | 11.5 ± 1.4 | 13.4 ± 1.1 | − | 13.2 ± 1.2 | 21.7 ± 1.8 | 21.7 ± 1.5 |
| 6862 | 3.2 ± 2.6 | −2.2 ± 2.0 | 12.5 ± 2.1 | 14.7 ± 1.8 | 10.3 ± 1.2 | − | 11.5 ± 1.2 | 11.8 ± 1.9 | 12.1 ± 1.6 |
| 8597 | 0.8 ± 2.4 | −1.5 ± 1.7 | 15.9 ± 2.0 | 18.4 ± 1.8 | 12.8 ± 1.2 | − | 15.4 ± 1.1 | 17.6 ± 1.7 | 22.7 ± 1.6 |
| 13453 | 0.4 ± 1.9 | −2.0 ± 1.3 | 3.9 ± 1.5 | 7.2 ± 1.3 | 6.0 ± 1.3 | 7.2 ± 1.9 | 3.0 ± 1.2 | 6.8 ± 1.9 | 4.6 ± 1.5 |
| 62240 | −3.4 ± 3.7 | 3.4 ± 2.7 | 10.2 ± 2.9 | 7.3 ± 2.4 | 8.8 ± 1.4 | − | 5.0 ± 1.4 | 10.6 ± 2.3 | 8.3 ± 2.2 |
Notes. The flux and 1σ errors are given in nanojansky. The aperture is 02 diameter, with PS aperture corrections. Six of these galaxies fall outside of the F335M imaging footprint.
Download table as: ASCIITypeset image
The dark-matter halos of massive galaxies at these redshifts are likely only a few arcseconds in radius. We therefore look very close to GN-z11, seeking yet fainter candidates. We find only one close object, at α = 189.105482 and δ = 62.241200, only 32 away, that visually could be a F115W dropout. This object is faint and noisy, only 4 nJy (AB mag 30), but marginally detected in F150W, F200W, and the stack of longer filters. The photometric redshift fitting to its current photometry mildly favors a midredshift solution. However, its proximity to GN-z11 could reasonably boost one's prior for a high-redshift solution. We consider this object to be worthy of further attention, but do not consider it to be a highly robust candidate.
6. Discussion and Conclusions
We have presented deep JADES nine-band NIRCam imaging of GN-z11, a particularly bright galaxy now known to be at a spectroscopic redshift of z = 10.60. Our photometry is deeper than and consistent with past GOODS-N imaging of GN-z11. We find a strong UV continuum abruptly cut off as a Lyα dropout. The morphology of GN-z11 is very compact, but mildly resolved. We fit the images with the combination of a PS and a nearly exponential disk with a half-light radius of 49 mas or 200 pc. About two-thirds of the emission is from the PS, leading to a half-light size of 16 mas or 64 pc. A faint haze about 04 away is likely to be a lower redshift galaxy, but might yet be another component of GN-z11.
We fit the PS, the extended emission, and the combination with galaxy spectral synthesis models. Omitting the possibility of a luminous AGN, our fits argue for an unattenuated low-metallicity star-forming galaxy, with about 20 M⊙ yr−1 of star formation and a total stellar mass of 109.1 M⊙. Fitting the two components separately indicates that the extended component has an older star formation history and a lower current specific star formation rate. The PS component is best fitted as a young burst. We note that such modeling carries substantial uncertainties, particularly when deblending marginally resolved components. Nevertheless, it is intriguing to see how the subtle color gradient in the F410M–F444W color can inform us about the formation history of the galaxy. This nuclear starburst seems to outshine the galaxy, making up for ∼two-thirds of the total rest-UV flux, but only contributing ∼one-fifth of the stellar mass. Theoretically, in cosmological simulations, such events are expected when the gas is rapidly fueled into the central region of early gas-rich galaxies (Dekel & Burkert 2014; Zolotov et al. 2015; Tacchella et al. 2016; Dekel et al. 2023).
We then search for other galaxies that might be associated to GN-z11. One candidate 3'' away is very faint and tentative. Searching more broadly, nine other galaxies with separations from  to
to  appear to be F115W dropouts with photometric redshifts consistent with z = 10.6. Our initial impression is that this is a mild angular overdensity, but we leave this study to future work.
GN-z11 is the brightest z ∼ 11 candidate known in the GOODS-S or GOODS-N fields of JADES. Taking the 320 square arcminute GOODS fields as a lower bound on the search area and considering the redshift range of 10 < z < 11, we can view this galaxy as being indicative of the brightest galaxy in a volume of at least 5 × 10⁵ Mpc3. Using an N-body simulation of a 300h−1 Mpc box with particle mass of 107 h−1 M⊙ based on the AbacusSummit methodologies (Maksimova et al. 2021), we estimate that the most massive halo at this redshift in such a volume would typically be about 8 × 10¹⁰ M⊙ and would have a 90% mass–radius of about 8 proper kpc, which is 2'' on the sky.
The contextual interpretation of GN-z11 depends on the reason for its unusual brightness. Is it brighter because it is in a particularly massive halo, or because of some other cause, such as a luminous AGN or some extreme starburst? If due to its host halo, then the halo mass cannot be much different than 8 × 10¹⁰ M⊙ because the halo mass function is very steep. Even a factor of 3 in mass would be about 30-fold in number density, yielding many other halos that could outshine GN-z11.
The stellar masses inferred in Section 4, about 109.1 M⊙, would be compatible with such a halo mass only if around 10% of the baryons in the halo have been formed into stars. This is rather efficient (Behroozi & Silk 2018; Tacchella et al. 2018; Boylan-Kolchin 2023; Lovell et al. 2023), comparable to that of L* galaxies today, and perhaps surprising given the low metallicity. However, the early universe is much denser than today, and perhaps cooling is indeed very rapid (e.g., Ostriker & Shetty 2011; Krumholz & Thompson 2012; Somerville et al. 2015). We note that globular clusters provide a similar behavior: they must consume much of their gas (else they would become unbound when the remaining gas is expelled) and they show evidence of self-enrichment, yet they remain at low metallicity. Perhaps high-redshift galaxies such as GN-z11 follow a similar path. Of course, an alternative explanation would be that the stellar mass is highly overestimated due to incorrect modeling assumptions, such as the stellar IMF or the role of binaries in stellar populations (e.g., Eldridge & Stanway 2022).
If GN-z11 is unusually bright for a reason not primarily driven by its presence in a high-mass halo, then the halo mass would usually be lower. Such a situation would predict that the large-scale clustering of such galaxies would be lower, due to the increase in clustering bias with halo mass. Of course, it also reduces the baryon supply, exacerbating the concerns about the inferred stellar mass.
The compact morphology of GN-z11 clearly could permit a luminous AGN, which would be a plausible route to reduce the fitted stellar mass and ease the tensions with the halo mass. Specifically, the PS component could be interpreted as an AGN, while the extended component would be the host galaxy. Such a scenario is investigated using the JADES NIRSpec data: a variety of emission line ratios (including iii]λ1908, C iv λ1550, and He ii λ1640) do not obviously favor photoionization due to AGN or star formation (Bunker et al. 2023). A potential AGN contribution will be considered in a forthcoming paper (Maiolino et al. 2023). We note that a luminous AGN could also be indicated by photometric variability or multiwavelength imaging.
JWST continues to transform our view of the high-redshift universe. Not only does it reveal multiple z > 10 candidates in every moderately deep pointing but we are also starting to see the diversity of these candidates: in morphology, SEDs, and spectral line diagnostics. GN-z11 is an exemplar of the bright end of the HST redshift frontier, but the great detail we have been able to uncover in it through JADES imaging and spectroscopy shows the marvelous opportunity that JWST will convey. It is most remarkable that we now look to z ∼ 10 galaxies in a manner past limited to z < 2.
Acknowledgments
We are grateful to the many people who worked for decades to turn JWST into a reality and in particular to our other colleagues on the NIRCam and NIRSpec instrument teams. We thank the referee for a constructive report that has helped to improve multiple aspects of the paper.
All of the data presented in this paper were obtained from the Mikulski Archive for Space Telescopes (MAST) at the Space Telescope Science Institute. The specific observations analyzed can be accessed via 10.17909/247y-bk69.
This research made use of the lux supercomputer at UC Santa Cruz, funded by NSF MRI grant No. AST 1828315, NASA's Astrophysics Data System (ADS), the arXiv.org preprint server, the Python plotting library matplotlib (Hunter 2007), astropy, a community-developed core Python package for Astronomy (Astropy Collaboration et al. 2022), the Python binding of FSPS (Foreman-Mackey et al. 2014), the SED-fitting code Prospector (Johnson et al. 2019), the dynamic nested sampling algorithm dynesty (Speagle 2020), the Photutils package (Bradley et al. 2022), and the SED handling tool sedpy (Johnson 2019).
D.J.E. is supported as a Simons Investigator. D.J.E., B.D.J., B.E.R., F.S., E.E., M.R., G.R., C.N.A.W., and T.J.L. acknowledge support from the NIRCam Science Team contract to the University of Arizona, NAS5-02015. W.B., R.M., J.W., L.S., and J.S. acknowledge support by the Science and Technology Facilities Council (STFC) and the ERC Advanced Grant 695671 "QUENCH." D.P. acknowledges support by the Huo Family Foundation through a P.C. Ho PhD Studentship. R.H. acknowledges funding by the Johns Hopkins University, Institute for Data Intensive Engineering and Science (IDIES). The research of C.C.W. is supported by NOIRLab, which is managed by the Association of Universities for Research in Astronomy (AURA) under a cooperative agreement with the National Science Foundation. E.C.L. acknowledges support of an STFC Webb Fellowship (grant No. ST/W001438/1). S.C. acknowledges support by European Union's HE ERC Starting Grant No. 101040227—WINGS. R.M. acknowledges funding from a research professorship from the Royal Society. A.J.B., A.J.C., J.C., A.S., and G.C.J. acknowledge funding from the "FirstGalaxies" Advanced Grant from the European Research Council (ERC) under the European Union's Horizon 2020 research and innovation program (grant agreement No. 789056). A.L.D. thanks the University of Cambridge Harding Distinguished Postgraduate Scholars Programme and Technology Facilities Council (STFC) Center for Doctoral Training (CDT) in Data intensive science at the University of Cambridge (STFC grant No. 2742605) for a PhD studentship. J.W. acknowledges support from Fondation MERAC. R.S. acknowledges support from a STFC Ernest Rutherford Fellowship (grant No. ST/S004831/1). H.Ü. gratefully acknowledges support by the Isaac Newton Trust and by the Kavli Foundation through a Newton-Kavli Junior Fellowship. K.B. is supported in part by the Australian Research Council Centre of Excellence for All Sky Astrophysics in 3 Dimensions (ASTRO 3D), through project number CE170100013. L.W. acknowledges support from the National Science Foundation Graduate Research Fellowship under grant No. DGE-2137419.
Footnotes
- 28
Position based on the analysis presented in this work.
- 29
To support the parallel imaging obtained simultaneously with MIRI
- 30
The pixel scales of the original SW and LW images are 0
031 and 0064, respectively.