


Abstract
In particular during the descending phase of the solar cycle, Alfvén waves in the high-speed solar wind streams are a major form of interplanetary disturbances. The fluctuating southward interplanetary magnetic field (IMF) of Alfvén waves has been suggested to induce geomagnetic activities through intermittent magnetic reconnection at the magnetopause. In this study, we provide in situ observational evidence for dayside magnetopause reconnection induced by such interplanetary Alfvén waves. Using multipoint conjunction observations, we show that the IMF Bz from interplanetary Alfvén waves is transmitted through and amplified by the Earth's bow shock. Associated with the intensified southward Bz to the magnetopause, in situ signatures of magnetic reconnection are detected. Repetitively, interplanetary Alfvén waves transmit the intensified Bz to the magnetosheath, leading to intervals of large magnetic shear angles across the magnetopause and magnetopause reconnection. Such intervals are promptly followed by hundreds of nanoTesla (nT) increases in the auroral electrojet indices (AE and AU) within 10–20 minutes. These observations are confirmed in multiple events in corotating interaction region-driven geomagnetic storms. To put the observations into context, we propose a phenomenological model of a strongly driven substorm. The substorm electrojet is linked to the enhanced magnetopause reconnection in the short timescale of re-establishing the ionosphere electric field and the two-cell convection. These results provide insights on the temporal patterns of solar wind magnetosphere–ionosphere coupling, especially during the descending phase of the solar cycle.
Export citation and abstract BibTeX RIS

Original content from this work may be used under the terms of the Creative Commons Attribution 4.0 licence. Any further distribution of this work must maintain attribution to the author(s) and the title of the work, journal citation and DOI.
1. Introduction
Geomagnetic storms represent a fundamental mode of the terrestrial response to interplanetary disturbances (Gonzalez et al. 1994; Kamide et al. 1998). Around solar maximum, fast coronal mass ejections (CMEs) from flares and erupting filaments are the dominant interplanetary disturbances causing intense magnetic storms. In contrast to solar maximum, high-speed streams from coronal holes have dominant geoeffects during the descending phase of the solar cycle (Gonzalez et al. 1999; Borovsky & Denton 2006; Echer et al. 2008). These high-speed streams interact with slower streams, forming corotating interaction regions (CIRs). In CIRs and the following high-speed streams, interplanetary Alfvén waves of large amplitude are continuously present (Belcher & Davis 1971; Tsurutani et al. 1995, 2011; Tu & Marsch 1995; Horbury et al. 2005; Borovsky & Denton 2010). The fluctuating southward interplanetary magnetic field (IMF) Bz of the Alfvén waves drives prolonged and continuous geomagnetic storm activities (Gonzalez et al. 1999; Kilpua et al. 2017). Generally, CIR-driven magnetic storms are small to moderate in terms of the disturbance storm-time (Dst) index disturbance. However, CIR-driven storms are of longer duration and produce a more severe level of relativistic electrons in the Earth's radiation belt (e.g., Borovsky & Denton 2006; Kataoka & Miyoshi 2006; Xiong et al. 2022).
Conceptually, the mechanism for Alfvén waves to generate geomagnetic activities is inferred to be intermittent magnetic reconnection at the Earth's magnetopause (Tsurutani & Gonzalez 1987; Gonzalez et al. 1999). As depicted in Figure 1, a wavy IMF Bz from large-amplitude interplanetary Alfvén waves is first transmitted through the Earth's bow shock into the magnetosheath region. Then Bz in the magnetosheath directly impinges on the Earth's magnetosphere and causes magnetic reconnection. During the transmission to the magnetosheath region, the magnetic field of Alfvén waves is expected to be amplified due to shock compression (Rankine–Hugoniot relation) (McKenzie & Westphal 1969; Hassam 1978). Hybrid simulations show that the amplification factor could be larger than the up-limit (4.0) due to bow shock compression, implying the possibility of additional compression and amplification in the downstream magnetosheath (Lu et al. 2009).

Figure 1. A cartoon of THEMIS–MMS conjunction observations of the IMF Bz of interplanetary Alfvén waves transmitted through Earth's bow shock to the magnetopause.
Download figure:
Standard image High-resolution imageThrough the dayside magnetopause reconnection, Alfvén waves drive geomagnetic activities that are measured on the ground. Interplanetary Alfvénic fluctuations are shown to have correlations with the auroral electrojet (AE) index (Tsurutani & Gonzalez 1987; Tsurutani et al. 1990; Gonzalez et al. 1999; Diego et al. 2005; Chian et al. 2006; D'Amicis et al. 2007; Guarnieri et al. 2018; Han et al. 2023). High-intensity long-duration continuous AE activities (HILDCAAs) are the effects of Alfvén wave trains in the IMF (Tsurutani & Gonzalez 1987). Alfvénic fluctuations are associated with repetitive substorms (Lee et al. 2006) and inferred to extend the recovery phase of geomagnetic storms (Tsurutani et al. 2011; Raghav et al. 2018; Telloni et al. 2021).
Previous studies focus on the "macroscopic" view of the relation between interplanetary Alfvén waves and geomagnetic activities. In these "macroscopic" investigations, geomagnetic activity is generally assumed to be caused by magnetopause reconnection induced by interplanetary Alfvén waves. To the best of our knowledge, no "microscopic" direct in situ observations of magnetopause reconnection induced by interplanetary Alfvén waves have yet been reported. Using multiple-point conjunct observations, we present such in situ observational evidence from multiple events for this process.
Magnetopause reconnection represents the solar wind–magnetosphere coupling part of the geomagnetic impact of interplanetary Alfvén waves. Generation of the Auroral Electrojet (AE) Indices (including four indices of AE, AU, AL and AO), which is related to measurements of the electric currents in the ionosphere, requires further processes of the magnetosphere–ionosphere coupling. In "macroscopic" investigations, it seems difficult to address the physical processes linking interplanetary Alfvén waves to AE. In our "microscopic" investigation, we propose a phenomenological model of strongly driven substorms, addressing the magnetosphere–ionosphere coupling aspects in the geoeffectiveness of interplanetary Alfvén waves.
Our study may provide insights into the temporal pattern of solar wind–magnetosphere–ionosphere coupling. In general, magnetopause reconnection may proceed in a steady or unsteady manner. It is desirable to understand the conditions for intermittent magnetopause reconnection. The temporal patterns of magnetopause reconnection and substorms are important aspects of solar wind–magnetosphere–ionosphere coupling (e.g., Kennel 1996; Dai et al. 2020; Zou et al. 2022). Understanding these aspects is the main science goal of the upcoming Solar Wind Magnetosphere Ionosphere Link Explorer (SMILE) mission (Raab et al. 2016; Wang & Branduardi-Raymond 2018).
The organization of the paper is as follows. In Section 2, we present an event study analyzing in situ observations of magnetopause reconnection induced by interplanetary Alfvén waves. In Section 3, we show that similar events occur multiple times in the recovery phase of CIR storms. The impact of interplanetary Alfvén waves on the AE/AU index is quantitatively investigated. Within 10–20 minutes, a sharp increases of AE/AU index quickly follows enhanced magnetopause reconnection. In Section 4, we propose a phenomenological model of strongly driven substorms to put the results into context. Conclusions and discussions are present in Section 5.
2. Magnetopause Magnetic Reconnection Induced by Interplanetary Alfvén Waves
2.1. Data and Instruments
The data used in this study come from instruments on the Advanced Composition Explorer (ACE), Time History of Events and Macroscale Interactions during Substorms (THEMIS), and Magnetospheric Multiscale (MMS) spacecraft (Angelopoulos 2009; Burch et al. 2016). The magnetic field data are obtained from MAG on ACE with a 16 s resolution (Smith et al. 1998), FGM on THEMIS with a spin resolution of about 3 s (Auster et al. 2008), and FGM on MMS in the survey mode (Russell et al. 2016). The plasma data are from SWEPAM on ACE with a 64 s resolution (McComas et al. 1998), ESA on THEMIS with a spin resolution of about 3 s (McFadden et al. 2008), and the fast plasma investigation on MMS in the fast mode with a 4.5 s resolution (Pollock et al. 2016). In this study, we use all data in the Geocentric Solar Magnetospheric (GSM) coordinates. The AE/AU index and the symmetric ring-current intensity (SYM-H) index are from the OMNI database. AU/AL represent a measurement of the maximum eastward/westward auroral electrojet current in the ionosphere. AE represents a combination of the strength of the eastward and westward auroral electrojet current.
2.2. A Representative Event of Magnetopause Reconnection Induced by Interplanetary Alfvén Waves
In the scenario of Figure 1, large-amplitude interplanetary Alfvén waves carry the mean field of IMF Bz . The wavy IMF Bz of the interplanetary Alfvén waves is amplified by the bow shock and then impinges on the Earth's magnetosphere. As a result, magnetospause reconnection is induced. We examine the above scenario in one representative event. THEMIS-B (THB) is located at [62.99, −8.33, 5.32] Re in the upstream solar wind and MMS is at [10.30, 0.53, −0.62] RE near the magnetopause (Figure 2).

Figure 2. In situ observations of magnetopause reconnection induced by interplanetary Alfvén waves. (a)–(c) The solar wind speed ∣V∣, δ Vz , and Vz in GSM, δ Bz and Bz in GSM from THB. δ Vz and δ Bz are obtained by subtracting a 6 hr average value. The THB data are time-shifted to the magnetopause. (d) Bz -GSM from MMS1, and the time-shifted 5*Bz -GSM from THB. (e)–(f) V-GSM and ion energy spectrum from MMS1. (g) 2D ion velocity distribution showing the feature of D-shape type distribution in reconnection jets. Panels (a)–(d) are smoothed over 1 minute to remove high-frequency fluctuations. Panel (e) is not smoothed because reconnection jets are of small timescales near magnetopause.
Download figure:
Standard image High-resolution imageFirst, Alfvén waves in the solar wind are identified by a high correlation (>0.7) between δ Bz and δ Vz from THB (Figures 2(b)–(c)). Such a correlation is a typical indication of interplanetary Alfvén waves (Belcher & Davis 1971; Tsurutani & Gonzalez 1987). The large-amplitude Alfvén waves in our study effectively represent slow-varying mean fields on the timescale of waves (tens minutes to a few hours). In one cycle of Alfvén waves, the IMF Bz reverses twice as indicated in the shaded box. Such large-amplitude Alfvén waves are naturally picked up by looking for large Bz –Vz correlations in a 6 hr interval.
Then we check the transmission of Alfvénic IMF Bz to the magnetosheath. The data from THB are time-shifted to the location of MMS. The time shift is simply estimated by [XGSM(MMS) − XGSM(THB)]/VX − GSM. In Figures 2(d)–(e), we examine Bz and Vz from MMS1 in the magnetosheath region downstream of the the bow shock. Bz in the downstream approximately retains the same waveform (with a rough amplification of 5) as that in the upstream (Figure 2(d)). The amplification factor of Bz implies compression of Bz in the magnetosheath in addition to bow shock compression. The Vz –Bz correlation (Figures 2(d)–(e)) in the downstream is not as good as that in the upstream. The flow field Vz may be strongly disturbed by shock or the magnetosphere obstacle and quickly enters a turbulence state in the high-β plasma magnetosheath (Hadid et al. 2015; Huang et al. 2017).
In situ evidence of magnetic reconnection is found near the magnetopause (03:42 UT–03:47 UT). MMS observes a high-speed ion flow ∼ −400 km s−1 in Z-GSM marked by the black arrow. The speed of the ion flow is close to the Alfvén speed (∼350 km s−1) in the magnetosheath. Inside the high-speed flow, D-shaped velocity distributions (Figure 2(k)) are observed near 03:45:36–03:45:40 UT. The accelerated ion jets in the form of D-shaped velocity distributions are mixed with low-energy populations. The Alfvén-speed of the flow and the D-shaped ion distribution are consistent with an ion outflow accelerated from magnetopause reconnection (Parker 1957; Paschmann et al. 1979; Cowley 1982; Phan et al. 2016; Dai et al. 2021; Ren et al. 2022). In this event, magnetopause reconnection responds quickly to the southward turning (03:42:00 UT) IMF Bz from Alfvén waves within less than three minutes. Notice that the magnitude of Bz (∼30 nT) near the magnetopause is likely due to the additional compression and pileup of the magnetic field.
Figure 3 displays details of the magnetopause reconnection near 03:45 UT from MMS in situ observations. MMS crosses the magnetopause and encounters the accelerated reconnection outflow near the X-line as depicted in Figure 3(a). The boundary normal coordinates (LMN) are
L
= [0.28, −0.43, 0.85] GSM,
M
= [0.06, 0.89, 0.44] GSM, and
N
= [−0.95, −0.08, 0.28] GSM. Near the magnetopause, MMS observes a significant BM
and  . These field components represent the Hall magnetic field and electric field that are usually identified as signatures of collisionless magnetic reconnection (e.g., Dai 2009, 2018; Duan et al. 2016; Dai et al. 2017; Zhang et al. 2017; Huang et al. 2018; Zhang et al. 2022; Dai & Wang 2023). EN
and EL
show systematic deviations from
. These field components represent the Hall magnetic field and electric field that are usually identified as signatures of collisionless magnetic reconnection (e.g., Dai 2009, 2018; Duan et al. 2016; Dai et al. 2017; Zhang et al. 2017; Huang et al. 2018; Zhang et al. 2022; Dai & Wang 2023). EN
and EL
show systematic deviations from  and
and  , respectively, suggesting that MMS is near the ion diffusion region or the separatrix region. EL
is a few millivolts per meter (mV/m) and mostly related to the electric field parallel to the local magnetic field (Lu et al. 2021). Such parallel electric fields have been interpreted as a field component of kinetic Alfvén moded (Dai 2009). The parallel electric fields may accelerate and trap electrons in magnetic reconnection (Egedal et al. 2012, 2013). Figure 3(h) shows that the current layer of reconnection appears to be structured.
, respectively, suggesting that MMS is near the ion diffusion region or the separatrix region. EL
is a few millivolts per meter (mV/m) and mostly related to the electric field parallel to the local magnetic field (Lu et al. 2021). Such parallel electric fields have been interpreted as a field component of kinetic Alfvén moded (Dai 2009). The parallel electric fields may accelerate and trap electrons in magnetic reconnection (Egedal et al. 2012, 2013). Figure 3(h) shows that the current layer of reconnection appears to be structured.

Figure 3. Detailed MMS observations of magnetic reconnection near the magnetopause. (a) A cartoon of magnetopause reconnection and the MMS trajectory. (b) The magnetic field B in the LMN coordinate system. (c) The proton velocity in LMN. (d) Ion energy spectrum. (e)–(g) E and − V × B in LMN. (h) The current density J in LMN from the curlometer technique.
Download figure:
Standard image High-resolution imageIn terms of the wave scale and the nature of geomagnetic effect, the Alfvén waves in our study are quite different from the interplanetary turbulence seen in previous studies (Borovsky & Funsten 2003; Osmane et al. 2015). The turbulences studied by Borovsky & Funsten (2003) and Osmane et al. (2015) are smaller-scale Fourier components of the IMF Bz that produce geomagnetic effects in terms of viscous coupling. The Alfvén waves in our study carry the larger-scale and slow-varying mean field of IMF Bz , producing geomagnetic effects through unsteady magnetopause reconnection.
Magnetosheath parameters are shown in Figure 4. The high-β plasma (∼1–10) in the magnetosheath is expected to be a result of hot, high-speed, and high-Mach-number solar wind streams produced during CIR-driven storms (Borovsky & Denton 2006; Kataoka & Miyoshi 2006). We expect that high-β magnetosheath plasmas are common for magnetopause reconnection induced by Alfvén waves in high-speed solar wind streams. The wavy IMF Bz
transmitted to the magnetosheath repetitively leads to intervals of large magnetic shear angle θ (black) across the magnetopause (Figure 4(d)). Large Bz
is typically associated with large θ (shaded region). Magnetopause reconnection near 03:45 UT is during one of the intervals of large θ. Magnetopause reconnection has been considered to occur in high θ (Trattner et al. 2007, 2021). Studies also suggest that θ for magnetic reconnection should be large so that  (Swisdak et al. 2003; Phan et al. 2013; Koga et al. 2019). L is the pressure gradient scale near the X-line and expected to be comparable to λi
, where λi
is the ion inertial length and Δβ is the difference of β across the magnetopause. The blue lines in Figure 4(d) represent a typical
(Swisdak et al. 2003; Phan et al. 2013; Koga et al. 2019). L is the pressure gradient scale near the X-line and expected to be comparable to λi
, where λi
is the ion inertial length and Δβ is the difference of β across the magnetopause. The blue lines in Figure 4(d) represent a typical  specified by this relation for L/λi
= 2.0. The magnetic field direction and plasma β from 03:10 UT–03:20 UT are taken as representing a steady magnetosphere value in obtaining the black/blue lines. During a significant fraction of the time, θ (black) is larger than or comparable to θβ
(blue). These observations suggest that the wavy IMF Bz
of Alfvén waves may repetitively induce large θ and magnetic reconnection.
specified by this relation for L/λi
= 2.0. The magnetic field direction and plasma β from 03:10 UT–03:20 UT are taken as representing a steady magnetosphere value in obtaining the black/blue lines. During a significant fraction of the time, θ (black) is larger than or comparable to θβ
(blue). These observations suggest that the wavy IMF Bz
of Alfvén waves may repetitively induce large θ and magnetic reconnection.
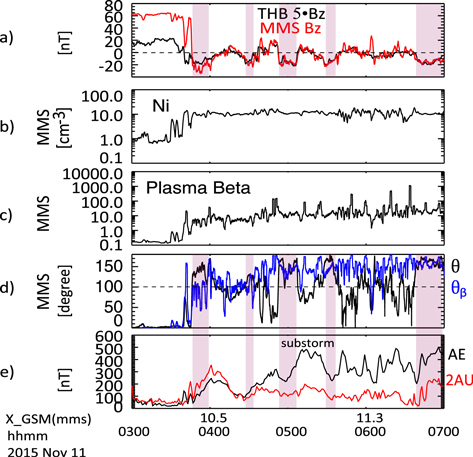
Figure 4. Magnetosheath parameters of the induced magnetopause and associated AE/AU index. (a) Bz -GSM from MMS1, and the time-shifted 5×Bz -GSM from THB. (b) Plasma density from MMS1. (c) Plasma β from MMS1. (d) θ (the magnetic shear angle with respect to B in the magnetosphere) from MMS1. Blue: arctan (Δβ/4)*2. (e) AE and 2AU.
Download figure:
Standard image High-resolution imageIntervals of large θ are mostly correlated with (or just before) the increases of AE/AU as marked by the shaded regions in Figures 4(d)–(e). Following intervals of magnetopause reconnection (large θ), both AE and AU increase within about 10–20 minutes. Such increases of AE/AU can be accumulative as in the first three shaded regions. In the absence of a substorm electrojet, 2AU roughly represents the strength of the two-cell convection electrojet. Near 04:00 UT, the AE increase is about twice of that of AU, indicating that the eastward and westward electrojets are nearly equal. Only convection electrojets respond. Near 05:00 UT, the increase of AE is much larger than the increase of 2AU, implying the formation of a strong westward substorm electrojet. The substorm near 05:00 UT is also picked up by the mid-latitude positive bay index (Chu et al. 2015; McPherron & Chu 2017; Chu 2021).
3. Multiple Events in CIR-driven Storms
During the descending phase of the solar cycle, coronal holes migrate down to lower latitudes. High-speed streams emanating from coronal holes last for several days and tend to recur due to solar rotation. High-speed streams can catch preceding slower-speed streams, forming a CIR between the slow-stream and fast-stream plasmas. CIR usually drives small to moderate geomagnetic storms in terms of Dst/SYM-H index variations. In this section, we show that magnetopause reconnection induced by interplanetary Alfvén waves is common in CIR-driven geomagnetic storms.
3.1. Multiple Events in 2015 November 9 CIR-driven Storms
The 2015 November 11 event analyzed in the previous section occurs in a typical CIR-driven storm, as event #1 shows in Figure 5. During this storm, the high-speed stream is as fast as 700 km s−1. The magnetic field strength is intensified at the stream interface as shown in Figure 5(a). Consistent with the typical profile of a CIR, the stream interface corresponds to a decrease in the density and an increase in the solar wind speed/temperature (Figures 5(c)–(d)) (e.g., Burlaga 1974). The enhanced magnetic field near the stream interface drives the main phase (SYM-H ∼ −70 nT on 2015 November 9) of the geomagnetic storm. The fluctuating IMF Bz is dominated by large-amplitude Alfvén waves near the stream interface and in the high-speed solar wind streams (Figure 5(b)).

Figure 5. Overview of the CIR-driven geomagnetic storm from 2015 November 8 to 13. (a)–(d) ACE observations of ∣ B ∣, Bz GSM, proton density, proton temperature, and the solar wind speed ∣ V ∣. (e) SYM-H index. (g) AE index.
Download figure:
Standard image High-resolution imageIn addition to event #1, more similar cases (events #2 and #3 as marked in Figure 5) are found in this CIR-driven storm. As shown in Figure 6, the IMF Bz of the interplanetary Alfvén waves is roughly amplified by a factor of about five and seven, respectively, in events #2 and #3. In event #2, MMS encounters one magnetopause reconnection near 02:13:05 UT (Figure 6(e1)). Similar to event #1, Bz near the magnetopause appears to be further compressed and piled-up. In event #3, MMS moves back and forth between the magnetosphere and the magnetosheath, encountering magnetopause reconnection induced by the Alfvén waves several times (Figure 6(e2)). The magnetoapuse reconnection in Figures 6(e1)–(e2) is associated with intervals of large Bz and θ. Figures 6(h)–(i) show that such intervals are correlated with (or just before) AE/AU enhancements. The correlation between large Bz /θ and AE/AU enhancements is reasonably high but not a one-to-one relation. During the recovery phase of the previous substorm (e.g., 2015 November 11, 13:30 UT–13:40 UT), AE/AU has to decrease regardless of the condition of Bz and θ.

Figure 6. Multiple events of magnetopause reconnection induced by interplanetary Alfvén waves during the 2015 November 9 CIR-driven geomagnetic storm. The figure format is the same as in Figures 2 and 4.
Download figure:
Standard image High-resolution image3.2. Multiple Events in the 2015 October 7 CIR-driven Storms
Near one astronomical unit, shocks are usually not fully developed with CIRs. However, if the relative speed difference between the interacting fast and slow streams is large enough, forward and reverse shocks bounding the CIR region can form at 1 au (Belcher & Davis 1971; Burlaga 1974; Richardson 2004). This is the case for the 2015 October 7 CIR-driven storms as shown in Figure 7. In this event, between the forward shock and the stream interface is a region of slow wind that is compressed and accelerated by the interaction. Between the stream interface and the reverse shock is a region of compressed and de-accelerated fast streams. The magnetic fields compressed by the shocks drive a significant response in the SYM-H index in the main phase of the storm (∼−120 nT). Following the reverse shock, the high-speed solar wind stream is characterized by high proton temperature, low density, and a high level of Alfvén waves (Figures 7(b)–(e)). The Alfvén waves are responsible for the continuous AE activity and the long-lasting recovery phase of the storms.
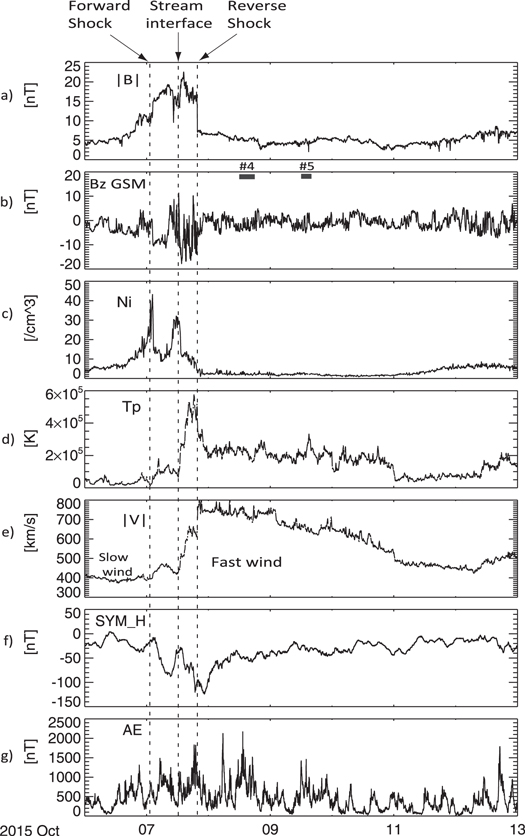
Figure 7. Overview of the 2015 October 7 CIR-driven geomagnetic storm measured by ACE. The format is the same as in Figure 5.
Download figure:
Standard image High-resolution imageFigure 8 shows observations of more events (#4 and #5 in Figure 7) of magnetopause reconnection induced by interplanetary Alfvén waves in the 2015 October 7 CIR-driven storm. In these events, the IMF Bz of interplanetary Alfvén waves is roughly amplified by a factor of ∼4. Similar to events #1, #2, and #3, magnetopause reconnection ion jets are found in intervals of large Bz /θ, which correlate with (or just before) AE/AU enhancements.

Figure 8. Multiple events of magnetopause reconnection induced by interplanetary Alfvén waves during the 2015 October 7 CIR-driven geomagnetic storm. The figure format is the same as Figure 6.
Download figure:
Standard image High-resolution image3.3. Amplification of the IMF Bz of Alfvén Waves
We perform a statistical survey of the amplification of the IMF Bz from Alfvén waves in the transmission to the magnetosheath region. Intervals of MMS in the magnetosheath from events #1–5 are selected for the survey. Bz is averaged over five minute intervals for each bins. The average amplification factor is close to four as shown in Figure 9(a), indicating that the major amplification is due to the Rankine–Hugoniot conservation relation through the bow shock. In some cases, the IMF Bz appears to be enhanced more than the upper limit (∼4) due to shock compression. This may be from the magnetic draping effect that tends to place the Bx component into Bz and By in the magnetosheath. Additional amplification of Bz may also come from the magnetic field pileup near the magnetopause.

Figure 9. Amplification of the IMF Bz of Alfvén waves from the interplanetary region (THB) to the magnetosheath region (MMS) in events #1–5. (a) Bz in the interplanetary region (THB) vs. Bz in the magnetosheath region (MMS). (b) The distribution of Bz in the interplanetary region (THB). (c) The distribution of Bz in the magnetosheath region (MMS).
Download figure:
Standard image High-resolution image3.4. Prompt Increases of AE/AU Following Intervals of Large Bz and θ
We present quantitative investigations of AE/AU enhancements in response to intervals of large Bz and θ in Figures 10 and 11.
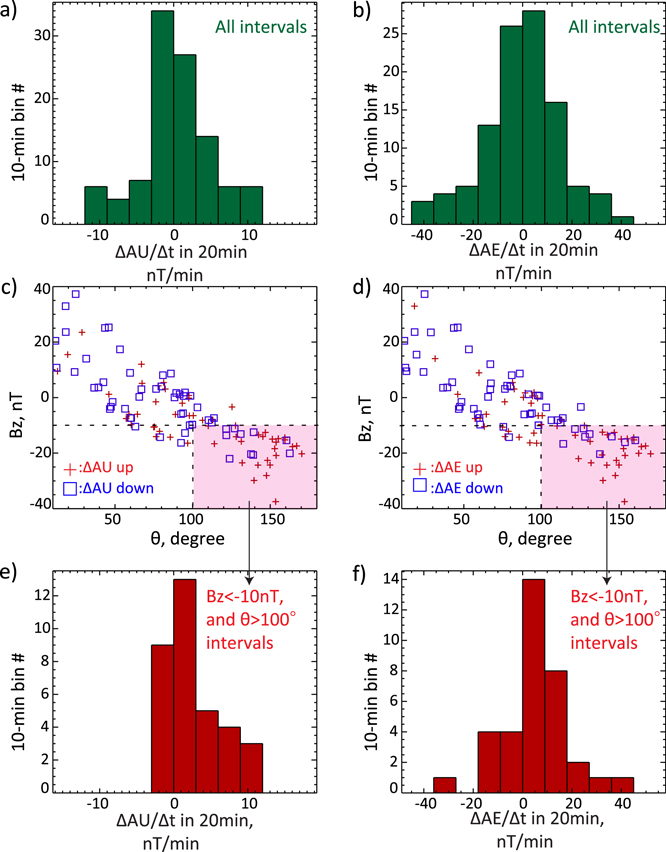
Figure 10. Quantitative analysis of AE/AU responses to Bz and θ in the magnetosheath. (a)–(b), ΔAU/Δt in 20 minutes and ΔAE/Δt in 20 minutes for all 10 minutes bins in events #1–5. (c)–(d) The distribution of 10 minute intervals as a function of the interval's Bz and θ. +/- correspond to increases/decreases of AU or AE in 20 minutes. (e)–(f), ΔAU/Δt in 20 minutes and ΔAE/Δt in 20 minutes for intervals of Bz < −10 nT and θ > 100°.
Download figure:
Standard image High-resolution image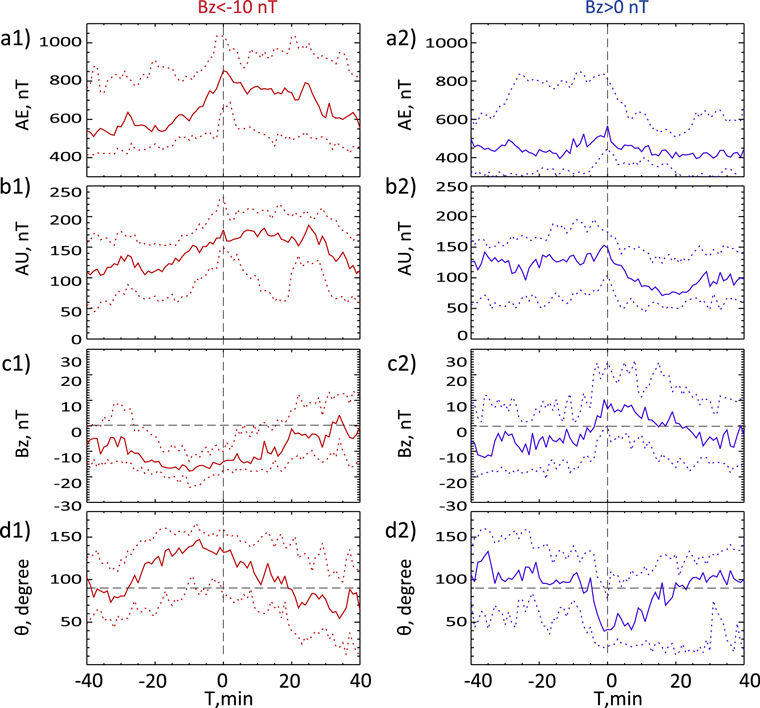
Figure 11. Superposed echo analysis of the AE, AU, Bz , and θ for 10 minute bins of Bz < −10 nT (a1)–(d1) and Bz > 0 nT (a2)–(d2). The zero epoch is the time of maximum AE in 20 minutes with respect to the beginning of the bin. The solid lines are the median values. The dashed lines are 25th percentile and 75th percentile of the data.
Download figure:
Standard image High-resolution imageIntervals of large Bz and θ effectively represent high probability of enhanced magnetopause reconnection. The parameters Bz and θ can be thought of as an effective driving function, which resembles the energy-coupling function as proposed by Akasofu (1981). In Akasofu (1981), the energy-coupling function is based on drivers in the solar wind. To a certain extent, our driving function represents a magnetosheath version of an energy-coupling-type function, with ingredients of more in situ physics in the magnetosheath. In the transmission from the solar wind to the magnetosheath region, Bz and θ can be affected by bow shock compression, the magnetic draping effect, and additional compression near the magnetopause.
All data in our events #1–5 are binned in 10 minute intervals for analysis. A duration of 10 minutes for each bin is selected because drivers that are much shorter than the timescale (10–20 minutes) of adjusting the polar cap convection are probably not effective. For each 10 minute bin, we calculate the increase rate of AU/AE in 20 minutes. Δ < AU[0, 20 minutes] > /Δt and Δ < AE[0, 20min] > /Δt are computed. As a benchmark, Figures 10(a)–(b) show that ΔAU/Δt and ΔAE/Δt are symmetric with respect to zero for all intervals as expected. Figures 10(c)–(d) show the distribution of 10 minute intervals as functions of Bz and θ. The regime of θ > 100° and Bz < −10 nT generally corresponds to enhancements of AE/AU in 20 minutes. This is consistent with the visual observations that such intervals are mostly correlated with (or just before) the enhancement of AE/AU seen in Figures 4, 6, and 8. Figures 10(e)–(f) show the distributions of ΔAU and ΔAE in 20 minutes for intervals of strong-driving conditions (θ > 100° and Bz < −10 nT). On average, such intervals correspond to about ∼240 nT and 70 nT increases in AE and AU, respectively, in 20 minutes. The magnitudes of increase are roughly consistent with the visual examination. Such abrupt increases could be accumulative (as in Figure 4) or on the basis of an existing high level of AE (as in Figures 6 and 8), leading to large final values of AE.
The results in Figure 10 are confirmed in the superposed epoch analysis in Figure 11. Bz < −10 nT and Bz > 0 nT are selected as criteria for selecting strongly driven intervals and non-strongly driven intervals.
For the 45 strongly driven intervals of Bz < −10 nT in Figures 11(a1)–(d1), AE/AU promptly increase within 10–20 minutes in response to large Bz and θ. Large θ generally corresponds to large −Bz . The delay from the start of Bz < −10 nT and θ > 90° to the enhancement of AE/AU appears to be around ∼10–15 minutes. The median increase in AE/AU is ∼300 nT/70 nT in 20 minutes, roughly consistent with the results in Figure 10. On average, the enhancement of AE is about four times that of AU, indicating the occurrence of a westward substorm electrojet that is much larger than the eastward auroral electrojet during the AE enhancement. As a comparison, we show the superposed epoch analysis of the 33 intervals of Bz > 0 nT in Figures 11(a2)–(d2). In these intervals, θ and −Bz are small from T = −10 minutes to 0 as expected. As expected, no single sharp increase of AE/AU is found from T = −20 minutes to T = 0. AE/AU decrease rapidly after T = 0. The zero epoch appears to correspond to the local maximum of AE during the recovery phase (decreasing phase of AE) of substorms.
4. A Phenomenological Model of Strongly Driven Substorms
The prompt enhancement of AE/AU follows the magnetopause reconnection within less than 10–20 minutes. Such observations do not seem to fit in the picture of the classic loading–unloading substorm. In a loading–unloading substorm, the time delay (∼1 hr) between magnetopause reconnection and AE increase is determined by the internal magnetosphere physics, which take place over periods longer than 10–20 minutes. In 20 minutes, the reconnected magnetic flux from dayside has not yet been stored in and transported earthward from the magnetotail. On average, the correlation between the signatures of magnetopause reconnection and AE should be random on the timescale of a 20 minutes delay. Accordingly, the superposed epoch analysis in Figures 11(a1)–(d1) is not expected to produce a single increase of AE/AU in loading–unloading substorms.
To put the observational results in context, we propose a type of strongly driven substorm associated with enhanced ionosphere convection in response to enhanced magnetopause reconnection. The scenario of the strongly driven substorm is summarized in Figures 12 and 13. In the strongly driven substorm, AU/AE responds to the magnetopause reconnection within less than 20 minutes (left of Figure 12). The 10–20 minute period is the time needed for the ionosphere to adjust to the change in the rate of dayside reconnection (Coroniti & Kennel 1973; Kennel 1996). An ionospheric two-cell convection pattern and electric field are re-established in this response time (Kennel 1996). AU increases correspond to the enhanced two-cell convection pattern. AE increases mainly correspond to the substorm elecrojet. The strongly driven substorms probably represent a major subset of substorm events in the study of the solar wind–magnetosphere energy-coupling function (Akasofu 1981). In the substorm events of Akasofu (1981), AE immediately follows the driving function with very little time delay. The energy unloading process does not have time to operate in directly driven substorms.
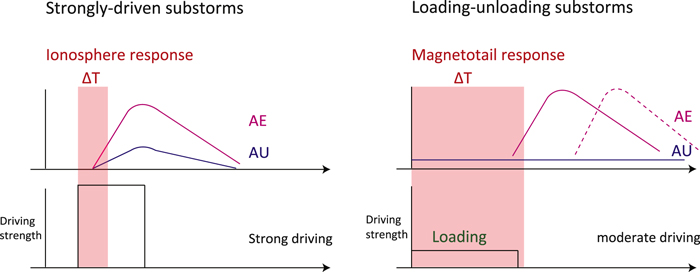
Figure 12. AE/AU responses in a strongly driven substorm and a loading–unloading substorm. In the strongly driven substorm, the response time (10–20 minutes) corresponds to the adjustment of ionosphere convection and electric field to enhanced magnetopause reconnection. In the loading–unloading substorm, the response time corresponds to the energy loading (∼1 hr) in the magnetotail. Because of the significant time delay in the loading process, an AE response can occur in the absence of ongoing drivers as indicated by the dashed line.
Download figure:
Standard image High-resolution image
Figure 13. A schematic of a strongly driven substorm and associated enhanced ionosphere two-cell convection in response to enhanced magnetopause reconnection. The reconnection-driven convection maps the dawn–dusk convective electric field to the high-latitude polar cap (the white circle region). The enhanced polar cap convective electric field penetrates to the auroral oval (green region), accompanied by an adjustment of the Pedersen current and FAC. In the auroral oval, ionosphere electrons perform E × B drift, forming an enhanced convection flow and an eastward/westward convection electrojet in the form of Hall currents. Enhanced two-cell convection and convective electric fields are established within 10–20 minutes in response to enhanced magnetopause reconnection (Coroniti & Kennel 1973; Kennel 1996). The bottom cartoon shows a proposed link between the substorm electrojet, its magnetosphere part (SCW), and the ionosphere convective electric fields in the nightside. The auroral oval convective electric fields map to the near-transition region of the magnetosphere, producing a pattern of flow deflection in the azimuthal direction, reducing the dawn–dusk electric current, and causing magnetic field dipolarization. The reduced dawn–dusk electric current forms an effective SCW and leads to the substorm electrojet in the ionosphere.
Download figure:
Standard image High-resolution image
From the perspective of large-amplitude interplanetary Alfvén waves, the existence of directly driven substorms appears to be viable, particularly in a strong solar wind driver (e.g., high-speed streams). The statistical survey shows that substorms are most frequent in the declining phase of the solar cycle, and in the high-speed streams following CIRs (McPherron & Chu 2018). These favorable conditions for substorms are coincident with those for large-amplitude interplanetary Alfvén waves.
The strongly driven substorms do not exclude the existence of the classic loading–unloading type substorm. In individual substorms, expansion onset may not exactly follow a southward turning of the IMF Bz , indicating energy accumulation and unloading associated with the magnetotail in those substorms (McPherron et al. 1973). The estimated time for the magnetotail to respond is about 1 hr (Kennel 1996). Because of the large time delay in the loading process, AE may respond in the absence of an ongoing solar wind driver (right of Figure 12).
The two types of substorm in Figure 12 differ in the chain of the process and the corresponding timescale. The scenario of two types of substorms is also supported by observations that the auroral electrojet (AE/AL) responds on both the 20 minutes scale and 1 hr scale to the IMF (Baker et al. 1983; Bargatze et al. 1985).
Figure 13 illustrates our phenomenological model of the strongly driven substorms. In the strongly driven substorms, the enhanced rate of magnetopause reconnection leads to an increased convective electric field in the polar cap. The convective electric fields are electrostatic fields. An increase of the polar cap electric field corresponds to electric charges built up at the boundary between the polar cap and auroral oval, causing electric field penetration to the lower-latitude auroral oval. The electric field penetration leads to an enhancement of the Pedersen current, associated field-aligned current (FAC), a convection electrojet in the form of a Hall current, a two-cell convection flow, and eventually a substorm electrojet. In this scenario, the substorm electrojets (as reflected by AE increases) are associated with the enhanced two-cell convection (as reflected by AU increases). More detailed explanations are in the caption of Figure 13. Overall, the phenomenological model only represents a cartoon level of explanation and discussion. Only the input (magnetopause reconnection) and output (AE/AU responses) of the model are directly taken from the data. The chain of internal processes of the model will be subjected to verification in more studies.
At the present time, we still understand very little about the formation of a substorm electrojet and its counterpart in the magnetosphere, the substorm current wedge (SCW) (Kepko et al. 2015). Observations only tell us that a substorm electrojet and SCW are related to dipolarization in the near-Earth transition region that separates the dipolar magnetic field from the stretched tail magnetic field (Baumjohann et al. 1999; Kepko et al. 2015). Such strongly driven substorms may provide perspectives on the formation of substorm electrojets and SCWs (bottom of Figure 13).
In directly driven substorms, the formation of a SCW may be linked to a convective electric field associated with a Pedersen current in the nightside aurora oval. These ionosphere convective electric fields point northward pre-midnight and southward post-midnight. Through the region-2 FAC, the ionosphere electric field maps to the nightside magnetosphere transition region, creating magnetosphere convection toward dusk pre-midnight and toward dawn post-midnight. Such an enhanced convection flow resembles a flow deflection in the azimuthal direction, producing a pressure gradient in the radially outward direction. According to the momentum balance equation (Vasyliunas 1970),

Such a pressure gradient corresponds to a perturbation of the electric current δ J⊥, reducing the dawn–dusk cross-tail current and causing dipolarization. The reduced dawn–dusk current is an effective SCW and sends FAC to the ionosphere to produce a substorm electrojet. The formation of a substorm electrojet and SCW is illustrated in the bottom of Figure 13. A region of SCW may also be reached through the magnetotail loading and unloading process. Flow bursts can transport magnetic flux from reconnection to the near-Earth region, producing an azimuthally deflected flow and dipolarazation in the near-Earth region (Birn & Hesse 2013; Kepko et al. 2015). The link to the substorm electrojet through the magnetotail response should have a longer timescale.
5. Conclusions and Discussions
Alfvén waves in high-speed solar wind streams are a major form of interplanetary disturbance, particularly during the descending phase of the solar cycle. Interplanetary Alfvén waves have been proposed to produce geomagnetic responses through intermittent magnetopause reconnection. Using multipoint conjunction observations, we present in situ observations of magnetopause reconnection induced by interplanetary Alfvén waves. The IMF Bz from interplanetary Alfvén waves is amplified by the Earth's bow shock and additional compression in the magnetosheath. Repetitively, interplanetary Alfvén waves transmit an intensified IMF Bz to the magnetosheath, leading to intervals of large magnetosheath Bz , θ, and magnetopause reconnection. Such intervals are promptly followed by AE/AU enhancements within 10–20 minutes. These observations are confirmed in multiple events of CIR-driven geomagnetic storms.
To put the observation results in context, we propose a phenomenological model of strongly driven substorms (Figure 13). The prompt increase of AE is connected to magnetopause reconnection mainly through the ionosphere instead of the magnetotail. Magnetopause reconnection drives enhanced convective electric fields and two-cell convection in the ionosphere. The auroral oval convective electric field sends signals to the nightside magnetosphere to induce an electric current equivalent to an SCW, resulting a substorm electrojet and large AE increases. The substorm electrojet is linked to enhanced magnetopause reconnection within the timescale (10–20 minutes) of re-establishing the ionosphere electric field and two-cell convection. AU enhancement arises from two-cell convection and is accompanied by AE enhancement. Such strongly driven substorms likely represent a major subset of substorm events in the study of the solar wind–magnetosphere energy-coupling function (Akasofu 1981).
Our study provides insights into the temporal patterns of solar wind magnetosphere–ionosphere coupling. Magnetopause reconnection induced by large-amplitude interplanetary Alfvén waves is likely an intermittent driver of geomagnetic activity. Through directly driven substorms, magnetopause reconnection produces prompt increases of AE/AU. This pattern of solar wind magnetosphere–ionosphere coupling is expected to be particularly viable and even dominant in the descending phase of the solar cycle. Such solar wind magnetosphere interaction is complementary to the more steady magnetopause reconnection that more likely occurs in the CME-driven storms around solar maximum.
We thank NASA CDA web (https://cdaweb.sci.gsfc.nasa.gov/), the THEMIS web (http://themis.ssl.berkeley.edu/) and the MMS Science Data Center (https://lasp.colorado.edu/mms/sdc/public/) for providing the ACE, the THEMIS and the MMS data. We appreciate the OMNI database (https://omniweb.gsfc.nasa.gov/ow.html) and World Data Center (WDC) for Geomagnetism, Kyoto (http://wdc.kugi.kyoto-u.ac.jp) for providing the AE and SYM-H data. The work at NSSC was supported by NNSFC grants (41731070, 41874175, 42174207), the Specialized Research Fund for State Key Laboratories of China, and the Strategic Pionner Program on Space Science II, Chinese Academy of Sciences, grants XDA15350201, XDA15052500. The work at INPE is supported by fund for China-Brasil Joint Laboratory for Space Weather.