


Abstract
To better understand the physical connections in sympathetic solar eruptions, we investigated the interaction between two nearby filaments and their successive partial eruptions in the active region (AR) NOAA 12866 on 2021 September 9 by using data from the Solar Dynamics Observatory and the New Vacuum Solar Telescope. Based on Hα and extreme ultraviolet observations, we found that the right part of one filament (F1) became active first and experienced an obvious rolling motion. Then the whole body of the filament became wider and expanded toward another filament (F2). They collided with each other, and the interaction between them was accompanied by the brightening and bidirectional flows that appeared between them. This implies that magnetic reconnection occurred between the threads of two filaments. The interaction resulted in a rightward motion of F2 at first, and then its activation, and finally part of it erupted. Furthermore, when the erupted F2 deflected rapidly toward the middle part of F1, the left part of F1 erupted with its overlying magnetic fields pushed by F2. These observational results imply that these successive eruptions within a short time are physically linked, and this was caused by the interaction of the filaments. Nonlinear force-free field extrapolation reveals that the magnetic structure of the filament F1 was composed of several magnetic flux ropes with different twists. These results further advance our understanding of partial filament eruptions and sympathetic solar eruptions.
Export citation and abstract BibTeX RIS

Original content from this work may be used under the terms of the Creative Commons Attribution 4.0 licence. Any further distribution of this work must maintain attribution to the author(s) and the title of the work, journal citation and DOI.
1. Introduction
As is well known, solar filament eruptions, solar flares, and coronal mass ejections (CMEs) usually accompany each other and are commonly regarded as the most energetic events in the solar atmosphere (Gosling et al. 1991; Chen & Shibata 2000; Lin & Forbes 2000; Yan et al. 2011; Wang et al. 2020). They can coexist in one event (Carmichael 1964; Sturrock 1966; Hirayama 1974; Kopp & Pneuman 1976) and are believed to be three different manifestations of one physical process (Litvinenko 1996). They can create hazardous solar–terrestrial space weather. Therefore, it is necessary to investigate their triggering mechanisms and dynamic evolution.
Solar filaments or prominences consist of relatively cool and dense plasma materials and exist in the extremely hot corona as a result of the balance between magnetic tension and gravity (Engvold 1976; Demoulin 1998; Gilbert et al. 2001; Mackay et al. 2010; Yan et al. 2020a). Solar filaments commonly form and exist in filament channels along polarity inversion lines (PILs) (Martin 1998; Parenti 2014; Gibson 2018). The magnetic structures of solar filaments are considered to be sheared arcades or flux rope structures, which are preconditions for providing dips for filament plasmas (van Ballegooijen & Martens 1989; DeVore & Antiochos 2000; Gaizauskas et al. 2001; van Ballegooijen 2004; Wang & Muglach 2007; Tan et al. 2022). The magnetic dips are usually formed at the bottom of the twisted flux rope configuration. Their 3D distributions can be used to predict the structures of the filaments and discriminate the two types of magnetic configurations of filaments within the framework of a 3D MHD model (Aulanier et al. 2000, 2002). Furthermore, the formation of magnetic dips can provide a condition for the merger of two filaments with identical chirality (Aulanier & Schmieder 2008). Besides, according to Chen et al. (2014, 2020), the magnetic configuration of a filament can be distinguished as being of either normal polarity or inverse polarity. Normal polarity is described in the sheared arcade configuration; in this case, the dextral (sinistral) filament corresponds to the left-bearing (right-bearing) barbs and has left-skewed (right-skewed) loops. For inverse polarity in the flux rope configuration, the dextral (sinistral) filament has right-bearing (left-bearing) barbs and left-skewed (right-skewed) loops. Coronal condensation and cool plasma injections from the chromosphere are well-known sources of filament material (Karpen et al. 2006). Solar filaments are not only formed in active regions, but also in quiescent regions, and even at the boundaries of active regions; they are called active-region filaments, quiescent filaments, and intermediate filaments correspondingly (Engvold 1998). However, many physical ingredients are closely related to the formation of solar filaments, such as magnetic reconnection (Wang et al. 2017; Xue et al. 2017; Yang et al. 2021) and its associated magnetic emergence and/or magnetic cancellation (Martens & Zwaan 2001; Yang et al. 2016). Furthermore, Yan et al. (2020c) found that a new filament is formed by the materials injected from one eruptive filament. Sunspot rotations and shearing motions of opposite magnetic polarities also play an important role in the formation of solar filaments (Yan et al. 2012, 2015). In addition, some filaments are formed by shearing motion and by magnetic reconnection (Wang et al. 2017).
Solar filaments can become active and erupt when they lose equilibrium. To understand the mechanisms that trigger their eruptions, many theoretical models have been proposed, such as the tether-cutting model (Moore et al. 2001; Chen et al. 2018), the catastrophe model (Forbes 1990; Forbes & Isenberg 1991; Lin & Forbes 2000), and the magnetic breakout model (Antiochos et al. 1999; Lynch et al. 2004; DeVore & Antiochos 2008). These eruption models involve magnetic reconnections. Additionally, emerging flux and magnetic cancellation, as well as the kink instability and torus instability of ideal magnetohydrodynamic (MHD), are possible mechanisms to trigger solar eruptions (Hood & Priest 1979; Chen & Shibata 2000; Török et al. 2004; Williams et al. 2005; Kliem & Török 2006; Bi et al. 2011, 2015; Yan et al. 2014). Moreover, the study of Wang et al. (2016) suggests that filament eruptions might be triggered by opposite electric currents carried by newly emerging magnetic flux. It is worth noting that not all filaments can erupt completely. Observations show that some eruptions may contain only a part of the filament materials, and magnetic fields can escape from the solar disk into interplanetary space, while the remaining part falls back to the Sun or stays in the coronal source region; such an eruption can be termed a partial eruption (Gilbert et al. 2001; Monga et al. 2021). For partial eruption episodes, the magnetic reconnection is located within or above the magnetic flux rope structure (Gilbert et al. 2001; Tripathi et al. 2013). Solar filaments might be divided into at least two parts owing to vertical splitting or horizontal splitting, forming a double-decker configuration (Cheng et al. 2018; Monga et al. 2021; Zhang et al. 2022) or resulting in the east and west parts of a filament erupting separately (Joshi et al. 2022). A successful partial or full eruption might occur in two steps if its overlying background magnetic fields are distributed nonuniformly (Gosain et al. 2016; Chandra et al. 2017). Associated studies were also made by Tripathi et al. (2006) and Shen et al. (2012). Observations and investigations showed that whether a CME is associated with filament eruption can be used to distinguish a successful eruption from a failed one. Strong overlying fields can lead to a failed eruption episode (Xue et al. 2014; Wang et al. 2018). In this episode, filaments first become active and rise, then stop at higher altitudes in the corona. So no materials or magnetic fields of the filaments are ejected from the Sun in failed eruptions (Ji et al. 2003; Joshi et al. 2013, 2022; Kuridze et al. 2013).
Sometimes, two or more filament eruptions occur at different places but simultaneously or successively within a relatively short time interval with certain physical connections; these are called sympathetic eruptions (Moon et al. 2002; Jiang et al. 2011; Török et al. 2011; Joshi et al. 2016; Wang et al. 2016). In recent years, there have been many studies of the interaction mechanisms of two filaments. Linton et al. (2001) demonstrated that interaction and reconnection may happen between a pair of flux ropes as they collide with each other, and they noted four types of interaction, known as tunnel, merge, slingshot, and bounce. Kong et al. (2013) reported an interaction event for sympathetic filament eruptions. They found that when one leg of a filament (F1) moved toward the other filament (F2), the large-scale overlying coronal loops of F2 were opened by the first eruption of F1 and triggered F2 to erupt subsequently. A filament was found to experience a process from rolling motion to acceleration caused by the disturbance of the filament erupting nearby; its final successful eruption was due to the opening of overlying fields (Wang et al. 2016). Similarly, the eruption of one filament was considered to be a result of the shared overlying magnetic loops being opened and removed through the first eruption or the material perturbation from the eruptive filament (Su et al. 2007; Xue et al. 2014). Furthermore, a right filament can erupt due to its overlying constraint fields being weakened by the magnetic reconnection triggered by the left one erupting first (Li et al. 2017). Besides, Yang et al. (2017) showed an interaction scenario through magnetic reconnection of two colliding filaments, which supports the slingshot interactive theory of Linton et al. (2001). Regarding the merge interactive episode, when two filaments of identical magnetic handedness collide with each other, they can merge or become partially linked, then erupt along the same path or a different path (Liu et al. 2010; Li & Ding 2012). In addition, a lower filament and an upper one can interact through their convergences (Zhu et al. 2015). Apart from for the direct interaction between two filaments, Jiang et al. (2011) presented the formation process of coronal dimming and its indirect role in triggering the successive eruptions of nearby filaments. Yang et al. (2016) proposed that a miniature filament (SF) below a large-scale filament (LF) formed and erupted owing to its surrounding small-scale photospheric activities (magnetic convergence and cancellation, as well as the subsequent emerging flux); the LF became unstable and finally erupted because its overlying magnetic flux was transferred to the sides or up to a higher position by the SF erupting first. They concluded that the SF was an intermediary that connected the photospheric activities and the LF eruption. Besides, sympathetic filament eruptions also happened through chain reconnections among the overlying arcades, the expanding filament-carrying flux ropes, and the nearby ambient fields (Joshi et al. 2016). A more complicated magnetic system overlying the filaments was more favorable for the occurrence of sympathetic filament eruptions via successive magnetic reconnections (Shen et al. 2012; Hou et al. 2020; Zhou et al. 2021). Moreover, multiple-arcade bipolar helmet–streamer configurations (Yang et al. 2012), the continuous invasion of one flare ribbon that formed through the initial eruptive filament (Song et al. 2020), and the mass-draining and longitudinal oscillations within filaments (Dai et al. 2021) might be alternative candidates for sympathetic solar filament eruptions. Consequently, during sympathetic eruptions, the way that one filament interacts with another could vary from case to case. More recently, Koleva et al. (2022) suggested that a part of the first eruptive filament approaching two other filaments may cause sympathetic eruptions. Besides the observational evidence mentioned above, Török et al. (2011) investigated the trigger mechanisms of sympathetic eruptions through 3D MHD simulations. In their model, each reconnection event can trigger the eruption of a flux rope due to its overlying fluxes being removed sufficiently. Similar work was also performed by Lynch & Edmondson (2013), which showed a sympathetic eruption associated with the magnetic breakout CME within a pseudo-streamer configuration through a 2.5D simulation.
Although numerous studies have been done to explore the interaction between two filaments during sympathetic eruptions, many questions are still unanswered, such as how one eruptive filament can influence another that is originally in a stable state, and what are the most important factors that can result in sympathetic filament eruptions? Here we have performed a detailed analysis of the interaction process of two adjacent filaments and the subsequent partial eruptions. The data sources and detailed data analysis are shown in Section 2. The main results are presented in Section 3. The conclusions and discussions are given in Section 4.
2. Observations and Data Analysis
The 1 m New Vacuum Solar Telescope (NVST) is a large ground-based telescope used to detect small-scale structures and solar activity in the photosphere and chromosphere (Liu 2014; Yan et al. 2020b). It is located in the Fuxian Solar Observatory of Yunnan Observatories in China. It can provide multichannel observations, such as Hα, TiO, and G-band. The Hα channel focuses on the chromosphere while the other two focus on the photosphere. In this paper, we used the Hα line center data of the NVST from 06:45 UT to 09:49 UT on 2021 September 9. Besides the observation of the line center at 656.28 nm, it can also provide off-band observation in Hα with a bandwidth of 0.025 nm (Xiang et al. 2016). The Hα images have a pixel scale of 0 165 and a cadence of about 12 s, while the TiO images have a sampling of 004 per pixel and the cadence is 30 s. The data are processed from level 0 to level 1.5 by using the dark-current and flat-field correction, then reconstructed by the speckle masking method (Weigelt 1977; Liu et al. 1998).
The Atmospheric Imaging Assembly (AIA; Lemen et al. 2012) and the Helioseismic and Magnetic Imager (HMI; Schou et al. 2012) are two instruments on board the Solar Dynamic Observatory (SDO; Pesnell et al. 2012). AIA can provide full-disk images and multiwavelength information from different solar atmospheres, including seven extreme ultraviolet (EUV) and two Ultraviolet (UV) bands, and one visual-light band (Lemen et al. 2012; Pesnell et al. 2012). The AIA images we used here are from the 304, 171, and 131 Å channels, which have a resolution of 06 pixel−1 and a cadence of 12 s. Combining with the Hα data and AIA images, we can analyze the interaction process between two filaments, as well as the subsequent eruptions. The line-of-sight (LOS) magnetograms and vector magnetograms were derived from the HMI observation. The LOS magnetograms are employed to show the magnetic distribution of the location of the filaments before their eruptions, and have a pixel size of 05 and a cadence of 45 s. All the data we used here were aligned to a reference time of 08:00 UT on 2021 September 9. The vector magnetograms were obtained by applying the Very Fast Inversion of the Stokes Vector (Borrero et al. 2011), which has a temporal resolution of 720 s. The 180° azimuthal ambiguity in the measurement of the vector field is resolved with the energy minimum method (Metcalf 1994). We investigated the magnetic field evolution associated with the formation of the filaments by using the vector magnetic data. Additionally, taking the photospheric vector magnetic field as the bottom boundary condition, we employ the nonlinear force-free field (NLFFF) extrapolation method (Wiegelmann 2004; Wiegelmann et al. 2006; Wiegelmann & Inhester 2010) to derive the magnetic structures of the filaments and their peripheral magnetic circumstances before their eruptions. In order to reveal the possible mechanism for the filament eruptions, we calculate the decay index of the background fields above the filaments by using the horizontal component of potential fields. Besides, the potential field source surface (PFSS) extrapolation model is also used to study the mechanism of the filament eruptions.
3. Results
3.1. The Formation of the Two Filaments and Their Locations and Morphologies before Eruptions
The active region (AR) NOAA 12866 began to appear on the eastern limb of the Sun on 2021 September 4. On September 7 and 8, two filaments were formed in this AR, and their activation and eruption were observed on 2021 September 9. To investigate the formation mechanisms of the two filaments or the evolution of the fibrils, we checked the magnetic field evolution of the photosphere underlying the filaments by using the vector magnetic field data. We found that, before and during the formation of the filaments, magnetic convergence and cancellation happened continuously at the location where the filaments formed (see the yellow circles in Figure 1, and the green and cyan profiles in Figure 1(a7)). Meanwhile, many negative-polarity magnetic features that emerged from the eastern and larger positive sunspot of the AR were detected (see the cyan circles in Figure 1). Most of these newly emerged negative-polarity fields finally moved toward the northern scatter-positive patches of the AR, and then magnetic cancellation occurred between them. Furthermore, magnetic convergence and cancellation can also happen between the newly emerged positive- (negative-)polarity fields and pre-existing negative- (positive-)polarity fields (see the rightmost yellow circles in Figures 1(a2), (a3), and (a4)). The newly emerged fields arise mainly from the western negative sunspot of the AR and its surroundings. Therefore, we suggest that magnetic emergence, convergence, and cancellation are the main mechanisms for the formation of the two filaments F1 and F2 in our study. Our results are similar to those of Yang et al. (2016) and Joshi et al. (2022). In their works, the activities of the photospheric magnetic fields (such as magnetic emergence, convergence, and cancellation) can lead to the formation and later eruption of a filament. Finally, AR 12866 evolved into a complex configuration that consisted of a larger leading negative-polarity sunspot and a larger following positive-polarity sunspot.
Figure 1. Photospheric vector magnetograms showing the magnetic emergence, convergence, and cancellation associated with the formation of the filaments from 2021 September 6–8 (panels (a1)–(a7)), and the appearance of the filaments before their eruptions on September 9 (panels (b) and (c)). (a1)–(a7) Positive (negative) magnetic fields are shown in white (black). Transverse magnetic fields are superposed on the positive- (negative-)polarity area of the longitudinal magnetic fields in the form of small blue (red) arrows, respectively. The length and direction of the arrows represent the strength and direction of the transverse magnetic field. Cyan circles mark the position of the emerged negative-polarity fields, and yellow circles mark the areas of magnetic cancellation. (b) SDO/HMI LOS magnetogram, in which positive (negative) magnetic fields are shown in white (black). Positive and negative polarities are labeled with the letters "P" and "N," respectively. In panels (a7) and (b), the green and cyan profiles denote the two filaments F1 and F2, respectively. (c) Hα image obtained with the NVST. The red (blue) contours represent the positive (negative) polarity of the LOS magnetic fields; the contour levels are ±400 and ±1000 G. In panels (a7), (b), and (c), white arrows indicate the locations of the two filaments, labeled "F1" and "F2," respectively. An animation of the SDO/HMI LOS magnetogram shown in panel (b) is available. Its duration is 13 s and it covers the period from 03:30 UT to 08:30 UT on September 9.
(An animation of this figure is available.)
Download figure:
Video Standard image High-resolution imageIn Figure 1, the LOS magnetogram (at 07:24:00 UT, see panel (b)) and Hα image (at 07:23:55 UT, see panel (c)) before the filament eruptions are mainly used to show the magnetic configuration of the AR and the general characteristics of the filaments. This AR was located at S18W07 on the solar disk and had a β magnetic configuration on this day. Furthermore, the eastern part of the AR was of dominantly positive polarity, while the western part was dominantly negative. The other regions were dominated by numerous small positive or negative patches. The two filaments are labeled with "F1" and "F2," respectively. It is unambiguous that F1 is larger than F2 and exhibits an "M" shape. F1 was located in the north of the AR and adjacent to F2 in the northwest. We can see that F1 and F2 were lying approximately above the PILs. The two footpoints of F1 were rooted in the main positive (P1) and negative (N1) sunspots, respectively. While the southwestward footpoint of F2 was rooted in nearly the same location as the right footpoint of F1, its northeastward footpoint was rooted in some smaller positive magnetic features (P2). In panel (b), "N2" and "P3" are the other two footpoints of F1 which is the same as Figure 8. According to the methods proposed by Chae (2000), Chen et al. (2020), and Zhou et al. (2020), there exists a one-to-one relationship between the filament chirality and the magnetic helicity, so F1 is a sinistral filament with positive helicity, while F2 is a dextral filament with negative helicity. F1 and F2 can exhibit a clockwise and a counterclockwise rotational motion during their eruption processes, respectively. Benefiting from the high-resolution observation of the NVST, the threads of the filaments can be discerned clearly (see panel (c)).
3.2. The Activation of the Right Part of F1
In Figure 2, we mainly show the brightening and bidirectional flows related to the activation of the right part of F1 (the right part of F1 is represented by "F1-R," here and below). At about 07:30 UT, the brightening was observed near the right leg of F1, but it did not spread upward (see the green arrows in panels (b1), (c1), and (d1)). Soon after the brightening disappeared, the bidirectional flows started to appear near the middle of F1-R (see the green arrows in panels (b2), (c2), and (d2)). We found that bidirectional flows moved from the middle in opposite directions (see the green bidirectional arrows in panels (b3), (c3), and (d3)). After the brightening and bidirectional flows appeared consecutively, F1 became active and finally erupted (see Figure 3). Therefore, we suggest that the brightening and bidirectional flows can be considered as precursors for the eruption of F1-R, which may be responsible for the instability of F1-R via magnetic reconnection (Wei et al. 2020; Koleva et al. 2022). Furthermore, we noted that the brightening and bidirectional flows are only observed in AIA/EUV wavelengths (panels (b1)–(b3), (c1)–(c3), and (d1)–(d3)), which is especially noticeable in the 131 Å channel. But they were not observed in the Hα channel (panels (a1)–(a3)). These observations indicate that magnetic reconnection may occur in the upper atmosphere.

Figure 2. Time-sequence series of images acquired at Hα, 304, 171, and 131 Å channels showing the brightening and bidirectional flows that appeared near the right part of F1 before its eruption. The green arrows in the left column (panels (b1)–(d1)) are indicate the locations of brightening. The green arrows in the middle column (panels (b2)–(d2)) and the right column (panels (b3)–(d3)) represent the bidirectional flows.
Download figure:
Standard image High-resolution imageFigure 3. The interaction process between F1-R and F2 as well as its associated successive eruptions in 304, 171, 131 Å, and Hα wavelengths. The black solid line "AB" in panels (a1), (b1), and (c1) marks the slit position of the time–distance diagram in Figure 4. In panels (a1)–(a4) in the top row, the LOS magnetic fields are overlaid on the Hα images; positive (negative) magnetic fields are marked by red (blue) contours, and the contour levels are ±400 and ±1000 G. In all panels, F1-R and the part of F2 near it are marked by black and white arrows, respectively. Green arrows indicate the other part of F2 in the right two columns. Blue arrows in the AIA wavelengths point to the brightening. An animation of the 304, 171, 131 Å, and Hα images is available. Its duration is 4 s and it shows the evolution from 07:25 UT to 07:55 UT on September 9.
(An animation of this figure is available.)
Download figure:
Video Standard image High-resolution image3.3. The Interaction between F1-R and F2 and Its Associated Eruptions
The interaction process between F1-R and F2 is shown in Figure 3. In order to present the interaction process in detail, we also created spacetime diagrams along the black line "AB" in panels (a1), (b1), and (c1) of Figure 3, and present them in Figure 4. The images we selected in Figure 4 are from 07:20 UT to 08:00 UT on 2021 September 9. Here we manually selected some data points along some typical features in Figure 4 to track the trajectory of the filament eruption and motion. Then we fitted these data points by using a linear function to obtain the velocity and the standard deviation of the filament eruption and motion. Cheng et al. (2020) investigated 12 solar filament eruption events; they used a combination of a linear function and a nonlinear (or exponential) function to fit the slow rise phase and the main-acceleration phase of these eruptive filaments well. With this method of Cheng et al. (2020), Devi et al. (2021) and Chandra et al. (2021) made a detailed analysis of the contraction and expansion of the loops during the filament eruptions. Because our work was mainly focused on the interaction between two filaments that occurred when one erupting filament was approaching another unstable one, we only used the linear function to fit the data.

Figure 4. Time–distance diagrams showing the interaction process between F1-R and F2 by using the images from NVST/Hα and SDO/AIA acquired at 304 and 171 Å wavelengths. The diagrams are obtained along the slit "AB" in Figures 3(a1), (b1), and (c1), respectively. In all the panels, the four vertical white dashed lines mark the four moments "07:32 UT," "07:37 UT," "07:47 UT," and "07:52 UT," respectively. The direction of motion of F1-R is indicated by blue lines and F2 by cyan lines. Green labels "Activated(F1-R)" and "Activated(F2)" represent the activation of F1-R and F2, respectively.
Download figure:
Standard image High-resolution imageAfter the brightening and bidirectional flows appeared, F1-R became unstable and started to become active at about 07:32 UT, and then it expanded and erupted to the right with a velocity of 1.8 ± 0.2 to 2.0 ± 0.2 km s−1 until about 07:52 UT (see the black arrows in Figure 3 and the blue lines in Figure 4). During its expansion and eruption, we noted that F1-R was approaching closer to the nearby F2 (see the black and white arrows in Figure 3 and the blue lines and cyan lines in Figure 4). When their threads collided with each other, magnetic reconnection occurred between them, then another brightening appeared between the two filaments. This brightening appeared at about 07:41 UT, spread upward, and then disappeared gradually (see the blue arrows in Figure 3). The bidirectional flows (shown in Figure 2) that appeared in the eruption process of F1-R can also be a signature of the magnetic reconnection that was led by the two colliding filament threads. These observations conformed to the previous studies of Yang et al. (2017) in which the brightening appeared between the two colliding filaments by magnetic reconnection. Furthermore, the filament threads of F1-R first showed a counterclockwise twisting motion and then a clockwise untwisting motion during its eruption (see the black arrows in Figures 3(a2) and (a3)). The clockwise rotational motion of F1-R implies the filament has sinistral chirality. At about 07:37 UT, the nearby part of F2 started to move rightward with a velocity of 1.3 ± 0.1 to 1.5 ± 0.1 km s−1 due to the disturbance from the erupting part of F1. The rightward movement of F2 lasted for about 15 minutes until the eruption of F1-R ended at about 07:52 UT (see the cyan lines in Figure 4). At about 07:47 UT, F2 became active and its northeast part rose slowly (see the green arrows in Figure 3). The final eruption of F2 will be described in the next paragraph. We highlighted that the activation and eruption of F2 were disturbed by the first erupting part of F1. The interaction that occurred between F1-R and F2 by magnetic reconnection might be the main factor responsible for the eruption of F2.
In Figure 5, the right and left parts of F1 are marked by "F1-R" and "F1-L," respectively. At about 07:52 UT, when F2 erupted rapidly toward the middle of filament F1 (see the green arrows in the left two columns), F1-L started to become active and erupted toward the south as its overlying fields were pushed by filament F2 (see the blue arrows in the left two columns). The eruption of F1-L lasted about 10 minutes (see the blue arrows and green arrows in the left three columns). F1-R was in equilibrium during the eruption of its left part (see the black arrows). After the eruption of filaments F1 and F2, two bright ribbons (C3.5 class flare, started at 08:09 UT, peaked at 08:31 UT, and ended at 08:43 UT) appeared on either side of F1 (see the green arrows in panels (a4), (b4), and (c4)). It is obvious that the flare was related to the eruption of F1. Furthermore, we can still observe part of the magnetic structures and plasma materials of the filament after the eruptions (see the yellow and cyan arrows in panels (a4), (b4), and (c4)). No CME was produced in these events, which indicates that they are failed eruptions (Joshi et al. 2022). Moreover, F2 appeared to rotate, which implies that it might possess a twisted magnetic structure (see the green arrows in the left three columns) (Xue et al. 2016; Yan et al. 2020a). This rotational motion might be caused by magnetic reconnection (Guo et al. 2021).
Figure 5. Time-sequence series of images acquired at 304 Å, 171 Å, and NVST/Hα wavelengths to show the successive eruptions of F2 and the left part of F1. In panels (a1)–(a4) in the top row, the LOS magnetic fields are overlaid on the Hα images, positive (negative) magnetic fields are denoted by red (blue) contours, and the contour levels are ±400 and ±1000 G. The white solid line "CD" in panels (a1), (b1), and (c1) marks the slit position of the time–distance diagrams in Figure 6. In the left three columns, the white and black arrows indicate the left and right parts of F1, respectively (marked "F1-L" and "F1-R"). F2 is erupting in the direction of the green arrows and F1-L in the direction of the blue arrows. In panels (a4), (b4), and (c4), the green arrows indicate the two flare ribbons. The visible structures after the eruptions of F1 and F2 are marked by cyan and yellow arrows. An animation of the 304 Å, 171 Å, and Hα images is available. Its duration is 6 s, covering from 07:50 UT to 08:35 UT on September 9.
(An animation of this figure is available.)
Download figure:
Video Standard image High-resolution imageFigure 6 shows the time–distance diagrams along the line "CD" in Figures 5(a1), (b1), and (c1), to show the successive eruptions of F2 and F1-L. The images we selected are from 07:40 UT to 08:10 UT on 2021 September 9, which mainly includes the events we were interested in. Here we obtained the velocity and its standard deviation by using the same fitting function as in Figure 4. We can see clearly that F2 began to become active at about 07:47 UT and rose slowly with a velocity of 3.6 ± 0.2 to 4.1 ± 0.7 km s−1 at first. Then it erupted toward the middle part of F1 (at about 07:52 UT) with a relatively fast speed of 9.5 ± 0.5 to 10.4 ± 0.4 km s−1 (see the blue lines in Figure 6). During the eruption process of F2, F1-L erupted as well, with a velocity of 4.0 ± 0.4 to 5.1 ± 0.4 km s−1, as shown by the cyan lines in Figure 6.
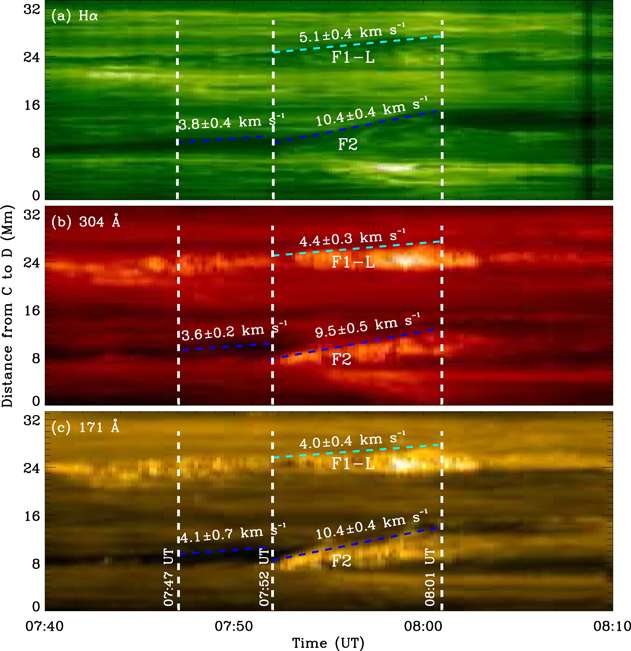
Figure 6. Time–distance diagrams showing the successive eruptions of F2 and F1-L by using the images from NVST/Hα and SDO/AIA acquired at 304 and 171 Å wavelengths. The diagrams are obtained along the slit "CD" in Figures 5(a1), (b1), and (c1), respectively. In all the panels, the three vertical white dashed lines mark the three moments "07:47 UT," "07:52 UT," and "08:01 UT". F2 and F1-L are marked by the blue lines and cyan lines correspondingly.
Download figure:
Standard image High-resolution image3.4. The Extrapolation of the NLFFF and PFSS and the Calculated Decay Index above the Filaments
We utilized the NLFFF extrapolation method (Wiegelmann 2004; Wiegelmann et al. 2006; Wiegelmann & Inhester 2010) to obtain the magnetic structures of F1 and F2 as well as details of the magnetic field surrounding them before their eruptions. The results demonstrated that F1 was composed of three sections, which are represented by the purple, cyan, and green lines (see Figure 7). It is obvious that the twists in F1-R (see the purple lines and the right green lines) are larger than that in F1-L (see the cyan lines and the left green lines). This is consistent with our observations in Figures 3(a2), (a3), and (a4) (indicated by the black arrows) that F1-R manifested as apparently twisting and untwisting motions during its eruption while F1-L was not as obvious as F1-R (see the blue arrows in Figures 5(a1) and (a2)). In Figure 7, filament F2 was shown by yellow lines; we can see that its twisted structure was in accordance with the rotational motion we observed during its eruption process (see the green arrows in Figure 3 and the left three columns of Figure 5). Additionally, partial footpoints of F1 and F2 were anchored in nearly the same location, which was consistent with the observations in Figures 1(a7), (b), and (c). The three sets of field lines of F1 here might provide an explanation for F1's partial eruption in which its right part erupts before its left part (see the purple and cyan lines in Figure 7, respectively). Therefore, we speculate that the green field lines may be the remaining part we observed after the partial eruption of F1. Moreover, the stronger overlying arcade fields of F1 and F2 (shown by white lines in Figures 7(b) and (c)) might prevent the successful eruptions of the two filaments. To further investigate the eruption mechanisms of filaments, we derived the decay index (n) of the horizontal fields (Bh
) at altitude h above the filaments based on the potential fields. The decay index is given by  (Kliem & Török 2006), and it is the condition for the ideal MHD torus instability with a critical value of 1.5. The decay index we calculated here was remarkably below the value of 1.5 (see the curve in the vertical plane of Figure 7(d)), which is a possible reason for the failed (or confined) eruptions of filaments F1 and F2. Furthermore, the results from the PFSS extrapolation demonstrated that there were many magnetic loops above the AR; these overlying loops connected the western leading main negative sunspot to the eastern following main positive sunspot (see the pink lines in panels (e) and (f)). These loops might be the strong overlying constraint forces above both F1 and F2 (see the white arrows and pink lines in panels (e) and (f)), and thus can be a reason for further explaining the filament failed eruptions. The south of the AR has a lower overlying field than the north, which can be used to explain the orientations of the filament eruptions, which tended to be toward the north of the AR (see the pink lines in the north and south of panels (e) and (f)).
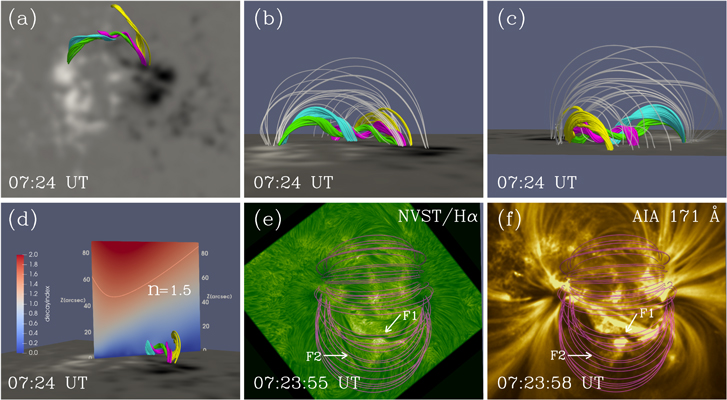
Figure 7. (a)–(c) The NLFFF extrapolation from different viewing angles: (a) top view, (b) and (c) side views. (d) The decay index of the background fields with the altitude above the filaments F1 and F2, in which the curve marks the decay index value of 1.5. In all the panels, the white (black) regions are the positive (negative) magnetic fields of the vertical component at 07:24 UT on 2021 September 9. F1 is represented by the purple, cyan, and green lines, while F2 is represented by the yellow lines. The white lines mark the overlying fields of F1 and F2 in panels (b) and (c). Panels (e) and (f) show the extrapolation of the PFSS from the opposite viewing angle to panel (a), and these two panels have the same field of view. The pink lines represent the overlying magnetic field lines of filaments F1 and F2, which are superposed on the NVST/Hα (07:23:55 UT) and AIA 171 Å (07:23:58 UT) images, respectively. The white arrows indicate filaments F1 and F2.
Download figure:
Standard image High-resolution image3.5. A Cartoon to Illustrate the Whole Eruption Scenario of the Filaments
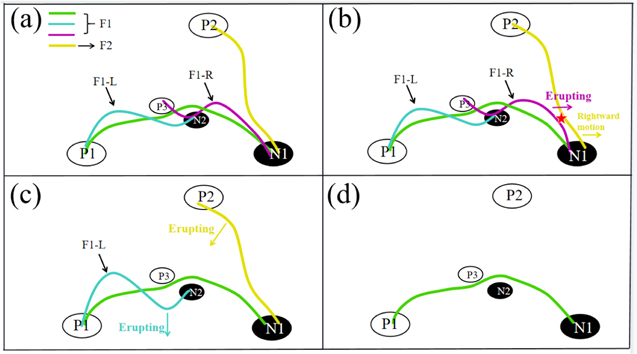
In order to make a concrete description of the interaction between the filaments F1-R and F2 as well as its associated partial eruptions, we draw a cartoon in Figure 8. Panel (a) shows the pre-eruption state of filaments F1 and F2, and both of them have flux rope structures. In particular, F1 consisted of three sets of twisted magnetic fields (see the cyan, purple, and green lines), which is as illustrated in Figure 7(a). Furthermore, the footpoints of F1 are rooted at "P1" and "N2" (cyan line), "P3" and "N1" (purple line), and "P1" and "N1" (green line). The footpoints of F2 are rooted at "P2" and "N1." During the eruption of F1-R, as it gradually approaches F2, magnetic reconnection occurs between them due to their collision (see the purple arrow and red star in panel (b)). These produce a rightward motion in F2 at first (see the yellow arrow in panel (b)) and then it becomes active and erupts. Subsequently F1-L erupts as F2 moves rapidly toward it (see the yellow arrow and cyan arrow in panel (c)). Meanwhile, we can see that F1-R disappeared after its eruption (no purple line in panel (c)). Finally, F-L also disappeared due to its eruption (no cyan line in panel (d)). The green line in panel (d) represents the part that we can clearly see in Figure 5(a4). As for F2, here we only show its erupted part with the yellow line in panels (a), (b), and (c). This part eventually disappeared due to its eruption (no yellow line in Figure 8(d)). In fact, F2 was a partial eruption, and part of its material and magnetic field remained in the region of origin of the corona (see the yellow arrow in Figure 5(a4)).
Figure 8. A sketch to show the whole scenario of the filament eruptions. In all panels, F1 is represented by the green, cyan, and purple lines, and F2 by the yellow line (as labeled in (a)). The cyan (purple) line represents the left (right) part of F1, labeled "F1-L" ("F1-R"). The white (black) ellipses represent the positive- (negative-)polarity fields that the filaments are rooted in, labeled "P" and "N." In panel (b), the purple arrow indicates the direction of eruption of F1-R, and the yellow arrow indicates the direction of motion of the footpoint of F2. The red star marks the site of the magnetic reconnection that happened between F1-R and F2. In panel (c), the yellow (cyan) arrow indicates the direction of eruption of F2 (F1-L).
Download figure:
Standard image High-resolution image
4. Conclusions and Discussions
In this paper, we have studied the interaction between filaments F1 and F2, as well as their successive partial eruptions in AR NOAA 12866 on 2021 September 9 by utilizing the multiwavelength observational data at high spatial and temporal resolution from the SDO and NVST. We found that the first brightening and the bidirectional flows that continuously appeared near F1-R caused it to become active and finally erupt. During the eruption of F1-R, it approached and collided with the nearest part of F2. The bidirectional flows and the second brightening that appeared between them indicate that magnetic reconnection happened between F1-R and F2, which contributes to one leg of F2 having a rightward motion at first. As it moves, F2 starts to become active and erupts due to loss of equilibrium. Furthermore, when F2 erupted rapidly toward the middle part of F1, F1-L became unbalanced and erupted as well due to its overlying magnetic fields being disturbed by the erupted F2. That is to say, the interaction caused by the eruption of F1-R plays a key role in these eruption events. According to Moon et al. (2002), Török et al. (2011), Jiang et al. (2011), Wang et al. (2016), and Joshi et al. (2016), these successive filament eruptions were consistent with sympathetic eruption episodes in which certain physical linkages might be built between them considering their close connections both spatially and temporally. Therefore, the investigation of the interaction between two filaments can shed light on the understanding of the triggering mechanisms of sympathetic filament eruptions. None of the eruption events we studied here produced any CME; parts of the filament structures and materials are still observed clearly after the eruption of F1 and F2. Moreover, during the eruption of F1, its right part erupted first and then its left part. These observations were further confirmed by the result of the NLFFF extrapolation that F1 has a three-part structure. Meanwhile, according to the NLFFF extrapolation and the decay index of the background magnetic fields above the filaments F1 and F2, we suggest that the strong confinement and lower decay index of these background fields above F1 and F2 might prevent their eruptions, thus leading to failed eruptions. Consequently, we conclude that the eruption of filaments involved in our study is likely to be sympathetic partial failed eruptions. Besides, the results from the NLFFF extrapolation demonstrated that both F1 and F2 have twisted magnetic structures, which are consistent with the observations that they manifested noticeable untwisting motions during their eruption processes.
The brightening that appeared near the footpoint of F1-R before its eruption may be caused by the magnetic reconnection that happened between the footpoint of F1-R and its ambient magnetic fields. By analyzing the results of the observation and the NLFFF extrapolation, we estimated that the twist of F1-R was around 1.5 turns, which was lower than the theoretical threshold of ideal MHD. Within the framework of ideal MHD, the kink instability can trigger filament eruption, but the torus instability is a decisive factor in determining whether an eruption is a failed event or a successful one (Török & Kliem 2005). The magnetic twist number was useful for forecasting the initiation of the solar eruption; it could be obtained by calculating the twists of every single magnetic field line (Liu et al. 2016) or by computing the degree of leg rotation of a filament (Yan et al. 2014). It also can be estimated based on the results of material motions and helical threads within a filament (Guo et al. 2021), and this is the method we used here.
In our work, the interaction between F1-R and F2 largely benefited from their nearby footpoints, which were rooted in nearly the same location (see Figures 1(b) and (c) and Figure 7(a)). When F1-R became active and expanded toward F2 with a velocity of 1.8 ± 0.2 to 2.0 ± 0.2 km s−1, they collided with each other and interacted. According to the interactive theory of Linton et al. (2001), when two flux ropes with opposite helicity collide with each other, the reconnection rate is dependent on their contact angle—a larger contact angle means a higher reconnection rate. In our case, F1-R and F2 have opposite signs of helicity. When F1-R collided with F2 the contact angle was less than 45°, and the magnetic reconnection between them would happen. It is obvious that our case is irrelevant to the slingshot, merge, and tunnel interactive theory of Linton et al. (2001). But it is similar to the bounce interaction picture of Linton et al. (2001). This is different from the majority of previous studies we mentioned above. Their work was either associated with the merge interaction, in which two interacting filaments have the same chirality (Liu et al. 2010; Li & Ding 2012; Zhu et al. 2015; Koleva et al. 2022) or associated with the slingshot interaction where two filaments have a larger contact angle of about 90° (Yang et al. 2017). In the study of Li & Ding (2012), two filaments with the same sign of helicity linked up partially through their interaction when they were rising, then they separated on different paths. Furthermore, Zhu et al. (2015) demonstrated that a double-decker configuration also favors a merge interaction. In this case, the lower filament erupted upwards as the upper filament descended. They eventually merged and produced a flare after their eruption. As for the slingshot episode, Yang et al. (2017) indicated that the magnetic topology of one filament was changed and some heated materials moved along it after the occurrence of filament interaction. This implied that magnetic reconnection can happen between the two interacting filaments. In our event, the morphology and magnetic topology of the two colliding filaments F1-R and F2 did not obviously change. But the brightening and bidirectional flows clearly appeared between them. These observational results conform to the bounce interactive episode of Linton et al. (2001). Within this episode, a relatively small contact angle means less reconnection was involved, and thus little energy can be released.
Numerous works have been done on partial eruptions of filaments, Cheng et al. (2018) investigated a successful partial eruption and a failed one, both resulting from vertical splitting of a filament during which internal reconnection was involved. Within this splitting scenario, the filament structure can be divided into an upper part and a lower part. Its upper structure erupted successfully due to its higher twists and torus instability, while its lower part remained stable (Monga et al. 2021). Furthermore, the partial eruptions of filaments can be related to the existence of a stable intermediate region that leads to a delayed or interrupted filament eruption (Chandra et al. 2017). In their work, one part of a filament, which was initially located in a lower and unstable zone (with a higher decay index), first rose due to the disturbance from jet activity. When it reached a higher and stable zone (with a lower decay index), it stopped rising and stayed at that position for several hours. It finally became unstable and erupted successfully when it reached a zone of stability. Their studies demonstrated that the existence of a stable zone should be responsible for the two-step eruption of a filament. Furthermore, the partial eruption of a filament can be caused by external reconnection within the model of magnetic breakout (Shen et al. 2012). Moreover, Bi et al. (2015) found a filament consisting of two twisted flux ropes. The one with a higher twist erupted owing to the kink instability, but the less twisted one did not erupt. They suggested that a twisted nonuniform field is favorable for the partial eruption of a filament. Besides, a filament erupted partially due to its overlying field being transferred from its western part to its eastern part by the continuous external reconnection (Hou et al. 2020). In our event, the interaction that happened between F1-R and the nearby F2 led to F2 and F1-L erupting successively, and no CME was produced. To our knowledge, it is rare that two parts of a filament erupt successively within around 20 minutes as a result of filament interaction instead of other trigger mechanisms, such as the MHD instability, as well as the reconnection of non-ideal MHD, which was not involved in reconnection between filaments. These results are confirmed by our observation and analysis.
However, due to the limitation of the instrument resolution, we cannot unambiguously discern the collided filament threads. But the second brightening might be an indicator of magnetic reconnection that was led by the collision of the two filaments. The bidirectional flows were related not only to the activation of F1-R but also to the interaction between the two colliding filaments. Therefore, the bidirectional flow and the second brightening that appeared between F1-R and F2 were typical features of the reconnection. During the interaction, F2 first showed a slow rightward motion with a velocity of 1.3 ± 0.1 to 1.5 ± 0.1 km s−1 due to the collision from the erupted F1-R. Then F2 lost its balance and erupted. The speed of F2 was obviously less than that of the erupted F1-R, which can be used to explain their ongoing interaction and the associated brightening (Figures 3 and 4). Meanwhile, we have not found any obvious photospheric activity below where the bidirectional flows and the second brightening appeared (see the animation associated with Figure 1(b)). These results provide further solid evidence for the filament interaction of F1-R and F2. And we suggest that the rightward motion of F2 is one of the manifestations of filament interaction.
Based on the observations mentioned above, we conjectured two possible causes of the eruption of F1-L. One is the disturbance induced by the erupting F2 as shown by Figures 5 and 6. The other is that F1 possesses a three-part structure, in which all parts of the filament flux rope were twisted together (Figure 7(a)). The overlying magnetic arcades shared by the right and left parts of F1 would be lifted to a certain altitude due to the eruptive right part, so the overlying fields were weakened to yield a favorable condition for the subsequent eruption of the left part, which is similar to Xue et al. (2014). The filaments often display many characteristics of dynamical evolution during their eruption processes, such as brightening, twisting, and untwisting motion, which can be driven by magnetic reconnections (Xue et al. 2016; Yan et al. 2020a; Guo et al. 2021). In our case, during the eruption of F1-R and F2, they also showed conspicuous untwisting motions, which indicated a filament with a flux rope structure. This is confirmed by the NLFFF extrapolation. Many factors can lead to a failed eruption, such as insufficient energy to power the eruption (Zhou et al. 2021) and a stronger constraint force above the filaments (Kuridze et al. 2013; Wang et al. 2016). The reason for the consecutive failed eruption events involved in our paper was similar to the latter case, which was verified from the calculated decay index, which did not satisfy the condition for torus instability. Moreover, F2 erupted toward the left part of F1 instead of in the other direction, which might imply that there were relatively weaker magnetic fields in the direction it erupted. During the eruption process of F1 and F2, they manifested as noticeable clockwise and counterclockwise rotational motions, respectively. These observations are consistent with the results from the NLFFF extrapolation.
At present, although the investigations on sympathetic solar filament eruptions have made certain progress, the observations concerning filament fine structures and dynamical evolution features are still limited by the resolution of instruments. Therefore, the interactive mechanism involved in our present paper requires for further confirmation.
The authors sincerely appreciate the anonymous referee for detailed comments and helpful suggestions to improve this paper, and the SDO and NVST teams for providing useful data, and sincerely appreciate all the staff working there. This work is sponsored by the National Science Foundation of China (NSFC) under the grant Nos. 11873087, 11973084, and 12003064, by the Yunnan Science Foundation of China under Nos. 202201AT070194, 202101AT070032, by Key Research and Development Project of Yunnan Province under No. 202003AD150019, by the Yunnan Key Laboratory of Solar Physics and Space Science under No. 202205AG070009, by Yunnan Science Foundation for Distinguished Young Scholars under No. 202001AV070004, by the Youth Innovation Promotion Association, CAS (No. 2019061), CAS "Light of West China" Program,and by Joint Funds of the National Natural Science Foundation of China (No.U1931116).