


Abstract
We present the analysis of ∼100 pc scale compact radio continuum sources detected in 63 local (ultra)luminous infrared galaxies (U/LIRGs; LIR ≥ 1011 L⊙), using FWHM ≲ 0 1–02 resolution 15 and 33 GHz observations with the Karl G. Jansky Very Large Array. We identify a total of 133 compact radio sources with effective radii of 8–170 pc, which are classified into four main categories—"AGN" (active galactic nuclei), "AGN/SBnuc" (AGN-starburst composite nucleus), "SBnuc" (starburst nucleus), and "SF" (star-forming clumps)—based on ancillary data sets and the literature. We find that "AGN" and "AGN/SBnuc" more frequently occur in late-stage mergers and have up to 3 dex higher 33 GHz luminosities and surface densities compared with "SBnuc" and "SF," which may be attributed to extreme nuclear starburst and/or AGN activity in the former. Star formation rates (SFRs) and surface densities (ΣSFR) are measured for "SF" and "SBnuc" using both the total 33 GHz continuum emission (SFR ∼ 0.14–13 M⊙ yr−1, ΣSFR ∼ 13–1600 M⊙ yr−1 kpc−2) and the thermal free–free emission from H ii regions (median SFRth ∼ 0.4 M⊙ yr−1,
  yr−1 kpc−2). These values are 1–2 dex higher than those measured for similar-sized clumps in nearby normal (non-U/LIRGs). The latter also have a much flatter median 15–33 GHz spectral index (∼−0.08) compared with "SBnuc" and "SF" (∼−0.46), which may reflect higher nonthermal contribution from supernovae and/or interstellar medium densities in local U/LIRGs that directly result from and/or lead to their extreme star-forming activities on 100 pc scales.
Export citation and abstract BibTeX RIS
1. Introduction
Luminous infrared galaxies (LIRGs; 1011 ≤ LIR [8–1000 μm] < 1012 L⊙) and ultraluminous infrared galaxies (ULIRG; LIR[8–1000 μm] ≥ 1012 L⊙) are an important class of objects for understanding massive galaxy evolution. Despite their rarity in the local universe, U/LIRGs are the dominant contributors to the comoving infrared (IR) luminosity density and star formation rate (SFR) density at z ≳ 1 (Chary & Elbaz 2001; Le Floc'h et al. 2005; Magnelli et al. 2011, 2013; Gruppioni et al. 2013), and ULIRGs are about 1000 times more common at z ∼ 2 compared to z ∼ 0 (e.g., Chapman et al. 2005; Magnelli et al. 2013).
Observations of U/LIRGs in the local universe revealed that a significant fraction of local LIRGs and nearly all local ULIRGs are interacting or merging gas-rich spirals (e.g., Lonsdale et al. 1984; Armus et al. 1987; Sanders & Mirabel1996). Simulations of galaxy interactions have been used to infer that such a process typically drives large fractions of interstellar materials into the central kiloparsec of each galaxy (e.g., Barnes & Hernquist 1992), triggering intense nuclear starbursts (e.g., Mihos & Hernquist 1996; Moreno et al. 2020) and/or fueling of powerful active galactic nuclei (AGNs; e.g., Di Matteo et al. 2005). This nuclear activity is thought to play a key role in the transformation of gas-rich systems into massive elliptical galaxies, the formation of quasars, and the coevolution of supermassive black holes and stellar bulges (e.g., Sanders et al. 1988; Hopkins et al. 2006). While the discovery of heavily obscured luminous AGNs in local U/LIRGs (Iwasawa et al. 2011; Treister et al. 2012; Ricci et al. 2017, 2021; Koss et al. 2018; Torres-Albà et al. 2018) has provided strong supporting evidence for this evolutionary scenario (see also review by U 2022), details regarding the interplay between star formation and AGN activity, as well as how they together (or separately) act upon the transformation of these extreme systems, still remain ambiguous. However, the extraordinary star-forming properties of local U/LIRGs relative to nearby normal galaxies (i.e., galaxies with LIR < 1011 L⊙; e.g., Lonsdale et al. 1984; Condon et al. 1991; Howell et al. 2010; Stierwalt et al. 2014; Piqueras López et al. 2016; Díaz-Santos et al. 2017; Linden et al. 2019, 2021; Larson et al. 2020; Song et al. 2021), and the prevalence of outflows observed in starburst-dominated local U/LIRGs (e.g., Rupke et al. 2005; Cazzoli et al. 2016; Barcos-Muñoz et al. 2018; Fluetsch et al. 2019, 2020; Vivian et al. 2019) highlight the pivotal role of star-formation-driven feedback in regulating their evolution. To better quantify the physical processes governing the evolution of local U/LIRGs, a robust characterization of the most energetic regions in these systems is necessary.
Due to heavy dust obscuration, especially in the central kiloparsec of U/LIRGs, observations of the optically thin radio emission provide the best tools for probing into the most obscured but energetically dominant regions in these systems. Condon et al. (1991) conducted the first subkiloparsec-scale radio continuum study of a sample of 40 local U/LIRGs at 8.4 GHz using the Karl G. Jansky Very Large Array (VLA), and concluded that most of their dust-obscured nuclei are powered by starbursts, with many as compact as 100 pc in radius. With the upgraded bandwidth of the VLA, observations at higher frequencies are now possible, allowing access to the faint, thermal free–free emission directly arising from ionizing photons from H ii regions (Condon 1992; Murphy et al. 2011) at subarcsecond resolutions. Using 33 GHz continuum VLA observations, Barcos-Muñoz et al. (2015, 2017) constrained the sizes and SFRs for the nuclei of the 22 most luminous local U/LIRGs. In the western nucleus of ULIRG Arp 220, the authors derived an SFR surface density of 104.1 M⊙ yr−1 kpc−2, the highest value ever measured, and far exceeding the theoretical limits for starbursts supported by supernovae feedback and dust-reprocessed radiation (Thompson et al. 2005; Kim & Ostriker 2015). What drives these extreme SFR surface densities? Are such conditions also observed in LIRGs at lower IR luminosity?
This paper aims to investigate the above questions. We present results from the high-resolution (01–02) component of a new multifrequency multiresolution radio continuum snapshot survey of 68 local U/LIRGs from the Great Observatories All-sky LIRG Survey (GOALS; Armus et al. 2009). In contrast to the previous radio surveys (e.g., Condon et al. 1991; Barcos-Muñoz et al. 2017) that focused on the most luminous objects, these 68 U/LIRGs span the entire IR luminosity range of the full GOALS sample of 201 U/LIRGs in the local universe (i.e., 1011–1012.5
L⊙), as demonstrated in Figure 1 (see Section 2 for details), and therefore represents a more diverse range of physical environments, including ones that more closely resemble nearby normal galaxies. These new observations also serve as an excellent companion to the Star Formation in Radio Survey (SFRS; Murphy et al. 2012, 2018; Linden et al. 2020), a study of 56 nearby normal galaxies observed at the same frequencies and physical scales as the U/LIRG sample presented in this paper. Linden et al. (2019) presented the first results from our new U/LIRG survey based on ∼1'' resolution observations. Despite finding extranuclear star formation enhancement relative to SFRS galaxies on kiloparsec scales, they concluded that nuclear star formation must drive GOALS systems above the star formation main sequence (e.g., Elbaz et al. 2011; Speagle et al. 2014) occupied by the SFRS galaxies. Subsequently in Song et al. (2021), four nuclear rings detected in our survey were examined at ∼100 pc (01) scales and compared to five nuclear rings detected in the SFRS galaxies. The nuclear ring star formation was found to contribute more significantly to the total star formation of the host galaxies for LIRGs compared with normal galaxies. In this paper, we extend the methodology adopted in Song et al. (2021) to study the ∼100 pc scale compact radio continuum sources detected in 63 U/LIRGs in the survey, with the aim of constraining the nature and physical properties of these energetic regions at frequencies unimpeded by dust extinction.

Figure 1. Basic properties (Heliocentric velocity and 8–1000 μm IR luminosity) of the GOALS-ES sample. Each system is color-coded by its merger stage, using visual classification by Stierwalt et al. (2013). The sample covers the full range of IR luminosities, distances, and merger stages represented by the GOALS sample of all 201 local U/LIRGs.
Download figure:
Standard image High-resolution imageThis paper is divided into six sections. We describe our sample, data, observation information, and reduction procedures in Section 2. In Section 3, we describe the methods used to identify and characterize individual regions of compact radio continuum emission. We further classify individual regions in each U/LIRG system into different types using ancillary multiwavelength data sets and information from the literature in Section 4, and present the derived region quantities for different region types. In Section 5, we discuss the limitations and implications of our results, complemented by results derived from observations of other U/LIRGs and nearby normal galaxies. Finally, Section 6 summarizes major results and conclusions.
Throughout this work, we adopt H0 = 70 km s−1 Mpc−1, Ωmatter = 0.28, and Ωvacuum = 0.72 based on the 5 yr Wilkinson Microwave Anisotropy Probe result (Hinshaw et al. 2009). These parameters are used with the three-attractor model (Mould et al. 2000) to calculate the luminosity distances of the sample.
2. Survey Description and Data Reduction
2.1. The GOALS "Equatorial" Survey
GOALS (Armus et al. 2009) is a multiwavelength imaging and spectroscopic campaign dedicated to studying the complete subset of over 200 local (z < 0.088) U/LIRGs from the IRAS Revised Bright Galaxy Sample of 629 extragalactic objects (S60 μm > 5.24 Jy, l > 5°; Sanders et al. 2003). The GOALS "equatorial" radio survey (hereafter GOALS-ES; see also Linden et al. 2019) is a multifrequency, multiresolution snapshot VLA survey designed to map the brightest radio continuum emission in all 68 U/LIRGs from GOALS that have a decl. of ∣δ∣ < 20°. This equatorial selection allows for detailed follow-up studies using ground-based facilities from both Hemispheres. The sample covers the entire range of LIR (1011–1012.5 L⊙), distances (VH = 1137–26,249 km s−1), and merger stages spanned by the full GOALS sample of 201 systems, as shown in Figure 1. A two-sample Kolmogorov–Smirnov (K-S) test on the LIR and VH distributions of GOALS and the equatorial sample yields p-values of 0.86 and 0.74, respectively. Hence, this equatorial sample serves as a statistically robust representation of the local U/LIRG population. Table 1 lists the basic properties of the GOALS-ES sample. In total, 18 systems are in (a) "pre-mergers," 10 in (b) "early-stage" mergers, four in (c) "mid-stage" mergers, 21 in (d) "late-stage" mergers, and 15 are (N) "non-mergers," based on visual classification by Stierwalt et al. (2013) using Spitzer imaging.
Table 1. Basic Properties of the GOALS-ES Sample
| ID | IRAS | Galaxy Name | R.A. (J2000) | Decl. (J2000) | log  ) ) | VH (km s−1) | DL (Mpc) | Scale (pc/'') | Stage |
|---|---|---|---|---|---|---|---|---|---|
| (1) | (2) | (3) | (4) | (5) | (6) | (7) | (8) | (9) | (10) |
| 1 | F00085-1223 | NGC 0034 | 00h11m06 56 56 | −12°06'282 | 11.34 | 5881 | 84 | 393 | d |
| 2 | F00163-1039 | MCG -02-01-052 | 00h18m5090 | −10°22'367 | 11.45 | 8125 | 117 | 540 | b |
| 3 | F01053-1746 | IC 1623 (VV 114) | 01h07m4759 | −17°30'242 | 11.59 | 6087 | 87 | 400 | c |
| 4 | F01076-1707 | MCG -03-04-014 | 01h10m0893 | −16°51'099 | 11.65 | 10536 | 152 | 689 | N |
| 5 | F01173+1405 | CGCG 436-030 | 01h20m0263 | +14°21'423 | 11.69 | 9362 | 134 | 612 | b |
| 6 | F01364-1042 | 01h38m5279 | −10°27'121 | 11.85 | 14464 | 211 | 931 | d | |
| 7 | F01417+1651 | III Zw 035 | 01h44m3056 | +17°06'090 | 11.64 | 8214 | 117 | 539 | a |
| 8 | F02071-1023 | NGC 0838 | 02h09m3866 | −10°08'472 | 11.05 | 3851 | 54 | 257 | a |
| 9 | F02114+0456 | IC 0214 | 02h14m0556 | +05°10'237 | 11.43 | 9061 | 130 | 592 | d |
| 10 | F02152+1418 | NGC 0877 | 02h17m5326 | +14°31'184 | 11.07 | 3913 | 55 | 261 | a |
| 11 | F02281-0309 | NGC 0958 | 02h30m4284 | −02°56'205 | 11.20 | 5738 | 81 | 379 | N |
| 12 | F02401-0013 | NGC 1068 | 02h42m4072 | −00°00'479 | 11.40 | 1137 | 17 | 80 | N |
| 13 | F02435+1253 | UGC 02238 | 02h46m1746 | +13°05'446 | 11.33 | 6560 | 93 | 433 | d |
| 14 | F02512+1446 | UGC 02369 | 02h54m0175 | +14°58'364 | 11.67 | 9761 | 140 | 640 | b |
| 15 | F03359+1523 | 03h38m4707 | +15°32'541 | 11.55 | 10613 | 153 | 693 | d | |
| 16 | F03514+1546 | CGCG 465-012 | 03h54m1595 | +15°55'434 | 11.16 | 6662 | 95 | 442 | c |
| 17 | F04097+0525 | UGC 02982 | 04h12m2268 | +05°32'491 | 11.20 | 5305 | 76 | 355 | d |
| 18 | F04191-1855 | ESO 550-IG02 | 04h21m2002 | −18°48'396 | 11.27 | 9652 | 140 | 637 | a |
| 19 | F04315-0840 | NGC 1614 | 04h33m5995 | −08°34'466 | 11.65 | 4778 | 69 | 323 | d |
| 20 | F04326+1904 | UGC 03094 | 04h35m3381 | +19°10'180 | 11.41 | 7408 | 107 | 493 | N |
| 21 | F05053-0805 | NGC 1797 | 05h07m4484 | −08°01'087 | 11.04 | 4457 | 65 | 304 | a |
| 22 | F05054+1718 | CGCG 468-002 | 05h08m2121 | +17°22'080 | 11.05 | 5049 | 73 | 340 | b |
| 23 | F05187-1017 | 05h21m0653 | −10°14'462 | 11.30 | 8474 | 123 | 566 | N | |
| 24 | 05442+1732 | 05h47m112 | +17°33'464 | 11.30 | 5582 | 81 | 381 | a | |
| 25 | F06295-1735 | ESO 557-G002 | 06h31m472 | −17°37'166 | 11.25 | 6385 | 94 | 439 | a |
| 26 | 07251-0248 | 07h27m3762 | −02°54'548 | 12.39 | 26249 | 401 | 1643 | d | |
| 27 | F07329+1149 | MCG +02-20-003 | 07h35m4344 | +11°42'348 | 11.13 | 4873 | 74 | 345 | a |
| 28 | F09111-1007 | 09h13m3769 | −10°19'246 | 12.06 | 16231 | 246 | 1073 | b | |
| 29 | F09437+0317 | Arp 303 (IC 0563/4) | 09h46m2070 | +03°03'304 | 11.23 | 6002 | 93 | 430 | a |
| 30 | F10015-0614 | NGC 3110 | 10h04m0211 | −06°28'295 | 11.37 | 5054 | 80 | 372 | d |
| 31 | F10173+0828 | 10h20m0024 | +08°13'328 | 11.86 | 14716 | 224 | 986 | a | |
| 32 | F11186-0242 | CGCG 011-076 | 11h21m1224 | −02°59'025 | 11.41 | 7464 | 117 | 538 | a |
| 33 | F11231+1456 | IC 2810 | 11h25m4507 | +14°40'360 | 11.45 | 10243 | 158 | 714 | a |
| 34 | F12112+0305 | 12h13m4602 | +02°48'422 | 12.36 | 21980 | 340 | 1427 | d | |
| 35 | F12224-0624 | 12h25m039 | −06°40'521 | 11.36 | 7902 | 124 | 570 | N | |
| 36 | F12243-0036 | NGC 4418 | 12h26m546 | −00°52'396 | 11.19 | 2179 | 36 | 170 | N |
| 37 | F12592+0436 | CGCG 043-099 | 13h01m5028 | +04°20'008 | 11.68 | 11237 | 174 | 782 | d |
| 38 | F12596-1529 | MCG -02-33-098 | 13h02m1966 | −15°46'042 | 11.17 | 4773 | 77 | 359 | b |
| 39 | F13188+0036 | NGC 5104 | 13h21m2309 | +00°20'332 | 11.27 | 5578 | 90 | 419 | N |
| 40 | F13197-1627 | MCG -03-34-064 | 13h22m2445 | −16°43'424 | 11.28 | 4959 | 80 | 375 | a |
| 41 | F13373+0105 | Arp 240 (NGC 5257/8) | 13h39m5534 | +00°50'095 | 11.62 | 6798 | 108 | 500 | b |
| 42 | F13497+0220 | NGC 5331 | 13h52m1632 | +02°06'180 | 11.66 | 9906 | 154 | 699 | c |
| 43 | F14348-1447 | 14h37m3828 | −15°00'242 | 12.39 | 24883 | 387 | 1596 | d | |
| 44 | F15107+0724 | CGCG 049-057 | 15h13m1307 | +07°13'321 | 11.35 | 3897 | 64 | 302 | N |
| 45 | F15276+1309 | NGC 5936 | 15h30m0085 | +12°59'221 | 11.14 | 4004 | 66 | 310 | N |
| 46 | F15437+0234 | NGC 5990 | 15h46m1641 | +02°24'556 | 11.13 | 3839 | 63 | 297 | a |
| 47 | F16164-0746 | 16h19m1175 | −07°54'030 | 11.62 | 8140 | 127 | 583 | d | |
| 48 | F16284+0411 | CGCG 052-037 | 16h30m5653 | +04°04'587 | 11.45 | 7342 | 115 | 531 | N |
| 49 | F16399-0937 | 16h42m4011 | −09°43'137 | 11.63 | 8098 | 126 | 579 | d | |
| 50 | F16504+0228 | NGC 6240 | 16h52m589 | +02°24'033 | 11.93 | 7339 | 115 | 529 | d |
| 51 | F16516-0948 | 16h54m2372 | −09°53'209 | 11.31 | 6807 | 107 | 495 | d | |
| 52 | F17138-1017 | 17h16m3568 | −10°20'405 | 11.49 | 5197 | 83 | 386 | d | |
| 53 | 17208-0014 | 17h23m2197 | −00°17'007 | 12.46 | 12834 | 197 | 874 | d | |
| 54 | 17578-0400 | 18h00m3186 | −04°00'534 | 11.48 | 4210 | 67 | 317 | b | |
| 55 | 18090+0130 | 18h11m3341 | +01°31'424 | 11.65 | 8759 | 134 | 610 | b | |
| 56 | F19297-0406 | 19h32m2230 | −04°00'011 | 12.45 | 25701 | 394 | 1619 | d | |
| 57 | 19542+1110 | 19h56m3578 | +11°19'049 | 12.12 | 19473 | 294 | 1257 | N | |
| 58 | F20304-0211 | NGC 6926 | 20h33m0613 | −02°01'389 | 11.32 | 5880 | 88 | 412 | d |
| 59 | F20550+1655 | II Zw 096 | 20h57m2438 | +17°07'392 | 11.94 | 10822 | 160 | 724 | c |
| 60 | F22287-1917 | ESO 602-G025 | 22h31m2548 | −19°02'040 | 11.34 | 7507 | 110 | 506 | N |
| 61 | F22491-1808 | 22h51m4935 | −17°52'249 | 12.20 | 23312 | 351 | 1466 | d | |
| 62 | F23007+0836 | NGC 7469 | 23h03m1564 | +08°52'255 | 11.58 | 4892 | 71 | 332 | a |
| 63 | F23024+1916 | CGCG 453-062 | 23h04m5655 | +19°33'071 | 11.38 | 7524 | 109 | 502 | N |
| 64 | F23157+0618 | NGC 7591 | 23h18m1625 | +06°35'091 | 11.12 | 4956 | 71 | 335 | N |
| 65 | F23157-0441 | NGC 7592 | 23h18m2219 | −04°24'574 | 11.40 | 7380 | 107 | 490 | b |
| 66 | F23254+0830 | NGC 7674 | 23h27m5671 | +08°46'443 | 11.55 | 8671 | 125 | 573 | a |
| 67 | 23262+0314 | NGC 7679 | 23h28m4662 | +03°30'414 | 11.11 | 5138 | 74 | 346 | a |
| 68 | F23394-0353 | MCG -01-60-022 | 23h42m0091 | −03°36'544 | 11.15 | 6966 | 100 | 464 | a |
Note. Column (1): Unique identifier for each IRAS system. Column (2): IRAS system name. Column (3): Commonly used galaxy name. Columns (4) and (5): J2000 coordinates for galaxy based on Spitzer IRAC 8 μm imaging (Chu et al. 2017; J. Mazzarella 2022, in preparation). Column (6): 8–1000 μm infrared luminosity in solar units. Column (7): Heliocentric velocity from the NASA/IPAC Extragalactic Database. Columns (8) and (9): Luminosity distance of the system and physical scale corresponding to 1'' at the distance of the system, calculated using the three-attractor model (Mould et al. 2000) and Ned Wright's Cosmology Calculator (Wright 2006), based on values from columns (4), (5), and (7). Column (10): Merger stage based on visual classification, from Stierwalt et al. (2013): a—pre-merger; b—early-merger; c—mid-merger; d—late-merger; N—isolated galaxy; see Stierwalt et al. (2013) for more details.
A machine-readable version of the table is available.
2.2. Observations and Data Reduction
The VLA observations for the GOALS-ES utilizes three receiver bands: the S band (2–4 GHz), Ku band (12–18 GHz), and Ka band (26.5–40 GHz), which has enabled us to sample a wide frequency range for characterizing the radio spectral energy distribution (SED). Each target was observed at each band in both the A-configuration (synthesized beam FWHM ∼ 006–06) and C-configuration (synthesized beam FWHM ∼ 06–70) to detect bright compact regions as well as large-scale diffuse structures. Ten systems in the sample were additionally observed with the Ka band in the B-configuration (beam FWHM ∼ 02) due to poor A-configuration detections. In this work, we focus on analyzing observations taken at the Ku band (15 GHz) and the Ka band (33 GHz) in the A- and/or B-configurations where the nuclear star-forming structures are resolved at subkiloparsec scales at the distances of these U/LIRGs (i.e., DL
∼ 100 Mpc, 1'' ∼ 500 pc). For simplicity, here we only provide descriptions on these relevant observations and data sets. Information on C-configuration observations and data sets can be found in Linden et al. (2019). A comprehensive description and atlas for all VLA images from the GOALS-ES will be presented in a forthcoming paper.
A-configuration observations at the Ku band and Ka band were initially carried out in two separate A-configuration cycles, from 2014 March 6–May 10 (14A–471, PI: A. Evans), and 2016 October 7–12 (16A-204, PI: S. Linden). For these observations, each galaxy was observed with 5 minute on-source time at the Ku band, and 10 minutes at the Ka band. Additional B-configuration observations at the Ka band were carried out in 2020 (20A–401, PI: Y. Song). These observations focused on 10 systems with extended emission that were clearly detected at the Ku band during the 14A–471 campaign, but had poor detections at the Ka band due to limited sensitivity of the snapshots. Therefore, these 10 systems were observed with longer on-source time (≳30 minutes) to ensure good detections for comparison with Ku-band observations. Additionally, Ku-band observations for six systems from 14A–471 were unsuccessful due to temporary malfunction of the re-quantizer, and were re-observed on December 10 (20B-313, PI: Y. Song) with 5 minutes on-source time. The project codes for the observations of each system used in this work are provided in Table A1 in Appendix A.
All raw data sets from project 14A–471 and 16A–204 were first reduced and calibrated into measurement sets (MS) using the Common Astronomy Software Applications (CASA; McMullin et al. 2007) VLA data calibration pipeline (v4.7.0). For observations from 20A–401 and 20B-313, we acquired the calibrated MSs directly from the NRAO Science Ready Data Products data archive (CASA v5.6.2 for 20A–401, v5.4.2 for 20B-313).
We then visually inspected the calibrated MS, flagged bad data related to RFI and specific antennae or channels, and then re-ran the appropriate versions of VLA pipelines on the flagged MS without Hanning smoothing. We repeated this procedure until all bad data were removed from the MSs.
We proceeded to image each science observation using tclean in CASA, utilizing the same versions that calibrations were performed with. In general, we adopted Briggs weighting with a robust parameter of 0.5, using the multiterm (multiscale) multifrequency synthesis deconvolving algorithm (Rau & Cornwell 2011) with scales = [0, 10, 30] pixels and nterm = 2. In cases where sensitivity was poor (peak S/N < 10), Natural weighting or a robust parameter of 1.0 was adopted instead to enhance sensitivity at the expense of the angular resolution. Cleaning masks were determined visually using the CASA viewer. Self-calibrations were not performed.
We detected emission at signal-to-noise ratio (S/N) ≳ 5 in 63 of the 68 GOALS-ES systems, at a resolution of ∼01–02 at 15 (Ku) and/or 33 GHz (Ka), corresponding to ∼10–160 pc at the distances of these systems. To our knowledge, this is the largest sample of local U/LIRGs that has been observed at high (>10 GHz) radio frequencies on ∼100 pc scales. The characteristics of the native-resolution images used in this paper are listed in Table A1. In Figure 2, we show several examples of the native-resolution images used for our analysis. The full image atlas will be presented in the upcoming survey paper.
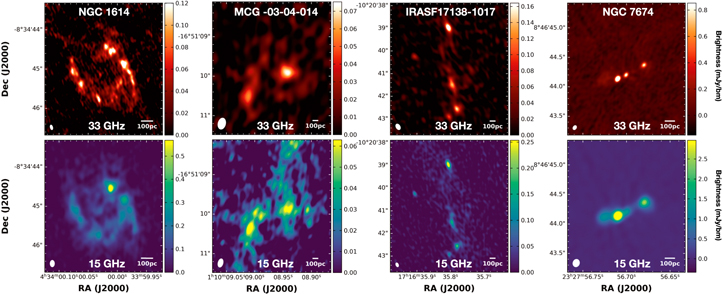
Figure 2. Examples of native-resolution 33 (top) and 15 GHz (bottom) images used in this work. Each image is displayed in linear stretch with bilinear interpolation, and the color bars show the brightness of the radio continuum emission, in the range of 0%–80% of the peak pixel value, in units of mJy beam−1. Synthesized beams (lower left) and scale bars of 100 pc (lower right) are shown.
Download figure:
Standard image High-resolution image2.3. Ancillary VLA Data
To expand our study, in Section 5 we include comparisons between properties of compact radio continuum sources detected in the GOALS-ES systems and of those detected in other local U/LIRGs and nearby normal galaxies. To do this, we utilize VLA continuum observations of 22 of the most luminous local U/LIRGs presented in Barcos-Muñoz et al. (2017; hereafter BM17) and of 56 nearby normal galaxies from the SFRS (Murphy et al. 2018; Linden et al. 2020).
Observations for BM17 were taken with all four VLA configurations at both 6 and 33 GHz, but we only utilize the high-resolution (VLA A- or B-configuration) 33 GHz observations here to complement our the A- or B-configuration GOALS-ES observations. Observations for the SFRS were taken with the VLA in the D-configuration at 33 GHz, C-configuration at 15 GHz, and B-configuration at 3 GHz. We only use the 15 and 33 GHz observations in this work for comparing with our GOALS-ES observations at the same frequencies. These ancillary VLA observations were reduced using CASA by BM17 and the SFRS team, and relevant details are provided in the original publications. The synthesized beams have FWHM ∼ 006–02 for the BM17 images, and FWHM ∼ 2'' for the SFRS images. At the distances of the BM17 (DL
∼ 170 Mpc) and SFRS galaxies (DL
∼ 11 Mpc), these values correspond to spatial resolutions of 20–200 pc and 30–290 pc, respectively, which are similar to the 10–160 pc resolutions reached by the GOALS-ES observations.
To ensure consistent comparisons, we reanalyzed these ancillary VLA images from BM17 and the SFRS using the same methods adopted here for the GOALS-ES images (see Sections 3 and 4). We present the results of these ancillary analyses in Appendix B, and compare them with the GOALS-ES results (see Section 4) in Section 5.
3. Analysis
3.1. Regions Identification and Measurements
To characterize the properties of compact radio sources detected in our VLA observations, we use the Python package Astrodendro (Robitaille et al. 2019) for region identification and measurements. Astrodendro identifies and categorizes structures in an image into trunk, branch, and leaf, based on three input parameters: the minimum brightness required for a structure to be physically meaningful (min_value), the minimum number of pixels in a structure (min_npix), and the minimum brightness relative to the local background required for a structure to be considered independent (min_delta). Structures identified as leaf are of the highest hierarchical order and are the independent regions of compact radio emission that we are interested in, while branch and trunk are the surrounding relatively diffuse emission.
To ensure that we only identify physically meaningful structures, we ran Astrodendro on both the 15 and 33 GHz images of each system with min_value = 5σrms and min_delta = 1σrms where σrms is the rms noise measured in an emission-free region of the image before primary-beam correction. We follow Song et al. (2021) and set min_npix to be a quarter of the area of the synthesized beam, to avoid identifying noise spikes yet allowing detection of small unresolved regions. Despite that extended diffuse emission is largely filtered out in these observations, complex structures encompassing trunk, branch, and leaf are identified in several systems. For our purpose of characterizing the most compact radio sources, we only focus on the identified leaf structures in subsequent analysis.
Because the 33 GHz radio continuum more directly traces thermal free–free emission from star formation (e.g., Condon 1992), in general we use Astrodendro results derived at 33 GHz for region identification and characterization. This also allows more robust constraints on the region sizes and surface brightness, given that 33 GHz observations either have higher native resolutions than 15 GHz observations, or better sensitivity (i.e., observations from 20A–401). In 10 systems and NGC 5258 in Arp 240, only the 15 GHz emission is bright enough to be identified via Astrodendro at native resolutions, and hence 15 GHz results were used instead. We also visually inspected all images and Astrodendro results to ensure that any identified structures associated with image artifacts are excluded from further analysis.
To account for the image noise and its influence on size and flux measurements of the identified regions, we re-ran Astrodendro 1000 times, randomly adjusting the brightness of each pixel sampling from a Gaussian distribution defined by the rms noise σrms and a VLA flux calibration error (10%). 17 The standard deviations of the results from the 1000 runs are used to quantify the uncertainties in measured flux densities and sizes. Figure 3 shows two examples of Astrodendro output for a single run. Given that we only focus on the most compact and distinct clumps in these systems, the uncertainties introduced by the image noise are estimated to be low in general, on the order of a few percent. Additionally, large-scale diffuse emission that could more significantly influence the source identification and measurements is largely filtered out in the A-/B-configuration VLA observations used here.
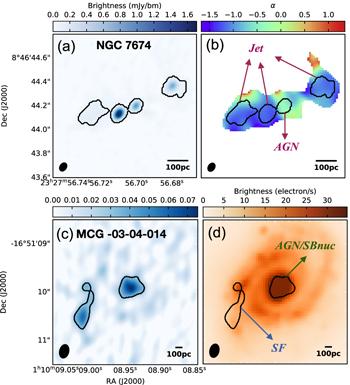
Figure 3. Images of NGC 7674 (a) and (b), and MCG-03-04-014 (c) and (d). These example images illustrate region identification, measurement, and classification procedures described in Sections 3 and 4.1. (a) and (c): native-resolution 33 GHz images, as displayed in Figure 2, with black contours outlining the areas of individual radio regions identified as leaf in a single run of Astrodendro. (b): 15–33 GHz spectral index map for NGC 7674 allows for the identification of synchrotron-dominated radio jets with steep spectra (α ∼ −1) and AGNs with flat spectrum (α ∼ 0). Black contours are the same as in panel (a). (d): Archival HST/NICMOS F160W is used to locate the nucleus and off-nuclear star-forming region identified in MCG-03-04-014, as shown in panel (c). In panels (b) and (d), region types classified following the methodology outlined in Section 4.1 are labeled. In each panel, the black ellipse represents the native synthesized beam.
Download figure:
Standard image High-resolution image3.2. 15–33 GHz Spectral Index
To better understand the nature of the identified regions of compact radio continuum emission, we measured the 15–33 GHz radio spectral index associated with each region, which can be used to estimate the relative contribution of thermal free–free emission to the total radio continuum emission at 33 GHz. To accomplish this, we smoothed and re-gridded the 15 and 33 GHz image of each galaxy to have a common resolution and pixel scale. Next, we again performed Astrodendro analysis on these beam-matched images following the same procedures described in Section 3.1. For most regions, boundaries identified using the 33 GHz images were used to measure their 15 and 33 GHz flux densities, which are then used to calculate the 15–33 GHz spectral index, α, given by the slope between 15 and 33 GHz flux measurements with respect to frequency:
where ν1 = 33 GHz and ν2 = 15 GHz in our case. The uncertainty in α is calculated via error propagation, accounting for uncertainties in flux density measurements. For regions that were only identified at 15 GHz, either due to limited sensitivity or intrinsic faintness at 33 GHz, boundaries identified from the 15 GHz images were used instead, and hence, the derived spectral indices are upper limits. For each unresolved region that has an area smaller than the matched beam, we use the flux density measured within a beam-sized aperture centered on the region to estimate its spectral index.
4. Results
For each of the 63 systems with detections, at least one region was identified using Astrodendro. In total, we identified and characterized 133 regions at native resolutions at 33 and/or 15 GHz, 19 of which are unresolved by the native beams. Because the 15–33 GHz matched beams are two to five times larger than the native beams at 33 GHz, distinct compact regions at native resolutions are blended together into larger, more extended regions at matched resolutions. Therefore, at matched resolutions, only 115 regions were identified, including 12 regions unresolved by the matched beams.
To better distinguish regions identified at native and matched resolutions, for the rest of this paper, we use "native regions" to refer to regions characterized at native resolutions, and refer to those characterized at matched resolutions as "matched regions." All matched regions encompass at least one native region.
In the following sections, we present the derived properties of the native and matched regions. First, we classify regions into different types on the basis of their AGN activity (Section 4.1). In Sections 4.2 and 4.3 we use measurements made for the native regions to constrain the brightness temperatures, physical sizes, and luminosity surface densities of various region types. In Sections 4.4 and 4.5 we use measurements for the matched regions that are not associated with AGN activity to estimate their total and thermal-only SFR and surface densities. Measured and derived quantities for the native regions are presented in Table 2, and those for the matched regions are in Table 3.
Table 2. Measured and Derived Quantities for Regions Identified at Native Resolutions
| ID | Region | Type | R.A. (J2000) | Decl. (J2000) | Sν | log Re | log Lν | log 
| log Tb | log 
|
|---|---|---|---|---|---|---|---|---|---|---|
| (°) | (°) | (mJy) | (pc) | (erg s−1 Hz−1) | (erg s−1 Hz−1 kpc−2) | (K) | (K) | |||
| (1) | (2) | (3) | (4) | (5) | (6) | (7) | (8) | (9) | (10) | (11) |
| 1 | n1 | AGN | 2.777289 | −12.107661 | 1.70 ± 0.17 | 1.75 ± 0.04 | 28.16 ± 0.04 | 30.17 ± 0.09 | 1.65 ± 0.09 | 1.65 ± 0.09 |
| 2 | n1 | SBnuc | 4.712000 | −10.376830 | 1.10 ± 0.07 | 2.14 ± 0.02 | 28.27 ± 0.03 | 29.49 ± 0.04 | 1.66 ± 0.04 | ⋯ |
| 3 | n1 | SF | 16.947427 | −17.507269 | 0.20 ± 0.01 | 1.94 ± 0.01 | 27.24 ± 0.01 | 28.86 ± 0.03 | 0.35 ± 0.03 | 0.92 ± 0.21 |
| n2 | SF | 16.947899 | −17.507178 | 0.13 ± 0.02 | 1.62 ± 0.04 | 27.07 ± 0.08 | 29.34 ± 0.12 | 0.82 ± 0.12 | 0.93 ± 0.05 | |
| n3 | SF | 16.947995 | −17.507169 | 0.31 ± 0.03 | 1.77 ± 0.02 | 27.43 ± 0.04 | 29.4 ± 0.06 | 0.88 ± 0.06 | 1.5 ± 0.17 | |
| n4 | SF | 16.947943 | −17.507019 | 0.10 ± 0.02 | 1.63 ± 0.05 | 26.96 ± 0.09 | 29.2 ± 0.14 | 0.68 ± 0.14 | −0.31 ± 0.03 | |
| n5 | SF | 16.948030 | −17.506986 | 0.11 ± 0.02 | 1.64 ± 0.04 | 26.98 ± 0.07 | 29.21 ± 0.11 | 0.69 ± 0.11 | 0.68 ± 0.04 | |
| n6 | AGN/SBnuc | 16.948336 | −17.506803 | 0.89 ± 0.01 | 2.05 ± 0.01 | 27.89 ± 0.01 | 29.29 ± 0.01 | 0.77 ± 0.01 | 2.12 ± 0.06 | |
| 4 | n1 | SF | 17.537546 | −16.852919 | 0.08 ± 0.01 | 2.13 ± 0.01 | 27.36 ± 0.01 | 28.6 ± 0.01 | 0.05 ± 0.01 | 0.17 ± 0.23 |
| n2 | AGN/SBnuc | 17.537256 | −16.852756 | 0.12 ± 0.01 | 2.19 ± 0.01 | 27.53 ± 0.01 | 28.66 ± 0.01 | 0.12 ± 0.01 | 0.4 ± 0.14 | |
| 5 | n1 | SF | 20.010986 | 14.361711 | 0.09 ± 0.02 | <1.34 | 27.30 ± 0.10 | >30.12 | >1.58 | >2.16 |
| n2 | SF | 20.010978 | 14.361733 | 0.08 ± 0.02 | <1.34 | 27.23 ± 0.11 | >30.04 | >1.51 | 1.33 ± 0.08 | |
| n3 | AGN/SBnuc | 20.010989 | 14.361786 | 1.20 ± 0.04 | 1.73 ± 0.02 | 28.41 ± 0.02 | 30.45 ± 0.04 | 1.91 ± 0.04 | 2.92 ± 0.1 | |
| 6 | n1 | AGN/SBnuc | 24.720291 | −10.453247 | 2.30 ± 0.02 | 2.14 ± 0.01 | 29.09 ± 0.01 | 30.31 ± 0.01 | 1.75 ± 0.01 | 2.49 ± 0.11 |
| 7 | n1 | SF | 26.127251 | 17.102370 | 0.27 ± 0.07 | <1.23 | 27.64 ± 0.11 | >30.68 | >2.15 | 2.52 ± 0.02 |
| n2 | AGN/SBnuc | 26.127263 | 17.102392 | 1.60 ± 0.08 | 1.42 ± 0.02 | 28.41 ± 0.02 | 31.09 ± 0.04 | 2.56 ± 0.04 | >2.45 | |
| 8 | n1 | SF | 32.411082 | −10.146978 | 0.05 ± 0.01 | <1.15 | 26.25 ± 0.05 | >29.45 | >0.95 | >1.42 |
| 9 | e1 | Bg | 33.523529 | 5.171878 | 0.60 ± 0.01 | 1.59 ± 0.01 | 28.08 ± 0.01 | 30.41 ± 0.01 | 1.88 ± 0.01 | >2.26 |
| n1 | SBnuc | 33.522890 | 5.173353 | 0.12 ± 0.01 | 1.42 ± 0.02 | 27.36 ± 0.03 | 30.03 ± 0.04 | 1.50 ± 0.04 | 1.85 ± 0.26 | |
| 12 | n1 | AGN | 40.669625 | −0.013322 | 18 ± 0.18 | 0.9 ± 0.01 | 27.77 ± 0.01 | 31.47 ± 0.01 | 2.98 ± 0.01 | 4.08 ± 0.01 |
| n2 | Jet | 40.669639 | −0.013244 | 31 ± 0.29 | 0.99 ± 0.01 | 28.01 ± 0.01 | 31.54 ± 0.01 | 3.04 ± 0.01 | 3.89 ± 0.01 | |
| n3 | Jet | 40.669689 | −0.013158 | 20 ± 0.22 | 1.04 ± 0.01 | 27.82 ± 0.01 | 31.24 ± 0.02 | 2.75 ± 0.02 | 3.5 ± 0.01 | |
| 13 | n1 | AGN/SBnuc | 41.572942 | 13.095758 | 0.04 ± 0.01 | 1.77 ± 0.01 | 26.65 ± 0.01 | 28.62 ± 0.02 | 0.10 ± 0.02 | ⋯ |
| 14 | n1 | AGN/SBnuc | 43.507581 | 14.970808 | 0.68 ± 0.01 | 1.76 ± 0.01 | 28.16 ± 0.01 | 30.15 ± 0.01 | 1.62 ± 0.01 | 2.24 ± 0.05 |
| n2 | SBnuc | 43.507247 | 14.976514 | 0.46 ± 0.01 | 1.63 ± 0.01 | 27.99 ± 0.01 | 30.24 ± 0.01 | 1.71 ± 0.01 | 3.23 ± 0.2 | |
| 15 | n1 | AGN/SBnuc | 54.696273 | 15.548194 | 1.70 ± 0.08 | 1.91 ± 0.03 | 28.67 ± 0.02 | 30.35 ± 0.06 | 1.81 ± 0.06 | 2.36 ± 0.03 |
| 16* | e1 | SF | 58.567399 | 15.929631 | 0.16 ± 0.01 | 1.72 ± 0.01 | 27.22 ± 0.01 | 29.29 ± 0.02 | 1.45 ± 0.02 | ⋯ |
| 18 | n1 | AGN/SBnuc | 65.333298 | −18.810889 | 1.00 ± 0.01 | 1.95 ± 0.01 | 28.39 ± 0.01 | 29.99 ± 0.01 | 1.45 ± 0.01 | 2.09 ± 0.04 |
| 19 | n1 | SF | 68.500131 | −8.579383 | 0.19 ± 0.01 | 1.36 ± 0.01 | 27.03 ± 0.02 | 29.82 ± 0.02 | 1.31 ± 0.02 | 1.86 ± 0.39 |
| n2 | SF | 68.500257 | −8.579275 | 0.26 ± 0.03 | 1.44 ± 0.02 | 27.16 ± 0.05 | 29.79 ± 0.07 | 1.28 ± 0.07 | 1.38 ± 0.11 | |
| n3 | SF | 68.499996 | −8.579283 | 0.05 ± 0.01 | 1.12 ± 0.05 | 26.47 ± 0.10 | 29.73 ± 0.14 | 1.22 ± 0.14 | 0.94 ± 0.09 | |
| n4 | SF | 68.499973 | −8.579261 | 0.09 ± 0.01 | 1.22 ± 0.03 | 26.68 ± 0.05 | 29.75 ± 0.08 | 1.24 ± 0.08 | 1.26 ± 0.23 | |
| n5 | SF | 68.499889 | −8.579256 | 0.12 ± 0.05 | 1.25 ± 0.09 | 26.83 ± 0.17 | 29.82 ± 0.25 | 1.31 ± 0.25 | 1.31 ± 0.08 | |
| n6 | SF | 68.500288 | −8.579200 | 0.04 ± 0.01 | <1.15 | 26.37 ± 0.11 | >29.58 | >1.07 | 1.92 ± 1.27 | |
| n7 | SF | 68.500322 | −8.579181 | 0.15 ± 0.02 | 1.29 ± 0.04 | 26.91 ± 0.06 | 29.83 ± 0.09 | 1.32 ± 0.09 | 1.49 ± 0.13 | |
| n8 | SF | 68.499917 | −8.579186 | 0.13 ± 0.02 | 1.25 ± 0.04 | 26.86 ± 0.06 | 29.86 ± 0.1 | 1.35 ± 0.10 | >1.36 | |
| n9 | SF | 68.499954 | −8.579133 | 0.44 ± 0.04 | 1.49 ± 0.03 | 27.39 ± 0.04 | 29.92 ± 0.06 | 1.41 ± 0.06 | 1.73 ± 0.12 | |
| n10 | SF | 68.500325 | −8.579106 | 0.05 ± 0.01 | <1.15 | 26.47 ± 0.05 | >29.67 | >1.16 | 1.59 ± 0.35 | |
| n11 | SF | 68.500046 | −8.579042 | 0.10 ± 0.02 | 1.14 ± 0.05 | 26.73 ± 0.08 | 29.95 ± 0.13 | 1.44 ± 0.13 | 1.44 ± 0.13 | |
| n12 | SF | 68.500024 | −8.579036 | 0.07 ± 0.02 | <1.15 | 26.56 ± 0.11 | >29.77 | >1.26 | 0.82 ± 0.12 | |
| n13 | SF | 68.500080 | −8.579008 | 0.17 ± 0.02 | 1.32 ± 0.03 | 26.98 ± 0.05 | 29.84 ± 0.08 | 1.32 ± 0.08 | 1.17 ± 0.12 | |
| 20 | n1 | AGN | 68.890888 | 19.171595 | 0.08 ± 0.01 | 1.26 ± 0.02 | 27.05 ± 0.03 | 30.03 ± 0.04 | 1.50 ± 0.04 | >1.70 |
| 21 | n1 | SF | 76.936725 | −8.019272 | 0.15 ± 0.01 | 1.88 ± 0.01 | 26.87 ± 0.01 | 28.61 ± 0.01 | 0.10 ± 0.01 | ⋯ |
| n2 | SF | 76.937236 | −8.019239 | 0.09 ± 0.01 | 1.87 ± 0.01 | 26.67 ± 0.01 | 28.44 ± 0.01 | −0.07 ± 0.01 | ⋯ | |
| n3 | SF | 76.937247 | −8.019033 | 0.24 ± 0.01 | 1.94 ± 0.01 | 27.07 ± 0.01 | 28.7 ± 0 | 0.19 ± 0.01 | ⋯ | |
| n4 | SF | 76.936644 | −8.019017 | 0.16 ± 0.01 | 1.92 ± 0.01 | 26.90 ± 0.01 | 28.56 ± 0.02 | 0.05 ± 0.02 | ⋯ | |
| 22 | n1 | AGN/SBnuc | 77.088371 | 17.368975 | 2.80 ± 0.10 | 1.73 ± 0.02 | 28.29 ± 0.02 | 30.34 ± 0.04 | 1.83 ± 0.04 | 2.33 ± 0.02 |
| 23 | n1 | AGN/SBnuc | 80.277259 | −10.246119 | 1.60 ± 0.02 | 1.85 ± 0.01 | 28.47 ± 0.01 | 30.28 ± 0.01 | 1.74 ± 0.01 | 2.21 ± 0.05 |
| 24 | n1 | Ud | 86.796939 | 17.562867 | 0.24 ± 0.01 | 1.96 ± 0.01 | 27.29 ± 0.01 | 28.87 ± 0.02 | 0.35 ± 0.02 | 0.43 ± 0.06 |
| n2 | Ud | 86.796356 | 17.562908 | 0.57 ± 0.02 | 1.97 ± 0.01 | 27.65 ± 0.01 | 29.22 ± 0.02 | 0.70 ± 0.02 | 1.11 ± 0.05 | |
| n3 | Ud | 86.796706 | 17.562911 | 0.11 ± 0.01 | 1.78 ± 0.01 | 26.92 ± 0.02 | 28.86 ± 0.04 | 0.35 ± 0.04 | 0.41 ± 0.09 | |
| n4 | Ud | 86.796563 | 17.562983 | 0.36 ± 0.01 | 1.98 ± 0.01 | 27.45 ± 0.01 | 28.99 ± 0.03 | 0.47 ± 0.03 | 0.59 ± 0.05 | |
| n5 | Ud | 86.796260 | 17.563022 | 0.16 ± 0.01 | 1.76 ± 0.02 | 27.10 ± 0.03 | 29.1 ± 0.04 | 0.58 ± 0.04 | 0.52 ± 0.05 | |
| 25* | n1 | SBnuc | 97.946724 | −17.621568 | 1.90 ± 0.01 | 2.00 ± 0.01 | 28.31 ± 0.01 | 29.82 ± 0.01 | 1.99 ± 0.01 | 2.82 ± 0.02 |
| 26 | n1 | AGN/SBnuc | 111.906720 | −2.915072 | 1.70 ± 0.02 | 2.15 ± 0.01 | 29.51 ± 0.01 | 30.71 ± 0.01 | 2.08 ± 0.01 | 3.01 ± 0.05 |
| 27 | n1 | Ud | 113.930986 | 11.709761 | 0.03 ± 0.01 | <1.10 | 26.29 ± 0.10 | >29.60 | >1.08 | ⋯ |
| n2 | Ud | 113.931001 | 11.709783 | 0.05 ± 0.01 | <1.10 | 26.53 ± 0.09 | >29.84 | >1.33 | ⋯ | |
| n3 | AGN/SBnuc | 113.930955 | 11.709811 | 0.34 ± 0.12 | 1.40 ± 0.08 | 27.34 ± 0.15 | 30.05 ± 0.22 | 1.53 ± 0.22 | ⋯ | |
| 28* | n1 | Ud | 138.411783 | −10.322264 | 0.11 ± 0.02 | 2.10 ± 0.04 | 27.91 ± 0.08 | 29.2 ± 0.12 | 1.31 ± 0.12 | ⋯ |
| n2 | AGN | 138.411817 | −10.322197 | 0.06 ± 0.02 | 1.97 ± 0.07 | 27.62 ± 0.12 | 29.18 ± 0.18 | 1.29 ± 0.18 | ⋯ | |
| n3 | Ud | 138.411893 | −10.322031 | 0.21 ± 0.01 | 2.20 ± 0.01 | 28.18 ± 0.01 | 29.27 ± 0.02 | 1.38 ± 0.02 | ⋯ | |
| 29* | n1 | SBnuc | 146.584648 | 3.045767 | 0.18 ± 0.01 | 1.72 ± 0.01 | 27.27 ± 0.02 | 29.33 ± 0.03 | 1.48 ± 0.03 | ⋯ |
| 31 | n1 | AGN/SBnuc | 155.000861 | 8.226089 | 2.10 ± 0.02 | 1.92 ± 0.01 | 29.1 ± 0.01 | 30.77 ± 0.01 | 2.20 ± 0.01 | 3.39 ± 0.06 |
| 32 | n1 | AGN/SBnuc | 170.300994 | −2.984111 | 0.55 ± 0.01 | 1.56 ± 0.01 | 27.95 ± 0.01 | 30.34 ± 0.01 | 1.81 ± 0.01 | >2.28 |
| 33 | e1 | SF | 171.437174 | 14.675178 | 0.49 ± 0.01 | 1.61 ± 0.01 | 28.16 ± 0.01 | 30.44 ± 0.01 | 1.89 ± 0.01 | >2.26 |
| n1 | AGN/SBnuc | 171.437757 | 14.676531 | 0.44 ± 0.01 | 1.65 ± 0.01 | 28.11 ± 0.01 | 30.31 ± 0.02 | 1.77 ± 0.02 | 2.37 ± 0.13 | |
| 34 | n1 | AGN/SBnuc | 183.441419 | 2.810864 | 0.58 ± 0.03 | 2.11 ± 0.01 | 28.91 ± 0.02 | 30.2 ± 0.04 | 1.59 ± 0.04 | 1.94 ± 0.07 |
| n2 | AGN/SBnuc | 183.441903 | 2.811542 | 2.40 ± 0.02 | 2.24 ± 0.01 | 29.53 ± 0.01 | 30.55 ± 0.01 | 1.94 ± 0.01 | 2.91 ± 0.03 | |
| 35 | n1 | AGN | 186.266292 | −6.681283 | 0.84 ± 0.02 | 1.54 ± 0.01 | 28.19 ± 0.01 | 30.62 ± 0.02 | 2.09 ± 0.02 | 3.28 ± 0.22 |
| 36 | n1 | AGN/SBnuc | 186.727556 | −0.877617 | 7.50 ± 0.08 | 1.36 ± 0.01 | 28.05 ± 0.01 | 30.85 ± 0.02 | 2.35 ± 0.02 | 3.40 ± 0.01 |
| 37 | n1 | Ud | 195.459577 | 4.333481 | 0.07 ± 0.01 | 1.45 ± 0.02 | 27.39 ± 0.04 | 29.99 ± 0.06 | 1.44 ± 0.06 | 1.17 ± 0.10 |
| n2 | Ud | 195.459488 | 4.333506 | 0.07 ± 0.01 | 1.46 ± 0.03 | 27.39 ± 0.06 | 29.97 ± 0.09 | 1.42 ± 0.09 | >1.30 | |
| n3 | Ud | 195.459516 | 4.333522 | 0.06 ± 0.01 | 1.42 ± 0.04 | 27.31 ± 0.07 | 29.96 ± 0.11 | 1.41 ± 0.11 | 0.92 ± 0.20 | |
| 38 | n1 | SBnuc | 195.581962 | −15.767778 | 1.30 ± 0.04 | 1.62 ± 0.01 | 27.96 ± 0.01 | 30.22 ± 0.03 | 1.70 ± 0.03 | 2.30 ± 0.05 |
| 39 | n1 | AGN/SBnuc | 200.346350 | 0.342328 | 0.59 ± 0.01 | 2.12 ± 0.01 | 27.75 ± 0.01 | 29.02 ± 0.02 | 0.50 ± 0.02 | ⋯ |
| 40 | n1 | Jet | 200.601899 | −16.728475 | 1.80 ± 0.11 | 1.47 ± 0.02 | 28.13 ± 0.03 | 30.69 ± 0.05 | 2.18 ± 0.05 | 2.52 ± 0.02 |
| n2 | Jet | 200.601934 | −16.728439 | 0.39 ± 0.06 | <1.16 | 27.48 ± 0.07 | >30.66 | >2.14 | 2.36 ± 0.01 | |
| n3 | Jet | 200.601952 | −16.728417 | 0.62 ± 0.13 | <1.16 | 27.68 ± 0.09 | >30.86 | >2.34 | 3.32 ± 0.06 | |
| n4 | Jet | 200.601966 | −16.728397 | 0.57 ± 0.14 | <1.16 | 27.64 ± 0.11 | >30.82 | >2.31 | 2.96 ± 0.02 | |
| 41 | e1 | SF | 204.970597 | 0.836818 | 0.32 ± 0.02 | 1.57 ± 0.02 | 27.66 ± 0.03 | 30.03 ± 0.05 | 1.50 ± 0.05 | 1.52 ± 0.08 |
| n1 | SBnuc | 204.970514 | 0.840113 | 0.26 ± 0.01 | 1.49 ± 0.01 | 27.56 ± 0.01 | 30.09 ± 0.02 | 1.56 ± 0.02 | 2.15 ± 0.17 | |
| 41* | e2 | SF | 204.988087 | 0.828974 | 0.03 ± 0.01 | <1.50 | 26.69 ± 0.06 | >29.18 | >1.29 | ⋯ |
| e3 | SF | 204.988254 | 0.829603 | 0.01 ± 0.01 | <1.50 | 26.34 ± 0.08 | >28.83 | >0.94 | >1.44 | |
| 42 | n1 | SF | 208.067729 | 2.101314 | 0.06 ± 0.01 | 1.99 ± 0.02 | 27.25 ± 0.04 | 28.77 ± 0.06 | 0.23 ± 0.06 | 0.35 ± 0.13 |
| n2 | SF | 208.067588 | 2.101339 | 0.14 ± 0.01 | 2.1 ± 0.01 | 27.6 ± 0.02 | 28.91 ± 0.03 | 0.37 ± 0.03 | >1.20 | |
| n3 | SF | 208.067488 | 2.101405 | 0.05 ± 0.01 | 1.95 ± 0.03 | 27.15 ± 0.05 | 28.76 ± 0.08 | 0.22 ± 0.08 | 0.52 ± 0.22 | |
| n4 | SF | 208.067337 | 2.101547 | 0.06 ± 0.01 | 1.98 ± 0.02 | 27.21 ± 0.05 | 28.76 ± 0.07 | 0.21 ± 0.07 | 0.60 ± 0.26 | |
| n5 | SF | 208.067346 | 2.101630 | 0.02 ± 0.01 | 1.79 ± 0.08 | 26.78 ± 0.15 | 28.71 ± 0.21 | 0.17 ± 0.21 | 0.10 ± 0.13 | |
| n6 | SF | 208.067212 | 2.101680 | 0.01 ± 0.00 | <1.83 | 26.58 ± 0.09 | >28.42 | >−0.12 | >−0.04 | |
| e1 | SF | 208.067513 | 2.102364 | 0.11 ± 0.01 | 2.02 ± 0.01 | 27.51 ± 0.01 | 28.97 ± 0.02 | 0.43 ± 0.02 | 1.43 ± 0.26 | |
| 43 | n1 | AGN | 219.409501 | −15.006728 | 0.65 ± 0.04 | 2.09 ± 0.02 | 29.07 ± 0.02 | 30.39 ± 0.04 | 1.77 ± 0.04 | 2.02 ± 0.06 |
| n2 | AGN/SBnuc | 219.409984 | −15.005906 | 0.34 ± 0.04 | 2.02 ± 0.03 | 28.79 ± 0.05 | 30.24 ± 0.07 | 1.61 ± 0.07 | 1.79 ± 0.08 | |
| 44 | n1 | AGN | 228.304564 | 7.225519 | 7.10 ± 0.18 | 1.38 ± 0.03 | 28.54 ± 0.01 | 31.29 ± 0.05 | 2.78 ± 0.05 | 3.77 ± 0.01 |
| 45* | n1 | AGN/SBnuc | 232.503449 | 12.989301 | 0.17 ± 0.01 | 1.51 ± 0.01 | 26.95 ± 0.02 | 29.43 ± 0.03 | 1.60 ± 0.03 | 1.55 ± 0.1 |
| 46* | n1 | AGN | 236.568233 | 2.415485 | 0.18 ± 0.01 | 1.46 ± 0.01 | 26.93 ± 0.01 | 29.52 ± 0.02 | 1.70 ± 0.02 | 2.54 ± 0.25 |
| 47 | n1 | SF | 244.799038 | −7.900803 | 1.80 ± 0.13 | 1.65 ± 0.02 | 28.53 ± 0.03 | 30.74 ± 0.05 | 2.21 ± 0.05 | 2.35 ± 0.02 |
| n2 | AGN | 244.799097 | −7.900789 | 2.00 ± 0.05 | 1.55 ± 0.01 | 28.58 ± 0.01 | 30.98 ± 0.03 | 2.44 ± 0.03 | >2.57 | |
| 48 | n1 | Ud | 247.735558 | 4.083006 | 0.03 ± 0.01 | <1.7 | 26.59 ± 0.10 | >28.69 | >0.16 | 0.29 ± 0.1 |
| 49 | n1 | AGN/SBnuc | 250.667232 | −9.720342 | 2.00 ± 0.02 | 1.73 ± 0.01 | 28.58 ± 0.01 | 30.62 ± 0.01 | 2.09 ± 0.01 | 3.11 ± 0.06 |
| 50 | n1 | AGN | 253.245372 | 2.400925 | 10.0 ± 0.2 | 1.90 ± 0.02 | 29.22 ± 0.01 | 30.91 ± 0.04 | 2.38 ± 0.04 | 3.66 ± 0.01 |
| n2 | AGN | 253.245514 | 2.401328 | 2.50 ± 0.03 | 1.62 ± 0.01 | 28.59 ± 0.01 | 30.85 ± 0.01 | 2.32 ± 0.01 | >2.93 | |
| 51* | e1 | Ud | 253.599241 | −9.889218 | 0.04 ± 0.01 | 1.63 ± 0.02 | 26.76 ± 0.03 | 29.01 ± 0.05 | 1.16 ± 0.05 | ⋯ |
| 52 | n1 | SF | 259.149184 | −10.345253 | 0.07 ± 0.01 | 1.69 ± 0.01 | 26.75 ± 0.02 | 28.87 ± 0.04 | 0.35 ± 0.04 | 0.89 ± 0.3 |
| n2 | SF | 259.149083 | −10.345153 | 0.21 ± 0.01 | 1.9 ± 0.01 | 27.24 ± 0.01 | 28.94 ± 0.02 | 0.42 ± 0.02 | 0.83 ± 0.14 | |
| n3 | SF | 259.149142 | −10.344861 | 0.28 ± 0.01 | 1.96 ± 0.01 | 27.35 ± 0.01 | 28.93 ± 0.02 | 0.41 ± 0.02 | 0.59 ± 0.08 | |
| n4 | SF | 259.149608 | −10.344511 | 0.04 ± 0.01 | <1.63 | 26.45 ± 0.04 | >28.70 | >0.18 | >0.35 | |
| n5 | AGN/SBnuc | 259.149193 | −10.344161 | 0.31 ± 0.01 | 1.94 ± 0.01 | 27.40 ± 0.01 | 29.03 ± 0.02 | 0.52 ± 0.02 | 1.14 ± 0.09 | |
| 53 | n1 | AGN/SBnuc | 260.841483 | −0.283581 | 5.70 ± 0.13 | 1.94 ± 0.01 | 29.42 ± 0.01 | 31.04 ± 0.02 | 2.48 ± 0.02 | 3.02 ± 0.02 |
| n2 | Ud | 260.841533 | −0.283589 | 0.37 ± 0.07 | 1.48 ± 0.05 | 28.23 ± 0.08 | 30.77 ± 0.12 | 2.21 ± 0.12 | 1.59 ± 0.03 | |
| n3 | AGN/SBnuc | 260.841567 | −0.283583 | 0.18 ± 0.05 | <1.46 | 27.92 ± 0.11 | >30.5 | >1.94 | 2.24 ± 0.05 | |
| 54 | n1 | AGN/SBnuc | 270.132691 | −4.014867 | 7.30 ± 0.05 | 1.68 ± 0 | 28.60 ± 0.01 | 30.73 ± 0.01 | 2.22 ± 0.01 | 3.33 ± 0.01 |
| 55* | n1 | Ud | 272.889204 | 1.528424 | 0.13 ± 0.02 | 1.7 ± 0.03 | 27.45 ± 0.06 | 29.56 ± 0.09 | 1.71 ± 0.09 | 1.92 ± 0.1 |
| n2 | Ud | 272.889146 | 1.528432 | 0.22 ± 0.01 | 1.76 ± 0.02 | 27.68 ± 0.02 | 29.66 ± 0.04 | 1.80 ± 0.04 | 2.44 ± 0.15 | |
| e1 | SF | 272.888671 | 1.529303 | 0.07 ± 0.01 | 1.61 ± 0.01 | 27.15 ± 0.02 | 29.44 ± 0.03 | 1.59 ± 0.03 | >1.77 | |
| 56 | n1 | AGN/SBnuc | 293.092944 | −4.000269 | 0.81 ± 0.04 | 2.16 ± 0.02 | 29.18 ± 0.02 | 30.35 ± 0.04 | 1.72 ± 0.04 | 2.12 ± 0.07 |
| 57 | n1 | AGN/SBnuc | 299.149109 | 11.318064 | 1.10 ± 0.04 | 2.09 ± 0.01 | 29.06 ± 0.02 | 30.38 ± 0.03 | 1.78 ± 0.03 | 2.00 ± 0.05 |
| 58 | n1 | AGN | 308.275475 | −2.027358 | 1.60 ± 0.02 | 1.53 ± 0.01 | 28.19 ± 0.01 | 30.63 ± 0.01 | 2.11 ± 0.01 | 3.78 ± 0.11 |
| 59 | e1 | SF | 314.351562 | 17.127561 | 0.84 ± 0.01 | 1.76 ± 0.01 | 28.41 ± 0.01 | 30.4 ± 0.01 | 1.85 ± 0.01 | 2.48 ± 0.07 |
| 60* | n1 | AGN/SBnuc | 337.856224 | −19.034481 | 0.54 ± 0.00 | 1.93 ± 0 | 27.89 ± 0.01 | 29.53 ± 0.01 | 1.69 ± 0.01 | 2.63 ± 0.09 |
| 61 | n1 | AGN/SBnuc | 342.955627 | −17.873369 | 0.92 ± 0.01 | 2.05 ± 0 | 29.13 ± 0.01 | 30.54 ± 0.01 | 1.92 ± 0.01 | 3.07 ± 0.26 |
| 62 | n1 | AGN | 345.815075 | 8.873903 | 3.50 ± 0.24 | 1.58 ± 0.02 | 28.32 ± 0.03 | 30.67 ± 0.04 | 2.16 ± 0.04 | 2.95 ± 0.04 |
| 63 | n1 | AGN/SBnuc | 346.235651 | 19.552303 | 2.70 ± 0.03 | 1.74 ± 0.01 | 28.59 ± 0.01 | 30.61 ± 0.01 | 2.08 ± 0.01 | 2.76 ± 0.02 |
| 64 | n1 | SF | 349.567859 | 6.585778 | 0.30 ± 0.14 | 1.81 ± 0.11 | 27.26 ± 0.20 | 29.14 ± 0.29 | 0.63 ± 0.29 | 0.85 ± 0.05 |
| n2 | SF | 349.567884 | 6.585861 | 0.03 ± 0.01 | <1.57 | 26.31 ± 0.11 | >28.67 | >0.15 | >0.44 | |
| n3 | SF | 349.567767 | 6.585894 | 0.23 ± 0.04 | 1.80 ± 0.04 | 27.14 ± 0.08 | 29.04 ± 0.12 | 0.53 ± 0.12 | 0.69 ± 0.07 | |
| 65 | n1 | SBnuc | 349.594360 | −4.416128 | 0.23 ± 0.01 | 1.44 ± 0.01 | 27.48 ± 0.02 | 30.1 ± 0.03 | 1.57 ± 0.03 | 1.86 ± 0.20 |
| n2 | AGN | 349.590885 | −4.415828 | 0.89 ± 0.02 | 1.61 ± 0.01 | 28.07 ± 0.01 | 30.36 ± 0.02 | 1.84 ± 0.02 | 2.99 ± 0.15 | |
| 66 | n1 | Jet | 351.986339 | 8.778928 | 0.15 ± 0.28 | 1.34 ± 0.43 | 27.45 ± 0.82 | 30.27 ± 1.19 | 1.74 ± 1.19 | 1.85 ± 0.07 |
| n2 | Jet | 351.986291 | 8.778925 | 2.30 ± 0.04 | 1.60 ± 0.01 | 28.63 ± 0.01 | 30.93 ± 0.02 | 2.40 ± 0.02 | 3.99 ± 0.17 | |
| n3 | AGN | 351.986252 | 8.778944 | 0.94 ± 0.03 | 1.51 ± 0.01 | 28.24 ± 0.01 | 30.73 ± 0.03 | 2.20 ± 0.03 | 3.29 ± 0.16 | |
| n4 | Jet | 351.986165 | 8.778992 | 1.30 ± 0.06 | 1.68 ± 0.02 | 28.39 ± 0.02 | 30.54 ± 0.05 | 2.01 ± 0.05 | 2.77 ± 0.07 | |
| 67 | n1 | AGN | 352.194425 | 3.511397 | 0.12 ± 0.01 | 1.14 ± 0.01 | 26.90 ± 0.02 | 30.12 ± 0.03 | 1.61 ± 0.03 | >1.81 |
| e1 | SF | 352.193779 | 3.512247 | 0.10 ± 0.01 | 1.11 ± 0.02 | 26.81 ± 0.03 | 30.10 ± 0.04 | 1.59 ± 0.04 | >1.76 |
Note. Column (1): Identifier for the IRAS system, corresponding to column (1) in Table 1. For systems marked with *, 15 GHz measurements are reported, due to either nondetection or poor detection (S/N < 5) at 33 GHz. For all other regions, 33 GHz measurements are used (i.e., ν = 33). Column (2): Identifier for regions within each IRAS system identified and characterized using Astrodendro, with"nuclear" and "off-nuclear" regions labeled with "n" and "extranuclear" regions labeled with "e." Regions within each system are numbered following the order of ascending decl. Column (3): Region type indicating the most likely source for the detected radio emission. See Section 4.1 and Appendix A notes for details. Columns (4) and (5): J2000 coordinates of the emission peak of the region, in degrees. Column (6): Measured flux density of the region at 33 GHz in millijanskys. For regions in systems marked with * in column (1), 15 GHz measurements are reported instead. We note that in Arp 240 (NGC 5257/8), regions in NGC 5258 were only detected at 15 GHz. Column (7): Region effective radius. For unresolved regions smaller than the synthesized beam accounting for uncertainties, the effective radius of the beam is reported instead as an upper limit for the region size, indicated with "<," as described in Section 4.3. Column (8): Spectral luminosity calculated from column (6) and Table 1. Column (9): Spectral luminosity surface density. For unresolved regions, the reported values are lower limits and marked with ">." Columns (10) and (11): Brightness temperature of the region in kelvin, derived using Astrodendro measurements, and via Gaussian-fitting using CASA imfit, in log10 units. Values for unresolved regions are marked with ">." See Section 4.2.
A machine-readable version of the table is available.
Table 3. Measured and Derived Quantities for Regions Identified at Matched Resolutions
| ID | Region | Type | S33 | S15 | α15−33 | fth | log Re | log SFR | log ΣSFR | log SFRth | log 
|
|---|---|---|---|---|---|---|---|---|---|---|---|
| (mJy) | (mJy) | (%) | (pc) | (M⊙ yr−1) | (M⊙ yr−1 kpc−2) | (M⊙ yr−1) | (M⊙ yr−1 kpc−2) | ||||
| (1) | (2) | (3) | (4) | (5) | (6) | (7) | (8) | (9) | (10) | (11) | (12) |
| 1 | n1 | AGN | 3.54 ± 0.37 | 5.01 ± 0.51 | −0.44 ± 0.19 | 62 ± 24 | 2.08 ± 0.01 | ||||
| 2* | n1 | SBnuc | <1.34 | 1.10 ± 0.11 | <0.25 | <100 | 2.14 ± 0.02 | 1.03 ± 0.21 | 2.26 ± 0.21 | <1.03 | <2.26 |
| 3 | n1 | SF | 0.20 ± 0.02 | 0.07 ± 0.04 | 1.38 ± 0.72 | 100 | 1.94 ± 0.01 | 0.06 ± 0.11 | 1.69 ± 0.11 | 0.06 ± 0.11 | 1.69 ± 0.11 |
| n2 | SF | 0.13 ± 0.01 | 0.15 ± 0.02 | −0.19 ± 0.24 | 91 ± 9 | 1.62 ± 0.04 | −0.29 ± 0.05 | 1.97 ± 0.10 | −0.16 ± 0.13 | 2.11 ± 0.15 | |
| n3 | SF | 0.31 ± 0.03 | 0.39 ± 0.05 | −0.29 ± 0.20 | 80 ± 20 | 1.77 ± 0.02 | 0.08 ± 0.05 | 2.04 ± 0.06 | 0.16 ± 0.13 | 2.13 ± 0.14 | |
| n4 | SF | 0.09 ± 0.01 | 0.09 ± 0.02 | 0.00 ± 0.31 | 100 | 1.64 ± 0.06 | −0.28 ± 0.13 | 1.95 ± 0.17 | −0.28 ± 0.13 | 1.95 ± 0.17 | |
| n5 | SF | 0.09 ± 0.01 | 0.12 ± 0.02 | −0.34 ± 0.26 | 74 ± 26 | 1.63 ± 0.04 | −0.46 ± 0.05 | 1.78 ± 0.10 | −0.41 ± 0.19 | 1.83 ± 0.21 | |
| n6 | AGN/SBnuc | 0.89 ± 0.09 | 0.90 ± 0.10 | −0.01 ± 0.19 | 100 | 2.05 ± 0.01 | |||||
| 4 | n1 | SF | 0.09 ± 0.01 | 0.19 ± 0.03 | −0.99 ± 0.28 | 14 ± 14 | 2.13 ± 0.01 | 0.11 ± 0.06 | 1.35 ± 0.06 | −0.66 ± 1.15 | 0.58 ± 1.15 |
| n2 | AGN/SBnuc | 0.13 ± 0.02 | 0.23 ± 0.04 | −0.76 ± 0.25 | 16 ± 16 | 2.19 ± 0.01 | |||||
| 5 | n1,n2,n3 | AGN/SBnuc | 2.50 ± 0.26 | 3.43 ± 0.35 | −0.40 ± 0.18 | 67 ± 23 | 2.1 ± 0.01 | ||||
| 6 | n1 | AGN/SBnuc | 2.59 ± 0.27 | 4.78 ± 0.48 | −0.78 ± 0.18 | 12 ± 12 | 2.31 ± 0.01 | ||||
| 7 | n1, n2 | AGN/SBnuc | 5.25 ± 0.53 | 10.8 ± 1.1 | −0.91 ± 0.18 | 15 ± 15 | 1.98 ± 0.01 | ||||
| 8* | n1 | SF | <0.13 | 0.27 ± 0.03 | <−0.92 | <8 | 1.61 ± 0.01 | −0.44 ± 0.06 | 1.84 ± 0.06 | <−1.36 | <0.92 |
| 9 | e1 | Bg | 0.52 ± 0.06 | 1.10 ± 0.11 | −0.95 ± 0.20 | 14 ± 14 | 1.73 ± 0.01 | ||||
| n1 | SBnuc | 0.11 ± 0.02 | 0.18 ± 0.02 | −0.63 ± 0.38 | 36 ± 36 | <1.55 | −0.03 ± 0.09 | >2.37 | −0.29 ± 0.68 | >2.1 | |
| 12 | n1 | AGN | 13.1 ± 1.3 | 18.7 ± 1.9 | −0.45 ± 0.18 | 60 ± 23 | 0.89 ± 0.01 | ||||
| n2 | Jet | 26.6 ± 2.7 | 60.3 ± 6.0 | −1.04 ± 0.18 | 0 | 0.98 ± 0.01 | |||||
| n3 | Jet | 17.7 ± 1.8 | 44.5 ± 4.5 | −1.17 ± 0.18 | 0 | 1.03 ± 0.01 | |||||
| 13 | n1 | AGN/SBnuc | 0.05 ± 0.01 | 0.16 ± 0.02 | −1.61 ± 0.28 | 0 | 1.77 ± 0.01 | ||||
| 14 | n1 | AGN/SBnuc | 0.81 ± 0.09 | 1.32 ± 0.13 | −0.62 ± 0.19 | 37 ± 28 | 1.93 ± 0.01 | ||||
| n2 | SBnuc | 0.43 ± 0.05 | 0.70 ± 0.07 | −0.61 ± 0.20 | 38 ± 29 | 1.8 ± 0.01 | 0.64 ± 0.05 | 2.54 ± 0.05 | 0.4 ± 0.33 | 2.31 ± 0.33 | |
| 15 | n1 | AGN/SBnuc | 1.69 ± 0.18 | 2.65 ± 0.27 | −0.57 ± 0.18 | 44 ± 26 | 2.01 ± 0.01 | ||||
| 18 | n1 | AGN/SBnuc | 1.11 ± 0.12 | 2.28 ± 0.23 | −0.91 ± 0.19 | 15 ± 15 | 2.06 ± 0.01 | ||||
| 19 | n1 | SF | 0.25 ± 0.04 | 0.36 ± 0.04 | −0.47 ± 0.24 | 58 ± 31 | 1.53 ± 0.01 | −0.21 ± 0.07 | 2.23 ± 0.07 | −0.27 ± 0.24 | 2.18 ± 0.24 |
| n3, n4 | SF | 0.11 ± 0.06 | 0.13 ± 0.07 | −0.20 ± 0.34 | 89 ± 11 | <1.34 | −0.58 ± 0.24 | >2.25 | −0.45 ± 0.30 | >2.38 | |
| n2 | SF | 0.37 ± 0.05 | 0.39 ± 0.05 | −0.06 ± 0.22 | 100 | 1.60 ± 0.02 | 0.13 ± 0.11 | 2.44 ± 0.12 | 0.13 ± 0.11 | 2.44 ± 0.12 | |
| n5,n8,n9 | SF | 1.26 ± 0.14 | 1.57 ± 0.16 | −0.27 ± 0.19 | 82 ± 18 | 1.70 ± 0.21 | 0.49 ± 0.05 | 2.59 ± 0.41 | 0.58 ± 0.12 | 2.68 ± 0.43 | |
| n6,n7,n10 | SF | 0.45 ± 0.06 | 0.60 ± 0.06 | −0.35 ± 0.21 | 74 ± 25 | 1.65 ± 0.04 | 0.04 ± 0.06 | 2.25 ± 0.10 | 0.09 ± 0.16 | 2.29 ± 0.18 | |
| n11,n12 | SF | 0.28 ± 0.04 | 0.64 ± 0.07 | −1.04 ± 0.21 | 14 ± 14 | 1.46 ± 0.03 | −0.06 ± 0.06 | 2.53 ± 0.09 | −0.85 ± 0.88 | 1.74 ± 0.88 | |
| n13 | SF | 0.14 ± 0.02 | 0.16 ± 0.01 | −0.16 ± 0.29 | 94 ± 6 | <1.34 | −0.48 ± 0.05 | >2.35 | −0.32 ± 0.15 | >2.5 | |
| 20* | n1 | AGN | <0.18 | 0.30 ± 0.03 | <−0.66 | <20 | 1.78 ± 0.01 | 0.10 ± 0.05 | 2.04 ± 0.05 | <−0.3 | <1.63 |
| 21 | n1 | SF | 0.15 ± 0.02 | 0.27 ± 0.04 | −0.74 ± 0.24 | 18 ± 18 | 1.88 ± 0.01 | −0.49 ± 0.05 | 1.25 ± 0.05 | −1.06 ± 0.95 | 0.68 ± 0.95 |
| n2 | SF | 0.10 ± 0.01 | 0.18 ± 0.04 | −0.76 ± 0.30 | 16 ± 16 | 1.87 ± 0.01 | −0.67 ± 0.05 | 1.10 ± 0.05 | −1.29 ± 1.35 | 0.49 ± 1.35 | |
| n3 | SF | 0.24 ± 0.03 | 0.41 ± 0.06 | −0.69 ± 0.22 | 26 ± 26 | 1.94 ± 0.01 | −0.29 ± 0.05 | 1.34 ± 0.05 | −0.7 ± 0.57 | 0.93 ± 0.57 | |
| n4 | SF | 0.16 ± 0.02 | 0.37 ± 0.05 | −1.09 ± 0.22 | 0 | 1.92 ± 0.01 | −0.35 ± 0.05 | 1.31 ± 0.05 | 0 | 0 | |
| 22 | n1 | AGN/SBnuc | 3.19 ± 0.33 | 3.63 ± 0.36 | −0.16 ± 0.18 | 94 ± 6 | 1.84 ± 0.01 | ||||
| 23 | n1 | AGN/SBnuc | 2.05 ± 0.22 | 5.03 ± 0.50 | −1.14 ± 0.19 | 0 | 2.03 ± 0.01 | ||||
| 24 | n1 | Ud | 0.24 ± 0.03 | 0.38 ± 0.05 | −0.57 ± 0.22 | 45 ± 32 | 1.96 ± 0.01 | ||||
| n2 | Ud | 0.57 ± 0.06 | 1.08 ± 0.11 | −0.81 ± 0.19 | 8 ± 8 | 1.97 ± 0.01 | |||||
| n3 | Ud | 0.11 ± 0.01 | 0.16 ± 0.03 | −0.49 ± 0.28 | 56 ± 37 | 1.78 ± 0.01 | |||||
| n4 | Ud | 0.36 ± 0.04 | 0.65 ± 0.07 | −0.76 ± 0.2 | 15 ± 15 | 1.98 ± 0.01 | |||||
| n5 | Ud | 0.16 ± 0.02 | 0.23 ± 0.03 | −0.46 ± 0.23 | 59 ± 29 | 1.76 ± 0.02 | |||||
| 25* | n1 | SBnuc | <0.40 | 2.05 ± 0.21 | <−2.06 | 0 | 1.94 ± 0.01 | 1.11 ± 0.04 | 2.73 ± 0.04 | 0 | 0 |
| 26 | n1 | AGN/SBnuc | 1.72 ± 2.77 | 0.18 ± 0.28 | −0.61 ± 0.18 | 39 ± 27 | 2.34 ± 0.01 | ||||
| 27 | n1 | AGN/SBnuc | 0.97 ± 1.23 | 0.12 ± 0.12 | −0.30 ± 0.20 | 79 ± 23 | 1.70 ± 0.06 | ||||
| 28* | n1 | Ud | <0.13 | 0.04 ± 0.02 | <0.15 | <100 | 2.10 ± 0.04 | ||||
| n2 | AGN | <0.07 | 0.03 ± 0.01 | <0.29 | <100 | 1.97 ± 0.07 | |||||
| n3 | Ud | <0.15 | 0.05 ± 0.03 | <−0.38 | <55 | 2.20 ± 0.01 | |||||
| 29* | n1 | AGN/SBnuc | <0.07 | 0.04 ± 0.02 | <−1.08 | <6 | 1.72 ± 0.01 | ||||
| 31 | AGN/SBnuc | 2.03 ± 3.10 | 0.21 ± 0.31 | −0.53 ± 0.18 | 49 ± 25 | 2.11 ± 0.01 | |||||
| 32 | n1 | AGN/SBnuc | 0.53 ± 0.07 | 1.15 ± 0.12 | −0.98 ± 0.21 | 14 ± 14 | 1.89 ± 0.01 | ||||
| 33 | SF | 0.39 ± 0.27 | 0.05 ± 0.03 | 0.48 ± 0.23 | 100 | 1.79 ± 0.01 | 0.88 ± 0.30 | 2.79 ± 0.30 | 0.88 ± 0.3 | 2.79 ± 0.3 | |
| AGN/SBnuc | 0.61 ± 0.58 | 0.08 ± 0.06 | 0.06 ± 0.21 | 100 | 1.92 ± 0.01 | ||||||
| 34 | n1 | AGN/SBnuc | 0.66 ± 0.08 | 0.75 ± 0.08 | −0.17 ± 0.20 | 92 ± 8 | 2.31 ± 0.01 | ||||
| n2 | AGN/SBnuc | 2.63 ± 0.27 | 4.05 ± 0.41 | −0.55 ± 0.18 | 48 ± 25 | 2.45 ± 0.01 | |||||
| 35 | n1 | AGN | 1.13 ± 0.13 | 2.01 ± 0.20 | −0.73 ± 0.19 | 20 ± 20 | 1.95 ± 0.01 | ||||
| 36 | n1 | AGN/SBnuc | 8.19 ± 0.83 | 12.9 ± 1.3 | −0.57 ± 0.18 | 44 ± 26 | 1.60 ± 0.01 | ||||
| 37 | n1 | Ud | 0.22 ± 0.04 | 0.27 ± 0.03 | −0.26 ± 0.26 | 83 ± 17 | 1.89 ± 0.06 | ||||
| n2, n3 | Ud | 0.30 ± 0.05 | 0.36 ± 0.04 | −0.22 ± 0.23 | 88 ± 12 | 1.95 ± 0.04 | |||||
| 38 | n1 | SBnuc | 2.21 ± 0.24 | 2.30 ± 0.23 | −0.05 ± 0.19 | 100 | 1.95 ± 0.01 | 1.00 ± 0.09 | 2.60 ± 0.09 | 1 ± 0.09 | 2.6 ± 0.09 |
| 39 | n1 | AGN/SBnuc | 0.59 ± 0.06 | 1.15 ± 0.12 | −0.84 ± 0.19 | 0 | 2.12 ± 0.01 | ||||
| 40 | n1,n2,n3,n4 | Jet | 10.3 ± 1.0 | 22.4 ± 2.24 | −0.98 ± 0.18 | 14 ± 14 | 2.04 ± 0.01 | ||||
| 41 | e1 | SF | 0.56 ± 0.07 | 0.30 ± 0.03 | 0.80 ± 0.21 | 100 | 1.81 ± 0.01 | 0.71 ± 0.07 | 2.59 ± 0.07 | 0.71 ± 0.07 | 2.59 ± 0.07 |
| n1 | SBnuc | 0.28 ± 0.04 | 0.23 ± 0.03 | 0.22 ± 0.23 | 100 | 1.67 ± 0.01 | 0.40 ± 0.1 | 2.57 ± 0.10 | 0.4 ± 0.1 | 2.57 ± 0.1 | |
| 41* | e2 | SF | <0.01 | 0.04 ± 0.01 | −2.61 ± 5.32 | 0 | <1.50 | −0.53 ± 0.06 | >1.96 | 0 | 0 |
| e3 | SF | <0.02 | 0.02 ± 0.01 | 0.55 ± 0.82 | 100 | <1.50 | −0.85 ± 1.02 | >1.63 | −0.85 ± 1.02 | >1.63 | |
| 42 | n1 | SF | 0.07 ± 0.01 | 0.11 ± 0.02 | −0.65 ± 0.32 | 33 ± 33 | 1.99 ± 0.02 | −0.09 ± 0.07 | 1.44 ± 0.08 | −0.39 ± 0.64 | 1.13 ± 0.64 |
| n2 | SF | 0.14 ± 0.02 | 0.23 ± 0.03 | −0.61 ± 0.24 | 39 ± 35 | 2.1 ± 0.01 | 0.24 ± 0.05 | 1.55 ± 0.06 | 0.01 ± 0.39 | 1.31 ± 0.39 | |
| n3 | SF | 0.05 ± 0.01 | 0.05 ± 0.02 | −0.02 ± 0.49 | 100 | 1.94 ± 0.02 | −0.04 ± 0.21 | 1.58 ± 0.21 | −0.04 ± 0.21 | 1.58 ± 0.21 | |
| n4 | SF | 0.06 ± 0.01 | 0.08 ± 0.02 | −0.42 ± 0.38 | 65 ± 35 | 1.98 ± 0.02 | −0.15 ± 0.07 | 1.40 ± 0.08 | −0.16 ± 0.32 | 1.39 ± 0.33 | |
| n5 | SF | 0.02 ± 0.01 | 0.03 ± 0.01 | −0.38 ± 0.59 | 69 ± 31 | 1.78 ± 0.07 | −0.52 ± 0.1 | 1.43 ± 0.17 | −0.5 ± 0.46 | 1.45 ± 0.48 | |
| n6 | SF | 0.02 ± 0.01 | 0.03 ± 0.01 | −0.50 ± 0.68 | 54 ± 46 | <1.83 | −0.55 ± 0.07 | >1.29 | −0.64 ± 0.73 | >1.2 | |
| e1 | SF | 0.11 ± 0.01 | 0.15 ± 0.02 | −0.32 ± 0.26 | 76 ± 24 | 2.02 ± 0.01 | 0.14 ± 0.05 | 1.60 ± 0.06 | 0.21 ± 0.18 | 1.67 ± 0.18 | |
| 43 | n1 | AGN | 1.01 ± 0.12 | 2.02 ± 0.2 | −0.88 ± 0.19 | 15 ± 15 | 2.38 ± 0.02 | ||||
| n2 | AGN/SBnuc | 0.66 ± 0.09 | 1.27 ± 0.13 | −0.83 ± 0.21 | 4 ± 4 | 2.35 ± 0.01 | |||||
| 44 | n1 | AGN | 8.17 ± 0.83 | 13.0 ± 1.3 | −0.59 ± 0.18 | 42 ± 26 | 1.69 ± 0.01 | ||||
| 45* | n1 | AGN/SBnuc | <0.24 | 0.17 ± 0.02 | <0.42 | <100 | 1.51 ± 0.01 | ||||
| 46* | n1 | AGN | <0.15 | 0.18 ± 0.02 | <−0.24 | <77 | 1.46 ± 0.01 | ||||
| 47 | n1 | SF | 0.89 ± 0.09 | 1.18 ± 0.12 | −0.35 ± 0.18 | 73 ± 22 | 1.59 ± 0.04 | 0.87 ± 0.05 | 3.20 ± 0.09 | 0.92 ± 0.14 | 3.24 ± 0.16 |
| n2 | AGN | 1.98 ± 0.20 | 3.57 ± 0.36 | −0.75 ± 0.18 | 17 ± 17 | 1.72 ± 0.02 | |||||
| 48 | n1 | Ud | 0.03 ± 0.01 | 0.04 ± 0.01 | −0.27 ± 0.65 | 82 ± 18 | <1.7 | ||||
| 49 | n1 | AGN/SBnuc | 2.05 ± 0.21 | 2.97 ± 0.30 | −0.47 ± 0.18 | 58 ± 24 | 1.94 ± 0.01 | ||||
| 50 | n1 | AGN | 11.0 ± 1.11 | 14.6 ± 1.5 | −0.36 ± 0.18 | 72 ± 22 | 2.04 ± 0.01 | ||||
| n2 | AGN | 2.15 ± 0.23 | 4.64 ± 0.47 | −0.98 ± 0.19 | 14 ± 14 | 1.78 ± 0.01 | |||||
| 51* | e1 | Ud | <0.06 | 0.05 ± 0.01 | <0.41 | <100 | 1.63 ± 0.02 | ||||
| 52 | n1 | SF | 0.07 ± 0.01 | 0.10 ± 0.02 | −0.46 ± 0.32 | 60 ± 40 | 1.69 ± 0.01 | −0.63 ± 0.07 | 1.49 ± 0.08 | −0.67 ± 0.31 | 1.44 ± 0.31 |
| n2 | SF | 0.21 ± 0.03 | 0.39 ± 0.05 | −0.76 ± 0.22 | 15 ± 15 | 1.90 ± 0.01 | −0.12 ± 0.05 | 1.58 ± 0.06 | −0.76 ± 1.03 | 0.93 ± 1.03 | |
| n3 | SF | 0.28 ± 0.03 | 0.47 ± 0.06 | −0.69 ± 0.21 | 27 ± 27 | 1.96 ± 0.01 | −0.01 ± 0.05 | 1.57 ± 0.06 | −0.4 ± 0.53 | 1.18 ± 0.53 | |
| n4 | SF | 0.04 ± 0.01 | 0.06 ± 0.01 | −0.58 ± 0.48 | 43 ± 43 | <1.63 | −0.85 ± 0.09 | >1.39 | −1.04 ± 0.69 | >1.21 | |
| n5 | AGN/SBnuc | 0.31 ± 0.03 | 0.60 ± 0.07 | −0.86 ± 0.20 | 15 ± 15 | 1.94 ± 0.01 | |||||
| 53 | n1,n2,n3 | AGN/SBnuc | 12.2 ± 1.2 | 21.1 ± 2.1 | −0.69 ± 0.18 | 26 ± 26 | 2.41 ± 0.01 | ||||
| 54 | n1 | AGN/SBnuc | 7.49 ± 0.76 | 12.7 ± 1.3 | −0.67 ± 0.18 | 30 ± 28 | 1.77 ± 0.01 | ||||
| 55* | n1 | Ud | <0.18 | 0.14 ± 0.02 | <0.3 | <100 | 1.70 ± 0.03 | ||||
| n2 | Ud | <0.18 | 0.22 ± 0.03 | <−0.24 | <76 | 1.76 ± 0.02 | |||||
| e1 | SF | <0.03 | 0.06 ± 0.01 | <−0.85 | 0 | 1.61 ± 0.01 | −0.36 ± 0.08 | 1.93 ± 0.08 | 0 | 0 | |
| 56 | n1 | AGN/SBnuc | 0.94 ± 0.11 | 1.53 ± 0.15 | −0.62 ± 0.19 | 37 ± 29 | 2.33 ± 0.01 | ||||
| 57 | n1 | AGN/SBnuc | 1.69 ± 0.19 | 3.20 ± 0.32 | −0.81 ± 0.19 | 7 ± 7 | 2.34 ± 0.01 | ||||
| 58 | n1 | AGN | 1.72 ± 0.18 | 3.13 ± 0.31 | −0.76 ± 0.18 | 16 ± 16 | 1.77 ± 0.01 | ||||
| 59 | e1 | SF | 0.89 ± 0.10 | 1.22 ± 0.12 | −0.40 ± 0.19 | 67 ± 24 | 1.95 ± 0.01 | 1.07 ± 0.05 | 2.67 ± 0.05 | 1.08 ± 0.16 | 2.67 ± 0.16 |
| 60* | n1 | AGN/SBnuc | <0.16 | 0.54 ± 0.06 | <−1.52 | 0 | 1.93 ± 0.01 | ||||
| 61 | n1 | AGN/SBnuc | 0.87 ± 0.10 | 1.60 ± 0.16 | −0.78 ± 0.20 | 12 ± 12 | 2.25 ± 0.01 | ||||
| 62 | n1 | AGN | 3.34 ± 0.34 | 6.93 ± 0.69 | −0.93 ± 0.18 | 15 ± 15 | 1.68 ± 0.01 | ||||
| 63 | n1 | AGN/SBnuc | 2.97 ± 0.31 | 4.99 ± 0.50 | −0.66 ± 0.18 | 31 ± 28 | 1.89 ± 0.01 | ||||
| 64 | n1 | SF | 0.38 ± 0.04 | 0.97 ± 0.10 | −1.19 ± 0.19 | 0 | 1.80 ± 0.11 | 0.13 ± 0.05 | 2.03 ± 0.23 | 0 | 0 |
| n2 | SF | 0.07 ± 0.01 | 0.17 ± 0.01 | −1.05 ± 0.26 | 13 ± 13 | <1.57 | −0.6 ± 0.03 | >1.76 | −1.40 ± 1.08 | >0.96 | |
| n3 | SF | 0.24 ± 0.03 | 0.61 ± 0.07 | −1.18 ± 0.20 | 0 | 1.80 ± 0.05 | −0.07 ± 0.05 | 1.83 ± 0.11 | 0 | 0 | |
| 65 | n1 | SBnuc | 0.24 ± 0.04 | 0.33 ± 0.03 | −0.37 ± 0.26 | 71 ± 29 | 1.60 ± 0.01 | 0.16 ± 0.08 | 2.46 ± 0.08 | 0.19 ± 0.2 | 2.49 ± 0.21 |
| n2 | AGN | 0.88 ± 0.10 | 1.69 ± 0.17 | −0.83 ± 0.19 | 4 ± 4 | 1.77 ± 0.01 | |||||
| 66 | n1 | Jet | 1.68 ± 0.17 | 4.20 ± 0.42 | −1.16 ± 0.18 | 0 | 1.65 ± 0.01 | ||||
| n2 | Jet | 0.27 ± 0.04 | 0.66 ± 0.07 | −1.13 ± 0.23 | 0 | 1.51 ± 0.06 | |||||
| n3 | AGN | 0.59 ± 0.03 | 0.88 ± 0.03 | −0.51 ± 0.20 | 53 ± 27 | <1.54 | |||||
| n4 | Jet | 1.57 ± 0.17 | 3.52 ± 0.35 | −1.02 ± 0.19 | 14 ± 14 | 1.87 ± 0.01 | |||||
| 67 | n1 | AGN | 0.10 ± 0.02 | 0.13 ± 0.01 | −0.38 ± 0.44 | 69 ± 31 | <1.32 | ||||
| e1 | SF | 0.08 ± 0.02 | 0.15 ± 0.01 | −0.70 ± 0.49 | 25 ± 25 | <1.32 | −0.62 ± 0.08 | >2.24 | −1.06 ± 1.37 | >1.81 |
Note. Column (1): Identifier for the IRAS system, corresponding to column (1) in Table 1. Column (2): Identifier for regions corresponding to column (2) in Table 2. Due to the lower resolution of the beam-matched 15 and 33 GHz images, several regions identified at native-resolution are blended together. In these cases, multiple region identifiers are provided for a single measurement. Column (3): Region type indicating the most likely source for the detected radio emission. See Section 4.1 and Appendix A for details. Column (4): Measured flux of the beam-matched region at 33 GHz. For regions identified at 15 GHz, upper limits on the 33 GHz flux densities are provided. Column (5): Measured flux density of the beam-matched region at 15 GHz. Column (6): Measured 15–33 GHz spectral index within the beam-matched region. Column (7): Thermal fraction at 33 GHz derived from column (6). Column (8): Effective radius for the beam-matched region, based on region area (A) computed by Astrodendro, defined as  . For unresolved regions that are smaller than the matched beam accounting for uncertainties, the effective radius of the matched beam is reported instead as an upper limit for the region size, indicated with "<." Column (8): SFRs of the beam-matched region derived from either 33 GHz or 15 GHz flux density in column (4) or (5). Column (10): SFR surface density. For unresolved regions, the reported values are lower limits, indicated with ">." Column (11): Thermal-only SFR derived from 33 GHz or 15 GHz flux density in column (4) or (5) and 15–33 GHz spectral index from column (6). Column (12): Thermal-only SFR surface density. For regions identified at 15 GHz, upper limits are provided for columns (6), (7), (11), and (12). For unresolved regions, the reported values are lower limits, indicated with ">." For columns (9)–(12), we only report values for "SF" and "SBnuc."
A machine-readable version of the table is available.
4.1. Region Classification
Before deriving the physical quantities associated with each region, it is crucial that we first identify the potential source powering the 33 and/or 15 GHz radio continuum emission. Radio continuum emission at frequencies >30 GHz is widely used as a tracer of SFR (e.g., Murphy et al. 2012, 2018). Yet emission from AGNs, if present, can completely dominate the observed radio emission at a physical scale of ∼100 pc (Lonsdale et al. 2003), in which case the radio-derived SFR would be overestimated. Further, separating AGNs and SF-dominated regions first will allow us to more clearly examine and better understand the radio properties of each population.
Although high brightness temperature (Tb > 105 K) is typically used to identify radio AGNs (e.g., Condon et al. 1991), beam dilution may reduce the brightness temperatures observed on 100 pc scales to the level that is characteristic of starbursts (see Section 4.2). Therefore, here we adopt a multiwavelength approach to classify the native and matched regions characterized in Section 3 into different categories based on whether or not they may contain energetically dominant AGNs. We describe this two-step procedure below, which is illustrated in Figure 3 and summarized in Figure 4, and provide more details on individual sources in Appendix A.
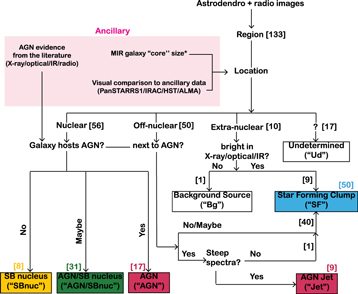
Figure 4. Region classification scheme described in Section 4.1 and demonstrated in Figure 3. Descriptions of individual galaxies are provided in Appendix A, including their multiwavelength AGN classifications and the ancillary data sets used. Numbers of native regions classified at each step are shown in brackets. Note that mid-IR (MIR) galaxy "core" sizes are measured by Díaz-Santos et al. (2010).
Download figure:
Standard image High-resolution image4.1.1. Region Location
As a first step, we separate regions into three initial categories—"nuclear," "off-nuclear," and "extranuclear"—based on their relative location in their host galaxies. These locations are determined visually by first overlaying the 33 and/or 15 GHz radio images on top of optical y-band images of the host galaxy from Pan-STARRS1 (Chambers et al. 2016; Flewelling et al. 2020) as well as Spitzer IRAC channel 1 and channel 4 maps (Armus et al. 2009; J. Mazzarella 2022, in preparation). Afterward, we overlay an ellipse representing the size of the unresolved mid-IR (MIR; λ = 13.2 μm) galaxy "core" reported in Díaz-Santos et al. (2010), which is the FWHM of the Gaussian fit to the Spitzer IRS spectra of the galaxy that have spatial resolutions of ∼36. The MIR traces warm dust emission (∼300 K) from obscured starburst and/or AGN activity, and hence provides useful constraints on the spatial extent of the most energetic component of the galaxy. The ellipse is then projected using galaxy position angles provided in the HyperLeda database (Makarov et al. 2014) and the Two Micron All Sky Survey Extended Source Catalog (Jarrett et al. 2000; Two-Micron All Sky Survey Science Team 2020), along with galaxy inclination derived from galaxy axis ratio reported in Kim et al. (2013) and Jin et al. (2019) using the recipe given by Dale et al. (1997).
In general, we found agreement between the astrometry of the multiwavelength images within a few arcseconds. Regions that spatially coincide with the optical and MIR galaxy peak are considered to be the galactic nuclei and hence are classified as "nuclear." Regions that are not "nuclear" but also lie within the MIR galaxy core are "off-nuclear," and regions lying completely outside of the MIR galaxy core are "extranuclear." In II Zw 096, the identified region is cospatial with the brightest MIR component that has previously been identified as a powerful starburst region triggered on the outer edge of the merging galaxy pair (Inami et al. 2010, 2022); therefore, we classify it as an "extranuclear" region. Regions residing within the MIR galaxy core (i.e., "nuclear" and "off-nuclear") are labeled with "n" in Tables 2 and 3 (column 2), and "extranuclear" regions are labeled with "e."
Due to the comparatively low spatial resolution of the Pan-STARRS1 and IRAC images, determining whether a given region is "nuclear" or "off-nuclear" can be challenging when there are multiple regions within the MIR galaxy core. For seven galaxies, we were able to rely on direct comparisons with high-resolution HST and/or Atacama Large Millimeter/submillimeter Array (ALMA) data sets publicly available from the archives to pinpoint the location of the galactic nuclei (often the kinematic center) and hence separate "nuclear" and "off-nuclear" regions. For 17 native regions residing in eight U/LIRGs without sufficient ancillary information from high-resolution imaging and/or gas kinematics, we assign them a final type "Ud" (undetermined) in Tables 2 and 3 (column 3). Images of these eight systems are shown in Appendix A. We carry out further classification for the remaining 116 native regions (57 "nuclear," 49 "off-nuclear," and 10 "extranuclear") in the following section.
4.1.2. Host AGN Classification
For the next step, we search in the literature for multiwavelength (i.e., X-ray, optical, MIR, radio/submillimeter) evidence for AGN presence in each of the 63 U/LIRGs with detections, summarized in Table A2 in Appendix A. Mainly, we build upon optical classifications by Veilleux et al. (1995) and Yuan et al. (2010), as well as results from previous surveys of local U/LIRGs with NuSTAR (e.g., Ricci et al. 2017, 2021), Chandra (Iwasawa et al. 2011; Torres-Albà et al. 2018), Spitzer (e.g., Petric et al. 2011; Stierwalt et al. 2013), AKARI (e.g., Inami et al. 2018), VLA (e.g., at 1.4 and 8.4 GHz; Condon et al. 1995; Vardoulaki et al. 2015), and the Very Long Baseline Array (e.g., Smith et al. 1998a). The compiled information is used in combination with the initial location classifications to further narrow down whether a region may contain an AGN that could dominate the radio emission:
- 1.For "nuclear" regions: if the host galaxies have been identified as hosting AGNs in the literature at more than one wavelength range, we classify them as "AGN." For example, we classify the nucleus of NGC 0034 as an "AGN," given that the host galaxy is classified as a Seyfert 2 galaxy based on optical line ratios (Veilleux et al. 1995; Yuan et al. 2010) and as an obscured AGN based on Chandra X-ray analysis revealing excess hard-band X-ray emission and an absorbing column density NH ∼ 1023 cm−2 (Torres-Albà et al. 2018). If the host galaxy has only been identified as an AGN at one wavelength range but lacks identification at other wavelengths, or if evidence for an AGN is ambiguous or inconsistent across all wavelengths, we classify the "nuclear" regions as "AGN/SBnuc." For example, the nucleus of IRAS F17138-1017 is classified as "AGN/SBnuc," because the X-ray spectral shape of the host galaxy is consistent with either star formation or an obscured AGN (Ricci et al. 2017; Torres-Albà et al. 2018), and the galaxy is classified as an LINER in the optical, which may be powered by low-luminosity AGNs, evolved stars, or both (Singh et al. 2013). Another example is the nucleus in MCG-03-04-014, which we classify as "AGN/SBnuc" given that the observed nuclear optical line ratios indicate emission from both AGNs and starbursts (Yuan et al. 2010), despite that the 3.3 and 6.2 μm polycyclic aromatic hydrocarbon (PAH) features have large equivalent widths (EWs) consistent with starburst-dominated emission (Stierwalt et al. 2013; Inami et al. 2018). Lastly, if no AGN evidence has been found at any wavelength range for the host galaxy, we then classify the region as a starburst-dominated nucleus ("SBnuc"). An example of this is NGC 5257 (Arp 240N).
- 2.For "off-nuclear" regions: if they form a linear structure with an identified "AGN" and show steep 15–33 GHz spectral indices (α ≲ −0.8) indicative of synchrotron-dominated emission (e.g., Condon et al. 1991), we classify them as radio jets ("Jets") associated with the AGN. An example of this is NGC 7674 (see Figure 3). While "off-nuclear" regions next to "AGN/SBnuc" may be jets from unconfirmed AGNs or star-forming clumps, we classify them as "SF" given that AGNs with jets tend to dominate the nuclear emission and likely would have been identified as AGNs at multiple wavelengths. This reasoning has been adopted to classify the "SF" regions in IC 1623B, MCG-03-04-014, CGCG 436–030, III Zw 035, and IRAS F17138-1017, and we note that these regions also all have optical/IR counterparts. While highly energetic optical/IR synchrotron jets have been observed in powerful quasars (e.g., Floyd et al. 2006a, 2006b), we argue that this scenario is unlikely given the lack of clear AGN evidence reported for the above U/LIRGs in our sample.
- 3.For "extranuclear" regions: if they are detected in the X-ray or have visible optical/IR counterparts, we classify them as star-forming regions ("SF"). Only one "extranuclear" region, in IC 0214, does not show any X-ray, optical, or IR counterpart. Hence, it is likely a background radio source ("Bg") that is not associated with the galaxy and is therefore eliminated from further analysis.
In summary, out of the 116 native regions with identified locations (i.e., not "Ud"), 17 "AGN," nine "Jet," eight "SBnuc," 31 "AGN/SBnuc," and 50 "SF" (41 "off-nuclear" and nine "extranuclear") regions are classified, excluding one "Bg" region detected near IC 0214. At matched resolutions, many "off-nuclear" native regions are blended with the "nuclear" native regions. In these cases, the larger blended matched regions are designated with the "nuclear" classifications (i.e., "AGN," "AGN/SBnuc," and "SBnuc"). As a result, 17 "AGN," six "Jet," 30 "AGN/SBnuc," eight "SBnuc," and 40 "SF" (32 "off-nuclear" and eight "extranuclear") matched regions are classified. Figure 4 summarizes our region classification scheme, and all region classifications are reported in Tables 2 and 3, and described in Appendix A in more detail. We note that only two systems in the sample (MCG-03-34-064, NGC 7674) have previously been classified as "radio-loud" AGNs based on the excess radio over far-IR (FIR) emission on galaxy scales (Condon & Broderick 1991; Condon et al. 1995), which emphasizes the necessity of the above two-step approach in constraining the sources of radio emission at resolved scales. In the upcoming survey paper, we will further investigate the kiloparsec-scale radio-IR correlations in the GOALS-ES systems for the different region types classified here.
4.2. Brightness Temperature
Condon et al. (1991) derived the maximum brightness temperature Tb for an optically thick starburst radio source to be:
where Te ∼ 104 K is the thermal electron temperature characteristic of massive star formation, ν is the radio frequency at which measurements are made, and αNT is the nonthermal spectral index characteristic of synchrotron emission generated by electrons accelerated by Type II supernovae. This limit allowed Condon et al. (1991) to confirm the AGN nature of the compact radio source they detected in UGC 08058 (Mrk 231), which has Tb ≳ 106 K at 8.4 GHz. Here we assume αNT ∼ −0.85, based on resolved measurements of star-forming regions in the nearby disk galaxy NGC 6946 by Murphy et al. (2011), which gives a maximum starburst Tb of 104.2 K at 33 GHz, and 104.4 K at 15 GHz.
Using the Rayleigh–Jeans approximation, the brightness temperature Tb of each native region can be calculated via (Condon 1992; Pérez-Torres et al. 2021):
where c is the speed of light, k is the Boltzmann constant, Sν
is the region flux density measured at frequency ν, and  is the region area assuming a Gaussian morphology, with θM
and θm
corresponding to the FWHM of the major and minor axes of the Gaussian, respectively.
is the region area assuming a Gaussian morphology, with θM
and θm
corresponding to the FWHM of the major and minor axes of the Gaussian, respectively.
Because the identified regions have irregular morphology with unknown sub-beam structures, here we calculate the brightness temperature of each native region using two different methods. First, we use region flux density and area measured with Astrodendro for Sν
and Ω in Equation (3). Second, we perform Gaussian-fitting and deconvolution on all native-resolution images using CASA task imfit and Astrodendro results as initial guess inputs, assuming uniform background noise level as characterized by σrms (see Table A1), and calculate the deconvolved brightness temperature  of each region using the flux density of the fitted Gaussian model and the deconvolved θM
and θm
, following Condon et al. (1991). We note that by assuming a simple Gaussian morphology, the latter method allows tighter constraints on the intrinsic sizes of marginally resolved regions, but does not reflect the observed diverse region morphology or the varying degree of surrounding diffuse emission present in each system, which leads to poor flux recovery especially for extended regions. Gaussian-fitting was also unsuccessful for 17 regions in nine systems. Therefore, we use the latter method only in this Section to illustrate the possible effect of beam dilution, but continue to use results derived with Astrodendro (Section 3) throughout the rest of the paper. Values of Tb
and
of each region using the flux density of the fitted Gaussian model and the deconvolved θM
and θm
, following Condon et al. (1991). We note that by assuming a simple Gaussian morphology, the latter method allows tighter constraints on the intrinsic sizes of marginally resolved regions, but does not reflect the observed diverse region morphology or the varying degree of surrounding diffuse emission present in each system, which leads to poor flux recovery especially for extended regions. Gaussian-fitting was also unsuccessful for 17 regions in nine systems. Therefore, we use the latter method only in this Section to illustrate the possible effect of beam dilution, but continue to use results derived with Astrodendro (Section 3) throughout the rest of the paper. Values of Tb
and  are reported in Table 2 and compared in Figure 5.
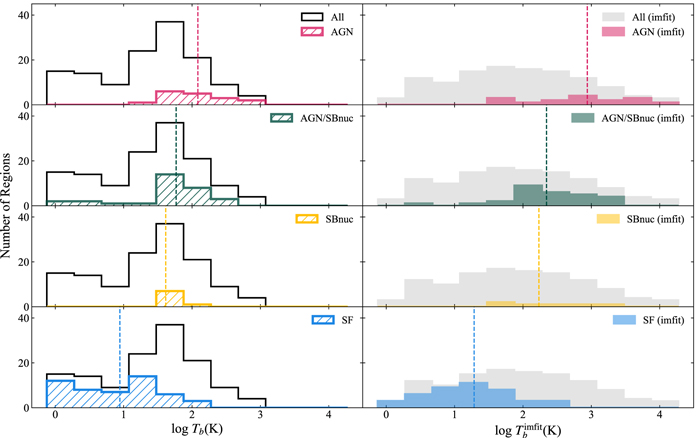
Figure 5. The distribution of brightness temperatures of regions identified at native resolutions at 15 or 33 GHz. Left: values derived from Astrodendro measurements of region areas and flux densities. The distribution for all 133 native regions is shown by the black unfilled histogram. Right: values derived from Gaussian-fitting results using CASA imfit task. The distribution for 116 regions with successful fits is shown by the black filled histogram. In both panels, distributions for "AGN" (magenta), "AGN/SBnuc" (green), "SBnuc" (yellow), and "SF" (blue) are shown separately for comparison, with dashed lines marking the median values. Overall, "AGN" regions have the highest brightness temperatures, and Gaussian-fitting yields higher values, but only one "AGN" (in NGC 1068) exceeds the maximum starburst brightness temperature (∼ 104 K). The measured low brightness temperature for AGNs is likely due to beam dilution.
Download figure:
Standard image High-resolution imageFigure 5 shows that, regardless of the method used, "AGN" and "AGN/SBnuc" have higher brightness temperatures than "SF." The ranges of Tb
for "AGN," "AGN/SBnuc," and "SF" are 19–950 K, 1–360 K, and 1–160 K, respectively. However, all regions, including "AGN," have Tb
< 104 K. For "SF," the overall low Tb
is expected from optically thin emission associated with star formation. For "AGN" and "AGN/SBnuc," the observed emission may come from a combination of AGN emission and nuclear star formation, which may be further diluted by the beam. The effect of such beam dilution is also demonstrated in Figure 5, where we see that  for "AGN" (50–11,900 K), "AGN/SBnuc" (3–2500 K), and "SBnuc" (70–1710 K) are higher than Tb
by up to ∼1 dex. Nevertheless, no "AGN" has
for "AGN" (50–11,900 K), "AGN/SBnuc" (3–2500 K), and "SBnuc" (70–1710 K) are higher than Tb
by up to ∼1 dex. Nevertheless, no "AGN" has  greater than 106 K, and the only "AGN" with
  K is the one in NGC 1068, which is the most nearby Seyfert in GOALS. Additionally, 19 regions (including the "AGN/SBnuc" in IRAS 17208-0014) are unresolved by the beam, seven of which, along with 12 other regions (including three "AGN" and two "AGN/SBnuc") are separately determined as point sources by CASA imfit. For these regions, the calculated Tb
and
K is the one in NGC 1068, which is the most nearby Seyfert in GOALS. Additionally, 19 regions (including the "AGN/SBnuc" in IRAS 17208-0014) are unresolved by the beam, seven of which, along with 12 other regions (including three "AGN" and two "AGN/SBnuc") are separately determined as point sources by CASA imfit. For these regions, the calculated Tb
and  are lower limits and indicated in Table 2.
Our results are similar to those found by Barcos-Muñoz et al. (2017), who measured an overall low Tb (∼100–1000 K) in the nuclei of the most luminous local U/LIRGs at 100 pc scales at 33 GHz. These results also demonstrate the limitation of the current VLA observations for directly identifying AGNs using brightness temperatures. Future very long baseline interferometry (VLBI) follow-up of the "AGN/SBnuc" regions would significantly improve our ability to identify AGNs in many more local U/LIRGs, as well as isolate AGN emission from the compact circumnuclear star formation prevalent in these systems (e.g., Condon et al. 1991).
4.3. Size, Luminosity, and Luminosity Surface Density
For each native region, Astrodendro can be used to measure its angular area A and flux density Sν
at frequency ν using the region boundary identified by the algorithm (i.e., black contours in Figure 2). We use the mean values of these measurements from 1000 runs of Astrodendro (see Section 3) to calculate the spectral luminosity ( ), effective radius (
 ), and spectral luminosity surface density
  of each region, using the luminosity distance (DL
) and angular-to-physical conversion factor derived for each system, as listed in Table 1. For the 19 native regions with areas smaller than the synthesized beams even after accounting for uncertainties, we use the beam areas as upper-limit estimates for the region sizes, and thus the corresponding
of each region, using the luminosity distance (DL
) and angular-to-physical conversion factor derived for each system, as listed in Table 1. For the 19 native regions with areas smaller than the synthesized beams even after accounting for uncertainties, we use the beam areas as upper-limit estimates for the region sizes, and thus the corresponding  are lower limits. The derived properties of a total of 133 native regions in 63 systems are reported in Table 2, of which 16 regions in 10 systems were measured at 15 GHz due to poor or nondetections at 33 GHz. In Figure 6, we show the distributions of the derived properties of 99 native regions with 33 GHz measurements, excluding the "Bg" in IC 0214 and 17 unresolved regions.

Figure 6. The distribution of derived properties of regions identified and characterized at native resolutions using Astrodendro. For direct comparison, we only show results derived from 33 GHz measurements, available for 99 native regions, excluding the "Bg" source in IC 0214 and 17 unresolved regions. Left: effective radius Re
. Middle: 33 GHz luminosity L33. Right: 33 GHz luminosity surface density  . In all three columns, we also show distributions for "AGN" (magenta), "AGN/SBnuc" (green), "SBnuc" (yellow), and "SF" regions (blue), and the corresponding median values (dashed lines), overlaid on the distributions of all 99 native regions (gray). Results for "Jet" and "Ud" regions are not separately shown for simplicity. While all region types are distributed over similar size ranges, "AGN" and "AGN/SBnuc" have higher L33 and
  than "SF" by an order of magnitude.
Download figure:
Standard image High-resolution imageThe effective radii (Re
) of these 99 native regions span from 8 to 170 pc, with no significant size differences among the region types, except for "AGN/SBnuc" regions, which have the largest sizes at a median value of 80 pc compared with ∼40 pc for "AGN," "SBnuc," and "SF." As shown in Figure 6, the 33 GHz luminosity (L33) spans 3 orders of magnitude, ranging from 3.0 × 1026 to 3.4 × 1029 erg s−1 Hz−1. Unsurprisingly, "AGN" regions are overall more luminous, with an L33 = 8.0 × 1026 − 1.7 × 1029 erg s−1 Hz−1 and a median of 1.7 × 1028 erg s−1 Hz−1, compared with "SF" regions, which have L33 = 2.0 × 1026–3.4 × 1028 erg s−1 Hz−1 and a median of 1.1 × 1027 erg s−1 Hz−1, about an order of magnitude lower. This difference is also evident in the distribution of spectral luminosity surface density  : "AGN" regions have
  ranging from 1.1 × 1030 to 3.0 × 1031 erg s−1 Hz−1 kpc−2 with a median of 4.2 × 1030 erg s−1 Hz−1 kpc−2, which is also an order of magnitude higher than 2.3 × 1029 erg s−1 Hz−1 kpc−2 for the "SF" regions. When considering all 99 native regions, including 15 "AGN," nine "Jet," 28"AGN/SBnuc," five "SBnuc," 36 "SF" (31 "off-nuclear" and five "extranuclear"), and nine "Ud" regions, the median for
  is around 1.1 × 1030 erg s−1 Hz−1 kpc−2, below which the distribution is almost completely dominated by "SF" regions. In Section 5.1 we further discuss the implication of the differences we observe between the "AGN" and "SF" native regions, in the theoretical context of radiation feedback-regulated star formation in the dusty environments of U/LIRGs.
4.4. Thermal Fraction at 33 GHz
Assuming a typical radio continuum SED for star-forming galaxies (e.g., Condon 1992), the 33 GHz radio continuum emission can be decomposed into thermal free–free emission with a flat spectrum (Sν
∝ ν−0.1) and nonthermal synchrotron emission with a steep spectrum ( ), where a nonthermal spectral index of αNT ∼ − 0.85 has been found to be widely applicable in resolved star-forming regions detected in nearby disk galaxies (Murphy et al. 2011, 2012). For each matched region, we derive the 33 GHz thermal fraction fth, which measures the fractional contribution of thermal free–free emission generated from plasma around massive young stars (i.e., H ii regions) using the measured 15–33 GHz spectral index α15–33 (see Section 3), and Equation (11) from Murphy et al. (2012):
where we set the spectral index α between ν1 and ν2 (33 and 15 GHz) to be our measured α15–33, and use error propagation to derive the uncertainties associated with flux calibration and image noise levels. We note that 17 matched regions were not identified with Astrodendro at 33 GHz due to insufficient sensitivity, so the measured α15–33 for these regions are likely steeper than the intrinsic values. We label these values in Table 3 as upper limits, and mark the host systems with "*".
Of the 97 matched regions that were identified at both 15 and 33 GHz (excluding "Bg" in IC 0214), 10 regions have steep spectra with α15–33 ≲ −0.85 after accounting for the estimated uncertainties. These regions include four "Jet," three "SF," and three "AGN/SBnuc." The observed 33 GHz emission in these regions is likely dominated by nonthermal synchrotron emission produced by relativistic electrons accelerated in AGN jets or supernovae. The "AGN/SBnuc" in UGC 02238 and NGC 5104 have the steepest spectra, with α15–33 ∼ − 1.6 ± 0.3. In these cases, we follow Linden et al. (2020) and set αNT = α15–33, which gives fth ∼ 0%, on the basis that negative fth are not physically meaningful. For three "SF" regions, IC1623B_n4, NGC5257_e1, and IC2810_e1, α15–33 ≳ 0 after accounting for uncertainties, which is unexpected from optically thin thermal free–free emission. Given that all "SF" regions have brightness temperatures much lower than the optically thick starburst temperature of ∼104 K (see Section 4.2), a potential cause for the higher-than-expected 33 GHz continuum flux may be anomalous microwave emission from spinning dust particles in heavily obscured young starbursts (Murphy et al. 2020). This possible explanation will require more high-resolution observations above and below 33 GHz to confirm. We note that the extranuclear region in NGC 5257 also shows the flattest 3–33 GHz spectrum among 48 extranuclear regions hosted in 25 U/LIRGs in the equatorial sample when measured on kiloparsec scales, consistent with Linden et al. (2019). For regions with α15–33 ≳ −0.1, we adopt fth ∼ 100%.
Figure 7 shows the distribution of fth for all 97 matched regions as well as for different region types, which all span a wide range from ∼0% (dominated by nonthermal emission) to 100% (dominated by thermal emission). However, the median values for "AGN" and "AGN/SBnuc," at fth ∼ 30%, are noticeably lower than those for "SBnuc" and "SF," at fth ∼ 65%. This result is consistent with kiloparsec-scale measurements of extranuclear star-forming regions by Linden et al. (2019) using GOALS-ES C-configuration observations. For "AGN" and "AGN/SBnuc," mechanisms other than star formation may be producing excess nonthermal emission at 33 GHz (e.g., Panessa et al. 2019). Overall, the wide range of fth spanned by different region types demonstrates that spectral shape and the derived fth alone are insufficient for inferring the nature of radio emission in a given region at 100 pc scales. In Section 5.2.1 we further discuss the potential mechanisms that may be contributing to the 15–33 GHz radio continuum emission in these local U/LIRGs at 100 pc scales.

Figure 7. The distribution of the derived 33 GHz thermal fraction, fth, for 97 matched regions identified at both 15 and 33 GHz (in gray) excluding "Bg," and for "AGN" (magenta), "AGN/SBnuc" (green), "SBnuc" (yellow), and "SF" regions (blue). The median values are ∼25%, 33%, 71%, and 62%, respectively, and shown in dashed lines. Results for "Jet" and "Ud" regions are not separately shown. While fth spans a wide range for all region types compared, "AGN" and "AGN/SBnuc" have lower median fth than "SBnuc" and "SF" regions.
Download figure:
Standard image High-resolution image4.5. Star Formation Rates and Surface Densities
For all matched-resolution "SF" and "SBnuc" regions, we use Equation (10) in Murphy et al. (2012) to convert the measured 33 or 15 GHz continuum flux density to a total SFR, accounting for both thermal free–free emission from H ii regions (<10 Myr) and nonthermal synchrotron emission from supernovae (∼ 10–100 Myr):
where a Kroupa initial mass function (IMF) and continuous and constant star-forming history over 100 Myr is assumed. In Equation (5), Lν
is the spectral luminosity at the observed frequency ν, given by  , where Sν
is the measured flux density. Here we again adopt an electron temperature Te
= 104 K and a nonthermal spectral index αNT = −0.85, as done in the previous sections. If we only consider the thermal free–free emission from young massive stars, Equation (5) becomes (Equation (6) in Murphy et al. 2012):
, where Sν
is the measured flux density. Here we again adopt an electron temperature Te
= 104 K and a nonthermal spectral index αNT = −0.85, as done in the previous sections. If we only consider the thermal free–free emission from young massive stars, Equation (5) becomes (Equation (6) in Murphy et al. 2012):
where  is the thermal-only spectral luminosity. For regions with fth ≃ 100%, thermal emission from young massive stars completely dominates the radio continuum, and
  . For fth ≃ 0%, SFRth ≃ 0 M⊙ yr−1.
For the 40 matched "SF" regions, SFR ranges from 0.14–12 M⊙ yr−1, with a median of ∼0.7 M⊙ yr−1. The SFRth spans from ∼0 M⊙ yr−1 to 12 M⊙ yr−1, corresponding to fth ≃ 0% to fth ≃ 100%. The median SFRth is 0.4 M⊙ yr−1. For the eight "SBnuc," the ranges of SFR and SFRth are 0.2–13 M⊙ yr−1 and 0–11 M⊙ yr−1, similar to the "SF" regions, but with higher median values, at 3.5 and 2 M⊙ yr−1, respectively. When taking account of the physical sizes of these matched regions, as calculated from the region boundaries defined by Astrodendro with which flux density and spectral index of each region was measured, the SFR and SFRth surface densities, ΣSFR and  , range from 13–1.6 × 10³
M⊙ yr−1 kpc−2 and 0–1.7 × 10³
M⊙ yr−1 kpc−2 for the "SF" regions including eight unresolved regions. For "SBnuc," ΣSFR and
, range from 13–1.6 × 10³
M⊙ yr−1 kpc−2 and 0–1.7 × 10³
M⊙ yr−1 kpc−2 for the "SF" regions including eight unresolved regions. For "SBnuc," ΣSFR and  have ranges of 22–540 M⊙ yr−1 kpc−2 and 0–400 M⊙ yr−1 kpc−2, including one unresolved region. The median values for the "SBnuc" regions are higher than those for the "SF" regions by about a factor of 5. However, this result may not be representative given the limited numbers of "SBnuc" identified in the sample. We report the above derived values in Table 3. For all other region types, given the unknown contribution of star formation to the observed radio continuum, we do not report values of SFR and SFRth. In Section 5.2.2 we compare these results to those derived for star-forming regions in nearby normal galaxies observed with the SFRS at ∼100 pc scales.
5. Discussion
5.1. What Powers the Compact 33 GHz Continuum Emission in Local U/LIRGs?
As demonstrated in Section 4.2, the radio data at hand does not allow for direct AGN identification using brightness temperatures, and multifrequency VLBI observations at milliarcsecond resolutions are needed to pinpoint the location of AGNs and isolate their emission from the circumnuclear star formation in "AGN" and "AGN/SBnuc" regions. Nevertheless, it is evident from Figures 5 and 6 that "AGN" and "SF," respectively, dominate the upper and lower ends of the distributions in brightness temperature and 33 GHz luminosity surface density. In Figure 8, we further illustrate this difference by showing the luminosity and luminosity surface density with respect to the effective radius characterized with Astrodendro at 33 GHz (filled symbols), including an additional 23 regions from BM17 (see Section 2.3 and Appendix B).

Figure 8. 33 GHz luminosity L33 (left) and surface density  (right) vs. effective radius for 95 native regions from GOALS-ES (filled symbols) and of additional 23 native regions characterized using observations of the most luminous U/LIRGs from Barcos-Muñoz et al. (2017, hereafter BM17; unfilled symbols). In both panels, we show "AGN" (magenta triangle), "AGN/SBnuc" (green circles), "SBnuc" (yellow diamonds), and "SF" regions (blue squares). Regions classified as "Jet" or "Ud" are not shown for simplicity. Upper limits in size measurements are indicated with arrows. Dashed gray curves are models for a steady-state radiation feedback-supported maximal starburst disk from Thompson et al. (2005) with assumed molecular gas fraction fg
= 0.1, 0.3, and 1.0 and stellar velocity dispersion σ = 200 km s−1, as well as for fg
= 1.0 and σ = 300 km s−1. Solid gray curves show the same models with a modified term to include supernovae feedback, as adopted in Barcos-Muñoz et al. (2017). Compared to "SF" and "SBnuc" regions, "AGN" and "AGN/SBnuc" regions have higher L33 and
(right) vs. effective radius for 95 native regions from GOALS-ES (filled symbols) and of additional 23 native regions characterized using observations of the most luminous U/LIRGs from Barcos-Muñoz et al. (2017, hereafter BM17; unfilled symbols). In both panels, we show "AGN" (magenta triangle), "AGN/SBnuc" (green circles), "SBnuc" (yellow diamonds), and "SF" regions (blue squares). Regions classified as "Jet" or "Ud" are not shown for simplicity. Upper limits in size measurements are indicated with arrows. Dashed gray curves are models for a steady-state radiation feedback-supported maximal starburst disk from Thompson et al. (2005) with assumed molecular gas fraction fg
= 0.1, 0.3, and 1.0 and stellar velocity dispersion σ = 200 km s−1, as well as for fg
= 1.0 and σ = 300 km s−1. Solid gray curves show the same models with a modified term to include supernovae feedback, as adopted in Barcos-Muñoz et al. (2017). Compared to "SF" and "SBnuc" regions, "AGN" and "AGN/SBnuc" regions have higher L33 and  by up to 3 dex across the entire size range probed, but only the "AGN" in Mrk 231 clearly exceeds the predicted L33 and
  for a maximally star-forming nuclear disk.
Download figure:
Standard image High-resolution imageAs illustrated in Figure 8, "AGN" and "AGN/SBnuc" almost always have higher L33 and  relative to "SF" across the entire size range probed; the difference can be as much as ∼3 dex. This result suggests that more extreme mechanisms may be driving the observed radio emission in the "AGN" and "AGN/SBnuc" regions compared with the "SF" and "SBnuc" regions. In the following sections, we discuss two mechanisms that may be simultaneously contributing to the elevated 33 GHz emission observed in these "AGN" and "AGN/SBnuc" regions.
5.1.1. Radiation Pressure-supported Nuclear Starburst
Using analytical models, Thompson et al. (2005, hereafter TQM05) predicted that intense starbursts triggered in the dust-obscured gas-rich nuclear environments of local U/LIRGs can potentially radiate at the Eddington limit (for dust). In this scenario, IR radiation from dust-reprocessed UV or optical emission from massive young stars provides the dominant vertical support against gravitational collapse in an optically thick starburst disk. The authors estimated the IR luminosity surface densities of 40 local U/LIRGs using radio observations by Condon et al. (1991) and found the values to agree with those predicted by their models, which have also been invoked to interpret compact radio/submillimeter sources observed in the most luminous local U/LIRGs on ∼100 pc scales (e.g., Barcos-Muñoz et al. 2015, 2017; Pereira-Santaella et al. 2021). In Figure 8 we compare our 33 GHz measurements to a simplified version of the radiation pressure-supported starburst disk models presented in TQM05 to investigate the possibility that the observed compact regions of radio emission are driven by such radiation pressure-supported optically thick starbursts.
Following BM17, we also present additional solutions incorporating vertical support from supernovae feedback that can be approximated as  (Faucher-Giguère et al. 2013; Kim & Ostriker 2015), where nmol is the volume number density of the molecular gas of the modeled marginally stable one-zone disk (Equations (1) and (7) from TQM05). The predicted IR luminosities are then converted into 33 GHz luminosities by assuming both come from star formation, using Equations (10) and (15) from Murphy et al. (2012). With this assumption, we expect that excess 33 GHz emission from AGN activity would bring the "AGN" and "AGN/SBnuc" regions above the predicted values for maximal starbursts.
However, as shown in Figure 8, only the nucleus in Mrk 231 has L33 and ΣL33 exceeding the model prediction for the highest molecular gas fraction and velocity dispersion assumed, suggesting dominant AGN contribution to the 33 GHz emission at 100 pc scales. While this result is unsurprising given that Mrk 231 hosts the closest quasar (Adams 1972), the fact that all other "AGN" and "AGN/SBnuc" do not exceed the model predictions points to the possibility that their 33 GHz emission could be attributed to star formation. Most of the "AGN/SBnuc" regions cluster around the solutions for a constant molecular gas fraction of 0.3, which is also the average value for local U/LIRGs derived by Larson et al. (2016) based on results from galaxy SED fitting by Vivian et al. (2012; for stellar mass) and global molecular gas mass estimates from the literature. Therefore, in the context of this model comparison, the higher L33 and  of the "AGN" and "AGN/SBnuc" regions relative to the "SF" regions appear to reflect a more extreme mode of star formation that maintains a radiation pressure-supported nuclear starburst disk, compared with star formation in relatively isolated giant molecular clouds (GMCs) on the outskirts of the systems.
We note that many of these compact nuclei may have gas fractions higher than 0.3 at 100 pc scales as molecular gas likely dominates the nuclear environments of local U/LIRGs (Downes et al. 1993; Larson et al. 2020). Additionally, radiation pressure may exceed the Eddington limit and drive outflows (e.g., Murray et al. 2005), in which case measurements will also lie above the model predictions (e.g., Pereira-Santaella et al. 2021). A notable example is the two nuclei in Arp 220 (fg ∼ 0.5, σ ∼ 165 km s−1; Downes & Solomon 1998; Genzel et al. 2001), around which outflows have been detected in different tracers (e.g., Sakamoto et al. 2009, 2017; Tunnard et al. 2015; Barcos-Muñoz et al. 2018; Perna et al. 2020). Although these outflows have collimated morphology that indicates an AGN origin (Sakamoto et al. 2017; Barcos-Muñoz et al. 2018), VLBI observation does not show evidence for a bright AGN radio core (e.g., Smith et al. 1998b; Lonsdale et al. 2006; Parra et al. 2007; Varenius et al. 2019), which suggests that the elevated radio continuum emission of these two nuclei are likely powered by nuclear starbursts. Future follow-up high-resolution extinction-free measurements of the stellar and molecular gas distribution and kinematics in these nuclei are required to provide better constraints on the gas fraction and stellar velocity dispersion.
5.1.2. (Obscured) AGN Activity
Aside from an extreme mode of nuclear starburst, AGN activity likely contributes to the elevated 33 GHz emission in "AGN" and "AGN/SBnuc" regions. TQM05 theorized that efficient AGN fueling on parsec scales is accompanied by intense star formation in the nuclear disk over 100 pc scales above a critical rate. This prediction may explain the relatively low L33 and  of the "SBnuc" regions relative to "AGN" and "AGN/SBnuc" regions: star formation in "SBnuc" do not yet reach the rates required to trigger efficient AGN fueling. In the theoretical context of a merger-quasar evolutionary sequence (e.g., Di Matteo et al. 2005) where the tidal torque of gas-rich galaxy mergers drives nuclear fueling, we then would expect the "SBnuc" regions to reside in systems at earlier interaction stages, and the luminosities of the nuclei to increase toward later interaction stages due to contributions from triggered AGN activity.
In the top panel of Figure 9, we present a histogram of the region types represented in galaxies from GOALS-ES at different merger stages, normalized by the total number of systems at each stage. We see that the "SBnuc" regions are indeed preferentially found in early-stage mergers (stage "b"), which supports the aforementioned evolutionary scenario. Additionally, "AGN/SBnuc" regions are found at all stages but most frequently in late-stage mergers (stage "d"). This is consistent with results from MIR analysis of the GOALS systems by Stierwalt et al. (2013), who found that among the local U/LIRGs, the fraction of AGN-starburst composite systems increases among late-stage mergers. Among the merging systems, "AGN" regions are also most frequently found in late-stage mergers. As shown in the lower panel of Figure 9, it is also at the late-stage that the nuclei have the highest median L33. These results are in agreement with the scenario that powerful AGN activity is triggered during, e.g., gas-rich galaxy mergers. The marked increase in "AGN/SBnuc" toward the later stages may reflect increased levels of dust obscuration that makes AGN identification more difficult at shorter wavelengths, as suggested in previous GOALS studies in the MIR and X-ray (e.g., Stierwalt et al. 2013; Ricci et al. 2017, 2021). We note that nuclei from BM17 were not included in Figure 9 because the host galaxies do not statistically represent the full GOALS sample. However, including the BM17 nuclei does not alter the overall trend seen in the sky area and flux-limited selection of the GOALS-ES sample.

Figure 9. The fraction of systems hosting different region types (upper) and nuclear luminosity distribution (lower) vs. merger stage classification of the host system: "a" pre-merging, "b" early-merger, "c" mid-merger, "d" late-merger, and "N" non-merger (Stierwalt et al. 2013). Upper: for each merger stage, the number of galaxies hosting each region type is normalized by the total number of galaxies with the specific merger classification, shown in parentheses on the horizontal axis. Galaxies often host more than one type of region; therefore, the normalized galaxy counts at each merger stage do not add to 1. All native regions identified at 15 or 33 GHz from GOALS-ES are accounted for, excluding "Ud" and "Bg." Lower: individual values are color-coded by the nuclear region types ("AGN"—magenta, "AGN/SBnuc"—green, and "SBnuc"—yellow), and median values and uncertainties at each merger stage are represented by the solid black lines. The number of systems included at each merger stage is shown in parentheses on the horizontal axis. Only nuclei identified at 33 GHz from GOALS-ES are included. Overall, "AGN" and "AGN/SBnuc" are more frequently found and are more luminous at 33 GHz in the final merger stages.
Download figure:
Standard image High-resolution imageTo further investigate whether the elevated 33 GHz emission is correlated with more powerful AGN activity, we compare AGN diagnostics in the X-ray (hardness ratio, HR, L2–10 keV; Iwasawa et al. 2011; Torres-Albà et al. 2018) and MIR (6.2 μm PAH EW, MIR slope; Stierwalt et al. 2013) with L33 of "AGN" and "AGN/SBnuc" regions in Figure 10. We also mark systems with [Ne v] (14.3 μm), Fe K (6.4 keV), and hard X-ray (>10 keV) detections (Iwasawa et al. 2011; Petric et al. 2011; Ricci et al. 2021), which are commonly used indicators of AGN activity. The latter two are used to identify heavily obscured AGNs.

Figure 10. The 33 GHz continuum luminosity of nuclei in GOALS-ES and BM17 vs. AGN diagnostics in the X-ray ((a) and (b)) and MIR ((c) and (d)). (a): X-ray hardness ratios (HRs) measured by Iwasawa et al. (2011) and Torres-Albà et al. (2018) using Chandra observations, defined as HR = (H − S)/(H + S), where H is the hard-band (2–7 keV) flux, and S is the soft-band (0.5–2 keV) flux. The dotted horizontal line marks the empirical threshold above which the nucleus is considered to host an AGN due to excess hard X-ray emission (pink shaded area). (b): X-ray luminosity at 2–10 keV from Iwasawa et al. (2011) and Torres-Albà et al. (2018), corrected for galactic extinction. The gray shaded area represents the radio/X-ray luminosity ratio range for radio-quiet AGNs from Panessa et al. (2019; i.e., ν
Lν
/L2–10 keV= 10−2–10−4, ν = 90–100 GHz), assuming the luminosities at 33 and 100 GHz are similar. The black dashed line represents the 1.4 GHz radio/X-ray luminosity ratio for star-forming galaxies from Ranalli et al. (2003; i.e.,  ), assuming α1.4–33 ∼ α15–33 ∼ −0.65, as measured among "AGN/SBnuc" in this work. (c): the 6.2 μm PAH equivalent widths (EWs) measured by Stierwalt et al. (2013) using Spitzer observations. The horizontal dotted line marks the empirical threshold, 0.27 μm, below which the MIR nuclear emission is considered to be dominated by AGNs (pink shaded area). The green shaded area represents the empirical range (0.27–0.54 μm) where the nuclear emission is considered to have some but nondominant AGN contribution, and nuclei in the yellow shaded area are considered to be starburst-dominated and have low to no AGN contribution on kiloparsec scales. (d): The MIR slope from Stierwalt et al. (2013), defined as the logarithmic flux density ratio between 30 and 15 μm. The gray shaded area represents the range spanned by the majority of LIRGs in GOALS. In all panels, filled symbols represent ULIRGs, and systems with [Ne v] 14.3 μm, Fe K 6.4 keV, and hard (>10 keV) X-ray detections reported in Petric et al. (2011), Iwasawa et al. (2011), Torres-Albà et al. (2018), and Ricci et al. (2021) are marked with square symbols in red, black, and blue, respectively, with increasing sizes. Nuclei with the highest L33 also have higher observed L2–10 keV, the smallest 6.2 μm PAH EW, and steepest MIR, suggesting (dust-obscured) AGN contribution to the 33 GHz emission in "AGN" and "AGN/SBnuc" regions.
Download figure:
Standard image High-resolution imageAs shown in Figure 10, while L33 does not exhibit clear correlation with the X-ray HR, nuclei with higher L33 show higher L2–10 keV, smaller 6.2 μm PAH EW, and steeper MIR slope. The Kendall's Tau correlation coefficients are 0.08, 0.27, −0.29, and 0.29, respectively, for comparisons presented in Figures 10(a), (b), (c), and (d), indicating stronger (anti)correlations between L33 and MIR diagnostics. Nuclei with L33 ≳ 1029 erg s−1 Hz−1 mostly reside in ULIRGs, and they also have the smallest 6.2 μm PAH EW and highest L2–10 keV, which suggests that in these nuclei, the 33 GHz continuum is likely tracing AGN activity that produces strong hard X-ray emission and weak PAH emission. The steeper MIR slope of these nuclei, as shown in Stierwalt et al. (2013), suggests the presence of warm dust heated by the accretion disk of the AGN. The dense interstellar medium (ISM) in such environments can result in the Compton down-scattering of X-ray photons and cause reduced correlations between the radio and observed X-ray luminosity.
In Figure 10(b) we also show the expected range of X-ray luminosities for radio-quiet AGNs (shaded in gray; Panessa et al. 2019) and star-forming galaxies (black dashed line; Ranalli et al. 2003) at the given L33. Many "AGN/SBnuc" follow the relation established for star-forming galaxies, suggesting that both L2–10 keV and L33 could be tracing star formation in these nuclei. However, some of them may also host highly embedded AGNs whose X-ray emission is significantly absorbed. Comparison between the observed L2–10 keV (Iwasawa et al. 2011; Torres-Albà et al. 2018) and intrinsic L2–10 keV derived from spectral model-fitting by Ricci et al. (2021) for a handful of overlapping systems shows that the latter could be higher by up to 2 orders of magnitude. Correcting for the effect of host obscuration will allow for a more robust comparison between these nuclei to radio-quiet AGNs (shaded area), and would require more sensitive X-ray observations and spectral analysis.
The inference from the above discussion is that the elevated 33 GHz emission in "AGN" and "AGN/SBnuc" with the highest 33 GHz luminosities is likely dominated by contributions from AGNs that are obscured in the X-ray. We note that the overall weak correlations between L33 and various AGN diagnostics presented above may be driven by the ∼5–10 times lower resolutions of the X-ray/MIR observations compared to our 33 GHz observations.
In summary, the elevated 33 GHz continuum emission of "AGN" and "AGN/SBnuc" regions relative to "SF" regions in local U/LIRGs likely comes from a combination of extreme nuclear starburst and AGN activity, with the nuclei with higher 33 GHz luminosities more dominated by AGNs but also experiencing more dust obscuration at shorter wavelengths. This conclusion is in agreement with X-ray studies that show that AGN accretion is accompanied by intense circumnuclear star formation (e.g., Lutz et al. 2018), and that powerful AGN accretion in mergers is heavily obscured by dust, especially in the final ULIRG stage (e.g., Ricci et al. 2017, 2021). However, follow-up observations at higher resolutions are required to fully disentangle the contribution from AGNs and starbursts.
5.2. How Does Star Formation in U/LIRGs Compare with That in Nearby Normal Galaxies?
In Section 4.4 and Figure 7 we showed that all regions in the GOALS-ES span a wide range in fth, but the median values for "SF" and "SBnuc" are significantly higher compared to those for the "AGN" and "AGN/SBnuc" regions. We note that similarly low fth (<50%) have also been observed by Barcos-Muñoz et al. (2015) and BM17 in the most luminous local U/LIRGs (including Arp 220), using 6–33 GHz measurements. The authors suggest that in these heavily obscured systems, thermal emission from the nuclear starburst could be suppressed via dust absorption of ionizing photons, which may be responsible for the apparent dominance of nonthermal emission. Meanwhile, given the discussion in Section 5.1.2, "AGN" and "AGN/SBnuc" regions may also contain excess nonthermal emission from unresolved jets and/or wind/outflows associated with AGN activity (e.g., Panessa et al. 2019; Hayashi et al. 2021). Therefore, in this Section we only focus on comparing the 48 "SF"/"SBnuc" regions in the GOALS-ES with 129 star-forming regions identified in the SFRS (see Section 2.3 and Appendix B).
5.2.1. Radio Spectral Indices and 33 GHz Thermal Fraction
Studies of nearby normal galaxies with the SFRS have shown that their 33 GHz continuum emission is largely dominated by thermal free–free emission from H ii regions on both kiloparsec and 100 pc scales, which make 33 GHz continuum an ideal extinction-free tracer of ongoing massive star formation (Murphy et al. 2011, 2012; Linden et al. 2020). Linden et al. (2019) shows that for extranuclear star-forming regions in the GOALS-ES, thermal emission accounts for ∼65% of the 33 GHz emission on kiloparsec scales, which is similar to values derived for the SFRS galaxies on the same physical scales (fth ∼ 60%; Murphy et al. 2012). To investigate whether this agreement is also seen on 100 pc scales, in Figure 11 (right panel) we compare the distributions of 15–33 GHz spectral indices (α15–33) measured for the GOALS-ES ("SF"/"SBnuc") regions and SFRS star-forming regions. We also show the effective radius of the area we use to measure α15–33 for each matched region. We note that α15–33 instead of fth is presented because the former can be more straightforwardly compared without considering any underlying assumptions about the intrinsic nonthermal and thermal spectral shapes.
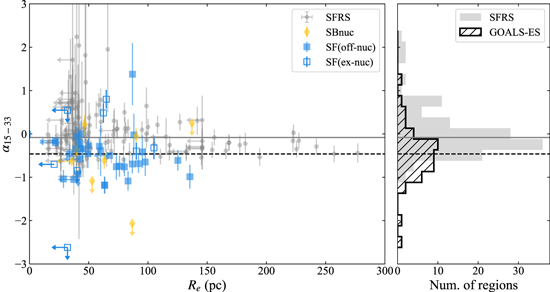
Figure 11. The 15–33 GHz spectral indices (α15–33) measured for matched regions identified in nearby star-forming galaxies from the SFRS and local U/LIRGs from GOALS-ES. Left: α15–33 vs. effective radii, Re , of the region area used to measure α15–33. SFRS regions are in gray, and GOALS-ES regions are colored in yellow ("SBnuc") and blue ("SF"), with extranuclear "SF" regions shown by nonfilled symbols. Upper limits in size are indicated with arrows. Right: distribution of α15–33 for GOALS-ES regions (hatched black) and for SFRS regions (filled gray). In both panels, the median values for the SFRS (−0.08 ± 0.27) and GOALS-ES regions (−0.46 ± 0.29) are shown in solid gray and dashed black lines, respectively. Overall, α15–33 spans a wide range for star-forming regions in both local U/LIRGs and normal galaxies, especially at Re < 100 pc. Regions in U/LIRGs have steeper median α15–33 compared with those in nearby normal galaxies, suggesting more dominant nonthermal contribution at 33 GHz.
Download figure:
Standard image High-resolution imageFigure 11 shows that star-forming regions in GOALS-ES and SFRS both exhibit a wide range of α15–33, from <−2 to 1.38 ± 0.72 for GOALS-ES and −0.98 ± 1.20 to ≳2 for SFRS. The median spectral index of the SFRS regions is −0.08 ± 0.27, which is consistent with values derived by Linden et al. (2020) using a different method to measure region photometry. In contrast, the median value for the GOALS-ES regions is −0.46 ± 0.29, suggesting a higher contribution from steep-spectrum nonthermal emission. This value is also steeper than the median value derived on kiloparsec scales for extranuclear star-forming regions in the GOALS-ES (−0.27 ± 0.23; Linden et al. 2019). A two-sample K-S test on the distributions of α15–33 for the GOALS-ES and SFRS regions yields a p-value of ≪1, which means that the differences we see between the two samples of regions are likely intrinsic. Several mechanisms may be responsible for the comparatively steep α15–33 of the 100 pc scale GOALS-ES regions, as discussed below.
First, because U/LIRGs are dusty, thermal free–free emission from H ii regions may have been suppressed via dust absorption (Barcos-Muñoz et al. 2015, 2017). However, this effect likely only becomes important in the most heavily obscured systems such as in the ULIRGs, and we also do not find any correlation between α15–33 and the MIR 9.7 μm silicate depths estimated by Stierwalt et al. (2013), which measure the level of dust obscuration on kiloparsec scales in these systems. Matched-resolution comparison between the resolved dust and the spectral index distribution will shed light on how much dust absorption affects the 100 pc scale high-frequency radio properties of local U/LIRGs.
Second, the ages of the starbursts also affect the relative contribution of nonthermal and thermal emission (e.g., Rabidoux et al. 2014; Linden et al. 2019, 2020). Using Starburst99 models, Linden et al. (2020) showed that nonthermal synchrotron emission from supernovae can quickly dominate the radio emission of an instantaneous starburst within 10 Myr compared with steady continuous star formation that maintains high thermal contribution with relatively flat radio spectrum. Using the same models and near-IR (NIR) hydrogen recombination line observations, Larson et al. (2020) estimated that star-forming clumps in local U/LIRGs have an age range of 6–10 Myr. Therefore, the overall higher nonthermal contribution at 33 GHz measured in local U/LIRGs could be a reflection of the more recent star formation triggered in local U/LIRGs on 100 pc scales.
Third, the dense ISM in the compact starbursts in local U/LIRGs may produce a nonthermal synchrotron spectrum that is intrinsically steeper than those characterized in star-forming regions in nearby normal galaxies (i.e., αNT ∼ −0.85; Murphy et al. 2011). Via multifrequency analysis, Galvin et al. (2018) measured an average αNT ∼ −1.06 in a sample of 19 local LIRGs. In the nearby starburst NGC 4945, αNT has been measured to be as steep as ∼−1.5 (e.g., Bendo et al. 2016; Emig et al. 2020). Additionally, spectral steepening of synchrotron emission above 10 GHz has also been observed in nearby star-forming galaxies (e.g., Klein et al. 2018), local U/LIRGs (e.g., Clemens et al. 2008; Leroy et al. 2011), as well as high-z star-forming and starburst galaxies (e.g., Thomson et al. 2019; Algera et al. 2022). As discussed in Klein et al. (2018), steep synchrotron spectra either result from energy losses of high-energy electrons due to inverse-Compton scattering and synchrotron radiation in dense ISM environments, or intrinsic lack of high-energy electrons. Therefore, the steeper α15–33 measured in GOALS-ES regions may simply reflect intrinsically steep nonthermal spectrum, and does not necessarily require excess nonthermal emission. We note that if we assume a simple two-component power-law model without spectral steepening (i.e., Equation (4)), for fth to be as high as measured in the SFRS regions (∼90%) at α15–33 ∼ −0.46, αNT will have to be ∼−2, which is also the steepest α15–33 measured in the GOALS-ES region. Matched-resolution observations at lower radio frequencies are needed to recover the intrinsic nonthermal spectral shape in these extreme systems (e.g., Tabatabaei et al. 2017).
Finally, tidal shocks associated with galaxy mergers may have produced excess nonthermal synchrotron emission in local U/LIRGs (Murphy 2013). While it is possible that we are detecting traces of shock-driven synchrotron emission, given the high resolution of our observations, large-scale diffuse emission driven by such dynamical effects is likely to have been resolved out, and would play a relatively minimal role in producing the steep α15–33 we measure on 100 pc scales.
We emphasize that while the median α15–33 of the GOALS-ES regions is significantly steeper than that of the SFRS regions, the wide range of values seen in both samples, especially at Re < 100 pc, suggests that the balance between thermal and nonthermal emission is more complicated at small scales. Large uncertainties in our measurements due to sparse frequency coverage and short on-source time also limit our ability to draw more definitive conclusions. Matched-resolution radio continuum observations at more than two different frequencies are needed to more robustly characterize the radio continuum spectrum of compact star-forming regions in local U/LIRGs. This will also allow us to better understand whether and how the extreme ISM conditions in these dense starbursts may alter the synchrotron production and propagation processes.
5.2.2. Star Formation Rates and Surface Densities
In Figure 12 we show SFRs and surface densities with respect to effective radii for "SF" and "SBnuc" regions in GOALS-ES (see Section 4.5) and SFRS. We show values derived from both the total 33 GHz flux ((a) and (b)) and the free–free component via 15–33 GHz spectral decomposition ((c) and (d)), as described in Section 4.4. The star-forming regions in local U/LIRGs have 1–3 dex higher SFR and ΣSFR than similarly sized regions in the nearby normal galaxies, even after accounting for the steeper α15–33 measured in the GOALS-ES regions. The median values for SFR and ΣSFR for the GOALS-ES regions are 0.8 ± 0.5 M⊙ yr−1 and 86 ± 65 M⊙ yr−1 kpc−2, which is roughly 10 times higher than the median values for the SFRS regions (SFR ∼ 0.1 M⊙ yr−1 and ΣSFR ∼ 10 M⊙ yr−1 kpc−2). As expected, the median values for SFRth and  are lower, at ∼0.4 M⊙ yr−1 and ∼44 M⊙ yr−1 kpc−2, but still significantly higher than those for the SFRS regions, despite that the latter are more dominated by thermal free–free emission. Given that this comparison is made at the scales of GMCs (10–100 pc), our result suggests that GMCs in local U/LIRGs are forming more stars compared to those in nearby normal galaxies, at least in these most active star-forming regions detected in these systems that are mostly "nuclear" and"off-nuclear."

Figure 12. SFRs and surface densities vs. effective radii for "SF" and "SBnuc" regions characterized in local U/LIRGs in this work, as well as for star-forming regions in nearby normal galaxies from the SFRS characterized using the same methods outlined in Section 3. Values derived for the SFRS sample are in gray circles. We show values derived both from the total 33 GHz flux ((a) and (b)) and thermal free–free only flux based on the measured 15–33 GHz spectral indices ((c) and (d)). Star-forming clumps and starburst nuclei in the GOALS-ES have up to 3 dex higher SFRs and surface densities compared with star-forming clumps in the SFRS on ∼ 100 pc scales.
Download figure:
Standard image High-resolution imageUsing HST NIR hydrogen recombination line (i.e., Paα, Paβ) observations of 48 local U/LIRGs smoothed to a common resolution of 90 pc, Larson et al. (2020) identified 751 extranuclear star-forming clumps in these systems with median SFR ∼ 0.03 M⊙ yr−1 and ΣSFR ∼ 0.3 M⊙ yr−1 kpc−2. These values are over 10 times lower than the values derived for the GOALS-ES regions, which may be due to intrinsic differences between nuclear and extranuclear star formation as suggested in Linden et al. (2019), or systematic offsets introduced by the use of different SFR tracers. However, due to the 90 pc resolution limit, the clumps studied in Larson et al. (2020) are at least five times larger than the GOALS-ES regions characterized in this work, which complicates the interpretation.
To investigate whether the different SFR tracers used may have introduced a systematic offset, we acquired continuum-subtracted Paα or Paβ images used in Larson et al. (2020) for nine non-AGN U/LIRGs also included in the GOALS-ES and directly compare the Pa α/β emission with the radio continuum, without smoothing the HST images, as demonstrated in the upper panels of Figure 13. We calculate the SFR at each matched region identified in the radio using the same circular apertures on the NIR, 15 and 33 GHz maps, following Equations (5) and (6) and the prescription provided in Larson et al. (2020). Due to lack of multiline observations, these NIR images are not corrected for extinction, which has a minimal effect on the measurements of extranuclear clumps studied in Larson et al. (2020) but could affect measurements within the central kiloparsec (Piqueras López et al. 2013).

Figure 13. A comparison between radio continuum and Pa α/β as SFR tracer. Upper: continuum-subtracted HST Paα image of NGC 1614 (left) and Paβ image of IRAS F17138-1017 (right) from Larson et al. (2020). Black contours show 33 GHz radio continuum at matched resolutions with 15 GHz continuum, and the matched beams are shown in the lower left corners in black ellipses. Contour levels are 0.075, 0.15, 0.23, and 0.45 mJy beam−1 for NGC 1614, and 0.032, 0.065, and 0.13 mJy beam−1 for IRAS F17138-1017. Lime circles show the apertures used for measuring and comparing radio- and Paα/β-derived SFRs. Lower: the ratio between radio-derived and NIR-derived SFRs for nine U/LIRGs in the sample. The SFRs derived from thermal free–free radio continuum (filled) show better agreement with NIR-derived SFRs than those derived from total 33 GHz continuum (unfilled), and deviations from 1:1 relation (dashed line) are likely due to nuclear dust extinction.
Download figure:
Standard image High-resolution imageAs shown in the lower panel of Figure 13, SFRs derived from the total 33 GHz continuum are consistently higher than values derived from the Pa α/β emission by up to ∼1 dex, with the "AGN/SBnuc" in IRAS F16399-0937 showing the highest discrepancy, possibly due to AGN activity or extreme nuclear obscuration. When only considering the thermal component, the radio-derived values for "SF" regions show better agreement, with SFRth/SFRNIR ∼ 0.5–15 and a median of ∼2, which would correspond to Av ∼ 4 if we assume thermal radio emission is tracing the same emission. This value is consistent with nuclear extinction estimated from NIR line ratios in previous works (e.g., Alonso-Herrero et al. 2006; Piqueras López et al. 2013). This suggests that the thermal free–free radio continuum is indeed tracing ionized plasma in H ii regions that are producing the hydrogen recombination lines, and that the radio continuum is more reliably tracing star formation in the dusty nuclear environments of local U/LIRGs.
Given the above, while the limited sensitivity of our current radio observations only allows detections of the most energetic regions of nuclear star formation, we expect that radio- and NIR-derived SFRs for the mildly obscured extranuclear star-forming clumps in local U/LIRGs to be largely consistent with each other. Therefore, nuclear star formation in local U/LIRGs, as probed by the extremely high SFR and ΣSFR derived in this work and previous studies (e.g., Barcos-Muñoz et al. 2017; Vivian et al. 2019), are likely proceeding at much faster rates at GMC scales than those in the outskirts of local U/LIRGs, as well as those in nearby normal galaxies. Such extreme activity is likely driven by the high molecular gas surface densities in the central kiloparsec of local U/LIRGs, as have been measured with ALMA at ∼100 pc scales (e.g., Wilson et al. 2019; Sánchez-García et al. 2022a, 2022b). These studies also show that molecular gas forms stars more efficiently in these high-density environments, potentially driven by cloud–cloud collisions (Jog & Solomon 1992) and/or gravitational instability induced by the high stellar mass density (e.g., Romeo & Fathi 2016).
Meanwhile, it has also been shown that local U/LIRGs host a higher fraction of young (<10 Myr) and massive (≳106 M⊙) star clusters compared to normal galaxies (e.g., Alonso-Herrero et al. 2002; Linden et al. 2017, 2021). Therefore, the elevated SFR and ΣSFR of GOALS-ES regions characterized in this work relative to the SFRS regions may be a reflection of the higher numbers of massive star clusters being produced in the former. These massive clusters better sample the stellar IMF and thus are more likely to contain a higher number of massive stars that ultimately generate synchrotron emission via supernovae explosions, which possibly contributes to the steep α15–33 measured in the GOALS-ES regions, as discussed in Section 5.2.1.
Finally, as shown in Figure 12, while SFR and SFRth are clearly correlated with Re for the SFRS regions, values for the GOALS-ES regions show relatively weak dependence on the region sizes and larger scatter at a given size. Fitting the data with a power-law model SFR ∝ Lradio ∝ rη yields η ∼ 2.3 for the SFRS regions and η ∼ 1.1 for the GOALS-ES regions, with similar values derived using SFRth, which have larger scatter as well as uncertainties. While the limited sensitivity of the radio observations prevents a direct comparison to the luminosity–size relation established in the optical/NIR (e.g., Piqueras López et al. 2016; Cosens et al. 2018), the relatively weak dependence of SFR and SFRth on the sizes of the GOALS-ES regions is consistent with a scenario where the H ii region is density-bounded with its luminosity set by the local gas volume density. In this case, hydrogen atoms in the region recombine faster than they are ionized and hence a fraction of ionizing photons is not absorbed and escapes the region, resulting in lower luminosity than expected at a given region size (e.g., Beckman et al. 2000; Wisnioski et al. 2012). Hence the relatively constant SFR and SFRth of the GOALS-ES regions may be reflecting the high-density environments that they reside in. In comparison, the SFRS regions may more closely resemble photon-bounded H ii regions (i.e., Strömgren spheres) in low-density environments, whose luminosities are more or less proportional to the region volumes as hydrogen recombination balances ionization.
A similar dichotomy was also observed by Cosens et al. (2018) in a large sample of star-forming clumps, and the authors found that clumps with ΣSFR > 1 M⊙ yr−1 kpc−2 show weaker size dependence in Hα luminosity than clumps with ΣSFR < 1 M⊙ yr−1 kpc−2, which are consistent with the ranges of ΣSFR and  represented by the GOALS-ES and SFRS regions, respectively. Deeper radio observations capable of sampling a wider range of star-forming clumps would allow for a more quantitative comparison between the luminosity–size relation observed in the radio and at shorter wavelengths.
6. Summary
Local U/LIRGs provide excellent laboratories for studying the intense dust-obscured phase in the evolution of many massive galaxies across the cosmic time. In this study we have used high-resolution (∼01) 33 and 15 GHz radio continuum VLA observations of 68 local U/LIRGs from the GOALS "equatorial" VLA Survey (GOALS-ES) to study the properties of AGNs and star formation in these extreme systems at 100 pc scales. The GOALS-ES sample spans the entire range of IR luminosities, distances, and merger stages represented in the local U/LIRG population. Below we provide a summary of our major results and conclusions:
- 1.Among the 68 systems in the GOALS-ES sample, compact radio continuum sources were detected in 63 systems with our high-resolution VLA observations at either 33 or 15 GHz. Using Astrodendro, we identified and characterized a total of 133 regions of compact radio continuum emission in these systems at the native resolutions, and found the effective radii (Re ) range from 8–170 pc. These regions were further classified as 17 "AGN" (AGN), nine "Jet" (AGN jet), 31 "AGN/SBnuc" (AGN-starburst composite nucleus), eight "SBnuc" (starburst nucleus), 50 "SF" (star-forming clump), and 17 "Ud" (unsure) based on their locations in the host galaxies as well as multiwavelength AGN classifications from the literature. While all regions have low brightness temperatures (Tb ≲ 104 K), "AGN" and "AGN/SBnuc" regions have consistently higher 33 GHz luminosities (L33) and surface densities (
 ) compared with "SF" and "SBnuc" regions of similar sizes by up to ∼3 dex. Comparisons with analytical models of radiation pressure-supported nuclear starbursts and with lower-resolution X-ray and IR AGN diagnostics suggest that both extreme modes of nuclear starbursts and AGN activity may contribute to the elevated 33 GHz emission in "AGN" and "AGN/SBnuc."
 - 2.We used resolution-matched 15 and 33 GHz images to measure the 15–33 spectral indices (α15–33) for a total of 115 regions, with which we estimated the fractional contribution of thermal free–free emission to the total 33 GHz continuum (thermal fraction; fth) in these regions. The 15–33 GHz spectral indices for these regions span a wide range, from <−2 to 1.38 ± 0.72, corresponding to f ∼ 0%–100% assuming a constant nonthermal spectral index of −0.85. While all region types span a wide range of α15–33, "SF" and "SBnuc" have flatter median spectral indices compared with the "AGN" and "AGN/SBnuc" regions. However, the median spectral indices for "SF" and "SBnuc" (α15–33 ∼ −0.46 ± 0.29) are significantly steeper than star-forming regions in nearby normal galaxies measured at similar physical scales, suggesting a higher contribution of nonthermal synchrotron emission at 33 GHz in local U/LIRGs.
- 3.For the 48 "SF" and "SBnuc" regions measured at matched resolution, we estimated their SFRs and surface densities from both total 33 GHz (or 15 GHz) flux densities as well as thermal free–free emission extracted using the estimated fth for each region. We found that with effective radii of 20–140 pc, these regions have SFRs and surface densities of 0.14–13 M⊙ yr−1 and 13–1600 M⊙ yr−1 kpc−2, respectively, which are consistently higher than similarly sized star-forming regions in nearby normal galaxies. Even after accounting for the relatively low estimated 33 GHz thermal fractions, the estimated thermal-only SFRs and surface densities still have median values of 0.4 M⊙ yr−1 and 44 M⊙ yr−1 kpc−2, respectively, and are at least 2 dex higher than star-forming regions in normal galaxies.

Throughout this study we have demonstrated the elevated star-forming activities in local U/LIRGs relative to nearby normal galaxies at the scales of GMCs, which motivates comprehensive investigation of the cold molecular gas properties at high resolution in these extreme environments. We have also shown the ubiquity of compact and powerful nuclear activity in local U/LIRGs with a wide range of host properties, despite the fact that the origin for these luminous high-frequency radio emission remains highly debatable. Future multifrequency high-resolution observations with wider frequency coverage will allow for more accurate characterization of the radio SEDs of these compact radio sources to future investigate their nature, and VLBI observations will help determine the prevalence and contribution from AGN activity. Meanwhile, James Webb Space Telescope (JWST) will provide crucial information on dust and multiphase ISM at matched resolutions.
Y.S. would like to thank J. Molden and M. Perrez-Torres for sharing preliminary results on AGN identification using e-MERLIN, T. Thompson for providing helpful insights on comparisons with the TQM05 models, J. Hibbard for helpful discussions on locating galactic nuclei using ALMA data sets, and J. Rich for additional information on optical AGN classifications. Support for this work was provided by the NSF through the Grote Reber Fellowship Program administered by Associated Universities, Inc./National Radio Astronomy Observatory. A.S.E. and Y.S. were supported by NSF grant AST 1816838. A.S.E. was also supported by the Taiwan, ROC, Ministry of Science and Technology grant MoST 102-2119-M001-MY3. V.U. acknowledges funding support from NASA Astrophysics Data Analysis Program (ADAP) grant 80NSSC20K0450. H.I. acknowledges support from JSPS KAKENHI grant No. JP19K23462. The National Radio Astronomy Observatory is a facility of the National Science Foundation operated under cooperative agreement by Associated Universities, Inc. We acknowledge the usage of the HyperLeda database (http://leda.univ-lyon1.fr), and the NASA/IPAC Infrared Science Archive, which is funded by the National Aeronautics and Space Administration and operated by the California Institute of Technology. This research made use of APLpy, an open-source plotting package for Python (Robitaille & Bressert 2012; Robitaille 2019).
Facilities: VLA - Very Large Array, Spitzer - Spitzer Space Telescope satellite, HST - Hubble Space Telescope satellite, IRSA - , NASA/ADS - , IPAC/NED - .
Software: Ned Wright's Cosmology Calculator (Wright 2006), Astropy (Price-Whelan et al. 2018), Astrodendro (http://www.dendrograms.org; Robitaille et al. 2019), CASA (McMullin et al. 2007), APLpy (Robitaille & Bressert 2012; Robitaille 2019).
Appendix A: Notes on Individual Systems
Here we provide details on the radio observations (Table A1), and regions identified in each system, along with their classifications via comparisons with archival optical and IR data sets as well as information from the literature (Table A2), when available. Unless otherwise specified, merger stage classifications are from Stierwalt et al. (2013), descriptions of the optical and IR comparisons are based on y-band images from the Pan-STARRS1 database (Flewelling et al. 2020), and channel maps are from Spitzer IRAC (Armus et al. 2009; J. Mazzarella 2022, in preparation). When describing the 6.2 μm PAH equivalent width (EW) as an AGN diagnostic, we follow Stierwalt et al. (2013) and Vardoulaki et al. (2015) and consider sources with 6.2 μm PAH EW < 0.27 μm to be AGN-dominated, and those with 0.27 < 6.2 μm PAH EW < 0.54 μm to have a mixed contribution from AGNs and starbursts, and those with 6.2 μm PAH EW > 0.54 μm to be starburst-dominated. For galaxies with regions with undetermined nature due to lack of high-resolution ancillary data, we also show a comparison between the ancillary data and our radio images for clarity.
- 1.NGC 0034: this system is a late-stage merger. We identified one bright nuclear region in this system at both 15 and 33 GHz. This region aligns with the galaxy center in the optical and IR. X-ray study suggests that this galaxy hosts a buried AGN (NH ∼ 1023 cm−2; Torres-Albà et al. 2018), and this galaxy is classified as a type-2 Seyfert in the optical (Veilleux et al. 1995; Yuan et al. 2010). Therefore, we classify the nuclear region identified in the radio as "AGN."
- 2.MCG -02-01-051: this galaxy is the southern component of the early-stage interacting pair Arp 256. Two nuclear regions were identified at 33 GHz at native resolution, but the image quality is poor (S/N ≲ 5); therefore, in Table 2 we report region properties characterized using the native-resolution 15 GHz image where the two regions blend together into one larger region. Note that the 15–33 GHz spectral index of this region, reported in Table 3, is an upper limit given the low S/N of the detection at 33 GHz. This region aligns with the optical and IR peak, and no evidence of AGN activity has been reported. Therefore, here we classify this region as "SBnuc."
- 3.IC 1623 (VV 114): we detect the eastern component of this mid-stage merger at both 15 and 33 GHz. In total, six nuclear regions are identified with Astrodendro. The brightest region aligns with the optical center and is identified as an AGN by Iono et al. (2013) based on elevated HCN/HCO+ ratio. However, analysis of JWST/MIRI imaging data shows that this region has MIR colors (e.g., F770W/F560W) consistent with pure star formation, while a much fainter radio region to the southwest shows MIR colors more consistent with AGN activity (Evans et al. 2022). No clear signatures of AGNs have been found in the X-ray, optical, or MIR on global scales, and high excitation MIR coronal lines indicative of AGN activity were not detected on 100 pc scales using JWST/MIRI-MRS spectroscopic data sets in any of the radio-selected regions (J. Rich et al. 2022, in preparation). Given the uncertainties, we tentatively classify the brightest region as "AGN/SBnuc," and the rest as off-nuclear "SF."
- 4.MCG -03-04-014: two nuclear regions are identified at both 15 and 33 GHz in this noninteracting galaxy. The brighter region aligns with the optical and IR peak, as well as the dynamical center of the warm molecular gas as revealed in the ALMA CO(J = 3–2) data set (2013.1.01165.S, PI: S. Haan). The fainter region lies on a nuclear spiral arm that connects to the dynamical center. No clear detection of AGNs has been reported for this galaxy, but it has been classified as an AGN/SB composite system in the optical by Yuan et al. (2010). Therefore, we classify the brighter region as "AGN/SBnuc" and the fainter region as off-nuclear "SF."
- 5.CGCG 436-030: in the native-resolution 33 GHz image, we detect one bright and two faint knots at the optical and IR peak of this western component of an early-stage merger. At matched resolution at 15 and 33 GHz, these three knots are blended together and were identified as one larger extended nuclear region with Astrodendro. This nuclear region is detected in the soft and hard X-ray with Chandra (Torres-Albà et al. 2018), and the nuclear MIR spectra (slit width ∼4'') indicate clear dominance of emission from star formation (Díaz-Santos et al. 2017; Inami et al. 2018). However, this galaxy is classified as an AGN/SB composite system in the optical (Vega et al. 2008) and radio (Vardoulaki et al. 2015). VLBI observations of this galaxies revealed a high brightness temperature (Tb > 107 K) component that can be explained with a clustered radio supernovae model (Smith et al. 1998a). Given these uncertainties, here we classify this nuclear region as an "AGN/SBnuc."
- 6.IRAS F01364-1042: in this late-stage merger, we detect one bright nuclear region close to the optical and IR peak of the galaxy. Chandra detected both the soft and hard X-ray at the center of this galaxy, and Iwasawa et al. (2011) attributed their origin to highly obscured high-mass X-ray binaries or AGNs. This system is classified as an LINER in the optical (Veilleux et al. 1995; Yuan et al. 2010) and as a likely AGN candidate in the radio due to the compactness of its 33 GHz emission (Barcos-Muñoz et al. 2017). Given the above, here we classify this nuclear region as "AGN/SB nuc."
- 7.III Zw 035: we detect the northern component of this pre-merger at both 15 and 33 GHz. At native resolution, one bright knot and a much fainter knot are identified at 33 GHz. Analysis of 003 resolution ALMA Band 6 continuum (2018.1.01123.S, PI: A. Medling) suggests that the brighter northern region likely hosts the AGN, while the fainter region in the south is part of a clumpy dust ring-like structure that is also producing strong OH maser emission (Pihlström et al. 2001). At matched resolution, these two knots are blended and were identified as one extended nuclear region. This region aligns with the optical and IR peak. While no direct evidence for AGN currently exists, González-Martín et al. (2009) found indirect X-ray signatures for a Compton-thick AGN, which is supported by an extremely high gas surface density estimated by Barcos-Muñoz et al. (2017), who also reported that this galaxy has the most compact 33 GHz emission among U/LIRGs in the GOALS sample. Given the above, here we classify this extended nuclear region as "AGN/SBnuc." More precisely, the nucleus is located at the brighter knot detected at native resolution, which coincides with the dynamical center of the molecular gas as revealed by ALMA (2018.1.01123.S, PI: A. Medling). Observation with e-MERLIN at 5 GHz reveals compact continuum emission at the location of the "AGN/SBnuc" with a peak brightness temperature of 104.8 K (J. Molden 2022, private communication).
- 8.NGC 0838: this galaxy is the northeast component of a complex pre-merging system with three components, one of which is a closely interacting galaxy pair formed by NGC 0833 and NGC 0835. A bright region lying within the MIR galaxy "core" is visible at both 15 and 33 GHz in NGC 0838. This region is also detected in the hard X-ray with Chandra (Torres-Albà et al. 2018), and lies to the south of the optical and IR peak, with a faint counterpart in the NIR as revealed by archival HST NICMOS images (11080, PI: D. Calzetti). The soft X-ray emission of this system is very extended, likely associated with wind from a starburst (Turner et al. 2001; Torres-Albà et al. 2018), which also shows up in our low-resolution C-configuration image. Given the above, here we tentatively classify this region as off-nuclear "SF." At matched resolution, detection at 33 GHz is poor (S/N < 5); therefore, the spectral index reported in Table 3 is an upper limit.
- 9.IC 0214: two regions are identified in this late-stage merger at both 15 and 33 GHz. The fainter region aligns with the optical and IR peak of the system, and the brighter region lies outside of the galaxy, with no visible IR or optical counterpart. No evidence for AGNs has been reported in the literature, and the high PAH 6.2 μm equivalent width measured with Spitzer indicates that this system is dominated by star formation, which is consistent with optical BPT diagnostics using VLT/MUSE (ID: 097.B-0427, PI: G. Privon). Therefore, here we classify the fainter region as the starburst-dominated nucleus. The bright extranuclear radio source does not have bright counterparts in the optical or IR; therefore, we tentatively classify this region as "Bg." We report its measured quantities in Tables 2 and 3 for completeness but exclude it from further analysis.
- 10.NGC 0877: due to the limited sensitivity of the A-configuration observations, we did not detect any 15 or 33 GHz emission in this pre-merging system.
- 11.NGC 0958: due to the limited sensitivity of the A-configuration observations, we did not detect any 15 or 33 GHz emission in this isolated galaxy.
- 12.NGC 1068: this well-studied isolated Seyfert 2 galaxy (e.g., Yuan et al. 2010) is the nearest LIRG in our sample. At both 15 and 33 GHz, three luminous nuclear regions are identified with Astrodendro. These regions are aligned almost linearly along the north–south direction, with the central region being the brightest at both 15 and 33 GHz. All three regions have been previously identified as radio jets associated with a highly obscured AGN, which is likely located within the southern region (e.g., Gallimore et al. 1996, 2004). Therefore, we have classified the southern region as "AGN," and the other two as "Jet."
- 13.UGC 02238: we detect one nuclear region in this late-stage merger at both 15 and 33 GHz. This bright region aligns with the optical and IR peak of the galaxy. This region is also detected in the soft and hard X-ray with Chandra, but a clear X-ray AGN signature was not found (Torres-Albà et al. 2018). The galaxy also does not show excess radio emission relative to FIR emission, as expected from radio AGNs (Condon et al. 1995). However, optical observations have classified this system as an LINER (Veilleux et al. 1995) or AGN/SB composite galaxy (Yuan et al. 2010). Given the above, we classify this nuclear region as "AGN/SBnuc."
- 14.UGC 02369: in this pair of early-stage mergers, we detect two nuclear regions that coincide with the optical and IR peaks of the two galaxies at both 15 and 33 GHz. The nucleus of the southern galaxy is detected in both the soft and hard X-ray with Chandra, and is classified as an AGN by Vardoulaki et al. (2015) based on the steep radio spectral index between 1.4 and 8.4 GHz. The northern nucleus is very faint in the X-ray and IR, with no reported signatures of AGNs. The entire interacting system has been classified as H ii (Veilleux et al. 1995) or AGN/SB composite system (Yuan et al. 2010) in the optical, and MIR diagnostics indicate that the system is dominated by star formation (Stierwalt et al. 2013; Inami et al. 2018). Given the above, we classify the southern nucleus as "AGN/SBnuc," and the northern nucleus as "SBnuc."
- 15.IRAS F03359+1523: we detect one bright nuclear region in this edge-on eastern component of a late-stage merger at both 15 and 33 GHz. This radio source is classified as an AGN/SB composite based on 1.4–8.4 GHz spectral index profile in Vardoulaki et al. (2015), but the galaxy is classified as starburst-dominated based on optical (Veilleux et al. 1995; Yuan et al. 2010) and MIR diagnostics (Inami et al. 2018). Observation with e-MERLIN at 5 GHz reveals compact continuum emission at the nucleus with a peak brightness temperature of 104.5 K (J. Molden 2022, private communication). Given the above, here we tentatively classify this region as "AGN/SBnuc."
- 16.CGCG 465–012: in this mid-stage merger, one bright extranuclear region is detected and identified at 15 GHz. No emission is detected at 33 GHz; therefore, we do not report measurements of this region in Table 3. This extranuclear region lies in the tidal tail of the merger and has a bright counterpart in the X-ray (Torres-Albà et al. 2018). We classify this region as extranuclear "SF" following Torres-Albà et al. (2018).
- 17.UGC 02982: due to the limited sensitivity of the A-configuration observations, we did not detect any 15 or 33 GHz emission in this late-stage merger.
- 18.ESO 550-IG025: we detect the two nuclei of this pair of pre-mergers at both 15 and 33 GHz. However, nuclear emission from the southern galaxy is much fainter and more diffuse and does not have good detection; therefore, we only report measurements for the nucleus of the northern galaxy in Tables 2 and 3. Both nuclei are detected in the X-ray with Chandra in Torres-Albà et al. (2018). While no clear signatures of AGN have been reported, both galaxies have been separately classified as an LINER/composite system by Veilleux et al. (1995) and Yuan et al. (2010) in the optical. Given the above, here we tentatively classify the identified nucleus of the northern component as "AGN/SBnuc."
- 19.NGC 1614: we detect 13 individual star-forming regions along the nuclear star-forming ring of this late-stage minor merger at native-resolution 33 GHz. At matched resolution, several smaller regions are blended together, resulting in a total of eight regions identified at both 15 and 33 GHz. A faint nucleus is visible at 33 GHz, but the detection is poor, and therefore not characterized in this work. The property of the nuclear star-forming ring has been studied at various wavelengths (e.g., Alonso-Herrero et al. 2001; König et al. 2013; Xu et al. 2015), and analysis of the ring based on radio data sets used in this work is presented in Song et al. (2021). Although this galaxy has been classified as an AGN/SB composite system in the optical (Yuan et al. 2010), deep VLBI observation has found no evidence for AGNs (Herrero-Illana et al. 2017), and the lack of molecular gas at the nucleus also excludes the possibility of a Compton-thick AGN (Xu et al. 2015). Following these studies, we classify all of these nuclear ring regions as off-nuclear "SF."
- 20.UGC 03094: we detect one nuclear region in this isolated spiral galaxy at both 15 and 33 GHz. This region aligns with the optical and IR peak of the galaxy center, and was detected in the ultrahard X-ray with SWIFT/BAT (Koss et al. 2013). While this galaxy does not show excess radio emission relative to FIR emission as expected for radio AGNs (Condon et al. 1995), fine-structure gas emission line [Ne v] 14.3 μm is clearly detected with Spitzer in this galaxy, which is a strong signature of AGN presence (Petric et al. 2011). Given the above, here we classify the identified radio nucleus as "AGN."
- 21.NGC 1797: this galaxy is in a pre-merging system IRAS F05053-0805, together with NGC 1799. We detected four nuclear regions at both 15 and 33 GHz, which are star-forming regions along a nuclear star-forming ring, whose diffuse emission is detected in C-configuration 33 and 15 GHz observations (Song et al. 2021). This galaxy is classified as a starburst galaxy in the optical (Veilleux et al. 1995; Yuan et al. 2010) and based on PAH 6.2 μm equivalent width (Stierwalt et al. 2013), with no emission detected at the center of the ring in our radio observations. We classify these four nuclear regions as off-nuclear "SF."
- 22.CGCG 468-002: in this mid-merging galaxy pair, we detect the nuclei of both galaxies at 15 and 33 GHz. Detection of hard X-ray emission with NuSTAR (Ricci et al. 2017) and [Ne v] 14.3 μm line emission with Spitzer (Petric et al. 2011) in the southwestern galaxy strongly suggests AGN presence, which is not detected in the eastern galaxy. Based on the PAH 6.2 μm equivalent width, the northeastern galaxy is dominated by star formation. Pereira-Santaella et al. (2015) classified the northeastern galaxy as an AGN/SB composite galaxy based on optical diagnostics. Because only the northeastern component is an LIRG, here we only report measurements of the northeastern nucleus, which we tentatively classify as "AGN/SBnuc."
- 23.IRAS F05187-1017: we detect one nuclear region in this isolated galaxy at both 15 and 33 GHz. This region coincides with with the optical and IR peak of the galaxy. This galaxy is classified as an LINER in the optical (Veilleux et al. 1995; Yuan et al. 2010) and the PAH 6.2 μm equivalent width indicates that both AGN and star formation could be contributing to the emission in this galaxy. Given the above, we classify the detected radio nucleus as "AGN/SBnuc."
- 24.IRAS 05442+1732: we detect five nuclear regions in this eastern-most component of a pre-merging system at both 15 and 33 GHz. This galaxy is likely dominated by star formation given the relatively high PAH 6.2 μm equivalent width (Stierwalt et al. 2013), and its IR SED agrees well with a pure starburst model (Dopita et al. 2011). These regions have counterparts in the NIR of various brightness based on comparison with archival high-resolution WFC3 F110W HST images (15241, PI: K. Larson; see Figure 14). Given the lack of evidence for AGNs, these regions are likely "SBnuc" and off-nuclear "SF." However, currently available ancillary information does not allow us to determine the precise nature of radio emission in these regions.
- 25.ESO 557-G002: we detect the nucleus of this northern component of a pre-merging galaxy pair at both 15 and 33 GHz. Detection at 33 GHz is poor (S/N < 5); therefore, we use the 15 GHz image to measure the properties of the detected nucleus, and the reported 15–33 GHz spectral index is an upper limit. Emission in this galaxy is dominated by star formation based on optical (Corbett et al. 2003) and MIR PAH 6.2 μm equivalent width (Stierwalt et al. 2013), and no clear signatures for AGNs have been reported. Therefore, here we tentatively classify this radio nucleus as "SBnuc."
- 26.IRAS F07251-0248: in this late-stage merger, we detect one nuclear region at 33 GHz. Observation at 15 GHz was severely affected by malfunction of the re-quantizer; therefore, we do not report matched-resolution measurements of this region in Table 3. This region lies within the optical and IR peak of the galaxy, and is detected in the soft X-ray with Chandra. This galaxy is classified as a "hard X-ray quiet (HXQ)" source by Iwasawa et al. (2009), and the X-ray emission may come from an obscured high-mass X-ray binary or AGN. The low PAH 6.2 μm equivalent width detected in this galaxy (Stierwalt et al. 2013) also indicates potential AGN presence. Given the above, we classify the radio nucleus as "AGN/SB nucleus."
- 27.MCG +02-20-003: in this northern component of a pre-merging system, we identify three radio regions at 33 GHz. Observation at 15 GHz was severely affected by malfunction of the re-quantizer; therefore, we do not report matched-resolution measurements of these regions in Table 3. These regions all coincide with the optical and IR peak of the galaxy, and lie within the elongated galaxy nucleus detected in Paα with HST NICMOS (10169, PI: A. Alonso-Herrero; Alonso-Herrero et al. 2009; Larson et al. 2020; see Figure 15). This galaxy is classified as an AGN/SB composite galaxy in the optical by Alonso-Herrero et al. (2009). While a low PAH 6.2 μm is detected (Stierwalt et al. 2013), Alonso-Herrero et al. (2012) did not find evidence for AGNs via IR spectral decomposition. Currently available ancillary information does not allow us to determine the precise nature of radio emission in these regions.
- 28.IRAS 09111-1007: due to the limited sensitivity of the A-configuration observation, we did not detect 33 GHz emission in this mid-stage merging galaxy pair. At 15 GHz, we detect three regions within the MIR peak of the eastern component, with the central region aligned with optical peak (see Figure 16). This galaxy was not classified as an X-ray AGN, but a strong SI xiii line was detected with Chandra (Iwasawa et al. 2011), which may come from a buried AGN. The [Ne v] 14.3 μm line is detected in the MIR on kiloparsec scales (Petric et al. 2011), and the system is classified as a Seyfert 2 or an LINER in the optical (Duc et al. 1997). Therefore, we classify the central region as "AGN," and the other two regions as "Ud" as we do not have sufficient information from other wavelengths to identify the nature of their radio emission.
- 29.Arp 303 (IC 0563/4): due to the limited sensitivity of the A-configuration observation, we did not detect 33 GHz emission in this pre-merging galaxy pair. Only the nucleus of the southern component (IC 0563) is detected at 15 GHz. The southern galaxy shows excess hard X-rays coming from an off-nuclear ULX region, which is possibly a background AGN. Given that no AGN evidence has been reported in this system, we classify the detected nucleus as "SBnuc."
- 30.NGC 3110: due to the limited sensitivity of the A-configuration observations, we did not detect emission in this late-stage merger at 33 or 15 GHz.
- 31.IRAS F10173+0828: we detect the nucleus of this galaxy in pre-merging stage at both 15 and 33 GHz. This nucleus is faint in the soft X-ray and is classified as an HXQ source by Iwasawa et al. (2009), potentially containing a Compton-thick AGN. Optical (Vardoulaki et al. 2015) and MIR diagnostics (Stierwalt et al. 2013) indicate a mixture of AGN- and SB-driven emission in this galaxy, which also hosts 26 OH mega-masers (Yu 2005). Vardoulaki et al. (2015) classified this galaxy as a radio AGN based on its negative 1.4–8.4 GHz spectral index, a signature for face-on AGNs with jets. Given the above, here we classify the nucleus as "AGN/SBnuc."
- 32.CGCG 011-076: we detect one nuclear region in this pre-merging galaxy at both 15 and 33 GHz. This region coincides with the optical and IR peak of the galaxy. While no clear evidence for AGN presence has been reported, its intermediate MIR PAH equivalent widths (Stierwalt et al. 2013; Yamada et al. 2013) indicate potential contribution from an AGN. Given the above, we classify the radio nucleus as "AGN/SBnuc."
- 33.IC 2810: we detect one nuclear and one extranuclear region in this northwestern component of a pre-merging galaxy pair at both 15 and 33 GHz. The fainter region aligns with the optical and IR peak of the galaxy, while the brighter region lies in the galaxy disk about 5'' south of the nucleus. Optical, MIR, and radio diagnostics all indicate a mixture of AGN- and SB-driven emission in the galaxy (Imanishi et al. 2010; Stierwalt et al. 2013; Vardoulaki et al. 2015); therefore, we classify the fainter region as "AGN/SBnuc," and the brighter region as extranuclear "SF."
- 34.IRAS F12112+0305: in this late-stage merger ULIRG, we detect the two nuclei of the north–south aligned galaxy pair at both 15 and 33 GHz, where the southern nucleus is about five times fainter than the northern nucleus. Both nuclei are detected with Chandra in the hard X-ray, but the northern nucleus is slightly fainter and has a softer spectrum than the southern nucleus (Iwasawa et al. 2011). Neither of the two nuclei was detected with NuSTAR, and analysis of the Chandra/XMM-Newton spectrum indicates no presence of AGNs (Ricci et al. 2021). While no clear AGN signatures are present, this system has been classified as a type-2 Seyfert in the optical (Yuan et al. 2010), and the southern nucleus is classified as an AGN/SB in the radio by Vardoulaki et al. (2015). Given the above, here we tentatively classify both nuclei as "AGN/SBnuc."
- 35.IRAS F12224-0624: in this isolated galaxy, we detect one nuclear region, at both 15 and 33 GHz, that coincides with the galaxy's optical and IR peak. The small equivalent width of PAH emission at both 6.2 and 3.3 μm strongly suggests AGN presence (Stierwalt et al. 2013; Yamada et al. 2013), and this galaxy has also been classified as a Seyfert 2 galaxy in the optical (Yuan et al. 2010). Therefore, here we classify the nucleus as "AGN."
- 36.NGC 4418: we detect one nuclear region in this isolated galaxy at both 15 and 33 GHz. This region coincides with the optical and IR peak of the galaxy, and the nature of this nucleus has been under active debate. While small equivalent widths of PAH emission at both 6.2 and 3.3 μm indicate AGN-dominated emission (Stierwalt et al. 2013; Yamada et al. 2013), this galaxy is not detected in the ultrahard X-ray (Koss et al. 2013; Ricci et al. 2021). The flat hard X-ray spectrum potentially points to a Compton-thick AGN (Maiolino et al. 2003), and VLBI observation at 5 GHz with European VLBI Network indicates that the nuclear radio emission in this galaxy comes from a mixture of AGNs and star formation (Varenius et al. 2014). Given the above, we classify this nucleus as "AGN/SBnuc."
- 37.CGCG 043-099: we detect three nuclear regions in this late-stage merger at 33 GHz at native resolution, two of which blend into one at 15–33 GHz matched resolution. All of these regions coincide with the IR and optical peak of the system, whose emission is dominated by star formation given the relatively large PAH 6.2 μm equivalent width. Optical studies have classified this system as a type-2 Seyfert (Toba et al. 2013), or a shock-dominated starburst (Rich et al. 2015). Archival HST/WFC3 F160W images (11235, PI: J. Surace) show an unresolved galactic nucleus that encompasses all radio regions (Figure 17). Given the late-merger stage, we are likely detecting the obscured double/triple nuclei of this system. However, currently available ancillary information does not allow us to determine the precise nature of radio emission in these regions.
- 38.MCG-02-33-098: we detect the nucleus of this western component of the early-stage merger IRAS F12596-1529 at both 15 and 33 GHz. Based on optical and MIR diagnostics (Veilleux et al. 1995; Yuan et al. 2010; Stierwalt et al. 2013), emission in this galaxy is dominated by star formation, and no AGN is detected in the ultrahard X-ray with Swift/BAT (Koss et al. 2013). Therefore, we classify this nucleus as an SB-dominated nucleus.
- 39.NGC5104: in this isolated galaxy, we detect one nuclear region at the location of the optical and IR peak of the galaxy at both 15 and 33 GHz. While no signatures of AGNs are present in the X-ray (Koss et al. 2013; Privon et al. 2020), this galaxy is classified as an LINER (Veilleux et al. 1995) or AGN/SB composite system (Yuan et al. 2010) in the optical, which is supported by an intermediate PAH 6.2 μm equivalent width (Stierwalt et al. 2013). Give the above, we classify the radio nucleus as "AGN/SBnuc."
- 40.MCG-03-34-064: in this southern component of a pre-merging galaxy pair, we detect four nuclear regions aligned linearly along the northeast–southwest direction in native-resolution 33 GHz image. At 15 and 33 GHz with matched resolutions, these four regions are blended together into one elongated region that lies within the IR and optical peak of the galaxy. Clear signatures of AGNs are present in the X-ray (Ricci et al. 2017; Torres-Albà et al. 2018), optical (Corbett et al. 2002), and MIR (Petric et al. 2011). This galaxy also shows significant radio excess relative to the radio-FIR correlation (Condon et al. 1995; Corbett et al. 2003). Therefore, the four linearly aligned regions we observe at native resolution are very likely AGN and radio jets, which is confirmed by the steep 15–33 GHz spectral index (<−0.9) measured at matched resolution. Although the precise location of the AGN is unclear from the currently available observations, the morphology of radio emission resembles commonly observed one-sided radio jets, with the brighter and more compact knots resulting from Doppler boosting effect from relativistic jets traveling close to the line of sight (e.g., Bridle & Perley 1984; Singal 2016). Given the above, we tentatively attribute the nuclear radio emission detected in this galaxy to radio "jets."
- 41.Arp 240 (NGC 5257/8): both the eastern and western components in this early-stage merger have been observed. We detect two regions in the western component NGC 5257, both at native and at matched resolutions. These two regions are about 12'' apart along the north–south direction, and the northern region coincides with the optical and IR peak of the galaxy, while the southern region lies at the tip of a spiral arm. This galaxy is classified as a starburst galaxy in the optical (Veilleux et al. 1995), MIR (Stierwalt et al. 2013), and radio (Vardoulaki et al. 2015); therefore, we classify the northern region as "SBnuc" and the southern region as extranuclear "SF." For the eastern component NGC 5258, we detect two extranuclear regions in one of the spiral arms, but only at 15 GHz due to limited sensitivity at 33 GHz. These two regions are classified as "SF."
- 42.NGC 5331: in this mid-merging galaxy pair, we only detect radio emission in the southern galaxy NGC 5331S given the sensitivity limits. At both 15 and 33 GHz, we identify seven regions in total in NGC 5331S, with six regions residing within the bulk of MIR emission at the galaxy center, and one region on the northern spiral arm. Comparison with high-resolution ALMA CO(J = 2–1) data (2017.1.00395.S, PI: T. Díaz-Santos) indicates that the nuclear radio knots lie along the edge of an inclined rotating nuclear disk. This galaxy is classified as a starburst galaxy in the optical (Wu et al. 1998), in agreement with a high PAH 6.2 μm equivalent width (Stierwalt et al. 2013), and no AGN is detected in the X-ray observation (Torres-Albà et al. 2018). Therefore, we classify the nuclear regions as off-nuclear "SF," and the region on the spiral arm as extranuclear "SF."
- 43.IRAS 14348-1447: in this late-stage merger, we detect the two nuclei of the southwest–northeast aligned merging galaxy pair at both 15 and 33 GHz. Both galaxies have been separately classified as LINERs (Veilleux et al. 1995) or AGN/SB composite galaxies (Yuan et al. 2010) in the optical, as well as in the radio (Vardoulaki et al. 2015). Both nuclei are detected in the X-ray with Chandra, but only the southwestern nucleus is bright in the hard X-ray with a spectrum consist with the model for buried AGNs (Iwasawa et al. 2011). Therefore, we classify the southern nucleus as "AGN," and the northern nucleus as "AGN/SBnuc."
- 44.CGCG 049-057: in this isolated galaxy, we detect one nuclear region at both 15 and 33 GHz. This region coincides with the optical and IR peak of the galaxy. While no AGN signatures are present based on IR and optical studies (e.g., Imanishi et al. 2010; Alonso-Herrero et al. 2012; Stierwalt et al. 2013), this galaxy likely contains a buried AGN based on X-ray (Torres-Albà et al. 2018) and radio (Baan & Klöckner 2006) analysis, which is supported by the high gas column density measured in the nucleus (Falstad et al. 2015). Therefore, we classify this nucleus as "AGN."
- 45.NGC 5936: in this isolated galaxy, we detect the nucleus at both 15 and 33 GHz. However, detection at 33 GHz is poor (S/N < 5), so we only report measurements at 15 GHz for this nucleus in Table 2, and its spectral index reported in Table 3 is an upper limit. This galaxy has a relatively large PAH 6.2 μm equivalent width, indicating SB-dominated emission, but it has been classified as an AGN/SB composite galaxy in the optical (Yuan et al. 2010; Alonso-Herrero et al. 2012). Given the above, we tentatively classify this nucleus as "AGN/SBnuc."
- 46.NGC 5990: we detect the nucleus of the bright southern component of this pre-merger at both 15 and 33 GHz. However, detection at 33 GHz is poor (S/N < 5), so we only report measurements at 15 GHz for this nucleus in Table 2, and its spectral index reported in Table 3 is an upper limit. While this galaxy does not show excess radio emission relative to FIR emission as expected for radio AGNs (Condon et al. 1995), it has been classified as a type-2 Seyfert in the optical (Yuan et al. 2010), and the [Ne v] 14.3 μm line is detected at the nucleus on kiloparsec scales (Petric et al. 2011), which is a clear signature of AGNs. Therefore, we classify this nucleus as "AGN."
- 47.IRAS F16164-0746: in this late-stage merger, at both 15 and 33 GHz, we detect a compact luminous nuclear region with faint elongated emission on its sides along the east–west direction and perpendicular to the galaxy's optical disk. Only emission on the west side of this region has strong enough detection to be characterized with Astrodendro, along with the bright region itself. Despite having a relatively large PAH 6.2 μm equivalent width (Stierwalt et al. 2013), this galaxy is classified as an AGN in the X-ray (Torres-Albà et al. 2018), and the [Ne v] 14.3 μm line is detected at the nucleus on kiloparsec scales (Petric et al. 2011), which is a clear signature for AGNs. It has also been classified as an LINER (Veilleux et al. 1995), or Seyfert 2 (Yuan et al. 2010) in the optical. The bright region coincides with the dynamical center of the molecular gas as revealed by ALMA (2017.1.00395.S, PI: T. Díaz-Santos); therefore, here we assume it to be the location of the AGN. The ALMA data also shows an edge-on rotating nuclear molecular disk, with the west side of the disk coinciding with the fainter elongated radio region, which has a relatively flat 15–33 GHz spectral index (∼−0.3). Therefore, here we tentatively classify this fainter region as off-nuclear "SF."
- 48.CGCG 052-037: in this isolated galaxy, multiple nuclear regions were detected at native resolutions, but only one region has a high enough S/N to be consistently identified with Astrodendro at both 15 and 33 GHz. No clear signatures of AGNs have been reported in the literature, and existing MIR studies classify this galaxy as a starburst galaxy (Imanishi et al. 2010; Stierwalt et al. 2013; Yamada et al. 2013). Therefore, this region is likely "SBnuc," or off-nuclear "SF." However, currently available information does not allow us to determine the nature of the radio emission.
- 49.IRAS F16399-0937N: in this late-stage interacting pair, we detect the northern nucleus at both 33 and 15 GHz. While no clear evidence for AGNs has been presented, a buried AGN possibly exists and is producing the OH megamaser observed in this system (Sales et al. 2015; Torres-Albà et al. 2018). Given the above, we classify this nucleus as "AGN/SBnuc."
- 50.NGC 6240: in this well-studied late-stage merger, we detect the two nuclei of the merging galaxy pair at both 15 and 33 GHz. This system has been classified as an LINER in the optical (Veilleux et al. 1995; Yuan et al. 2010). Despite having a relatively large PAH 6.2 μm equivalent width, MIR line diagnostics on kiloparsec scales indicate a strong presence of one or two buried AGNs (Armus et al. 2006). Analysis in the X-ray shows that both nuclei have clear AGN signatures (Iwasawa et al. 2011). These two active nuclei have also been resolved with radio VLBI (Gallimore et al. 2004). Therefore, here we classify these two nuclei as "AGN."
- 51.IRAS F16516-0948: in this late-stage merger, we detect two regions that lie outside of the MIR galaxy "core" at both 15 and 33 GHz. These two extranuclear radio-emitting regions were also identified by Herrero-Illana et al. (2017) at 8 GHz. However, only the region to the east has good enough detection to be identified by Astrodendro and only at 15 GHz; hence, we only report the 15 GHz measurements in Table 2, and the spectral indices reported in Table 3 are upper limits. This region lies outside the bulk of optical and 3.5 μm IR emission (Spitzer IRAS Channel 1), yet coincides with the peak of 8 μm IR emission (Spitzer IRAS Channel 4), as shown in Figure 18. While a relatively large PAH 6.2 μm equivalent width was measured in this system (Stierwalt et al. 2013), the measurement was performed centering on the optical peak of the system and misses the region we identify at 15 GHz, which may be a highly obscured nucleus or off-nuclear "SF." Currently available ancillary information does not allow us to determine the precise nature of radio emission in this region.
- 52.IRAS F17138-1017: in this late-stage merger, we detect five regions at both 15 and 33 GHz, four of which are aligned along the north–south direction following the bulk of the nuclear optical and IR emission in the galaxy. The northern-most region is at the location of the nucleus (Colina et al. 2015), and is also the brightest among all regions. Although this galaxy is detected in the hard X-ray with NuSTAR and Chandra, it is inconclusive from analysis of the X-ray spectra whether a buried AGN is present (Ricci et al. 2017; Torres-Albà et al. 2018). In the optical, this galaxy is classified as an AGN/SB composite galaxy (Yuan et al. 2010), while the PAH 6.2 μm equivalent width and NIR line diagnostics indicate that its nuclear emission is dominated by SF (Stierwalt et al. 2013; Colina et al. 2015). Give the above, we classify the northern-most region as "AGN/SBnuc," and the other four nuclear regions as off-nuclear "SF."
- 53.IRAS 17208-0014: in this late-stage merger, we detect three nuclear regions at native resolutions at both 15 and 33 GHz. These regions are aligned linearly along the east–west direction, and the western-most region appears much more luminous than the rest. At matched resolution, these regions are blended together into a larger elongated region at 15 and 33 GHz. Prominent shock features have been observed in this galaxy (Medling et al. 2015; Vivian et al. 2019), which has been attributed to star formation (Rich et al. 2015). While VLBI observations do not find compact radio cores indicative of AGN activity (Momjian et al. 2003b, 2006), the system has been classified as an AGN-starburst composite system in the optical (Yuan et al. 2010) and based on an intermediate 6.2 μm PAH equivalent width (Stierwalt et al. 2013). It has been argued in several studies that the system likely hosts buried AGNs (e.g., Iwasawa et al. 2011; Falstad et al. 2021; Baba et al. 2022). The brightest region on the west is located at the dynamical center of the molecular gas as revealed by ALMA (2018.1.00486.S, PI: M. Pereira-Santaella). This region and the faint radio region on the east coincide with the locations of the merging dual nuclear disks revealed in milliarcsecond-resolution Keck observations (Medling et al. 2015). Therefore, we classify these two regions as "AGN/SBnuc." The other faint region in between may be associated with shock or clumpy star formation in one of the nuclear disks, but currently available information is not sufficient to clearly identify its nature. Figure 19 shows the HST image of the galaxy along with VLA radio continuum images of the nuclear regions studied in this work.
- 54.IRAS 17578-0400: in the northern component of this early-stage merging galaxy triplet, we detect one nuclear region at both 15 and 33 GHz. This region aligns with the optical and IR peak of this galaxy. This galaxy is not detected in the ultrahard X-ray with SWIFT/BAT (Koss et al. 2013), and it has a large PAH 6.2 μm equivalent width (Stierwalt et al. 2013), indicating SB-dominated emission, which is also consistent with the optical classification (Rich et al. 2015). However, this galaxy may host a highly embedded AGN (Falstad et al. 2021). Therefore, we tentatively classify this nucleus as "AGN/SBnuc."
- 55.IRAS 18090+0130W: we detect two nuclear regions and one extranuclear region in this western component of an early-stage merger at both 15 and 33 GHz. However, the detection at 33 GHz is poor (S/N < 5); therefore, we only report measurements made at 15 GHz in Table 2, and the derived spectral indices reported in Table 3 are upper limits. The two nuclear regions lie close to each other, and both are located at the IR and optical peak of the galaxy. Archival HST 132N image (ID: 14095, PI: G. Brammer) shows an unresolved galactic nucleus encompassing the radio regions we detect, as shown in Figure 20. This galaxy is not detected in the X-ray with Chandra or SWIFT/BAT (Koss et al. 2013; Torres-Albà et al. 2018), but an intermediate PAH 6.2 μm equivalent width (Stierwalt et al. 2013) indicates that the emission in this galaxy may be partially driven by AGNs. Therefore, the two nuclear regions that we detect are likely the AGN/SB nucleus and an off-nuclear SF region or a radio jet. However, currently available ancillary information does not allow us to determine the precise nature of radio emission in these two nuclear regions.
- 56.IRAS F19297-0406: we detect the nucleus of this late-stage merger at both 15 and 33 GHz. This galaxy is detected in both the soft and hard X-ray with Chandra, and Iwasawa et al. (2009) classified it as an HXQ, and it may contain a buried AGN. Optical and MIR diagnostics all point to an AGN/SB composite system (Yuan et al. 2010; Stierwalt et al. 2013). Therefore we classify this nucleus as "AGN/SBnuc."
- 57.IRAS 19542+1110: in this isolated galaxy, we detect its nucleus at both 15 and 33 GHz. While MIR diagnostics do not clearly identify AGN signatures (Imanishi et al. 2010; Stierwalt et al. 2013), this galaxy is compact and bright in the hard X-ray and has a very steep spectrum and hence was classified as an AGN by Iwasawa et al. (2011). AGN signatures were not detected in the optical (Fluetsch et al. 2020). Therefore, here we classify this nucleus as "AGN/SBnuc."
- 58.NGC 6926: we detect the nucleus of this late-stage merger at both 15 and 33 GHz. This galaxy is an optical type-2 Seyfert (Veilleux et al. 1995; Yuan et al. 2010), and has a clear detection of the [Ne v] 14.3 μm line at the nucleus on kiloparsec scales, which is a clear signature of AGN presence. Therefore, we classify this nucleus as "AGN."
- 59.II Zw 096: in this mid-stage merger, we detect one region at both 15 and 33 GHz. This region coincides with the site of an extremely obscured off-nuclear starburst that is responsible for 70% of the IR luminosity of this system (Inami et al. 2010), which also has the hardest X-ray spectrum among all X-ray sources detected in this system due to the obscuration (Iwasawa et al. 2011). Here we tentatively classify this region as an extranuclear "SF" following Inami et al. (2010). We note that while VLBI observations of the OH megamaser in this region have suggested that it may host an obscured AGN (Migenes et al. 2011), recent multifrequency analysis of the radio spectrum shows that it is well described by pure star formation (Wu et al. 2022).
- 60.ESO 602-G025: in this isolated galaxy, we detect its nucleus at both 15 and 33 GHz. However, detection at 33 GHz is poor; therefore, we report the 15 GHz measurements instead in Table 2, and its spectral index reported in Table 3 is highly uncertain. Both MIR and optical diagnostics point to an AGN/SB composite scenario (Yuan et al. 2010; Stierwalt et al. 2013; Yamada et al. 2013); therefore, we classify this nucleus as "AGN/SBnuc."
- 61.IRAS F22491-1808: we detect the eastern nucleus of this late-stage merger at both 33 and 15 GHz. This nucleus is detected in both the soft and hard X-ray with Chandra, and is classified as an HXQ by Iwasawa et al. (2011), which may contain a buried AGN. This system is classified as SB-dominated in the optical (Veilleux et al. 1995; Yuan et al. 2010), but MIR diagnostics indicate potential AGN contribution to the emission (Stierwalt et al. 2013). Given the above, we classify this nucleus as "AGN/SBnuc."
- 62.NGC 7469: in this southern component of a pre-merging galaxy pair, we detect its nucleus at both 15 and 33 GHz. This galaxy does not show excess radio emission relative to FIR emission, as expected for radio AGNs (Condon et al. 1995), but it is a well-studied optical Seyfert 1 galaxy (e.g., Veilleux et al. 1995; Yuan et al. 2010), and the [Ne v] 14.3 μm line is clearly detected at its nucleus on kiloparsec scales (Petric et al. 2011). Therefore, we classify the detected radio nucleus as "AGN."
- 63.CGCG 453-062: in this isolated galaxy, we detect the nucleus at both 33 and 15 GHz. While MIR diagnostics point to an SB-dominated scenario (Imanishi et al. 2010; Stierwalt et al. 2013; Yamada et al. 2013), this galaxy has been classified as an LINER (Veilleux et al. 1995) or Seyfert 2 (Yuan et al. 2010) in the optical, and strong [Ne v] 14.3 μm line emission has been detected at the nuclear position at kiloparsec scales (Petric et al. 2011). Therefore, we classify this nucleus as an "AGN."
- 64.NGC 7591: in this isolated galaxy, we detect a nuclear star-forming ring at both 33 and 15 GHz. The nucleus and six individual star-forming regions along the ring are resolved only at 15 GHz at native resolution, and analysis of these regions is presented in Song et al. (2021). This ring has also been detected and studied in NIR hydrogen recombination lines by Larson et al. (2020). For consistency, here we mainly use the 33 GHz measurements for our analysis. At 33 GHz, the circumnuclear ring was observed at lower resolution (i.e., B-configuration), and three distinct regions were identified by Astrodendro, which we classify as off-nuclear "SF."
- 65.NGC 7592: in this early-stage merging galaxy triplet, we detect the nuclei of the eastern and western components at both 15 and 33 GHz. While the [Ne v] 14.3 μm line is clearly detected for the entire unresolved system with Spitzer (Petric et al. 2011), only the western galaxy is classified as a Seyfert 2 in the optical (Veilleux et al. 1995; Yuan et al. 2010), which also shows compact emission in the X-ray with hard X-ray excess (Torres-Albà et al. 2018) and MIR AGN signatures (Imanishi et al. 2010). The eastern component is classified as a starburst galaxy in the optical (Veilleux et al. 1995; Yuan et al. 2010), and no AGN signatures have been identified in the X-ray or MIR (Imanishi et al. 2010; Stierwalt et al. 2013; Torres-Albà et al. 2018). Therefore, here we classify the eastern nucleus as "SBnuc," and the western nucleus as an "AGN."
- 66.NGC 7674: in this western component of a pre-merging galaxy pair, we detect four nuclear regions at both 33 and 15 GHz. These regions are aligned almost linearly along the east–west direction. This galaxy is detected with NuSTAR (Gandhi et al. 2017) and classified as a Seyfert 2 in the optical (Veilleux et al. 1995; Yuan et al. 2010), with a strong detection of the [Ne v] 14.3 μm line (Petric et al. 2011) and small PAH equivalent widths (Imanishi et al. 2010; Stierwalt et al. 2013). This galaxy also shows excess radio emission relative to FIR emission, as expected from radio AGNs (Condon et al. 1995). Using VLBI, Momjian et al. (2003a) also concluded that the nuclear radio continuum emission is most likely all associated with AGN activity and that the AGN itself is located in between the brightest two radio components. At 15 and 33 GHz, we detect a faint region in between the two brightest radio continuum sources that were observed by Momjian et al. (2003a), and this is the only region that shows a flat 15–33 GHz spectral index (α ∼ −0.35) among all four regions, which likely marks the location of the AGN. Therefore, we classify this faint region as "AGN," and the others as "Jet."
- 67.NGC 7679: in this pre-merging galaxy, we detect one nuclear region and one extranuclear region at 15 and 33 GHz. The nuclear region coincides with the optical and IR peak of the galaxy. Observations in the X-ray revealed that this galaxy hosts an unobscured AGN (Della Ceca et al. 2001), while it is classified as a Seyfert 2 in the optical (Veilleux et al. 1995; Yuan et al. 2010). Although the large PAH 6.2 μm equivalent width (Stierwalt et al. 2013) indicates that this galaxy is dominated by star formation, the [Ne v] 14.3 μm line is clearly detected at the nucleus on kiloparsec scales (Petric et al. 2011), supporting the optical and X-ray classification. Therefore, we classify the nuclear region as "AGN," and the extranuclear region as extranuclear "SF."
- 68.MCG -01-60-022: We did not detect any radio continuum emission in this pre-merging galaxy due to incorrect pointing setup.

Figure 14. IRAS 05442+1732. Left: archival HST 110W image, displayed in arcsinh stretch with bilinear interpolation. The yellow square outlines the field of view of the 33GHz VLA continuum. Middle: 33 GHz VLA continuum observed with the B-configuration. Right: 15 GHz VLA continuum observed with the A-configuration.
Download figure:
Standard image High-resolution image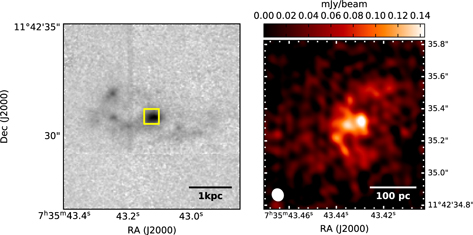
Figure 15. MCG +02-20-003. HST Paα image (left), displayed in arcsinh stretch with bilinear interpolation. The yellow square outlines the field of view of the 33 GHz VLA continuum observed with the B-configuration (right), showing bright clumpy nuclear star-forming structures.
Download figure:
Standard image High-resolution image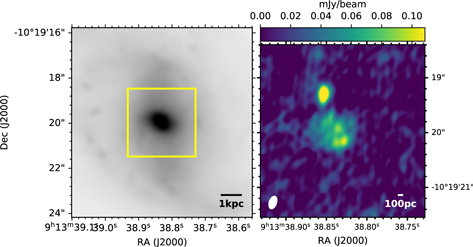
Figure 16. IRAS 09111-10. Left: archival HST 160W image, displayed in arcsinh stretch with bilinear interpolation. Right: 15 GHz VLA continuum observed with the A-configuration.
Download figure:
Standard image High-resolution image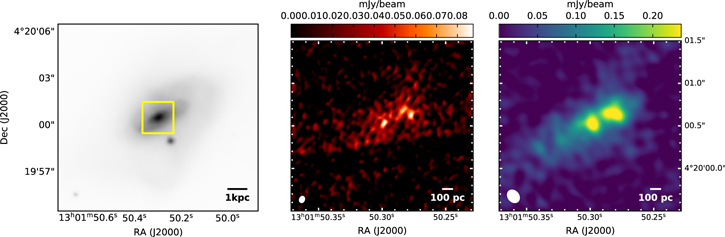
Figure 17. CGCG 043-099. Left: archival HST 160W image, displayed in arcsinh stretch with bilinear interpolation. Middle: 33 GHz VLA continuum observed with the A-configuration. Right: 15 GHz VLA continuum observed with the A-configuration.
Download figure:
Standard image High-resolution image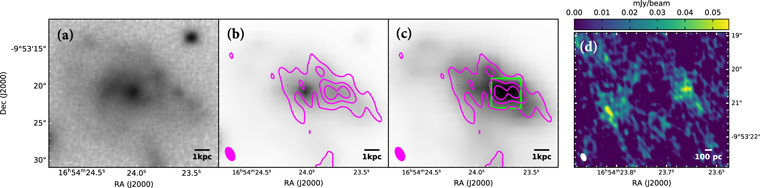
Figure 18. IRAS F16516-0948. (a): Pan-STARRS1 y-band image, displayed in arcsinh stretch with bilinear interpolation. (b): Spitzer channel 1 image, overlaid with 33 GHz VLA continuum (magenta contours) observed with the C-configuration (beam shown on the lower left in magenta). (c): the same as panel (b) but on the Spitzer channel 4 image. The lime square outlines the field of view of the 15 GHz VLA continuum. (d): 15 GHz VLA continuum observed with the A-configuration.
Download figure:
Standard image High-resolution image
Figure 19. IRAS 17208-0014. Left: HST/NICMOS F160W image, displayed in arcsinh stretch with bilinear interpolation. The yellow square outlines the field of view of the 33 GHz VLA continuum. Middle: 33 GHz VLA continuum observed with the A-configuration (beam shown on the lower left in white). Right: 15 GHz VLA continuum observed with the A-configuration.
Download figure:
Standard image High-resolution image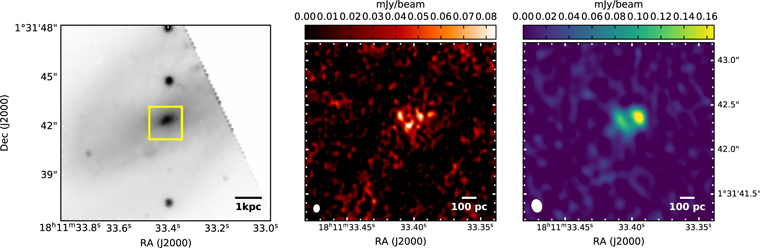
Figure 20. IRAS 18090+0130. HST F132N image (left), displayed in arcsinh stretch with bilinear interpolation. The yellow square outlines the field of view of the 33 GHz (middle) and 15 GHz (right) VLA continuum observed with the A-configuration, showing at least two radio components of undetermined nature.
Download figure:
Standard image High-resolution image
Table A1. VLA 15 and 33 GHz Observations
| ID | Project Code |

| P.A.33GHz |

|

| P.A.15 GHz |

|
|---|---|---|---|---|---|---|---|
| (deg) | (μJy bm−1) | (deg) | (μJy bm−1) | ||||
| 1 | 14A−471 | 014 × 006 | −41 | 21.5 | 017 × 011 | −6 | 21.3 |
| 2 | 14A−471 | 014 × 006 | −40 | 20.9 | 019 × 012 | −7 | 11.6 |
| 3 | 20A−401,14A−471 | 028 × 018 | 16 | 8.0 | 019 × 010 | −15 | 13.6 |
| 4 | 20A−401,14A−471 | 028 × 019 | −15 | 6.0 | 022 × 013 | −15 | 11.7 |
| 5 | 14A−471 | 009 × 006 | −41 | 16.0 | 014 × 012 | 42 | 15.6 |
| 6 | 14A−471 | 016 × 005 | −43 | 21.3 | 016 × 013 | −7 | 12.9 |
| 7 | 14A−471 | 008 × 005 | −44 | 18.4 | 011 × 010 | −18 | 13.2 |
| 8 | 14A−471 | 020 × 006 | −43 | 18.9 | 020 × 012 | −26 | 12.3 |
| 9 | 14A−471 | 011 × 005 | −48 | 16.6 | 014 × 011 | −39 | 13.6 |
| 10 | 14A−471 | 011 × 006 | −42 | 14.5 | 013 × 012 | −28 | 11.4 |
| 11 | 14A−471, 16A−204 | 012 × 006 | 1 | 11.5 | 018 × 014 | 14 | 8.6 |
| 12 | 14A−471 | 010 × 006 | 1 | 35.3 | 014 × 011 | 12 | 120.0 |
| 13 | 16A−204, 20A−401 | 024 × 018 | −65 | 5.2 | 016 × 014 | 15 | 10.4 |
| 14 | 14A−471, 16A−204 | 009 × 006 | −6 | 11.7 | 013 × 011 | 8 | 9.9 |
| 15 | 14A−471 | 009 × 006 | 12 | 15.8 | 013 × 011 | −174 | 9.4 |
| 16 | 14A−471, 16A−204 | 010 × 007 | 7 | 15.3 | 013 × 011 | 0 | 9.8 |
| 17 | 14A−471, 16A−204 | 010 × 006 | 12 | 12.2 | 013 × 011 | 5 | 9.7 |
| 18 | 14A−471, 16A−204 | 015 × 007 | 12 | 13.7 | 022 × 012 | −5 | 11.2 |
| 19 | 14A−471, 16A−204 | 012 × 006 | 16 | 13.7 | 017 × 011 | 0 | 15.1 |
| 20 | 14A−471 | 007 × 007 | 58 | 15.0 | 013 × 011 | 8 | 10.4 |
| 21 | 14A−471, 20A−401 | 027 × 019 | −34 | 4.0 | 016 × 011 | 13 | 10.4 |
| 22 | 14A−471 | 008 × 006 | 63 | 15.3 | 014 × 013 | −3 | 13.0 |
| 23 | 14A−471 | 010 × 006 | 33 | 19.3 | 018 × 013 | 17 | 11.5 |
| 24 | 14A−471, 20A−401 | 027 × 018 | −69 | 7.2 | 013 × 011 | −178 | 10.6 |
| 25 | 14A−471 | 015 × 006 | 29 | 23.9 | 019 × 010 | −2 | 12.7 |
| 26 | 14A−471, 20B−313 | 008 × 006 | 6 | 17.8 | 015 × 011 | −5 | 13.9 |
| 27 | 14A−471, 20B−313 | 008 × 007 | 24 | 17.8 | 014 × 011 | −10 | 9.8 |
| 28 | 14A−471, 20B−313 | 010 × 007 | −12 | 16.4 | 024 × 013 | −19 | 11.2 |
| 29 | 14A−471, 20B−313 | 008 × 007 | −17 | 15.5 | 019 × 013 | −22 | 11.4 |
| 30 | 14A−471, 20B−313 | 009 × 006 | −13 | 17.5 | 023 × 013 | −25 | 11.8 |
| 31 | 14A−471, 20B−313 | 007 × 006 | −15 | 16.5 | 014 × 011 | −24 | 15.9 |
| 32 | 14A−471 | 008 × 006 | −11 | 12.1 | 028 × 013 | 47 | 19.3 |
| 33 | 14A−471, 20B−313 | 007 × 006 | −37 | 17.0 | 015 × 012 | −41 | 13.5 |
| 34 | 14A−471 | 007 × 006 | −20 | 12.0 | 018 × 013 | 48 | 11.8 |
| 35 | 14A−471 | 009 × 006 | −28 | 15.6 | 020 × 012 | 33 | 11.4 |
| 36 | 14A−471 | 008 × 006 | −19 | 20.6 | 019 × 013 | 41 | 27.4 |
| 37 | 14A−471 | 008 × 006 | −22 | 12.8 | 016 × 013 | 40 | 11.3 |
| 38 | 14A−471 | 010 × 006 | −16 | 14.9 | 025 × 012 | 31 | 14.5 |
| 39 | 14A−471, 20A−401 | 025 × 017 | −42 | 7.3 | 014 × 012 | 11 | 11.9 |
| 40 | 14A−471 | 010 × 006 | −14 | 12.9 | 026 × 012 | 31 | 11.1 |
| 41 | 14A−471 | 008 × 006 | 18 | 13.4 | 014 × 011 | 14 | 9.7 |
| 41 | 14A−471 | 008 × 006 | 18 | 13.3 | 014 × 011 | 14 | 9.7 |
| 42 | 14A−471, 20A−401 | 021 × 018 | 63 | 6.2 | 014 × 011 | 11 | 9.8 |
| 43 | 14A–471 | 011 × 006 | −26 | 18.4 | 021 × 012 | 16 | 13.5 |
| 44 | 14A−471 | 007 × 006 | 0 | 31.1 | 013 × 011 | −7 | 55.2 |
| 45 | 14A−471 | 008 × 006 | −7 | 15.0 | 013 × 011 | −7 | 10.2 |
| 46 | 14A−471 | 008 × 006 | −1 | 13.5 | 014 × 011 | −8 | 10.0 |
| 47 | 14A−471 | 008 × 006 | −1 | 15.4 | 016 × 011 | −12 | 19.3 |
| 48 | 14A−471, 20A−401 | 020 × 018 | 51 | 9.1 | 014 × 011 | −10 | 9.8 |
| 49 | 14A−471 | 008 × 006 | −1 | 16.1 | 017 × 011 | −14 | 14.0 |
| 50 | 14A−471 | 007 × 006 | 0 | 28.7 | 014 × 011 | −13 | 54.7 |
| 51 | 14A−471 | 009 × 006 | 11 | 16.6 | 023 × 014 | 26 | 10.0 |
| 52 | 14A−471, 20A−401 | 027 × 018 | 31 | 9.8 | 019 × 011 | 23 | 10.3 |
| 53 | 14A−471 | 007 × 006 | 9 | 24.9 | 016 × 011 | 26 | 11.7 |
| 54 | 14A−471 | 008 × 007 | −48 | 24.6 | 015 × 011 | 16 | 11.4 |
| 55 | 14A−471, 16A−204 | 008 × 006 | −2 | 16.7 | 014 × 011 | 15 | 10.9 |
| 56 | 14A−471 | 008 × 006 | −11 | 16.4 | 015 × 011 | −1 | 10.1 |
| 57 | 14A−471 | 007 × 006 | −9 | 16.5 | 015 × 013 | −11 | 11.4 |
| 58 | 14A−471 | 008 × 006 | −19 | 16.1 | 018 × 011 | −7 | 11.5 |
| 59 | 14A−471 | 007 × 006 | −37 | 17.1 | 016 × 013 | 60 | 10.2 |
| 60 | 14A−471 | 012 × 005 | −29 | 20.4 | 021 × 011 | −12 | 9.8 |
| 61 | 14A−471 | 012 × 005 | −31 | 20.9 | 021 × 011 | −15 | 9.2 |
| 62 | 14A−471 | 009 × 006 | −27 | 20.7 | 013 × 012 | −5 | 9.3 |
| 63 | 14A−471 | 007 × 006 | −37 | 17.9 | 012 × 011 | −31 | 10.8 |
| 64 | 14A−471, 20A−401 | 030 × 017 | 55 | 7.9 | 013 × 011 | −18 | 9.3 |
| 65 | 14A−471 | 009 × 006 | −23 | 19.0 | 015 × 011 | −19 | 9.9 |
| 66 | 14A−471 | 008 × 005 | −34 | 20.8 | 013 × 011 | −19 | 12.2 |
| 67 | 14A−471 | 009 × 006 | −26 | 17.7 | 013 × 011 | −13 | 9.3 |
| 68 | 14A−471 | 009 × 006 | −23 | 15.7 | 015 × 011 | −12 | 9.9 |
Note. All observations were taken with the VLA in the A-configuration except for Ka-band observations carried out in project 20A–401, which used the B-configuration instead. For each image, the σrms is measured in an emission-free region before primary-beam correction. θM×m are the synthesized beam FWHM (major × minor) for the native-resolution images produced following the procedures described in Section 2.
Table A2. Sample AGN Classification
| ID | X-Ray | Optical | MIR | Radio | Reference (X-Ray/Optical/MIR/Radio) | Adopted |
|---|---|---|---|---|---|---|
| (1) | (2) | (3) | (4) | (5) | (6) | (7) |
| 1 | Y | Y | N, M, M | Y | T18/V95,Y10/I10, S13, I18/V15 | Y |
| 2 | N | N | N* | ⋯ | R17/V95,Y10/I10, S13, I18/- | N |
| 3 | M | N | N, M | N, Y, Y | G06, G20/V95,Y10/I10, S13/C95, V15, I13 | M |
| 4 | N | N,M | N | ⋯ | K13/V95,Y10/I10, S13, I18/- | M |
| 5 | N | M | N, M | M | T18/V08/I10, S13/V15 | M |
| 6 | M | M | M, Y | M | I11/V95,Y10/S13, I18/V15 | M |
| 7 | N,M | N | N* | M | G09, TA18/V95,Y10/I18/PC | M |
| 8 | N | N | N | ⋯ | T18,T01/T01/S13/- | N |
| 9 | N | N | N | ⋯ | K13/PC/S13/- | N |
| 12 | Y | Y | Y | Y | T18/V95,Y10/P11/G96 | Y |
| 13 | N | M | N | N | T18/V95,Y10/I10, S13, I18/C95 | M |
| 14 | N | N,M | N* | Y(S) | T18/V95,Y10/S13, I18/V15 | M(S), N(N) |
| 15 | N | N | N | M | T18/V95,Y10/I10, I18/V15, PC | M |
| 18 | N | M | ⋯ | Y(S), M(N) | T18/V95,Y10/-/V15 | M(S), M(N) |
| 19 | N | M | N | N | T18/V95,Y10/I10, S13, I18/H17 | N |
| 20 | Y | ⋯ | Y, M | ⋯ | K13/-/P11, S13/C95 | Y |
| 21 | N | N | N | ⋯ | K13/V95,Y10/S13/- | N |
| 22 | N | M | N | ⋯ | R17/P15/S13/- | M |
| 23 | N | M | M | ⋯ | K13/V95,Y10/S13/- | M |
| 24 | ⋯ | ⋯ | N | ⋯ | −/-/S13/- | N |
| 25 | N | N | N | ⋯ | K13/C03/S13/- | N |
| 26 | M | ⋯ | Y | ⋯ | I09, I11/-/S13/- | M |
| 27 | N | M | Y, N | ⋯ | K13/A09/S13, A12/- | M |
| 31 | M | M | N, M, N | Y | I09, I11/V15/I10, S13, I18/V15 | M |
| 32 | ⋯ | ⋯ | M | ⋯ | −/-/S13/- | M |
| 33 | N | M | Y, N | M | T18/V08,V15/I10, S13/V15 | M |
| 34 | M | Y* | M* | N(N), M(S) | I09, I11/V95,Y10/S13/V15 | M |
| 35 | N | Y | Y | ⋯ | K13/V95,Y10/I10, S13, Y13/- | Y |
| 36 | N | ⋯ | Y | M | K13, R21/-/I10, S13, Y13/V13 | M |
| 37 | N | Y, N | N | ⋯ | T18/T13, R15/S13/- | M |
| 38 | N | N | N | ⋯ | K13/V95,Y10/S13/- | N |
| 39 | N | M | M | ⋯ | K13,P20/V95,Y10/S13/- | M |
| 40 | Y | Y | Y | Y | R17, T18/R93/P11, S13/C95, C03 | Y |
| 41 | N | N | N | N | K13/V95/S13/V15 | N |
| 42 | N | N | N | ⋯ | T18/W98/S13/- | N |
| 43 | Y(SW), N(NE) | M | Y* | M | I11/V95,Y10/I10, S13/V15 | Y(SW), M(NE) |
| 44 | Y | N, M | N, M | Y | T18/V95,A12/I10, S13/BK06, F15 | Y |
| 45 | N | N, M | N | ⋯ | K13/V95,Y10/S13/- | M |
| 46 | N | Y | Y | N | K13/Y10/P11, S13/C95 | Y |
| 47 | Y | M, Y | Y, N | ⋯ | T18/V95,Y10/P11, S13/- | Y |
| 48 | ⋯ | ⋯ | N | ⋯ | −/-/I10, S13, Y13/- | M |
| 49 | M | M | M | N | T18/Y10, R15/S13/BK06 | M |
| 50 | Y | M | Y*, M* | Y | I11/V95,Y10/A06, S13/G04 | Y |
| 51 | ⋯ | ⋯ | N | N | −/-/S13/C02 | N |
| 52 | M | M | N | ⋯ | R17, T18/Y10/S13, C15/- | M |
| 53 | M | M, N | M | ⋯ | I11/Y10, R15/S13, M15/- | M |
| 54 | N | N | N | M | K13/R15/S13/F21 | M |
| 55 | N | ⋯ | M | ⋯ | T18/-/S13/- | M |
| 56 | M | N, M | M | ⋯ | I11/V95,Y10/S13/- | M |
| 57 | Y | N | N,M | ⋯ | I11/F20/I10, S13/- | M |
| 58 | Y | Y | Y, M | ⋯ | K13/V95,Y10/P11, S13/- | Y |
| 60 | N | M | M | ⋯ | K13/V95,Y10/S13, Y13/- | M |
| 61 | N | N | N, M | ⋯ | I11/V95,Y10/I10, S13/- | M |
| 62 | Y | Y | Y | N | B86/V95,Y10/I10, S13, Y13/C95 | Y |
| 63 | ⋯ | M, Y | Y | ⋯ | −/V95,Y10/P11/- | Y |
| 65 | Y(W), N(E) | Y(W), N(E) | Y(W), N(E) | ⋯ | T18/V95,Y10/I10, P11/- | Y(W), N(E) |
| 66 | Y | Y | Y | Y | K13,G17/V95,Y10/P11, S13, I13/M03, K17 | Y |
| 67 | Y | Y | Y, N | ⋯ | D01,K13/V95,Y10/P11, S13/- | Y |
Note. Column (1): Identifier for each IRAS system matched with Table 1. Column (2): Whether any AGN has been detected in the X-ray (i.e., ultrahard X-ray detection, HR, Fe line detection) where Y = Yes, N = No, and M = Maybe (i.e., analysis is unable to identify the origin of X-ray emission). Column (3): Whether any AGN has been detected in the system at optical wavelengths via optical line ratios (i.e., BPT diagram). We consider "LINER" to be potentially hosting an AGN (i.e., classified as "M"). Column (4): Whether any AGN has been detected via MIR diagnostics (i.e., 6.2 μm PAH equivalent width, 15–30 μm spectral slope, and [Ne v] 14.3 μm line detection). Column (5): Whether any AGN has been detected in the radio. For columns (2)–(5): if AGN classifications from multiple studies conducted at the same wavelength range disagree, the classification from individual studies is presented, separated by a comma. Column (6): Coded references for AGN identification in the X-ray/optical/MIR/radio. See the end of the table caption for full references. Column (7): Adopted AGN classification in this study. If an AGN has been identified in at least two different wavelength ranges, then we consider the system as an AGN host in this work (i.e., labeled as Y = Yes); if evidence for an AGN is identified at only one wavelength range (Y or M), or if evidence is ambiguous at all wavelengths, then we consider the system as a potential AGN host (i.e., classified as M = Maybe). If no AGN evidence is currently identified at any wavelength ranges, we do not consider the system an AGN host (i.e., classified as N = No). Note that * indicates classification for the entire IRAS system instead of individual galaxy components.
References. PC: private communication, A06 (Armus et al. 2006), A09 (Alonso-Herrero et al. 2009), A12 (Alonso-Herrero et al. 2012), B86 (Barr 1986), BK06 (Baan & Klöckner 2006), C02 (Corbett et al. 2002), C03 (Corbett et al. 2003), C15 (Colina et al. 2015), C95 (Condon et al. 1995) D01 (Della Ceca et al. 2001), F15 (Falstad et al. 2015), F20 (Fluetsch et al. 2020), F21 (Falstad et al. 2021), G04 (Gallimore et al. 2004), G06 (Grimes et al. 2006), G09 (González-Martín et al. 2009), G17 (Gandhi et al. 2017), G20 (Garofali et al. 2020), G96 (Gallimore et al. 1996), H17 (Herrero-Illana et al. 2017), I09 (Iwasawa et al. 2009), I10 (Imanishi et al. 2010), I11 (Iwasawa et al. 2011), I13 (Iono et al. 2013), I18 (Inami et al. 2018), K13 (Koss et al. 2013), K17 (Kharb et al. 2017), M03 (Momjian et al. 2003a), M15 (Medling et al. 2015), P10 (Petric et al. 2011), P15 (Pereira-Santaella et al. 2015), P20 (Privon et al. 2020), R15 (Rich et al. 2015), R17 (Ricci et al. 2017), R21 (Ricci et al. 2021), R93 (Rush et al. 1993), S13 (Stierwalt et al. 2013), T01 (Turner et al. 2001), T13 (Toba et al. 2013), T18 (Torres-Albà et al. 2018), V08 (Vega et al. 2008), V14 (Varenius et al. 2014), V15 (Vardoulaki et al. 2015), V95 (Veilleux et al. 1995), W98 (Wu et al. 1998), Y10 (Yuan et al. 2010), Y13 (Yamada et al. 2013).
Appendix B: Analysis Result for Ancillary VLA Data
Images from BM17 and SFRS (see Section 2.3) were reanalyzed following methods described in Section 3. Five of the 22 systems in BM17 are also in the GOALS-ES sample, and emission in two other systems is resolved out in the A- or B-configuration); therefore, we only include results derived for 26 regions in 15 systems from BM17 to complement our discussions in Section 5. These regions are classified into seven "AGN," 10 "AGN/SBnuc," six "SF," two "Ud," and one "Bg," using procedures described in Section 4.1. Regions classified as "Ud" and "Bg" were further removed from comparison. One galaxy in the SFRS, NGC 2146, is an LIRG included in the full GOALS sample (Armus et al. 2009), and hence was also excluded from reanalysis and comparison to the GOALS-ES results. A total of 187 regions are identified and characterized at both 15 and 33 GHz in 35 SFRS galaxies, but we remove 58 regions identified as AGNs, background galaxies, and Anomalous Microwave Emission candidates by Linden et al. (2020) from comparison to the GOALS-ES "SF" and "SBnuc" regions in Sections 5.2.1 and 5.2.2. Below we present measured and derived quantities for a total of 152 regions identified in the BM17 (Table B1) and SFRS sample (Table B2) that were included in Figures 8, 10, 11, and 12 in Section 5.
Table B1. Measured and Derived Quantities for BM17 Regions
| Region | Type | R.A. | Decl. | log Re | S33 | log L33 | log 
|
|---|---|---|---|---|---|---|---|
| (°) | (°) | (pc) | (mJy) | (erg s−1 Hz−1) | (erg s−1 Hz−1 kpc−2) | ||
| (1) | (2) | (3) | (4) | (5) | (6) | (7) | (8) |
| IRASF08572+3915_n1 | AGN | 135.105726 | 39.065042 | 2.40 ± 0.01 | 2.08 ± 0.04 | 29.24 ± 0.01 | 29.94 ± 0.01 |
| UGC04881_n1 | AGN/SB | 138.981308 | 44.332764 | 2.28 ± 0.01 | 1.39 ± 0.03 | 28.72 ± 0.01 | 29.65 ± 0.02 |
| UGC05101_n1 | AGN | 143.964993 | 61.35325 | 2.59 ± 0.01 | 10.4 ± 0.12 | 29.59 ± 0.01 | 29.92 ± 0.01 |
| MCG+07-23-019_n1 | AGN/SB | 165.974877 | 40.849986 | 2.29 ± 0.01 | 3.95 ± 0.09 | 29.07 ± 0.01 | 29.99 ± 0.03 |
| NGC3690_e1 | SF | 172.127739 | 58.563694 | 1.72 ± 0.03 | 0.72 ± 0.08 | 27.35 ± 0.05 | 29.42 ± 0.06 |
| NGC3690_n1 | AGN | 172.129125 | 58.561333 | 1.91 ± 0.01 | 6.82 ± 0.1 | 28.33 ± 0.01 | 30.01 ± 0.02 |
| NGC3690_e2 | SF | 172.130562 | 58.563889 | 1.88 ± 0.01 | 2.41 ± 0.04 | 27.88 ± 0.01 | 29.62 ± 0.01 |
| NGC3690_n2 | AGN | 172.140122 | 58.562958 | 2.13 ± 0.01 | 36.54 ± 0.32 | 29.06 ± 0.01 | 30.31 ± 0.01 |
| UGC08058_n1 | AGN | 194.059319 | 56.873681 | 2.54 ± 0.01 | 74.7 ± 1.07 | 30.52 ± 0.01 | 30.94 ± 0.01 |
| VV250A_n1 | AGN/SB | 198.895668 | 62.124661 | 2.39 ± 0.04 | 3.59 ± 0.63 | 28.93 ± 0.08 | 29.65 ± 0.09 |
| UGC08387_n1 | SF | 200.147075 | 34.139639 | 1.32 ± 0.01 | 0.26 ± 0.01 | 27.57 ± 0.02 | 30.42 ± 0.03 |
| UGC08387_n2 | AGN | 200.147159 | 34.139542 | 1.63 ± 0.01 | 5.69 ± 0.06 | 28.9 ± 0.01 | 31.15 ± 0.01 |
| UGC08387_n3 | SF | 200.147216 | 34.139494 | 1.25 ± 0.03 | 0.14 ± 0.02 | 27.31 ± 0.06 | 30.32 ± 0.06 |
| UGC08387_n4 | SF | 200.147307 | 34.139381 | 1.57 ± 0.01 | 0.96 ± 0.03 | 28.13 ± 0.01 | 30.49 ± 0.02 |
| UGC08696_n1 | AGN | 206.175541 | 55.887083 | 2.49 ± 0.01 | 12.32 ± 0.13 | 29.63 ± 0.01 | 30.15 ± 0.01 |
| UGC08696_n2 | SF | 206.175739 | 55.886889 | 2.10 ± 0.01 | 0.58 ± 0.02 | 28.31 ± 0.01 | 29.60 ± 0.02 |
| VV705_n1 | AGN | 229.525484 | 42.745851 | 1.73 ± 0.01 | 0.91 ± 0.02 | 28.57 ± 0.01 | 30.60 ± 0.02 |
| VV705_n2 | AGN/SB | 229.526365 | 42.743917 | 1.56 ± 0.01 | 0.35 ± 0.01 | 28.15 ± 0.01 | 30.54 ± 0.02 |
| IRASF15250+3608_n1 | AGN/SB | 231.747596 | 35.97707 | 1.91 ± 0.01 | 3.78 ± 0.04 | 29.46 ± 0.01 | 31.14 ± 0.01 |
| UGC09913_n1 | AGN/SB | 233.738441 | 23.503215 | 1.81 ± 0.12 | 20.8 ± 4.83 | 29.29 ± 0.10 | 31.17 ± 0.24 |
| UGC09913_n2 | AGN/SB | 233.738729 | 23.503168 | 1.60 ± 0.04 | 9.94 ± 0.77 | 28.97 ± 0.03 | 31.26 ± 0.08 |
| IRAS21101+5810_n1 | AGN/SB | 317.872035 | 58.385519 | 1.75 ± 0.01 | 1.06 ± 0.02 | 28.58 ± 0.01 | 30.58 ± 0.01 |
| IRASF23365+3604_n1 | AGN/SB | 354.755258 | 36.352366 | 1.93 ± 0.01 | 0.98 ± 0.04 | 28.99 ± 0.02 | 30.63 ± 0.02 |
Note. Column (1): Region identifier including galaxy name, with "n" and "e" indicating region location: "n"—within the MIR galaxy core measured by Díaz-Santos et al. (2010), "e"—extranuclear (outside MIR galaxy core). Column (2): Region type indicating the most likely source for the detected radio emission, classified following Section 4.1. Columns (3) and (4): J2000 coordinates of the emission peak of the region. Column (5): Region effective radius. Column (6): 33 GHz flux density. Column (7): 33 GHz spectral luminosity calculated from column (6). Column (8): 33 GHz spectral luminosity surface density, calculated from columns (5) and (7).
Download table as: ASCIITypeset image
Table B2. Measured and Derived Quantities for SFRS Star-forming Regions
| Region | R.A. | Decl. | log Re | S15 | S33 | α15−33 | fth | log SFR | log ΣSFR | log SFRth | log 
|
|---|---|---|---|---|---|---|---|---|---|---|---|
| (°) | (°) | (pc) | (mJy) | (mJy) | (%) | (M⊙ yr−1) | (M⊙ yr−1 kpc−2) | (M⊙ yr−1) | (M⊙ yr−1 kpc−2) | ||
| (1) | (2) | (3) | (4) | (5) | (6) | (7) | (8) | (9) | (10) | (11) | (12) |
| NGC0337_e4 | 14.95841 | −7.57622 | 2.25 ± 0.01 | 0.34 ± 0.04 | 0.28 ± 0.04 | −0.26 ± 0.23 | 83 ± 17 | −1.27 ± 0.06 | −0.26 ± 0.06 | −1.17 ± 0.14 | −0.16 ± 0.14 |
| NGC0337_e1 | 14.96135 | −7.58297 | 2.52 ± 0.04 | 1.66 ± 0.17 | 1.24 ± 0.13 | −0.37 ± 0.19 | 70 ± 23 | −0.62 ± 0.05 | −0.16 ± 0.09 | −0.6 ± 0.15 | −0.13 ± 0.17 |
| NGC0337_e3 | 14.96622 | −7.57672 | <2.06 | 0.09 ± 0.01 | 0.08 ± 0.02 | −0.07 ± 0.43 | 100 | −1.63 ± 0.20 | >−0.25 | −1.63 ± 0.2 | >−0.25 |
| NGC0337_e2 | 14.96757 | −7.57772 | 2.15 ± 0.02 | 0.11 ± 0.02 | 0.14 ± 0.03 | 0.30 ± 0.32 | 100 | −1.40 ± 0.13 | −0.20 ± 0.13 | −1.4 ± 0.13 | −0.20 ± 0.13 |
| NGC0628_e1 | 24.14878 | 15.83535 | <1.53 | 0.07 ± 0.01 | 0.07 ± 0.02 | −0.03 ± 0.41 | 100 | −2.56 ± 0.19 | >−0.13 | −2.56 ± 0.19 | >−0.13 |
| NGC0628_e2 | 24.15686 | 15.75200 | 1.63 ± 0.01 | 0.16 ± 0.02 | 0.16 ± 0.03 | −0.02 ± 0.27 | 100 | −2.19 ± 0.13 | 0.06 ± 0.13 | −2.19 ± 0.13 | 0.06 ± 0.13 |
| NGC1097_e4 | 41.57669 | −30.27344 | <2.16 | 0.91 ± 0.04 | 0.70 ± 0.05 | −0.32 ± 0.24 | 76 ± 24 | −1.14 ± 0.03 | >0.04 | −1.07 ± 0.16 | >0.10 |
| NGC1097_e2 | 41.57698 | −30.27661 | 2.35 ± 0.02 | 2.60 ± 0.26 | 1.97 ± 0.22 | −0.35 ± 0.19 | 73 ± 23 | −0.69 ± 0.05 | 0.11 ± 0.06 | −0.65 ± 0.14 | 0.15 ± 0.15 |
| NGC1097_e1 | 41.57891 | −30.27736 | <2.16 | 0.82 ± 0.05 | 0.72 ± 0.06 | −0.17 ± 0.24 | 93 ± 7 | −1.13 ± 0.04 | >0.05 | −0.98 ± 0.12 | >0.20 |
| NGC1097_e5 | 41.57949 | −30.27228 | 2.29 ± 0.02 | 1.81 ± 0.18 | 1.19 ± 0.15 | −0.53 ± 0.2 | 50 ± 28 | −0.91 ± 0.05 | 0.02 ± 0.07 | −1.04 ± 0.25 | −0.11 ± 0.25 |
| NGC1097_e3 | 41.58142 | −30.27603 | 2.41 ± 0.01 | 3.53 ± 0.36 | 2.46 ± 0.27 | −0.46 ± 0.19 | 59 ± 25 | −0.59 ± 0.05 | 0.09 ± 0.06 | −0.64 ± 0.19 | 0.04 ± 0.19 |
| IC342_e1 | 56.69650 | 68.09453 | 1.19 ± 0.08 | 0.26 ± 0.03 | 0.25 ± 0.05 | −0.02 ± 0.28 | 100 | −2.67 ± 0.14 | 0.45 ± 0.21 | −2.67 ± 0.14 | 0.45 ± 0.21 |
| IC342_n3 | 56.69918 | 68.09611 | 1.69 ± 0.01 | 15.8 ± 1.58 | 12.3 ± 1.23 | −0.32 ± 0.18 | 76 ± 21 | −1.17 ± 0.04 | 0.96 ± 0.05 | −1.11 ± 0.13 | 1.02 ± 0.13 |
| IC342_n1 | 56.70253 | 68.09544 | 1.21 ± 0.03 | 1.10 ± 0.11 | 0.84 ± 0.09 | −0.35 ± 0.19 | 73 ± 22 | −2.33 ± 0.05 | 0.76 ± 0.08 | −2.29 ± 0.14 | 0.80 ± 0.16 |
| IC342_n2 | 56.70432 | 68.09611 | 1.36 ± 0.03 | 2.44 ± 0.24 | 1.99 ± 0.20 | −0.26 ± 0.18 | 84 ± 16 | −1.96 ± 0.04 | 0.82 ± 0.08 | −1.86 ± 0.11 | 0.92 ± 0.13 |
| IC342_n4 | 56.70499 | 68.09719 | 1.23 ± 0.04 | 0.97 ± 0.10 | 0.85 ± 0.09 | −0.17 ± 0.19 | 93 ± 7 | −2.33 ± 0.05 | 0.71 ± 0.09 | −2.18 ± 0.1 | 0.86 ± 0.13 |
| NGC1482_e2 | 58.66209 | −20.50219 | <2.12 | 2.83 ± 0.10 | 2.00 ± 0.08 | −0.44 ± 0.19 | 62 ± 24 | −0.28 ± 0.02 | >0.98 | −0.31 ± 0.17 | >0.95 |
| NGC1482_e1 | 58.66280 | −20.50236 | <2.12 | 2.79 ± 0.13 | 2.03 ± 0.11 | −0.40 ± 0.19 | 67 ± 23 | −0.27 ± 0.02 | >0.99 | −0.27 ± 0.15 | >0.99 |
| NGC2403_e2 | 114.11956 | 65.56339 | <1.7 | 0.53 ± 0.06 | 0.54 ± 0.06 | 0.03 ± 0.21 | 100 | −2.36 ± 0.09 | >−0.26 | −2.36 ± 0.09 | >−0.26 |
| NGC2403_e5 | 114.17505 | 65.61433 | 1.37 ± 0.01 | 0.23 ± 0.03 | 0.18 ± 0.02 | −0.30 ± 0.23 | 79 ± 21 | −3.01 ± 0.06 | −0.25 ± 0.06 | −2.94 ± 0.15 | −0.17 ± 0.16 |
| NGC2403_e7 | 114.18999 | 65.61717 | 1.69 ± 0.01 | 1.00 ± 0.11 | 0.97 ± 0.10 | −0.04 ± 0.19 | 100 | −2.11 ± 0.09 | 0.01 ± 0.09 | −2.11 ± 0.09 | 0.01 ± 0.09 |
| NGC2403_e6 | 114.20492 | 65.61442 | 1.49 ± 0.01 | 0.36 ± 0.04 | 0.32 ± 0.04 | −0.15 ± 0.21 | 95 ± 5 | −2.77 ± 0.05 | −0.25 ± 0.06 | −2.61 ± 0.11 | −0.09 ± 0.11 |
| NGC2403_e4 | 114.21716 | 65.61344 | 1.48 ± 0.02 | 0.38 ± 0.04 | 0.36 ± 0.04 | −0.05 ± 0.21 | 100 | −2.54 ± 0.1 | 0.01 ± 0.11 | −2.54 ± 0.1 | 0.01 ± 0.11 |
| NGC2403_e3 | 114.27855 | 65.61075 | 1.61 ± 0.01 | 2.15 ± 0.22 | 2.07 ± 0.21 | −0.04 ± 0.18 | 100 | −1.78 ± 0.09 | 0.5 ± 0.09 | −1.78 ± 0.09 | 0.50 ± 0.09 |
| NGC2403_e1 | 114.32559 | 65.56303 | 1.66 ± 0.03 | 0.48 ± 0.06 | 0.53 ± 0.06 | 0.13 ± 0.21 | 100 | −2.37 ± 0.09 | −0.19 ± 0.11 | −2.37 ± 0.09 | −0.19 ± 0.11 |
| NGC2798_e1 | 139.34511 | 42.00036 | <2.61 | 0.07 ± 0.01 | 0.04 ± 0.01 | −0.65 ± 0.42 | 32 ± 64 | −1.82 ± 0.12 | >−1.53 | −2.13 ± 0.87 | >−1.85 |
| NGC2976_e4 | 146.77163 | 67.93094 | 1.58 ± 0.01 | 0.42 ± 0.05 | 0.42 ± 0.06 | −0.02 ± 0.22 | 100 | −2.39 ± 0.11 | −0.05 ± 0.11 | −2.39 ± 0.11 | −0.05 ± 0.11 |
| NGC2976_e5 | 146.78139 | 67.93186 | 1.82 ± 0.01 | 1.85 ± 0.19 | 1.61 ± 0.17 | −0.17 ± 0.19 | 93 ± 7 | −1.98 ± 0.05 | −0.12 ± 0.05 | −1.84 ± 0.1 | 0.02 ± 0.11 |
| NGC2976_e3 | 146.78272 | 67.93011 | 1.35 ± 0.04 | 0.11 ± 0.02 | 0.10 ± 0.02 | −0.14 ± 0.36 | 96 ± 4 | −3.19 ± 0.1 | −0.38 ± 0.13 | −3.03 ± 0.19 | −0.22 ± 0.21 |
| NGC2976_e2 | 146.84798 | 67.89875 | 1.49 ± 0.02 | 0.30 ± 0.04 | 0.29 ± 0.04 | −0.04 ± 0.24 | 100 | −2.54 ± 0.12 | −0.03 ± 0.13 | −2.54 ± 0.12 | −0.03 ± 0.13 |
| NGC2976_e1 | 146.85152 | 67.89858 | 1.51 ± 0.03 | 0.34 ± 0.04 | 0.29 ± 0.04 | −0.20 ± 0.25 | 90 ± 10 | −2.73 ± 0.07 | −0.24 ± 0.09 | −2.59 ± 0.14 | −0.11 ± 0.15 |
| NGC3049_n1 | 148.70650 | 9.27114 | <2.37 | 1.28 ± 0.13 | 0.96 ± 0.10 | −0.37 ± 0.19 | 71 ± 23 | −0.74 ± 0.05 | >0.03 | −0.71 ± 0.15 | >0.06 |
| NGC3190_e1 | 154.51795 | 21.82553 | 2.36 ± 0.01 | 2.19 ± 0.22 | 1.94 ± 0.20 | −0.15 ± 0.18 | 95 ± 5 | −0.43 ± 0.04 | 0.36 ± 0.05 | −0.28 ± 0.1 | 0.51 ± 0.10 |
| NGC3184_n1 | 154.57036 | 41.42425 | 1.96 ± 0.01 | 0.17 ± 0.02 | 0.14 ± 0.02 | −0.23 ± 0.27 | 87 ± 13 | −2.01 ± 0.07 | −0.42 ± 0.07 | −1.89 ± 0.16 | −0.30 ± 0.16 |
| NGC3198_e1 | 154.97923 | 45.54981 | 1.82 ± 0.02 | 0.19 ± 0.02 | 0.08 ± 0.02 | −1.03 ± 0.30 | 14 ± 39 | −1.97 ± 0.09 | −0.11 ± 0.10 | −2.76 ± 1.26 | −0.90 ± 1.26 |
| IC2574_e1 | 157.18191 | 68.47422 | 1.61 ± 0.02 | 0.18 ± 0.03 | 0.31 ± 0.05 | 0.72 ± 0.28 | 100 | −2.46 ± 0.09 | −0.18 ± 0.10 | −2.46 ± 0.09 | −0.18 ± 0.10 |
| IC2574_n1 | 157.20167 | 68.46764 | 1.57 ± 0.01 | 0.31 ± 0.04 | 0.32 ± 0.04 | 0.05 ± 0.23 | 100 | −2.44 ± 0.10 | −0.08 ± 0.10 | −2.44 ± 0.1 | −0.08 ± 0.10 |
| NGC3351_e1 | 160.99024 | 11.70189 | 2.22 ± 0.02 | 2.17 ± 0.22 | 1.60 ± 0.17 | −0.39 ± 0.19 | 68 ± 23 | −1.14 ± 0.05 | −0.08 ± 0.06 | −1.13 ± 0.15 | −0.07 ± 0.16 |
| NGC3351_n1 | 160.99066 | 11.70539 | 2.07 ± 0.01 | 1.56 ± 0.16 | 1.11 ± 0.12 | −0.43 ± 0.19 | 63 ± 24 | −1.30 ± 0.05 | 0.06 ± 0.05 | −1.32 ± 0.17 | 0.04 ± 0.17 |
| NGC3351_e2 | 160.99186 | 11.70464 | 1.76 ± 0.05 | 0.31 ± 0.04 | 0.19 ± 0.03 | −0.59 ± 0.23 | 41 ± 33 | −2.06 ± 0.06 | −0.08 ± 0.12 | −2.27 ± 0.35 | −0.29 ± 0.37 |
| NGC3627_e1 | 170.06784 | 12.96367 | <2.23 | 1.94 ± 0.20 | 1.65 ± 0.17 | −0.21 ± 0.19 | 89 ± 11 | −1.13 ± 0.05 | >−0.07 | −1 ± 0.11 | >0.05 |
| NGC3627_e2 | 170.06826 | 12.97881 | 2.38 ± 0.01 | 6.43 ± 0.65 | 5.11 ± 0.52 | −0.29 ± 0.18 | 80 ± 20 | −0.63 ± 0.04 | 0.1 ± 0.05 | −0.55 ± 0.12 | 0.18 ± 0.12 |
| NGC3773_n1 | 174.55459 | 12.11242 | 2.26 ± 0.03 | 0.67 ± 0.08 | 0.60 ± 0.07 | −0.14 ± 0.21 | 96 ± 4 | −1.32 ± 0.05 | −0.33 ± 0.08 | −1.16 ± 0.11 | −0.17 ± 0.12 |
| NGC4254_e1 | 184.69229 | 14.40531 | 1.99 ± 0.01 | 0.06 ± 0.02 | 0.10 ± 0.02 | 0.64 ± 0.43 | 100 | −1.79 ± 0.12 | −0.27 ± 0.12 | −1.79 ± 0.12 | −0.27 ± 0.12 |
| NGC4321_e4 | 185.72693 | 15.82258 | 1.90 ± 0.06 | 0.18 ± 0.02 | 0.11 ± 0.02 | −0.60 ± 0.3 | 41 ± 44 | −1.93 ± 0.09 | −0.22 ± 0.14 | −2.14 ± 0.48 | −0.44 ± 0.49 |
| NGC4321_e1 | 185.72762 | 15.82050 | <1.85 | 0.06 ± 0.01 | 0.06 ± 0.01 | 0.08 ± 0.52 | 100 | −1.99 ± 0.2 | >−0.20 | −1.99 ± 0.2 | >−0.20 |
| NGC4321_e2 | 185.73048 | 15.82108 | 2.07 ± 0.03 | 0.39 ± 0.04 | 0.32 ± 0.04 | −0.26 ± 0.22 | 84 ± 16 | −1.47 ± 0.06 | −0.11 ± 0.08 | −1.37 ± 0.14 | −0.01 ± 0.15 |
| NGC4321_e5 | 185.73057 | 15.82317 | 1.84 ± 0.05 | 0.13 ± 0.02 | 0.10 ± 0.02 | −0.40 ± 0.28 | 67 ± 33 | −1.99 ± 0.08 | −0.16 ± 0.13 | −1.98 ± 0.23 | −0.15 ± 0.26 |
| NGC4321_e3 | 185.73074 | 15.82242 | 1.93 ± 0.05 | 0.24 ± 0.03 | 0.17 ± 0.02 | −0.45 ± 0.24 | 61 ± 31 | −1.75 ± 0.06 | −0.10 ± 0.11 | −1.79 ± 0.23 | −0.14 ± 0.25 |
| NGC4536_e2 | 188.61225 | 2.18881 | 2.16 ± 0.02 | 5.33 ± 0.53 | 3.47 ± 0.35 | −0.54 ± 0.18 | 48 ± 25 | −0.42 ± 0.04 | 0.76 ± 0.06 | −0.56 ± 0.23 | 0.62 ± 0.23 |
| NGC4536_e1 | 188.61375 | 2.18772 | 2.04 ± 0.04 | 2.66 ± 0.27 | 1.76 ± 0.18 | −0.52 ± 0.18 | 51 ± 25 | −0.72 ± 0.04 | 0.70 ± 0.09 | −0.83 ± 0.21 | 0.58 ± 0.23 |
| NGC4559_e2 | 188.98410 | 27.96125 | <1.61 | 0.02 ± 0.01 | 0.04 ± 0.01 | 0.63 ± 0.97 | 100 | −2.82 ± 0.24 | >−0.54 | −2.82 ± 0.24 | >−0.54 |
| NGC4559_e1 | 188.99353 | 27.95775 | 1.62 ± 0.02 | 0.04 ± 0.01 | 0.05 ± 0.01 | 0.38 ± 0.55 | 100 | −2.7 ± 0.18 | −0.44 ± 0.19 | −2.7 ± 0.18 | −0.44 ± 0.19 |
| NGC4631_e5 | 190.51391 | 32.53819 | <1.60 | 0.24 ± 0.02 | 0.24 ± 0.02 | 0.01 ± 0.22 | 100 | −1.96 ± 0.09 | >0.35 | −1.96 ± 0.09 | >0.35 |
| NGC4631_e1 | 190.51470 | 32.53703 | <1.60 | 0.08 ± 0.01 | 0.05 ± 0.01 | −0.60 ± 0.54 | 41 ± 59 | −2.82 ± 0.07 | >−0.52 | −3.04 ± 0.84 | −0.73 ± 0.84 |
| NGC4631_e4 | 190.51490 | 32.53786 | 1.71 ± 0.02 | 0.80 ± 0.08 | 0.61 ± 0.06 | −0.34 ± 0.19 | 75 ± 22 | −1.74 ± 0.05 | 0.34 ± 0.06 | −1.69 ± 0.14 | 0.39 ± 0.14 |
| NGC4631_e2 | 190.51747 | 32.53736 | 1.65 ± 0.03 | 0.14 ± 0.02 | 0.11 ± 0.02 | −0.36 ± 0.29 | 72 ± 28 | −2.49 ± 0.07 | −0.29 ± 0.1 | −2.45 ± 0.22 | −0.26 ± 0.23 |
| NGC4631_e6 | 190.51776 | 32.54036 | 2.19 ± 0.01 | 2.88 ± 0.30 | 2.70 ± 0.28 | −0.08 ± 0.18 | 100 | −0.91 ± 0.09 | 0.20 ± 0.09 | −0.91 ± 0.09 | 0.2 ± 0.09 |
| NGC4631_e3 | 190.52103 | 32.53736 | <1.60 | 0.08 ± 0.01 | 0.06 ± 0.01 | −0.36 ± 0.51 | 72 ± 28 | −2.76 ± 0.09 | >−0.45 | −2.72 ± 0.38 | >−0.41 |
| NGC4631_e9 | 190.59043 | 32.54675 | <1.59 | 0.02 ± 0.01 | 0.04 ± 0.01 | 0.58 ± 0.79 | 100 | −2.75 ± 0.21 | >−0.43 | −2.75 ± 0.21 | >−0.43 |
| NGC4631_e8 | 190.59132 | 32.54567 | 2.03 ± 0.05 | 0.44 ± 0.05 | 0.52 ± 0.06 | 0.21 ± 0.21 | 100 | −1.63 ± 0.09 | −0.20 ± 0.13 | −1.63 ± 0.09 | −0.2 ± 0.13 |
| NGC4631_e7 | 190.59478 | 32.54625 | 1.7 ± 0.1 | 0.09 ± 0.02 | 0.12 ± 0.02 | 0.37 ± 0.35 | 100 | −2.26 ± 0.12 | −0.16 ± 0.24 | −2.26 ± 0.12 | −0.16 ± 0.24 |
| NGC4736_e4 | 192.73461 | 41.12214 | <1.44 | 0.05 ± 0.02 | 0.07 ± 0.01 | 0.32 ± 0.70 | 100 | −2.96 ± 0.23 | >−0.33 | −2.96 ± 0.23 | >−0.33 |
| NGC4736_e3 | 192.73472 | 41.12056 | 1.68 ± 0.01 | 0.38 ± 0.05 | 0.33 ± 0.04 | −0.17 ± 0.23 | 93 ± 7 | −2.43 ± 0.05 | −0.28 ± 0.06 | −2.28 ± 0.13 | −0.14 ± 0.13 |
| NGC4736_e2 | 192.73605 | 41.11797 | 1.81 ± 0.02 | 0.87 ± 0.10 | 0.56 ± 0.07 | −0.55 ± 0.21 | 47 ± 29 | −2.20 ± 0.05 | −0.32 ± 0.06 | −2.34 ± 0.27 | −0.47 ± 0.27 |
| NGC4736_e1 | 192.73693 | 41.11314 | 1.68 ± 0.01 | 0.54 ± 0.06 | 0.34 ± 0.04 | −0.57 ± 0.22 | 44 ± 31 | −2.42 ± 0.06 | −0.28 ± 0.06 | −2.59 ± 0.31 | −0.46 ± 0.31 |
| NGC4826_e6 | 194.17897 | 21.68550 | <1.42 | 0.06 ± 0.01 | 0.05 ± 0.01 | −0.20 ± 0.51 | 90 ± 10 | −3.14 ± 0.09 | >−0.49 | −3.01 ± 0.28 | >−0.36 |
| NGC4826_e3 | 194.17897 | 21.68342 | <1.42 | 0.06 ± 0.01 | 0.05 ± 0.01 | −0.34 ± 0.51 | 75 ± 25 | −3.16 ± 0.08 | >−0.50 | −3.1 ± 0.36 | >−0.45 |
| NGC4826_e1 | 194.17960 | 21.68183 | <1.42 | 0.08 ± 0.01 | 0.06 ± 0.01 | −0.45 ± 0.42 | 61 ± 39 | −3.08 ± 0.09 | >−0.42 | −3.12 ± 0.4 | >−0.46 |
| NGC4826_e5 | 194.17996 | 21.68500 | <1.42 | 0.08 ± 0.01 | 0.05 ± 0.01 | −0.62 ± 0.46 | 37 ± 63 | −3.15 ± 0.08 | >−0.49 | −3.4 ± 0.8 | >−0.74 |
| NGC4826_e4 | 194.18085 | 21.68358 | 1.6 ± 0.02 | 0.60 ± 0.06 | 0.43 ± 0.05 | −0.42 ± 0.19 | 64 ± 24 | −2.21 ± 0.05 | 0.09 ± 0.06 | −2.23 ± 0.17 | 0.08 ± 0.17 |
| NGC4826_n1 | 194.18184 | 21.68433 | 1.58 ± 0.02 | 0.42 ± 0.05 | 0.34 ± 0.04 | −0.27 ± 0.20 | 82 ± 18 | −2.31 ± 0.05 | 0.04 ± 0.07 | −2.21 ± 0.13 | 0.13 ± 0.13 |
| NGC4826_e2 | 194.18453 | 21.68208 | 1.61 ± 0.01 | 0.12 ± 0.02 | 0.16 ± 0.02 | 0.39 ± 0.31 | 100 | −2.46 ± 0.11 | −0.18 ± 0.11 | −2.46 ± 0.11 | −0.18 ± 0.11 |
| NGC5194_e1 | 202.41397 | 47.14339 | <1.58 | 0.02 ± 0.01 | 0.04 ± 0.01 | 0.94 ± 1.13 | 100 | −2.80 ± 0.23 | >−0.47 | −2.8 ± 0.23 | >−0.47 |
| NGC5194_e2 | 202.41397 | 47.14464 | 1.91 ± 0.01 | 0.20 ± 0.03 | 0.23 ± 0.03 | 0.13 ± 0.25 | 100 | −1.99 ± 0.10 | −0.3 ± 0.11 | −1.99 ± 0.1 | −0.3 ± 0.11 |
| NGC5194_e6 | 202.43203 | 47.16686 | <1.56 | 0.03 ± 0.01 | 0.05 ± 0.01 | 0.74 ± 0.76 | 100 | −2.69 ± 0.18 | >−0.31 | −2.69 ± 0.18 | >−0.31 |
| NGC5194_e5 | 202.43559 | 47.16644 | <1.56 | 0.02 ± 0.01 | 0.04 ± 0.01 | 0.70 ± 0.89 | 100 | −2.77 ± 0.21 | >−0.39 | −2.77 ± 0.21 | >−0.39 |
| NGC5194_e4 | 202.43816 | 47.16578 | 1.85 ± 0.01 | 0.23 ± 0.03 | 0.29 ± 0.03 | 0.30 ± 0.23 | 100 | −1.89 ± 0.09 | −0.09 ± 0.09 | −1.89 ± 0.09 | −0.09 ± 0.09 |
| NGC5194_e21 | 202.44604 | 47.22797 | 1.67 ± 0.01 | 0.01 ± 0.01 | 0.04 ± 0.01 | 1.81 ± 2.01 | 100 | −2.78 ± 0.21 | −0.62 ± 0.22 | −2.78 ± 0.21 | −0.62 ± 0.22 |
| NGC5194_e19 | 202.44813 | 47.22364 | 1.62 ± 0.02 | 0.01 ± 0.01 | 0.01 ± 0.01 | 2.04 ± 4.47 | 100 | −3.30 ± 0.39 | −1.04 ± 0.39 | −3.3 ± 0.39 | −1.04 ± 0.39 |
| NGC5194_e25 | 202.45647 | 47.23331 | 1.68 ± 0.01 | 0.01 ± 0.01 | 0.02 ± 0.01 | 1.19 ± 1.84 | 100 | −3.06 ± 0.31 | −0.91 ± 0.31 | −3.06 ± 0.31 | −0.91 ± 0.31 |
| NGC5194_e20 | 202.45647 | 47.22439 | <1.56 | 0.01 ± 0.02 | 0.04 ± 0.01 | 1.71 ± 2.19 | 100 | −2.73 ± 0.25 | >−0.35 | −2.73 ± 0.25 | >−0.35 |
| NGC5194_e8 | 202.45806 | 47.19194 | 1.70 ± 0.01 | 0.19 ± 0.02 | 0.15 ± 0.02 | −0.28 ± 0.24 | 82 ± 18 | −2.35 ± 0.06 | −0.25 ± 0.07 | −2.26 ± 0.16 | −0.16 ± 0.16 |
| NGC5194_e12 | 202.45928 | 47.19761 | <1.57 | 0.08 ± 0.01 | 0.05 ± 0.01 | −0.50 ± 0.44 | 54 ± 46 | −2.81 ± 0.08 | >−0.45 | −2.89 ± 0.48 | >−0.54 |
| NGC5194_e23 | 202.46027 | 47.22914 | 1.65 ± 0.02 | 0.02 ± 0.01 | 0.04 ± 0.01 | 0.77 ± 0.90 | 100 | −2.75 ± 0.22 | −0.54 ± 0.22 | −2.75 ± 0.22 | −0.54 ± 0.22 |
| NGC5194_e24 | 202.46064 | 47.23222 | <1.56 | 0.02 ± 0.02 | 0.03 ± 0.01 | 0.80 ± 1.43 | 100 | −2.84 ± 0.34 | >−0.46 | −2.84 ± 0.34 | >−0.46 |
| NGC5194_e16 | 202.46112 | 47.19886 | 1.61 ± 0.02 | 0.10 ± 0.02 | 0.08 ± 0.01 | −0.29 ± 0.33 | 80 ± 20 | −2.64 ± 0.08 | −0.36 ± 0.09 | −2.56 ± 0.22 | −0.27 ± 0.22 |
| NGC5194_e22 | 202.46224 | 47.22881 | 1.54 ± 0.02 | 0.03 ± 0.02 | 0.08 ± 0.01 | 1.32 ± 0.88 | 100 | −2.43 ± 0.14 | 0.00 ± 0.15 | −2.43 ± 0.14 | 0 ± 0.15 |
| NGC5194_e17 | 202.46468 | 47.20028 | 1.65 ± 0.03 | 0.41 ± 0.05 | 0.25 ± 0.03 | −0.64 ± 0.21 | 34 ± 32 | −2.13 ± 0.05 | 0.08 ± 0.08 | −2.42 ± 0.41 | −0.21 ± 0.41 |
| NGC5194_e11 | 202.46811 | 47.19678 | <1.57 | 0.11 ± 0.01 | 0.05 ± 0.01 | −0.99 ± 0.41 | 14 ± 55 | −2.72 ± 0.09 | >−0.36 | −3.49 ± 1.72 | >−1.13 |
| NGC5194_e15 | 202.46836 | 47.19878 | 1.63 ± 0.07 | 0.13 ± 0.02 | 0.08 ± 0.01 | −0.68 ± 0.28 | 28 ± 44 | −2.63 ± 0.08 | −0.38 ± 0.16 | −3.01 ± 0.68 | −0.76 ± 0.70 |
| NGC5194_e14 | 202.46909 | 47.19819 | 1.66 ± 0.05 | 0.19 ± 0.02 | 0.10 ± 0.02 | −0.74 ± 0.26 | 18 ± 42 | −2.5 ± 0.07 | −0.31 ± 0.13 | −3.06 ± 0.99 | −0.87 ± 1.00 |
| NGC5194_e13 | 202.46983 | 47.19769 | 1.63 ± 0.08 | 0.22 ± 0.03 | 0.11 ± 0.02 | −0.88 ± 0.26 | 15 ± 37 | −2.43 ± 0.07 | −0.18 ± 0.17 | −3.13 ± 1.07 | −0.88 ± 1.08 |
| NGC5194_e9 | 202.47952 | 47.19294 | <1.57 | 0.06 ± 0.01 | 0.05 ± 0.01 | −0.12 ± 0.50 | 98 ± 2 | −2.82 ± 0.09 | >−0.46 | −2.64 ± 0.24 | >−0.29 |
| NGC5194_e10 | 202.48258 | 47.19578 | 1.91 ± 0.01 | 0.38 ± 0.05 | 0.39 ± 0.05 | 0.06 ± 0.22 | 100 | −1.75 ± 0.1 | −0.07 ± 0.1 | −1.75 ± 0.1 | −0.07 ± 0.1 |
| NGC5194_e26 | 202.49846 | 47.23328 | 1.55 ± 0.03 | 0.04 ± 0.01 | 0.07 ± 0.02 | 0.77 ± 0.49 | 100 | −2.47 ± 0.14 | −0.07 ± 0.16 | −2.47 ± 0.14 | −0.07 ± 0.16 |
| NGC5194_e7 | 202.49934 | 47.18683 | 1.67 ± 0.01 | 0.15 ± 0.02 | 0.17 ± 0.03 | 0.14 ± 0.27 | 100 | −2.11 ± 0.12 | 0.05 ± 0.12 | −2.11 ± 0.12 | 0.05 ± 0.12 |
| NGC5194_e18 | 202.50630 | 47.21428 | 1.81 ± 0.01 | 0.43 ± 0.05 | 0.37 ± 0.04 | −0.21 ± 0.21 | 89 ± 11 | −1.96 ± 0.05 | −0.07 ± 0.06 | −1.83 ± 0.12 | 0.06 ± 0.12 |
| NGC5194_e3 | 202.50993 | 47.16361 | 1.71 ± 0.01 | 0.15 ± 0.02 | 0.18 ± 0.03 | 0.20 ± 0.27 | 100 | −2.09 ± 0.11 | 0.00 ± 0.12 | −2.09 ± 0.11 | 0.00 ± 0.12 |
| TOL89_n1 | 210.33377 | −33.06967 | <2.35 | 1.44 ± 0.15 | 1.47 ± 0.16 | 0.03 ± 0.19 | 100 | −1.17 ± 0.09 | >−0.37 | −1.17 ± 0.09 | >−0.37 |
| M101_e7 | 210.61708 | 54.27697 | 1.55 ± 0.11 | 0.06 ± 0.02 | 0.10 ± 0.02 | 0.57 ± 0.57 | 100 | −2.48 ± 0.17 | −0.08 ± 0.27 | −2.48 ± 0.17 | −0.08 ± 0.27 |
| M101_e6 | 210.61765 | 54.27397 | 1.9 ± 0.01 | 0.40 ± 0.05 | 0.59 ± 0.06 | 0.50 ± 0.22 | 100 | −1.69 ± 0.08 | 0.01 ± 0.08 | −1.69 ± 0.08 | 0.01 ± 0.08 |
| M101_e5 | 210.62293 | 54.27214 | <1.59 | 0.05 ± 0.02 | 0.06 ± 0.01 | 0.24 ± 0.73 | 100 | −2.71 ± 0.25 | >−0.39 | −2.71 ± 0.25 | >−0.39 |
| M101_e4 | 210.62351 | 54.27097 | 1.92 ± 0.01 | 0.59 ± 0.07 | 0.66 ± 0.07 | 0.13 ± 0.21 | 100 | −1.64 ± 0.09 | 0.02 ± 0.09 | −1.64 ± 0.09 | 0.02 ± 0.09 |
| M101_e3 | 210.62750 | 54.26939 | 1.87 ± 0.01 | 0.40 ± 0.05 | 0.44 ± 0.05 | 0.11 ± 0.22 | 100 | −1.81 ± 0.09 | −0.05 ± 0.1 | −1.81 ± 0.09 | −0.05 ± 0.1 |
| M101_e2 | 210.62764 | 54.26697 | 1.75 ± 0.01 | 0.15 ± 0.03 | 0.21 ± 0.03 | 0.44 ± 0.32 | 100 | −2.14 ± 0.11 | −0.14 ± 0.11 | −2.14 ± 0.11 | −0.14 ± 0.11 |
| M101_e1 | 210.75487 | 54.24147 | <2.10 | 1.23 ± 0.14 | 1.53 ± 0.16 | 0.27 ± 0.19 | 100 | −1.27 ± 0.08 | >0.02 | −1.27 ± 0.08 | >0.02 |
| M101_n1 | 210.80179 | 54.34850 | <1.52 | 0.03 ± 0.01 | 0.05 ± 0.01 | 0.72 ± 0.75 | 100 | −2.78 ± 0.18 | >−0.32 | −2.78 ± 0.18 | >−0.32 |
| M101_e8 | 210.91608 | 54.31569 | 2.02 ± 0.01 | 8.37 ± 0.84 | 6.95 ± 0.70 | −0.24 ± 0.18 | 86 ± 14 | −0.79 ± 0.04 | 0.66 ± 0.05 | −0.68 ± 0.11 | 0.78 ± 0.11 |
| M101_e9 | 210.97111 | 54.36558 | <1.52 | 0.04 ± 0.01 | 0.06 ± 0.01 | 0.62 ± 0.63 | 100 | −2.69 ± 0.17 | >−0.22 | −2.69 ± 0.17 | >−0.22 |
| M101_e10 | 210.97139 | 54.36850 | 1.78 ± 0.01 | 0.17 ± 0.03 | 0.31 ± 0.04 | 0.78 ± 0.27 | 100 | −1.97 ± 0.08 | −0.03 ± 0.08 | −1.97 ± 0.08 | −0.03 ± 0.08 |
| M101_e11 | 210.97497 | 54.36983 | 1.77 ± 0.01 | 0.17 ± 0.03 | 0.29 ± 0.04 | 0.67 ± 0.26 | 100 | −1.99 ± 0.08 | −0.03 ± 0.08 | −1.99 ± 0.08 | −0.03 ± 0.08 |
| NGC5713_e5 | 220.04292 | −0.28892 | 2.26 ± 0.05 | 0.23 ± 0.03 | 0.19 ± 0.03 | −0.22 ± 0.25 | 87 ± 13 | −1.34 ± 0.06 | −0.36 ± 0.12 | −1.22 ± 0.15 | −0.24 ± 0.18 |
| NGC5713_e3 | 220.04325 | −0.29125 | <2.16 | 0.09 ± 0.02 | 0.07 ± 0.01 | −0.34 ± 0.47 | 74 ± 26 | −1.78 ± 0.09 | >−0.60 | −1.73 ± 0.34 | >−0.56 |
| NGC5713_e1 | 220.04400 | −0.29675 | <2.16 | 0.08 ± 0.01 | 0.06 ± 0.01 | −0.29 ± 0.53 | 80 ± 20 | −1.83 ± 0.08 | >−0.66 | −1.75 ± 0.34 | >−0.58 |
| NGC5713_e8 | 220.04475 | −0.28883 | 2.23 ± 0.02 | 0.70 ± 0.07 | 0.59 ± 0.06 | −0.20 ± 0.19 | 90 ± 10 | −0.85 ± 0.05 | 0.2 ± 0.06 | −0.72 ± 0.11 | 0.33 ± 0.11 |
| NGC5713_e2 | 220.04550 | −0.29333 | 2.44 ± 0.01 | 0.51 ± 0.06 | 0.36 ± 0.05 | −0.44 ± 0.22 | 62 ± 29 | −1.07 ± 0.06 | −0.45 ± 0.06 | −1.1 ± 0.21 | −0.48 ± 0.21 |
| NGC5713_e9 | 220.04608 | −0.28867 | 2.19 ± 0.03 | 0.70 ± 0.07 | 0.53 ± 0.05 | −0.37 ± 0.19 | 71 ± 23 | −0.91 ± 0.05 | 0.22 ± 0.08 | −0.88 ± 0.15 | 0.25 ± 0.16 |
| NGC5713_e7 | 220.04750 | −0.28875 | 2.39 ± 0.01 | 2.59 ± 0.26 | 1.95 ± 0.20 | −0.36 ± 0.18 | 71 ± 22 | −0.34 ± 0.04 | 0.38 ± 0.05 | −0.3 ± 0.14 | 0.42 ± 0.14 |
| NGC5713_e4 | 220.05150 | −0.28900 | <2.16 | 0.06 ± 0.01 | 0.08 ± 0.01 | 0.32 ± 0.56 | 100 | −1.56 ± 0.19 | >−0.39 | −1.56 ± 0.19 | >−0.39 |
| NGC5713_e6 | 220.05267 | −0.28867 | 2.35 ± 0.03 | 0.27 ± 0.04 | 0.24 ± 0.03 | −0.16 ± 0.26 | 94 ± 6 | −1.25 ± 0.06 | −0.44 ± 0.09 | −1.1 ± 0.14 | −0.29 ± 0.15 |
| NGC6946_e5 | 308.58284 | 60.16850 | <1.99 | 1.30 ± 0.13 | 1.48 ± 0.15 | 0.16 ± 0.18 | 100 | −1.27 ± 0.08 | >0.23 | −1.27 ± 0.08 | >0.23 |
| NGC6946_e6 | 308.58921 | 60.17167 | <1.99 | 0.70 ± 0.08 | 0.61 ± 0.06 | −0.18 ± 0.19 | 92 ± 8 | −1.84 ± 0.05 | >−0.13 | −1.69 ± 0.1 | >0.01 |
| NGC6946_e8 | 308.59457 | 60.17608 | <1.99 | 1.22 ± 0.13 | 1.10 ± 0.11 | −0.13 ± 0.19 | 97 ± 3 | −1.58 ± 0.04 | >−0.07 | −1.42 ± 0.09 | >0.1 |
| NGC6946_e7 | 308.63450 | 60.17194 | <1.99 | 0.86 ± 0.09 | 0.93 ± 0.10 | 0.10 ± 0.19 | 100 | −1.48 ± 0.08 | >0.07 | −1.48 ± 0.08 | >0.07 |
| NGC6946_e1 | 308.66384 | 60.08131 | 1.78 ± 0.01 | 0.11 ± 0.02 | 0.14 ± 0.02 | 0.28 ± 0.32 | 100 | −2.31 ± 0.12 | −0.36 ± 0.13 | −2.31 ± 0.12 | −0.36 ± 0.13 |
| NGC6946_e11 | 308.70777 | 60.21131 | 1.60 ± 0.03 | 0.01 ± 0.01 | 0.01 ± 0.01 | 2.24 ± 3.38 | 100 | −3.31 ± 0.29 | −1.01 ± 0.3 | −3.31 ± 0.29 | −1.01 ± 0.3 |
| NGC6946_e12 | 308.71331 | 60.21172 | <1.62 | 0.05 ± 0.01 | 0.06 ± 0.01 | 0.10 ± 0.50 | 100 | −2.69 ± 0.19 | >−0.43 | −2.69 ± 0.19 | >−0.43 |
| NGC6946_e13 | 308.71767 | 60.21214 | 1.82 ± 0.02 | 0.01 ± 0.01 | 0.04 ± 0.01 | 1.95 ± 1.45 | 100 | −2.82 ± 0.16 | −0.95 ± 0.17 | −2.82 ± 0.16 | −0.95 ± 0.17 |
| NGC6946_n1 | 308.71775 | 60.15397 | <2.23 | 19.4 ± 1.94 | 12.7 ± 1.27 | −0.54 ± 0.18 | 49 ± 25 | −0.52 ± 0.04 | >0.52 | −0.65 ± 0.23 | >0.39 |
| NGC6946_e10 | 308.77567 | 60.18233 | 1.58 ± 0.05 | 0.11 ± 0.02 | 0.11 ± 0.02 | 0.02 ± 0.28 | 100 | −2.41 ± 0.13 | −0.07 ± 0.16 | −2.41 ± 0.13 | −0.07 ± 0.16 |
| NGC6946_e9 | 308.77936 | 60.17925 | <1.62 | 0.11 ± 0.01 | 0.08 ± 0.02 | −0.37 ± 0.40 | 70 ± 30 | −2.69 ± 0.09 | >−0.42 | −2.67 ± 0.31 | >−0.4 |
| NGC6946_e4 | 308.79619 | 60.14929 | <1.99 | 1.23 ± 0.13 | 1.23 ± 0.13 | 0.01 ± 0.19 | 100 | −1.35 ± 0.09 | >0.16 | −1.35 ± 0.09 | >0.16 |
| NGC6946_e2 | 308.80389 | 60.14729 | 1.85 ± 0.01 | 0.46 ± 0.05 | 0.46 ± 0.05 | −0.02 ± 0.21 | 100 | −1.78 ± 0.10 | 0.02 ± 0.1 | −1.78 ± 0.1 | 0.02 ± 0.1 |
| NGC6946_e3 | 308.80875 | 60.14771 | <1.62 | 0.06 ± 0.01 | 0.07 ± 0.01 | 0.07 ± 0.51 | 100 | −2.61 ± 0.20 | >−0.34 | −2.61 ± 0.2 | >−0.34 |
Note. Column (1): Region identifier, with "n" and "e" indicating the location of the region within the galaxy: "n"—nuclear (within 250 pc of the galaxy center), "e"—extranuclear. Columns (2) and (3): Region coordinates. Column (4): Region effective radius. For regions with areas smaller than the matched 15–33 GHz synthesized beam (i.e., unresolved), the effective radius of the synthesized beam is reported and marked as an upper limits ("<"). Column (5): 15 GHz flux density. Column (6): 33 GHz flux density. Column (7): 15–33 GHz spectral index. Column (8): Thermal fraction at 33 GHz, estimated from column (6) using Equation (4). Column (9): SFRs derived from total 33 GHz continuum emission from column (6) using Equation (5). Column (10): SFR surface density. For unresolved regions, the reported values are lower limits, indicated with ">." Column (11): Thermal-only SFR derived from 33 GHz flux in column (6) and 15–33 GHz spectral index from column (7), using Equation (6). Column (12): Thermal-only SFR surface density. For unresolved regions, the reported values are lower limits, indicated with ">."
A machine-readable version of the table is available.
Footnotes
- 17
While the fundamental accuracy of flux density scale calibration is 3%–5%, here we conservatively assume an accuracy of 10% instead since flux density calibrators and complex gain calibrators were not observed at similar elevations given the nature of our snapshot observations. See https://science.nrao.edu/facilities/vla/docs/manuals/oss/performance/fdscale.