


Abstract
We investigate the non-local thermodynamic equilibrium (non-LTE, hereafter NLTE) analysis for Cu i lines with the updated model atom that includes quantum-mechanical rate coefficients of Cu + H and Cu+ + H− inelastic collisions from the recent study of Belyaev et al. The influence of these data on NLTE abundance determinations has been performed for six metal-poor stars in a metallicity range of −2.59 dex ≤ [Fe/H] ≤ −0.95 dex. For Cu i lines, the application of accurate atomic data leads to a decrease in the departure from LTE and lower copper abundances compared to that obtained with Drawin's theoretical approximation. To verify our adopted copper atomic model, we also derived the LTE copper abundances of Cu ii lines for the sample stars. A consistent copper abundance from the Cu i (NLTE) and Cu ii (LTE) lines has been obtained, which indicates the reliability of our copper atomic model. It is noted that the [Cu/Fe] ratios increase with increasing metallicity when ∼−2.0 dex < [Fe/H] < ∼−1.0 dex, favoring a secondary (metallicity-dependent) copper production.
Export citation and abstract BibTeX RIS

Original content from this work may be used under the terms of the Creative Commons Attribution 4.0 licence. Any further distribution of this work must maintain attribution to the author(s) and the title of the work, journal citation and DOI.
1. Introduction
The investigation of the chemical compositions of stars encoded in stellar spectra is one of the fundamental problems in contemporary astrophysics (e.g., McWilliam & Rich 1994; Freeman & Bland-Hawthorn 2002; Asplund 2005; Kobayashi et al. 2011; Mashonkina 2014; Barklem 2016). Non-local thermodynamic equilibrium (non-LTE, hereafter NLTE) modeling of stellar spectra plays an important role in deriving both relative and absolute abundances for various chemical elements in stars, particularly in the case of metal-deficient objects. Contrary to LTE assumptions, NLTE modeling requires lots of information about the radiative and collision inelastic processes in collision with electrons and hydrogens. For a given atomic species, the mutual neutralization processes involving the collision of positive ions with hydrogen negative ions are also necessary. The main uncertainty for NLTE studies has often been introduced, due to the lack of reliable collisional data with hydrogen particles (Asplund 2005; Barklem 2016).
Copper is an interesting iron-peak element, which is theoretically thought to be synthesized in multiple nucleosynthetic processes (Bisterzo et al. 2004): (a) the weak s process (i.e., occurring in massive stars during core-helium, carbon-shell, and the explosive complete Ne burning stages, Woosley & Weaver 1995; Limongi & Chieffi 2003; Pignatari et al. 2010), or the main s process (i.e., taking place in low- and intermediate-mass asymptotic giant branch stars, Arlandini et al. 1999); (b) the explosive nucleosynthesis, either in long-lived Type Ia supernovae (Matteucci et al. 1993; Iwamoto et al. 1999; Travaglio et al. 2004; Fink et al. 2014), or in Type II supernovae (Timmes et al. 1995); (c) the weak sr process (i.e., operating during core He burning and during the subsequent convective shell C-burning phase in massive stars, Bisterzo et al. 2004). However, there is no consensus on the respective importance of the above processes. For instance, Matteucci et al. (1993), Mishenina et al. (2002), and Simmerer et al. (2003) supported the point that the main source of copper was SNe Ia. While Bisterzo et al. (2004) suggested that most Cu was synthesized by the weak sr process in massive stars, which was subsequently supported by the predictions of the Galactic chemical evolution (GCE) model of Romano & Matteucci (2007) and Romano et al. (2010). Therefore, detailed and reliable observations of Cu abundances can help to figure out the problem.
So far, most analyses of the copper abundances in stellar atmospheres adopted the LTE assumption. Shi et al. (2014) for the first time modeled Cu in the NLTE framework and pointed out that the important NLTE mechanism influencing the Cu i spectra was ultraviolet (UV) overionization and the NLTE effects were essential for deriving Cu abundances, which was later confirmed by Yan et al. (2015, 2016). Andrievsky et al. (2018) developed their own Cu atomic model, and determined the NLTE copper abundances within a wide metallicity range, −4.2 < [Fe/H] <−1.4. They found that the NLTE effects were strong for copper in metal-poor stars. Recently, Roederer & Barklem (2018) investigated the Cu abundances in six late-type metal-poor stars using the UV Cu ii lines that were supposedly free of the NLTE influence. They showed that the Cu abundances derived from Cu i and Cu ii lines differed from each other by 0.36 dex on average. Reanalyzing the Cu abundances of these six stars, Korotin et al. (2018) showed that their NLTE consideration of the Cu i lines removed the disparity between the abundances obtained from Cu i and Cu ii lines.
Reviewing previous works, it is easy to conclude that observable Cu i lines for low-metallicity stars are susceptible to the influence of NLTE effects and an accurate and detailed Cu model atom needs to be defined for NLTE calculations. Although both Shi et al. (2014) and Andrievsky et al. (2018) built their respective Cu atomic models for NLTE calculations, the NLTE corrections in these two models are slightly different: Andrievsky et al. (2018) obtained higher NLTE corrections compared to those given by Shi et al. (2018). The accuracy of NLTE calculations depends on the important inelastic collision processes with hydrogen. For collisions with hydrogen, both studies used the so-called Drawin formula (Drawin 1968, 1969; Steenbock & Holweger 1984). However, from comparisons with full quantum calculations for several elements, including Li, O, Na, Mg, Ca, and Ni atoms (Belyaev et al. 1999; Belyaev & Barklem 2003; Belyaev et al. 2010; Guitou et al. 2011; Belyaev et al. 2012, 2018, 2019; Voronov et al. 2022), it is found that the classic formula is not reliable and fails to describe the underlying mechanisms existing in inelastic collisions with hydrogen (Barklem et al. 2011). A common approach to correcting for inadequacies in the Drawin recipe is to scale the rate coefficients by an empirical factor SH. We note that a scale of SH = 0.1 was used by Shi et al. (2014), which was later tested in a series of works (Yan et al. 2015, 2016; Shi et al. 2018; Xu et al. 2019, 2020). Therefore, the differences in both copper atomic models may lead to the discrepancy between the two works.
As full quantum calculations are time consuming, especially for the quantum-chemical data, the above approximate approaches are often in use. Until recently, Belyaev et al. (2021) investigated the inelastic processes in low-energy Cu + H and Cu+ + H− collisions (306 partial processes in total) considering the fine-structure effects. And it provides us with an opportunity to explore the influence on the NLTE effects of copper lines when using accurate data.
The present study is motivated by the appearance of quantum-mechanical rate coefficients for inelastic collisions with hydrogen performed by Belyaev et al. (2021). In this paper, we investigate how the use of data from Belyaev et al. (2021) affects the derived copper abundances for a sample of metal-poor stars with a metallicity of −2.59 dex ≤ [Fe/H] ≤ −0.95 dex, and on the trend of [Cu/Fe] versus [Fe/H]. Meanwhile, we aim to independently estimate the reliability of our old and newly updated copper atomic model. The observations are briefly summarized in Section 2. Stellar parameters, atomic line data, model atmospheres, and the atomic model are described in Section 3. The results and discussion are given in Section 4. And our conclusions are presented in Section 5.
2. Observations
The stellar sample analyzed is the same as in Roederer & Barklem (2018) and Korotin et al. (2018), and was detailedly described in the above papers. The UV spectra were downloaded from the Mikulski Archive for Space Telescopes (MAST), which were collected with the Space Telescope Imaging Spectrograph (Kimble et al. 1998; Woodgate et al. 1998) on board the Hubble Space Telescope. The resolved power was R = 114,000. Most of the investigated Cu i lines and all of the Cu ii lines are situated in the UV spectra. For all program stars, the following lines are detectable in the spectral range: Cu i 2024 Å and Cu ii 2037, 2054, 2104, 2112, 2126, and 2148 Å. Besides, for HD 84937, HD 94028, and HD 140283, the following lines also can be found in those spectra: Cu i 2165, 2199, 2225, 2227, and 2230 Å, and Cu ii 2189 and 2247 Å.
The high-resolution UVES optical spectra have been used to supplement the UV spectra and they were obtained from the European Southern Observatory (ESO) Science Archive Facility. This enables us to employ two resonant UV lines of 3247 and 3274 Å. For HD 76932 and HD 94028, the optical subordinate lines of 5105, 5153, and 5218 Å are also included in our analysis.
3. Method of Calculation
3.1. Stellar Parameters
The stellar parameters of our program stars are adopted from Roederer & Barklem (2018), and they have also been used by Korotin et al. (2018). Briefly, the effective temperature Teff was calculated from the Casagrande et al. (2010) metallicity-dependent color Teff calibrations. The surface gravity log g was obtained from fundamental relations (Roederer & Barklem 2018; see formula (1)), which were based on the Hipparcos and Tycho-2 Gaia parallaxes and the masses estimated by Casagrande et al. (2010). It needs to be pointed out that the log g values calculated from the newly released Gaia EDR3 data are very similar to what is used here, and the differences are less than 0.02 dex. The metallicity [Fe/H] and microturbulence velocity ξ were determined via an iterative process with Fe i and Fe ii lines. For the reader's convenience, the stellar parameters are repeated in Table 1.
Table 1. Stellar Parameters for the Studied Stars
| Star | Teff | log g | (Fe/H) | ξ |
|---|---|---|---|---|
| (K) | (cgs) | (dex) | (km s−1) | |
| HD 19445 | 6070 | 4.44 | −2.12 | 1.60 |
| HD 76932 | 5945 | 4.17 | −0.95 | 1.10 |
| HD 84937 | 6427 | 4.14 | −2.16 | 1.45 |
| HD 94028 | 6097 | 4.34 | −1.52 | 1.30 |
| HD 140283 | 5766 | 3.64 | −2.59 | 1.30 |
| HD 160617 | 6050 | 3.91 | −1.89 | 1.50 |
Download table as: ASCIITypeset image
3.2. Atomic Line Data
The copper lines used in this study are taken from Korotin et al. (2018), and the wavelength (λ), low excitation potential (Elow), and oscillator strengths (log gf) are listed in Table 2. It needs to be pointed out that we do not use all the lines, and the Cu i 2214 Å line is discarded in our analysis because it is blended with other lines for our program stars. For the optical copper lines, the ratio between the two copper isotopes (63Cu and 65Cu) is adopted as 0.69:0.31 (Asplund et al. 2009), and the hyperfine structures have been taken into account. Table 2 presents the mean wavelengths and average oscillator strengths. A detailed list of the wavelengths and oscillator strengths can be found in Shi et al. (2014, 2018). While for the UV lines, the hyperfine structures have not been considered, and the oscillator strengths are adopted from Korotin et al. (2018). As described in their work, the log gf values of the Cu ii lines are taken from Dong & Fritzsche (2005), and those for most neutral UV copper lines are taken from Kurucz (2011). In addition, for the Cu i 2024 Å and 2165 Å lines, the data are respectively from Lindgård et al. (1980) and Morton (1991).
Table 2. Atomic Data of the Copper Lines
| λ | Elow | log gf |
|---|---|---|
| (Å) | (ev) | |
| Cu i | ||
| 2024.325 | 0.0 | −1.75 |
| 2024.338 | 0.0 | −1.46 |
| 2165.096 | 1.3889 | −0.84 |
| 2199.586 | 1.3889 | 0.45 |
| 2199.754 | 1.6422 | 0.34 |
| 2225.705 | 0.0 | −1.20 |
| 2227.776 | 1.6422 | 0.46 |
| 2230.086 | 1.3889 | 0.64 |
| 3247.54 | 0.0 | −0.21 |
| 3273.95 | 0.0 | −0.50 |
| 5105.54 | 1.3890 | −1.64 |
| 5153.23 | 3.7859 | −0.01 |
| 5218.20 | 3.8167 | 0.28 |
| Cu ii | ||
| 2037.127 | 2.8327 | −0.28 |
| 2054.979 | 2.8327 | −0.30 |
| 2104.796 | 2.9754 | −0.60 |
| 2112.100 | 3.2564 | −0.14 |
| 2126.044 | 2.8327 | −0.32 |
| 2148.984 | 2.7188 | −0.49 |
| 2189.630 | 3.2564 | −0.39 |
| 2247.003 | 2.7188 | 0.10 |
Download table as: ASCIITypeset image
3.3. Model Atmospheres
For each star, we compute the 1D LTE MARCS atmospheric models, which are obtained by interpolation in the grid of plane-parallel MARCS models for 3.5 dex ≤ log g ≤ 5.5 dex (see Gustafsson et al. 2008, for details). For each individual model, the α enhancement is under consideration, as described below:
3.4. Updated Atomic Model
For our NLTE calculations, we adopt the copper atomic model from Shi et al. (2014) as a basis. It contains 97 energy levels (96 Cu i levels and the Cu ii ground state) and 1089 line transitions of Cu i. The fine structures of the levels with low excitation energy are included, and the transition oscillator strengths and the photoionization cross sections from Liu et al. (2014) are introduced into our atomic model. To calculate the excitation of allowed and forbidden transitions by electron collisions, we use the formulae of van Regemorter (1962) and Allen (1973), respectively. And the formula of Seaton (1962) is used to calculate the collisional ionization rates.
A novelty of this study is that we take into account the mutual neutralization, ion-pair formation, excitation, and de-excitation inelastic processes in copper-hydrogen collisions according to the data from Belyaev et al. (2021) (hereafter the new model). Previously, for the calculation of the inelastic collisions with hydrogen, we used Drawin's formula (Drawin 1968, 1969), which was described by Steenbock & Holweger (1984) with a scaling factor of SH = 0.1 following the suggestion of Shi et al. (2014) (hereafter the old model).
In order to solve the statistical equilibrium and the coupled radiative transfer equations, we employ the revised DETAIL code (Butler & Giddings 1985), which is based on an accelerated lambda iteration method (Rybicki & Hummer 1991, 1992), to calculate the NLTE occupation numbers for the copper atomic model. Then, the obtained departure coefficients are used to compute the synthetic line profiles via the Spectrum Investigation Utility program (Reetz 1991).
4. Results and Discussion
4.1. Stellar Copper Abundances
The LTE and NLTE copper abundances in our six program stars are derived through the spectral synthesis method based on the Cu i and Cu ii lines. Abundance determination in this way is an iterative process and we change the copper abundances until the differences between the synthetic spectra and the observed ones are minimized.
Figure 1 illustrates the observed and synthetic line profiles of eight copper lines: the upper panel shows the profiles of four Cu i lines, and the lower panel presents the four Cu ii line profiles of HD 94028. In this figure, the LTE and NLTE profiles of the copper lines are indicated by the red dotted lines and the black solid lines, respectively. It needs to be pointed out that the LTE and NLTE profiles are synthesized with the same abundance for the Cu i line in the upper panel of Figure 1, and the LTE assumptions underestimate the Cu abundances.

Figure 1. Synthetic profiles of Cu i lines (upper panel) and Cu ii lines (lower panel) for HD 94028. The filled squares are the observed spectra, the black solid line is the best-fitting synthesis (NLTE synthesis), and the red dotted line is the LTE profile with the same [Cu/Fe] relative to the NLTE.
Download figure:
Standard image High-resolution imageIn Table 3, we present the [Cu/Fe] values derived from the line profile fitting of individual Cu i lines and the mean results along with the standard deviation. The LTE abundances of each star are shown in the first row, while the NLTE results based on the new and old copper atomic model are indicated in the second and third row, respectively. Considering that the copper abundances are mostly derived based on the UV copper lines, the uncertainty in abundance determination mainly comes from the indeterminacy of continuum determination, which can vary from 0.05 to 0.1 dex for a 1% shift from the true continuum flux level. Through inspection of Table 3, it can be found that the NLTE corrections, ΔNLTE = [Cu i/Fe]NLTE − [Cu i/Fe]LTE, are evident for both copper atomic models, and the effects differ from line to line even for the same star. The NLTE corrections vary from 0.05 to 0.39 dex and 0.08 to 0.42 dex, for the new and old copper model, respectively. In Figure 2, the upper panel presents the NLTE corrections for resonance (filled pentagrams) and UV Cu i lines (open pentagrams) based on the new copper atomic model. It can be seen that the NLTE corrections decrease with increasing metallicity, which has been reported in previous studies (Yan et al. 2015; Andrievsky et al. 2018; Korotin et al. 2018; Shi et al. 2018; Xu et al. 2019, 2020). The NLTE corrections have no relation to the adopted Cu i lines. The lower panel shows the NLTE corrections for our two copper atomic models (filled circles denote the new model, while open circles represent the old one), and it indicates that the same feature (i.e., the NLTE corrections decrease with increasing metallicity) exists. Theoretically, if the [Fe/H] increases, UV line blocking will increase rapidly, and the overionization will become less important. Therefore, the NLTE correction, as expected, will decrease with increasing [Fe/H]. Meantime, it is clear that the NLTE corrections for the new model are lower than the old one, indicating that the application of accurate atomic data leads to a decrease in the departure from LTE.
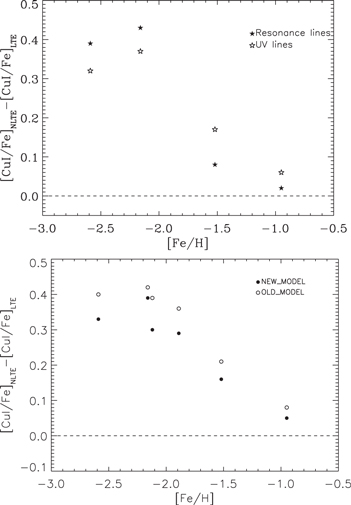
Figure 2. The NLTE corrections to the LTE copper abundances derived from Cu i lines as a function of [Fe/H].
Download figure:
Standard image High-resolution imageTable 3. [Cu/Fe] for Cu i Lines Based on New and Old Copper Atomic Models
| Star | 3247 Å | 3274 Å | 5105 Å | 5153 Å | 5218 Å | 2024 Å | 2165 Å | 2199 Å | 2225 Å | 2227 Å | 2230 Å | Mean+σ | ΔNLTE |
|---|---|---|---|---|---|---|---|---|---|---|---|---|---|
| HD 19445 | −0.68 | −0.73 | ⋯ | ⋯ | ⋯ | ⋯ | ⋯ | ⋯ | ⋯ | ⋯ | ⋯ | −0.71 ± 0.02 | |
| −0.40 | −0.41 | ⋯ | ⋯ | ⋯ | ⋯ | ⋯ | ⋯ | ⋯ | ⋯ | ⋯ | −0.41 ± 0.01 | 0.30 | |
| −0.31 | −0.33 | ⋯ | ⋯ | ⋯ | ⋯ | ⋯ | ⋯ | ⋯ | ⋯ | ⋯ | −0.32 ± 0.01 | 0.39 | |
| HD 76932 | −0.20 | −0.18 | −0.21 | −0.22 | −0.27 | −0.20 | ⋯ | ⋯ | ⋯ | ⋯ | ⋯ | −0.21 ± 0.03 | |
| −0.18 | −0.17 | −0.11 | −0.16 | −0.22 | −0.14 | ⋯ | ⋯ | ⋯ | ⋯ | ⋯ | −0.16 ± 0.04 | 0.05 | |
| −0.17 | −0.16 | −0.06 | −0.12 | −0.17 | −0.10 | ⋯ | ⋯ | ⋯ | ⋯ | ⋯ | −0.13 ± 0.04 | 0.08 | |
| HD 84937 | −0.78 | −0.74 | ⋯ | ⋯ | ⋯ | ⋯ | −0.72 | −0.74 | −0.70 | −0.72 | −0.75 | −0.74 ± 0.03 | |
| −0.35 | −0.32 | ⋯ | ⋯ | ⋯ | ⋯ | −0.35 | −0.38 | −0.36 | −0.36 | −0.35 | −0.35 ± 0.02 | 0.39 | |
| −0.30 | −0.28 | ⋯ | ⋯ | ⋯ | ⋯ | −0.31 | −0.35 | −0.33 | −0.33 | −0.32 | −0.32 ± 0.02 | 0.42 | |
| HD 94028 | −0.45 | −0.47 | −0.50 | ⋯ | ⋯ | −0.45 | −0.46 | −0.49 | −0.45 | −0.50 | −0.49 | −0.47 ± 0.02 | |
| −0.37 | −0.39 | −0.28 | ⋯ | ⋯ | −0.29 | −0.27 | −0.33 | −0.30 | −0.31 | −0.28 | −0.31 ± 0.04 | 0.16 | |
| −0.30 | −0.33 | −0.23 | ⋯ | ⋯ | −0.23 | −0.21 | −0.29 | −0.24 | −0.26 | −0.23 | −0.26 ± 0.04 | 0.21 | |
| HD 140283 | −0.71 | −0.56 | ⋯ | ⋯ | ⋯ | ⋯ | −0.53 | −0.54 | −0.54 | −0.48 | −0.58 | −0.56 ± 0.07 | |
| −0.32 | −0.18 | ⋯ | ⋯ | ⋯ | ⋯ | −0.19 | −0.24 | −0.21 | −0.17 | −0.27 | −0.23 ± 0.05 | 0.33 | |
| −0.24 | −0.11 | ⋯ | ⋯ | ⋯ | ⋯ | −0.12 | −0.19 | −0.15 | −0.12 | −0.21 | −0.16 ± 0.05 | 0.40 | |
| HD 160617 | −0.69 | −0.62 | ⋯ | ⋯ | ⋯ | ⋯ | ⋯ | ⋯ | ⋯ | ⋯ | ⋯ | −0.66 ± 0.04 | |
| −0.40 | −0.33 | ⋯ | ⋯ | ⋯ | ⋯ | ⋯ | ⋯ | ⋯ | ⋯ | ⋯ | −0.37 ± 0.04 | 0.29 | |
| −0.33 | −0.27 | ⋯ | ⋯ | ⋯ | ⋯ | ⋯ | ⋯ | ⋯ | ⋯ | ⋯ | −0.30 ± 0.03 | 0.36 |
Note. The LTE abundances of each star are shown in the first row, while the NLTE results, respectively, based on new and old copper atomic models, are indicated in the second and third row.
Download table as: ASCIITypeset image
4.2. Influence of Inelastic Collisions with Hydrogen on the Cu Abundance
Figure 3 displays the mean differences between the NLTE Cu abundances derived from the Cu i lines for the new and old copper atomic models as functions of effective temperature, surface gravity, and metallicity.
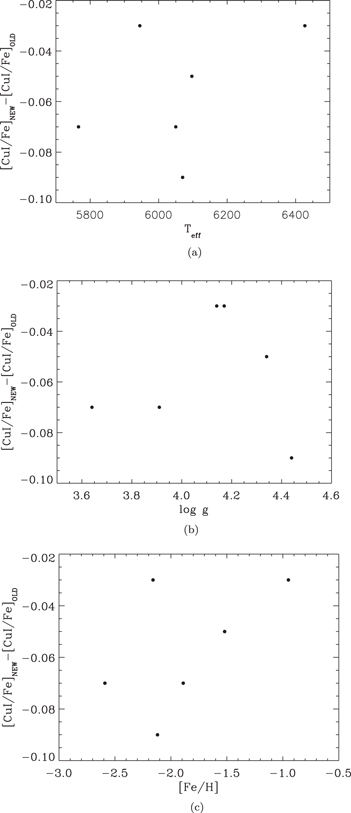
Figure 3. The mean differences between the NLTE abundances derived from the Cu i lines for the new and old copper atomic models as functions of the stellar atmospheric parameters.
Download figure:
Standard image High-resolution imageWe find the difference in NLTE abundance depends on the metallicity with a range from −0.09 to −0.03 dex. The difference between the NLTE abundances derived with the new (accurate data) and old (approximate data) models diminishes with increasing metallicity, because, in more metal-rich stars, the collision with electrons become more important. Moreover, it can be seen that the differences are negative, which indicates that the application of accurate data for our program stars leads to lower NLTE Cu abundances.
4.3. Verify the Adopted Copper Atomic Model
In Table 4, we give the LTE copper abundances determined with individual Cu ii lines. The penultimate column shows the difference between the copper abundances derived from Cu i (NLTE) and Cu ii (LTE) lines for the new copper atomic model. The difference varies from −0.02 to 0.04 dex, which can be explained by the standard deviation in the mean results. Theoretically, as the copper atoms are mainly remaining in the ionization state in the metal-poor stars, the Cu ii lines are supposedly free of the NLTE influence. The nearly same abundance both from the lines of two ionization stages suggests that our new atomic model is valid.
Table 4. [Cu/Fe] for Cu ii under LTE Conditions
| Star | 2037 Å | 2054 Å | 2104 Å | 2112 Å | 2126 Å | 2148 Å | 2189 Å | 2247 Å | mean+σ | [Cu i/Fe]−[Cu ii/Fe] | [Cu/Fe] |
|---|---|---|---|---|---|---|---|---|---|---|---|
| HD 19445 | −0.50 | −0.48 | −0.42 | −0.42 | −0.49 | −0.40 | ⋯ | ⋯ | −0.45 ± 0.04 | +0.04 | −0.44 |
| HD 76932 | −0.21 | −0.16 | −0.13 | ⋯ | −0.15 | ⋯ | ⋯ | ⋯ | −0.16 ± 0.03 | 0.00 | −0.16 |
| HD 84937 | −0.31 | −0.34 | −0.30 | ⋯ | −0.38 | ⋯ | ⋯ | −0.38 | −0.34 ± 0.04 | −0.01 | −0.35 |
| HD 94028 | −0.42 | −0.40 | −0.30 | −0.15 | −0.29 | −0.15 | −0.29 | ⋯ | −0.29 ± 0.10 | −0.02 | −0.30 |
| HD 140283 | ⋯ | −0.20 | ⋯ | −0.27 | −0.23 | −0.19 | ⋯ | −0.22 | −0.22 ± 0.03 | −0.01 | −0.22 |
| HD 160617 | −0.42 | −0.38 | ⋯ | −0.31 | −0.39 | ⋯ | ⋯ | ⋯ | −0.38 ± 0.05 | +0.01 | −0.37 |
Download table as: ASCIITypeset image
To more visually verify our adopted copper atomic model, we present the abundance differences as a function of [Fe/H] in Figure 4. The upper panel shows the differences for the resonance and UV lines based on the new model. Obviously, not only for the resonance lines but also for the UV lines, the same conclusion can be drawn as described in the above paragraph. The lower panel presents the differences for our new and old models. It can be seen that the difference is negligible for both models when the errors of abundances are considered. Besides, it is noted that although the inelastic collisions with hydrogen are obtained with approximate formulas for the old model, our old atomic model is also valid to analyze the NLTE copper abundances to some extent.

Figure 4. Differences between the Cu abundances derived from the Cu i (NLTE) and Cu ii (LTE) lines for our new and old copper atomic models. The same symbols are used as in Figure 2.
Download figure:
Standard image High-resolution image4.4. Comparison with Other Work
Several groups have derived copper abundances for metal-poor stars under both LTE and NLTE assumptions. We compare our results with those from other works and discuss the reasons for the differences.
Yan et al. (2015, 2016) derived the copper abundances of a large number of metal-poor stars with the Cu i lines at 5105.5, 5218.2, and 5782.1 Å. Their results are in good agreement with ours, and the average difference between our NLTE abundances and theirs is −0.02 ± 0.03 for the two common stars.
Andrievsky et al. (2018) developed a model atom for Cu and investigated the NLTE effects of Cu i lines in very metal-poor stars. We have three objects in common with theirs, i.e., HD 84937, HD94028, and HD 140283. For HD 84937, their NLTE result is 0.15 dex higher than ours, while it is 0.13 for HD 94028. For HD 140283, both results agree well (0.03 dex), since similar stellar parameters have been adopted in these two works, which cannot explain the differences. Besides, we note that both studies used different log gf values for the five common optical lines, and their values are generally higher than ours of 0.11 ± 0.07 dex. Theoretically, it will lead to lower [Cu/Fe] ratios compared to ours. However, they derived higher NLTE copper abundances. The reason is that the different copper atomic model adopted in NLTE calculations for both works, e.g., for the inelastic collisions with hydrogen, Andrievsky et al. (2018) used the Drawin formula, while our work uses the data from Belyaev et al. (2021).
Roederer & Barklem (2018) made a new test of copper abundances in late-type stars using ultraviolet Cu ii lines and concluded that LTE underestimated the Cu abundances obtained from Cu i lines. As their work has no NLTE results, we compare their Cu ii LTE abundances with ours. For HD 19445, HD 76932, and HD 94028, the results of both works agree well. While for HD 160617, our LTE result is 0.16 dex higher than theirs, which can be explained by the difference of continuum determination. However, for HD 84937 and HD 140283, our results are 0.30 and 0.49 dex higher, respectively. We note that the numbers of copper lines used by both works are different. It is noted that, except for the eight common copper lines from Roederer & Barklem (2018), we include another 11 UV lines. For the eight common lines, Roederer & Barklem (2018) adopted their log gf values from the NIST Atomic Spectra Database, which are higher than ours. While our log gf values are mainly adopted from previous literature (see Section 3.2), and have been tested by Korotin et al. (2018), the average difference of the log gf values is 0.08 ± 0.06 dex for the eight common lines. Thus, the difference between the log gf values can lead to a discrepancy of about 0.1 dex in copper abundance. Moreover, the statistical uncertainties include contributions from the uncertainty of line fitting and log gf values have been listed in Table 7 of Roederer & Barklem (2018), and the values are 0.19 and 0.29 dex. Considering the abovementioned factors, the large differences can be explained.
Based on the high-resolution, high signal-to-noise ratio UVES spectra, Shi et al. (2018) determined the copper abundances of 29 metal-poor stars. There are four common stars between both studies. For HD 76932 and HD 84937, both results agree well, while for HD 140283 and HD 160617, their abundances are 0.41 and 0.33 dex lower than ours. For these two stars, we note that the adopted stellar parameters are different in both works, which will lead to the large differences. For HD 140283, both studies used similar Teff and log g values, while their [Fe/H] and ξ values are 0.18 and 0.2 dex higher than ours. For HD 160617, although both works used the same ξ (1.5 km s−1), their Teff and log g are 110 K and 0.11 dex lower than our values, and their [Fe/H] ratio is 0.11 dex higher than ours. When we used the same parameters as Shi et al. (2018) to derive the copper abundances for the two stars, the differences will decrease to 0.13 and 0.10 dex, which can be explained by the impact of continuum determination.
Using the same stars and stellar parameters with Roederer & Barklem (2018), Korotin et al. (2018) checked the consistency between the copper abundance for ultraviolet Cu ii lines and Cu i lines, and showed that their NLTE results of the Cu i lines removed disagreement between these two sets of lines presented in the former work. For the six common stars, the average difference between their [Cu I/Fe] values and ours is 0.14 ± 0.07 dex, while it is 0.05 ± 0.11 dex between their [Cu II/Fe] values and our results. As we note they adopted the same copper atomic model with Andrievsky et al. (2018), and their [Cu I/Fe] ratios in NLTE assumptions are systematically higher than ours, which is due to the difference between adopted copper atomic models.
4.5. The Galactic [Cu/Fe] Trend
The [Cu/Fe] ratios play an important role in revealing the nature of Cu nucleosynthesis and constraining the GCE model. In Figure 5 we illustrate the Cu abundances derived in this study. The left panel of Figure 5 compares the NLTE [Cu/Fe] ratios determined from the Cu i lines with a representative selection of previous works from the literature. The references are listed in the caption of Figure 5. It can be seen that our NLTE Cu abundances are consistent with the results of Shi et al. (2018), excluding the group of stars with low-α ratios as discussed by Shi et al. (2018). Meanwhile, our [Cu/Fe] ratios are systematically lower than those from Andrievsky et al. (2018) and Korotin et al. (2018), and we suggest it could be ascribed to the difference of adopted copper atomic models as discussed in Section 4.4. Moreover, through the whole metallicity range of our program stars, the features of the [Cu/Fe] trend have no large difference between the results when using the old and new models. There is only a downward shift in the [Cu/Fe] ratios with respect to that of the old model; namely the application of accurate collisional data for our sample stars leads to a lower NLTE copper abundance.

Figure 5. Derived Cu abundances. The left panel shows [Cu/Fe] derived from the Cu i lines for our program stars, which are designed by filled squares (new model) and open squares (old model). The samples of Andrievsky et al. (2018), Korotin et al. (2018), and Shi et al. (2018) are designed by open triangles, diamonds, and gray filled circles. The theoretical predictions of Kobayashi et al. (2020) (black solid line) are also presented. The right panel shows [Cu/Fe] derived from the Cu ii lines for our sample stars. The samples of Korotin et al. (2018) and Roederer & Barklem (2018), two stars analyzed by Andrievsky et al. (2018), one star analyzed by Roederer & Lawler (2012), and one star analyzed by Roederer et al. (2016) are also shown. Corresponding symbols are annotated in the figure.
Download figure:
Standard image High-resolution image
The right panel of Figure 5 presents the [Cu/Fe] ratios derived from Cu ii lines, and we can see that our LTE Cu abundances are overall in good agreement with the results in the literature. Although our sample stars are small, a feature of the [Cu/Fe] trend can still be found: it increases with increasing metallicity when ∼−2.0 < [Fe/H] < ∼−1.0 dex, which indicates that copper behaves as a secondary (metallicity-dependent) element. The rise of [Cu/Fe] ratios with increasing metallicity is most likely due to the metallicity-dependent Cu yields from the weak s process in massive stars (SN ii progenitors; Bisterzo et al. 2004). While in the metallicity range of [Fe/H] < ∼−2.0 dex, the feature is not clear due to the small sample of stars.
Many groups (e.g., Sneden et al. 1991; Timmes et al. 1995; Goswami & Prantzos 2000; Mishenina et al. 2002; Kobayashi et al. 2006; Romano & Matteucci 2007; Romano et al. 2010; Kobayashi et al. 2011, 2020) have attempted to model the Galactic evolution of copper. In Figure 5, we overplot the behavior of the [Cu/Fe] trend predicted by the GCE model from Kobayashi et al. (2020). We note that our [Cu/Fe] ratios are consistent with the model predictions in the metallicity range ∼−2.0 < [Fe/H] < ∼−1.0 dex. However, when [Fe/H] < ∼−2.0 dex, the model predictions cannot reproduce the [Cu/Fe] ratios. It needs to be pointed out that our sample of stars with metallicity less than ∼−2.0 dex, is small, and more extremely metal-poor stars are needed in future work to explain the discrepancy.
5. Conclusions
Our work mainly aims to perform the NLTE calculations for Cu i lines using the data from Belyaev et al. (2021) for inelastic collisions with hydrogen. We derived the NLTE and LTE abundances from the Cu i and Cu ii lines for six warm, metal-poor stars in the metallicity range of −2.59 ≤ [Fe/H] ≤ −0.95. Despite the small sample of stars studied, we can still draw the following noticeable conclusions:
- 1.Our results show that the NLTE effects are obvious either for optical or ultraviolet Cu i lines, and confirm that the NLTE effects have a dependency on the metallicity, increasing with decreasing [Fe/H], found by Yan et al. (2015).
- 2.The application of accurate data leads to a decrease in the departure from LTE and lower NLTE copper abundances for neutral Cu lines.
- 3.When the uncertainties are taken into account, consistent abundances from the Cu i (NLTE) and Cu ii (LTE) lines are obtained. It suggests that our adopted copper atomic model is valid for investigating the formation of Cu i lines.
- 4.The [Cu/Fe] ratios increase with increasing metallicity when ∼−2.0 < [Fe/H] < ∼−1.0 dex, which indicates a secondary (metallicity-dependent) production of Cu.
To the best of our knowledge, this work is the first NLTE investigation of Cu i lines to explore the influence on NLTE effects and copper abundances using the theoretical hydrogen collision data. Our results indicate that it is essential to perform NLTE abundance analysis for both optical and UV Cu i lines in metal-poor stars.
Our research is partially supported by the Scholar Program of Beijing Academy of Science and Technology (DZ:BS202002). We acknowledge the science research grants from the China Manned Space Project with No. CMS-CSST-2021-B05. This work is also supported by the National Key R&D Program of China No. 2019YFA0405502, the National Natural Science Foundation of China under grant Nos. 12090040, 12090044, and 11833006. We acknowledge the data provided by the Mikulski Archive for Space Telescope (MAST) and the ESO Science Archive.