


Abstract
We present the results of a systematic search and analysis of GRBs detected by the Astrorivelatore Gamma ad Immagini LEggero (AGILE) MiniCALorimeter (MCAL; 0.4–100 MeV) over a time frame of 13 yr, from 2007 to 2020 November. The MCAL GRB sample consists of 503 bursts triggered by MCAL, 394 of which were fully detected onboard with high time resolution. The sample consists of about 44% short GRBs and 56% long GRBs. In addition, 109 bursts triggered partial MCAL onboard data acquisitions, providing further detections that can be used for joint analyses or triangulations. More than 90% of these GRBs were also detected by the AGILE Scientific RateMeters (RMs), providing simultaneous observations between 20 keV and 100 MeV. We performed spectral analysis of these events in the 0.4–50 MeV energy range. We could fit the time-integrated spectrum of 258 GRBs with a single power-law model, resulting in a mean photon index 〈β〉of−2.3. Among them, 43 bursts could also be fitted with a Band model, with peak energy above 400 keV, resulting in a mean low-energy photon index 〈α〉 = −0.6, a mean high-energy photon index 〈β〉 = −2.5, and a mean peak energy 〈Ep〉 = 640 keV. The AGILE MCAL GRB sample mostly consists of hard-spectrum GRBs, with a large fraction of short-duration events. We discuss properties and features of the MCAL bursts, whose detections can be used to perform joint broad-band analysis with other missions, and to provide insights on the high-energy component of the prompt emission in the tens of mega electron volt energy range.
Export citation and abstract BibTeX RIS

Original content from this work may be used under the terms of the Creative Commons Attribution 4.0 licence. Any further distribution of this work must maintain attribution to the author(s) and the title of the work, journal citation and DOI.
1. Introduction
Gamma-ray bursts (GRBs) are transient gamma-ray emissions produced by ultra-relativistic particles, accelerated in extragalactic central engines. Discovered in the late 1960s (Klebesadel et al. 1973), these events typically release isotropic energies on the order of Eiso ≳ 1051–1052 erg, representing the most luminous events occurring in the universe (Gehrels & Mészáros 2012). GRBs usually consist of a prompt phase, produced by initial inner shocks in outflows, followed by a so-called "afterglow" emission, involving a wide range of wavelengths, produced by the interaction of jets with the surrounding medium (Meszaros & Rees 1993; Wijers et al. 1997; Piran 2003). By means of their spectrum and their T90 time duration (i.e., the time over which the central 90% of the fluence is received, Kouveliotou et al. 1993), GRBs are historically divided in short GRBs and long GRBs. The short GRBs have T90 < 2 s and are characterized by a hard spectrum extending up to mega electron volt energies. They have been recently confirmed as the product of the mergers of binary neutron stars (BNS) by the joint detection of the gravitational wave (GW) event GW170817 revealed by the LIGO/Virgo (LV) experiments (Abbott et al. 2017a, 2017b, 2017c) and the short GRB 170817A detected by Fermi and INTEGRAL (Connaughton et al. 2017; Goldstein et al. 2017); nevertheless, they are thought to originate in neutron-star–black-hole systems as well (Belczynski et al. 2006; Nakar 2007; Baiotti & Rezzolla 2017). On the other hand, long GRBs exhibit softer spectra and T90 > 2 s and have been clearly associated with Type Ic core-collapse supernovae (Galama et al. 1998; Stanek et al. 2003).
GRB spectra can be usually described by a Band spectral model, a smoothly joint broken power law with a defined peak energy Ep (Band et al. 1993). Although GRBs typically release most of their energy in the prompt phase in the few kilo electron volt to few mega electron volt energy range, a fraction of them show extra high-energy components during the prompt and/or early afterglow phases, extending the spectrum up to hundreds mega electron volt or giga electron volt energies (Ajello et al. 2019). These events cannot be described by a simple Band model, but require additional power-law or cutoff power-law components, to justify the emission at such energies. These high-energy components are still not completely understood. They can occur during the prompt phase, suggesting an internal production mechanism due to inverse Compton (IC) scattered synchrotron photons of the prompt (Bošnjak et al. 2009); alternatively, they can come as extended and delayed emission, decaying in time as a power-law t−α , similarly to what occurs in afterglows, and suggesting a production arising from external shocks traveling in the surrounding medium (Ackermann et al. 2013). Some GRBs can present high-energy emissions both during the prompt and the afterglow phases.
2. Instrument
The Astrorivelatore Gamma ad Immagini LEggero (AGILE) is an Italian space mission devoted to high-energy astrophysics (Tavani et al. 2009). The satellite payload houses a suite of detectors that allow broad-band observation of Galactic and extragalactic sources in the 20 keV–50 GeV energy range.
The AGILE detectors consist of a tungsten-silicon tracker with imaging capabilities, sensitive in the 30 MeV–50 GeV energy range; a CsI(Tl) all-sky MiniCALorimeter (MCAL), sensitive in the 0.4–100 MeV energy range; a coded mask hard X-ray imager SuperAGILE (SA), sensitive in the 18–60 keV energy range; and surrounding scintillation detectors serving as an Anti-Coincidence (AC) system, sensitive in the 50–200 keV energy range. The silicon tracker and the MCAL detector constitute the so-called Gamma-Ray Imaging Detector (GRID). We point out that the simultaneous detection of a GRB by the GRID, MCAL, and SuperAGILE detectors would provide a broad-band observation of the burst, allowing a spectral coverage of over six orders of magnitude.
After the first two operative years, due to a failure of the onboard reaction wheel, AGILE lost its possibility to point at sources in the sky, starting to spin around its Sun-pointing axis with an angular velocity of one rotation every 7 minutes. Given the isotropic nature of GRBs, this issue did not affect the MCAL GRB detection capabilities. However, spinning has an effect on spectral analysis, as the angle under which GRBs are observed onboard varies in time, as well as the corresponding instrument response matrix. The effects of rotation are mostly negligible on typical GRB timescales, but long-lasting events with durations of several tens of seconds, or minutes, require accurate evaluations of appropriate response matrices throughout the burst duration. Only few very long-lasting GRBs have been detected in the "spinning period" and required such detailed treatment.
2.1. AGILE MCAL
The AGILE MiniCALorimeter (MCAL, Labanti et al. 2009) is a non-imaging gamma-ray scintillation detector, sensitive in the 400 keV–100 MeV energy range. It is composed of 30 CsI(Tl) scintillator bars (15 × 23 × 375 mm3 each), arranged in two orthogonal layers, providing a total on-axis geometrical area of ∼1400 cm2. At both ends of each bar, the readout of the scintillation light is performed by two custom PIN photodiodes (PDs). Although being a segmented detector, MCAL is not capable of localizing GRBs, but it can only allow a rough (>30°) reconstruction of the direction of the incoming photons for some incoming angles. Moreover, the energy released by the incoming radiation produces a track in the detector bars which can be used to discriminate photons from high-energy particles.
MCAL is a self-triggered instrument, whose detection logic is based on the principle that a transient event exceeding a given threshold above the background rate issues an onboard data acquisition. The background count rate depends on the timescale and the energy range, and it is evaluated by using different ratemeters working on different search integration time (SIT) windows and energy ranges. In particular, hardware logics work on short-duration timescales (i.e., 0.293, 1, and 16 ms), whereas software logics work on longer-duration timescales (i.e., 64, 256, 1024, and 8192 ms), and both are evaluated in three energy ranges (low energy, 0.3–1.4 MeV; medium energy, 1.4–3 MeV; high energy, 3–100 MeV). The 0.293 ms, or "sub-ms," search window is a unique feature of MCAL, playing a crucial role in the detection of very short-duration events in the high-energy regime, such as submillisecond terrestrial gamma-ray flashes (TGFs, Marisaldi et al. 2010, 2014). Triggers are issued whenever a given threshold count rate is reached above the background. This threshold depends on the involved SIT duration. Hardware logics, which work on short-duration timescales, adopt a static trigger logic, where the threshold count rate is fixed and independent on the background rate. On the other hand, software logics, which work on longer-duration timescales, adopt a flexible trigger logic, where the threshold count rate varies depending on the background rate. Both static and flexible thresholds can be fully configured onground. Whenever one or more of these logic thresholds are exceeded, MCAL issues a Burst-START condition, starting a data acquisition. When all ratemeters return to a normal background level, MCAL issues a Burst-STOP condition (which can also be forced after a given amount of time, in order to prevent mass memory saturation in the case that a normal background level is not encountered). Burst-START and Burst-STOP conditions determine the duration of the trigger acquisition. MCAL stores data in a cyclic buffer, including pre- and post-burst data acquisitions of time intervals occurring immediately before and after the Burst-START and Burst-STOP: the duration of these acquisitions depend on the triggered logic timescale, as well. It is important to notice that the trigger logic is implemented in the AGILE data-handling unit and its parameters are flexible and fully configurable onground. Energy and time information of each triggered event is sent to telemetry as photon-by-photon, with 2 μs time resolution, in order to limit energy and time binning by only counting statistics.
MCAL can work in two operative modes: GRID mode, in which MCAL acts as a slave to the silicon tracker, issuing triggered data acquisition whenever the silicon tracker detects a signal, and BURST mode, in which MCAL works as an independent self-triggering detector. Both operative modes can work at the same time.
Although not having imaging capabilities, MCAL constitutes a suitable detector for GRB science. First of all, it provides a continuous monitoring of an ideal ∼4π all-sky, only constrained by Earth occultations, not requiring GRBs to lay within a given FoV (as for GRID and SuperAGILE detectors). Moreover, it offers the opportunity to cover the energy range between tens of mega electron volts and 100 MeV, poorly investigated by other space missions. Finally, it can operate as an independent self-triggering detector down to very short-duration timescales (∼300 μs), allowing the detection of very fast transients.
A first MCAL GRB catalog was released by Galli et al. (2013), covering the first two years of the AGILE mission in the so-called "pointing mode." This sample consisted of 84 bursts detected between 2007 and 2009 November, which are included in the present catalog. The AGILE MCAL is part of the third Inter-Planetary Network (IPN), contributing to GRB localization by means of triangulation with other space missions. Moreover, MCAL actively contributed to the LIGO-Virgo O2 (2017) and O3 (2018–2019) observational runs, promptly reacting to GW detections and delivering upper limit fluences in the 0.4–100 MeV energy range on different timescales (Verrecchia et al. 2019).
2.2. Data of the AGILE Scientific Ratemeters
Data acquired by all AGILE detectors (i.e., Gamma-Ray Imaging Detector, GRID; MiniCALorimeter, MCAL; SuperAGILE, SA; and Anti-Coincidence, AC) are continuously recorded in telemetry, with 0.512 s (for SA) and 1.024 s (for GRID, MCAL, and AC) time resolution, independently on any trigger, to provide a continuous monitoring of the X- and gamma-ray background through orbital phases. Data of all detectors are used to build broad-band energy spectra, stored onboard to be directly telemetered down, one for each detection layer. Although designed to investigate the background modulation, the AGILE RMs clearly detect a large number of high-energy transients, such as GRBs, soft gamma repeaters, and solar flares, and it can work as an independent detectors as well. The coarse time resolution mostly makes RMs serve as a back-up or cross-check to other onboard detectors. From this perspective, MCAL RMs, operating in the same energy range of the MCAL detector, provide a useful tool to validate MCAL detections: long-lasting GRBs may be only partially acquired in MCAL-triggered data acquisitions, and their real duration can be only established by analyzing the associated RM continuous data stream. The AGILE RMs are routinely calibrated, comparing the detected GRBs with count rates and spectra reported for the same events detected by the IPN or other space missions.
3. Methods
The search and analysis of GRBs is performed in several steps. First, we carried out a cross-search between MCAL triggers and GRBs reported by the IPN network, in the time frame from 2007 to 2020 November: this allowed us to verify how many bursts were triggered onboard by MCAL. At the same time, we performed a blind search in the MCAL data, by using the MCAL GRB detection algorithm used for the automatic pipeline alert system: this allowed us to perform a search independently from trigger times and external times. In a second stage, we used MCAL RMs data to verify the real duration of the GRBs acquired onboard by MCAL and to classify them into fully acquired bursts (i.e., events for which the onboard triggered data acquisition completely covers the whole GRB duration) and incomplete bursts (i.e., events for which the onboard triggered data acquisition only provides a partial or fragmented detection). Finally, we retrieved all available sky localizations of the MCAL GRBs, provided by other space missions, or by IPN triangulations; for these events, we performed, when possible, spectral analysis of the time-integrated spectra, using different spectral models and retrieving information about the emitted flux, fluence, and isotropic equivalent energy.
3.1. Cross-search of IPN GRBs and MCAL Triggers
We analyzed the AGILE MCAL onboard triggers issued in the period from 2007 to 2020 November. This sample consisted of more than 106 trigger acquisitions, resulting in a total effective exposure time of ∼100 days (corresponding to the sum of all MCAL-triggered data acquisitions). We point out that the majority (>99%) of these triggers are spurious, due to instrumental background noise and charged particles crossing the detector, triggering especially the short-duration hardware timescales (sub-ms, 1, and 16 ms). This is ascribed to the lowering of the onboard trigger thresholds, adopted to enhance the detection sensitivity to short-duration transients and to increase the exposure time. We carried out a cross-check with the list of GRBs reported by the IPN (Hurley et al. 2013; IPN webpage: http://www.ssl.berkeley.edu/ipn3/), which, for the same period, included 4578 bursts detected by various space missions. Given the large number of events to consider, it is important to estimate the chance match probability. The MCAL onboard trigger configuration underwent a number of modifications through the years, making the detection rate not uniform in time, as shown in Figure 1; for this reason, we cannot provide a stable MCAL GRB detection rate, but only a total number of triggers, equal to Ntrg = 1047679 events. On the other hand, the IPN burst rate is quite stable since 2007/2008, as the number of space missions devoted to GRB detection remained quite constant: 4578 GRBs have been reported in 13 yr, corresponding to an average detection rate of ∼350 GRBs yr−1, or rIPN ∼ 1.1 × 10⁻⁵ Hz. GRBs exhibit different time profiles depending on the considered energy range. As a consequence, since MCAL operates in the >400 keV energy range, we expect that the MCAL trigger T0s do not always coincide with T0s reported by other space missions, typically more sensitive in the low-energy regime. For that reason, we adopted an a priori δ
t = 60 s time window, in order to confidently ensure a match when the same burst is detected by MCAL and reported by IPN. The number of expected chance matches is equal to  . We point out that this number is underestimated, because we assumed a constant MCAL detection rate, but it is useful to qualitatively evaluate the impact of chance matches on our search. In Section 4, we carry out a visual inspection of MCAL data light curves for all matches retrieved from this cross-search, ending up with 787 events for which no significant signal is detected above the background: their number is compatible with
  and it represents the number of events that are rejected from the analysis.
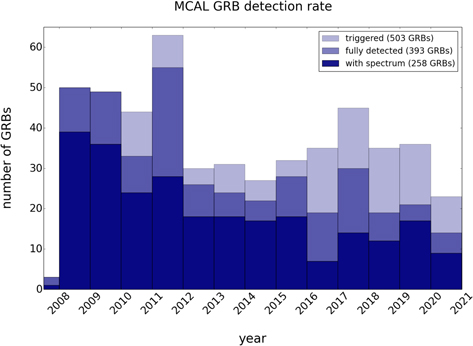
Figure 1. MCAL GRB detection rate from 2007 to 2020 November. The detected events consist of Ntot = 503 bursts that triggered MCAL, issuing complete or incomplete/fragmented data acquisitions. Out of them, Nfull = 394 events were fully acquired onboard, providing complete detections that can be used for studying time and spectral properties. We could perform spectral analysis on  events, with available localizations provided by other space missions. It can be seen that the detection rate is not constant in time, as a result of the different telemetry restrictions undergone in recent years, which implied changes in the onboard trigger configurations and available onboard mass memory.
Download figure:
Standard image High-resolution imageThis first search is carried out by using MCAL data. We point out that scientific RMs offer another suitable tool to detect GRBs, even in the hard X-ray energy range, covering about three orders of magnitude in energy: a cross-search of IPN GRBs with the AGILE RMs is very promising and will be treated in a future work.
3.2. Search of Bursts
At the same time, we also performed an independent offline search of GRBs in the MCAL data. To do that, we used the same algorithm used for the AGILE routine data analysis and identification of bursts in MCAL data, to provide prompt communication via GCN Notices and Circulars to the scientific community (https://gcn.gsfc.nasa.gov/agile_mcal.html). The aim of the algorithm is to detect GRBs independently from the MCAL trigger time, carrying out a blind search in the MCAL data stream. It operates on different timescales (16, 32, 64, and 128 ms) and searches for events that can be confidently neglected as statistical fluctuations of the background. A more detailed description of the MCAL GRB algorithm can be found in Ursi et al. (2019).
3.3. Cross-check with MCAL RMs
Long GRBs might not be fully acquired in a single MCAL trigger: GRBs exhibiting more bursting episodes separated in time could trigger a single data acquisition on the first burst, without re-triggering on the following episodes; moreover, long GRBs could be triggered by MCAL on the burst onset, but the available onboard memory may not be sufficient to store the entire GRB data stream. Both these cases would produce incomplete or fragmented detections. In order to check the real duration of the detected GRBs and to verify whether the MCAL acquisition included the whole event, we investigated the corresponding MCAL RM data, which provide a continuous data stream in the same energy range of the MCAL detector, with a 1.024 s time resolution. For each GRB, we therefore studied the MCAL RM light curve in a time interval of T0 ± 150 s, which allowed us to classify the triggered events as fully or partially acquired in the related onboard data acquisition.
4. Results and Discussion
The cross-search between MCAL triggers and IPN GRBs ended up with 1263 matches. A visual inspection of the MCAL high-time-resolution data light curves led to the rejection of 787 matches, for which no signal was distinguishable above the background. As illustrated in Section 3.1, these events correspond to spurious triggers which issued data acquisitions on the short-duration timescales, probably produced by instrumental background noise and cosmic showers. Such number is compatible with the expected number of chance matches  discussed above. The distribution of the time difference between the T0s of the rejected MCAL triggers and the T0s of IPN bursts is uniform in the δ
t time interval adopted for the search, as expected from a genuine sample of chance matches. This search resulted in Nmatch = 476 matched GRBs, detected by MCAL and reported by the IPN.
discussed above. The distribution of the time difference between the T0s of the rejected MCAL triggers and the T0s of IPN bursts is uniform in the δ
t time interval adopted for the search, as expected from a genuine sample of chance matches. This search resulted in Nmatch = 476 matched GRBs, detected by MCAL and reported by the IPN.
On the other hand, the MCAL burst search algorithm identified Nalgo = 432 events in the MCAL data stream. Out of them, Nalgo&match = 405 were already retrieved in the cross-check with IPN GRBs. It is interesting to notice that Nmatch − Nalgo&match =71 events found in the IPN matches, but not detected in the independent search, are mostly long GRBs with very smooth time profiles, which did not trigger the algorithm. On the other hand, Nalgo − Nalgo&match = Ncand = 27 events found by the algorithm, but not retrieved in the cross-search with the IPN list, are short-duration GRBs, not reported in external public burst lists, and therefore labeled here as "candidate GRBs." These events could be bursts detected by other space missions, without official communications to the scientific community; as we cannot solidly assume them to be genuine GRBs, we report them without the acronym "GRB" in the name. We also point out that the letter, characterizing the burst name, is written as uppercase, when the event is reported in official communications and lists, whereas we use a lowercase letter in all other cases.
The total burst sample obtained by both the cross-check with IPN and the independent offline search resulted in Ntot =Nmatch + Ncand = 503 GRBs, which triggered MCAL and issued high-time-resolution data acquisitions.
It is important to note that, in the last years, the AGILE satellite underwent severe telemetry restrictions, which strongly limited the onboard mass memory available for storing data of each detector. As a consequence, the MCAL trigger configuration was occasionally changed through the years, in order to prevent memory saturation, reducing the amount of time available for each data acquisition: such changes enhanced the MCAL acquisition of short-duration events, at the expenses of long-lasting transients. Out of Ntot = 503 triggered GRBs, 40 events exhibit not very intense gamma-ray emissions on timescales above ∼1–2 s, being not distinguishable above the background in the 1.024 s binned RM light curves; given their short duration, these bursts are therefore considered fully acquired in the corresponding triggered data acquisition. On the other hand, the remaining 464 GRBs were clearly detected in the MCAL RMs; out of them, Npartial = 109 events exhibited longer durations than the related MCAL triggers, whereas the remaining 354 can be considered fully acquired onboard. These searches ended up with a total number of Nfull = 463 − 109 + 40 = 394 complete detections of GRBs, which can be considered for timing and spectral analysis. Nevertheless, the Npartial = 109 partial or fragmented detections, though incomplete, provide further detections which can be used for triangulation purposes.
Figure 1 shows how the MCAL GRB detection rate changed over time, due to the different onboard configurations adopted. The huge decrease of detections in the year 2020 is due to the COVID-19 pandemic, which severely reduced the number of served passages on the AGILE ground station in Malindi, Kenya, affecting the data acquisition capabilities of MCAL.
For what concerns the MCAL detections, the most triggered onboard logic timescales are the 16 ms and the 256 ms, which detected most of the short GRBs and long GRBs, respectively. In particular, the logics were triggered for 7% by the sub-ms, for 3% by the 1 ms, for 24% by the 16 ms, for 14% by the 64 ms, for 24% by the 256 ms, foe 21% by the 1.024 ms, and for 15% by the 8192 ms. The percentages are not complementary, as more than one logic can be triggered at the same time.
It is also interesting to investigate the SuperAGILE (SA) and Anti-Coincidence (AC) RM data for each burst, in order to perform multi-wavelength observation of these events. Out of the Ntot = 503 events of the sample,  were detected in the SA RMs in the 18–60 keV energy range,
  in the AC RMs in the 50–200 keV energy range, and
  in the MCAL RMs in the 0.4–100 MeV energy range. It is important to remark that SA is an imaging detector with a ∼30° FoV (at half sensitivity): as a consequence, events with no associated SA detection are not necessarily bursts with no X-ray component, but can be bursts seen under a very large off-axis angle for which the related X-ray signal is strongly attenuated or not detectable.
Table 1 reports the GRB samples detected by MCAL and by the scientific RMs. Schematic diagrams providing a comprehensive view of MCAL GRB samples are shown in Figure 2.

Figure 2. Left: schematic diagram of the Ntot GRBs of the MCAL sample (purple shaded), obtained from the cross-check of MCAL triggers (black dotted–dashed) with IPN GRBs (red dashed), and from the independent search algorithm (blue solid). Right: schematic diagram of the Nfull GRBs fully acquired onboard by MCAL (green shaded), after cross-checking the Ntot GRBs (purple solid) with the corresponding MCAL RMs data (orange dotted).
Download figure:
Standard image High-resolution imageTable 1. Number of GRBs Detected by MCAL and Related Detection Types
| Detection Type | Number of GRBs |
|---|---|
| Triggered by AGILE MCAL | Ntot = 503 |
| from match with IPN GRB list | Nmatch = 476 |
| from independent algorithm | Nalgo = 432 |
| only from independent algorithm (candidates) | Ncand = 27 |
| detected by SA RMs |

|
| detected by AC RMs |

|
| detected by MCAL RMs |

|
| Fully detected by AGILE MCAL | Nfull = 394 |
| short GRBs |

|
| long GRBs |

|
| With spectral analysis |

|
| fitted with power law (PL) |

|
| fitted with Band model |

|
Note. We report the number of onboard triggered events, either found in close time association to external IPN bursts, or independently detected by the offline search algorithm, as well as the number of bursts detected by MCAL and by the AGILE RMs. Out of the fully acquired GRBs, we report the number of short and long GRBs, and of events for which spectral analysis is available.
Download table as: ASCIITypeset image
4.1. Time Analysis
We estimated the T50 and T90 time duration of our GRBs by adopting the algorithm reported by Koshut et al. (1996). An example of the algorithm applied to the short GRB 190606A is shown in Figure 3. The gray region indicates the portion of light curve on which the calculation has been performed: the background rate is evaluated in the red regions, before and after the event, and the burst count rate is evaluated in the blue region. T50 and T90 distributions of the Nfull = 394 MCAL GRBs are reported in Figure 4. As Nfull includes a certain number of candidates, we discriminate between the sample of confirmed bursts only (i.e., those retrieved in the cross-search with GRB lists, shown as a dashed line) and the sample of confirmed bursts plus our MCAL candidates (shown as a solid line).
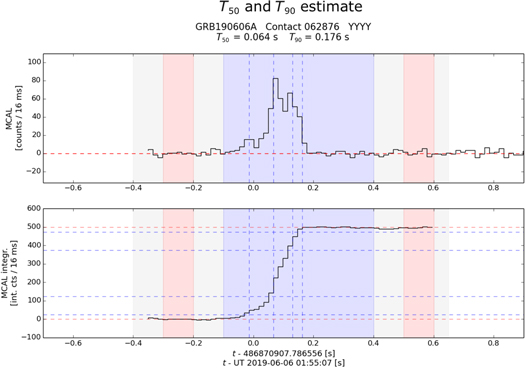
Figure 3. T50 and T90 calculations for the short GRB 190606A, evaluated in the 0.4–100 MeV energy range. Background and burst count rates are evaluated in the red and blue regions, respectively. The top panel shows the event light curve with a 16 ms time resolution, whereas the bottom panel shows the integrated counts as a function of time. For this burst, the time durations result equal to T50 = 64 ms and T90 = 176 ms.
Download figure:
Standard image High-resolution image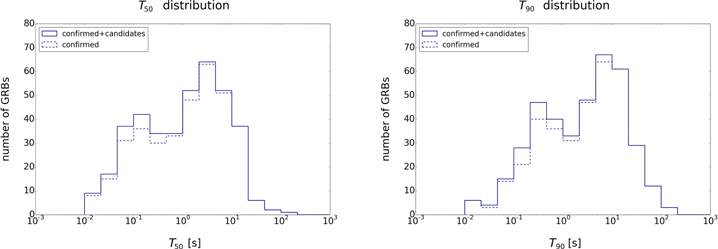
Figure 4. T50 and T90 distribution of the 367 GRBs detected by MCAL and confirmed by external GRB lists (dashed line) and of the Nfull = 394 GRBs detected by MCAL, including MCAL candidates retrieved offline by an independent search algorithm (solid line). About 41% (confirmed) and 44% (confirmed + candidates) of the sample is represented by short GRBs, showing that the detection efficiency of MCAL is biased to hard-spectrum, short-duration events.
Download figure:
Standard image High-resolution imageThe time distribution of the confirmed sample results in 150 short GRBs and 217 long GRBs, corresponding to about 41% and 59% of the sample, respectively. On the other hand, the time distribution of the total sample results in 173 short GRBs and 221 long GRBs, corresponding to about 44% and 56% of the sample, respectively.
These distributions show a high fraction of short GRBs compared to those reported by other space missions, such as INTEGRAL (Bošnjak et al. 2014), Fermi GBM (Bhat et al. 2016), and Konus-Wind (Svinkin et al. 2016). This difference can be ascribed to several reasons. A first explanation is related to the detection efficiency of MCAL, which is not uniform through the years. Figure 5 shows the distribution in time of the duration of the GRBs triggered by MCAL: blue solid dots represent events fully acquired onboard, for which it was possible to evaluate a T90 duration, whereas hollow dots represent partial or fragmented acquisitions, for which we report an approximate duration estimate based on MCAL RMs data. A depletion of fully acquired long-duration events in recent years can be noticed, due to the different trigger configurations adopted onboard. These changes were carried out to save mass memory during severe telemetry restrictions and to enhance the capability of MCAL to detect short GRBs during the LIGO-Virgo O2 and O3 runs (as short GRBs were the most promising candidates to be electromagnetic counterparts of GW events detected by LV). It is important to remark that this change did not affect the MCAL sensitivity to long GRBs, but only the possibility of fully detecting these transients. The partial data acquisition of long GRBs is not a problem of detection efficiency, but an issue regarding the post-burst duration and mass memory requirements.

Figure 5. Duration of the Ntot = 503 GRBs triggered by AGILE MCAL between 2007 and 2020, as a function of time (UTC). Filled dots represent events fully acquired onboard, for which the reported duration corresponds to the T90 estimate. Hollow dots represent events partially acquired onboard, for which the reported duration is an estimate based on MCAL RMs data. The efficiency of MCAL in acquiring full GRB detections is not uniform through the years, with a depletion of long-duration events in the recent years, due to severe telemetry reductions and onboard configuration changes. This behavior explains the high fraction of short GRBs in the T50 and T90 distributions of MCAL bursts.
Download figure:
Standard image High-resolution imageA second explanation is ascribed to a physical reason: MCAL operates above 400 keV and it is therefore more sensitive to GRBs with a hard spectrum, typically short GRBs. MCAL is sensitive in a limited energy range, which does not include the X-ray regime, in which most GRBs emit the largest fraction of their energy. The burst emission above 400 keV may therefore last less with respect to the overall duration of the event in a wider energy range. It is interesting to compare the T90s obtained by MCAL to those provided by Fermi GBM (operative in the 10 keV–40 MeV energy range), for a common data sample. We considered 272 GRBs detected by both MCAL and GBM and compared the corresponding durations obtained by the two detectors, in their energy ranges. As shown in Figure 6, MCAL T90s are slightly shorter than those reported by GBM: this is true especially for long GRBs, which exhibit shorter durations in the MCAL detections, contributing to the populating of the short GRB region. This behavior is even more evident when comparing MCAL data with SA data. GRBs in the SA data usually exhibit longer durations with respect to those reported by MCAL and MCAL RMs. In Figure 7, we show an example of this for GRB 200829A: in the SA RMs data, the event lasts 15.3 ± 0.5 s, whereas in the MCAL RMs data it lasts 8.1 ± 0.5 s. In the plot, the SA count rate is rescaled to better highlight the burst duration difference in the two energy ranges. The energy range in which a burst is detected may affect not only the total time duration observed, but also the T0: a GRB onset may occur at slightly different times depending on the energy range. We already pointed out such issue in the previous section, when we discussed the necessity of a δ t match window for the cross-check between MCAL triggers and IPN GRBs.

Figure 6. T90 distribution of 272 GRBs detected by AGILE MCAL (red) and Fermi GBM (magenta). The gray dashed line corresponds to T90 = 2 s. It is clear that the T90s obtained from MCAL data in the 0.4–100 MeV regime are slightly shorter than those obtained by the GBM, which operates in a softer energy range, including the X-ray contribution. As a consequence, some MCAL bursts exhibit shorter durations, enhancing the population of short GRBs.
Download figure:
Standard image High-resolution image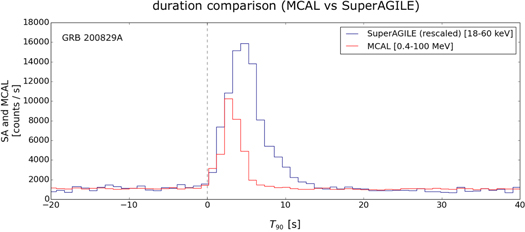
Figure 7. GRB 200829A as detected by the SuperAGILE RMs (18–60 keV, blue) and MCAL RMs (0.4–100 MeV, red), properly rescaled in order to achieve a similar background rate and better highlight the different duration of the burst in the two energy ranges. The average duration observed by the two detectors is different, with a longer emission in X-ray range (15.3 ± 0.5 s) with respect to that detected in the MCAL range (8.1 ± 0.5 s).
Download figure:
Standard image High-resolution imageThe shortest-duration GRB detected by MCAL is GRB 090522, with T50 = 0.008 s and T90 = 0.012 s, whereas the longest-duration one is GRB 110820B, with T50 = 128 s and T90 = 156 s. The short GRBs subsample peaks in T50 =0.25 s and T90 = 0.36 s, whereas the long GRBs subsample peaks in T50 = 7.69 s and T90 = 14.77 s.
Table 2 reports the 503 MCAL GRBs, with trigger time in UTC and related information. For each event, we define four flags corresponding to the detections of the scientific RMs of SA, AC, and MCAL (columns RM SA, RM AC, and RM MCAL, respectively) and of the MCAL detector with high time resolution (column MCAL). Each flag characterizes the detection type and is assigned as follows:
- 1.Y, complete detection: events that can be considered for timing and, if localization is available, spectral analysis;
- 2.I, partial detection: events that are not fully acquired in the trigger, providing only partial data collections and incomplete time duration estimates (which are starred in Table 2);
- 3.F, fragmented detection: events whose light curve presents gaps due to saturations of the MCAL memory cyclic buffer, providing only partial detections and incomplete time duration estimates (which are starred in Table 2);
- 4.N, no detection: events that are not detectable above the background rate;
- 5.n, no data available: events that are not covered by data for the time interval under analysis (due to Earth occultations, passages in the South Atlantic Anomaly, or data losses).
Table 2. List of the Ntot = 503 GRBs Triggered by MCAL and Fully (Nfull = 394) or Partially (Npartial = 109) Acquired by Data Acquisitions
| NAME | UTC | conf. | RM | RM | RM | MCAL | BKG | T50 | T90 |
|---|---|---|---|---|---|---|---|---|---|
| SA | AC | MCAL | (Hz) | (s) | (s) | ||||
| GRB071125A | 2007-11-25 23:21:00.36 | C1 | N | N | Y | Y | 260 | 13.824 ± 0.256 | 18.432 ± 0.256 |
| GRB071204A | 2007-12-04 05:58:29.40 | C1 | N | N | Y | Y | 223 | 0.032 ± 0.080 | 0.224 ± 0.080 |
| GRB071227A | 2007-12-27 20:13:47.17 | C1 | N | N | Y | Y | 231 | 0.640 ± 0.032 | 2.368 ± 0.032 |
| GRB080212B | 2008-02-12 23:04:49.42 | C1 | Y | Y | Y | Y | 268 | 1.600 ± 0.032 | 4.800 ± 0.032 |
| GRB080303B | 2008-03-03 21:34:37.82 | C1 | Y | Y | Y | Y | 278 | 3.072 ± 0.512 | 15.360 ± 0.512 |
| GRB080318A | 2008-03-18 08:31:31.87 | C1 | N | N | Y | Y | 282 | 5.184 ± 0.032 | 7.936 ± 0.032 |
| GRB080319C | 2008-03-19 12:25:56.65 | C1 | n | N | Y | Y | 312 | 0.896 ± 0.032 | 2.240 ± 0.032 |
| GRB080328A | 2008-03-28 08:02:59.85 | C1 | N | N | Y | Y | 270 | 5.120 ± 0.256 | 24.064 ± 0.256 |
| GRB080407A | 2008-04-07 20:42:05.10 | C1 | Y | Y | Y | Y | 274 | 9.728 ± 0.256 | 20.992 ± 0.256 |
| GRB080413c | 2008-04-13 19:26:16.49 | C1 | N | N | Y | Y | 282 | 11.776 ± 0.256 | 20.992 ± 0.256 |
Note. For each burst, we report name (no GRB prefix means candidate burst not confirmed by other instruments), trigger time in UTC, onboard configuration, possible detections of SuperAGILE, MCAL, and Anti-Coincidence scientific RMs (flags are Y, complete detection; N, no detection; I, incomplete acquisition; F, fragmented acquisition; n, no data), average background rate in the MCAL energy band, and T90 and T50 time durations. Events with no GRB in the name do not have a match with IPN list and are only retrieved in the MCAL data. GRBs duration marked with a star correspond to T50 and T90 evaluated on incomplete data acquisitions.
Only a portion of this table is shown here to demonstrate its form and content. A machine-readable version of the full table is available.
Download table as: DataTypeset image
Events with MCAL = Y are the Nfull = 394 GRBs previously discussed, for which the related onboard acquisitions are complete and for which it was possible to estimate T50 and T90 time durations, as well as the total number of counts released in the MCAL detector. On the other hand, for events with MCAL = I or MCAL = F, we can only provide partial estimates of T50,90 durations and number of counts, based on the available data. The duration of such events is marked with a star in Table 2. An example of a GRB with all flags equal to Y (i.e., GRB 130606B), fully acquired by MCAL and clearly detected in all RMs data is shown in Figure 8. As for the example in Figure 7, in the MCAL high-energy range, the event exhibits a shorter duration with respect to the softer SA and AC energy range.

Figure 8. GRB 130606B detected by AGILE MCAL and AGILE scientific RMs. The MCAL data are acquired in photon-by-photon mode and can be rebinned successively (here displayed with a binwidth of 64 ms), whereas RMs have fixed bin size equal to 0.512 s (for SuperAGILE) and 1.024 s (for Anti-Coincidence and MCAL).
Download figure:
Standard image High-resolution imageFigure 1 shows how the MCAL detection rate changed in 13 yr. Such variation does not depend only on the trigger configuration changes, but also on other issues undergone by the satellite in its lifetime. Such changes make the MCAL burst sample not uniform. In order to provide more homogenoeus subsets of the MCAL GRBs, we introduce a flag indicating different configurations, running in different periods of the AGILE lifetime, during which the onboard trigger condition and sensitivity to GRBs can be considered stable. In particular, the configuration flag may assume the following values:
- 1.C1 (from 2007 April to 2009 November): the satellite was in its 2 yr nominal phase and fully operational, all passages were served at the ground station, and all triggered GRBs were completely acquired onboard;
- 2.C2 (from 2009 December to 2015 February): after the reaction wheel failure, the satellite started spinning around its Sun-pointing axis, making the detection of long-duration transients more difficult, and requiring onboard configuration changes to test the detector;
- 3.C3 (from 2015 March to 2016 August): the AC veto shield was inhibited to increase the detection of TGFs (Marisaldi et al. 2015), with the drawback effect of an enhancement of the background rate, which required a change of the onboard configuration to make the trigger logics more conservative;
- 4.C4 (from 2016 August, alternating with C3, on demand): a new onboard configuration was introduced, aimed at increasing the sensitivity to short-duration, weak signals (e.g., subthreshold events or GRB precursors), in view of the LIGO-Virgo follow-up campaign. Such configuration is available on demand and it is adopted whenever possible, depending on telemetry requirements; otherwise, the baseline C3 configuration is adopted.
4.2. Spectral Analysis
In order to perform spectral analysis of the MCAL GRBs, it is necessary to retrieve the instrument response matrices corresponding to the angle under which the bursts are observed. In order to do this, sky localizations of the events are needed. As MCAL is a non-imaging detector, localizations only can be retrieved from available SuperAGILE detections, or externally, from other space missions, or IPN triangulation. We carried out a search in different databases from various satellites with imaging or localization capabilities: in particular, we adopted the Fermi GBM, Fermi LAT, and Fermi GBM Trigger lists, as well as the Swift BAT and Swift XRT lists (all reported in https://heasarc.gsfc.nasa.gov/W3Browse/), and the INTEGRAL ISGRI list (https://www.isdc.unige.ch/integral/science/grb). We retrieved sky coordinates for 276 of our GRBs, as shown in Figure 9, for which we could simulate the corresponding response matrices. Taking into consideration the available count statistics, spectral analysis was possible for 258 of these bursts.

Figure 9. Aitoff distribution in galactic coordinates l, b of the 276 GRBs detected by MCAL, for which an external localization is available, provided by other space missions. We fitted 258 of these events with a power-law model and 43 events with a Band model, in the 0.4–50 MeV energy range.
Download figure:
Standard image High-resolution image4.2.1. Spectral Fit with a Power-law Model
GRB spectra can often be described by means of a Band model, a smooth-joint broken power law (PL) with a peak energy Ep (Band et al. 1993). This value corresponds to the maximum of the ν
F
ν spectrum: it divides the PL at low energies, described by a low-energy photon index α, from the PL at high energies, described by a high-energy photon index β. Typically, α>−2 and β<−2, in order to ensure the presence of an Ep, which usually ranges in the tens to few hundreds of kilo electron volts energy range, but can extend up to mega electron volt energies for the hardest GRBs. As MCAL operates above 400 keV, we expect that most Eps will lay outside the MCAL energy range, and that the time-integrated spectrum of most events would only appear as a simple PL with photon index ∼β. As a consequence, we carried out a systematic spectral analysis fitting each spectrum using a single PL model  , where A is a normalization constant and E0 = 100 keV. The spectral analysis was carried out using the XSpec spectral fitting package (version 12.9.0, Arnaud 1996); as the MCAL average background rate ranges between 200 and 700 Hz, depending on the year and on the orbital position, and since the detected events may exhibit different durations and count rates, we adopted different XSpec statistics to perform the spectral analysis. In particular, all events exhibiting less than 1000 background-subtracted counts have been treated with the XSpec Cstat statistic, a modified version of the Cash statistic used for Poisson data on a Poisson background; in the case of Poisson data over a Gaussian background, we adopted the PGstat statistic. In all other cases, events have been treated using the standard chi statistics. We carried out the spectral analysis in the 0.4–50 MeV energy range.
For  events out of 276 localized bursts, it was possible to perform a spectral analysis with a reliable
  and a β ranging between −4 and 0. These events are reported, with related information, in Table 3. The localizations reported in the table are obtained from different space missions or IPN triangulations and are flagged as SA (AGILE SuperAgile), GBM (Fermi GBM), LAT (Fermi LAT), BAT (Swift BAT), XRT (Swift XRT), INT (INTEGRAL ISGRI), or IPN. The 0.4–50 MeV interval corresponds to a number of MCAL spectral channels Nchannels = 79, so that the number of degrees of freedom (dof) is accordingly set for a two-parameter model as Ndof = 75. The average photon index obtained from this systematic analysis is 〈β〉 = −2.3, and the related distribution is shown in Figure 10. The fluxes (90% confidence level) obtained by these spectral fittings range between 3.9 × 10⁻⁷ and 1.0 × 10⁻² erg cm−2 s−1, whereas the corresponding fluences (90% confidence level) range from 5.5 × 10⁻⁸ and 1.3 × 10⁻² erg cm−2. GRB fluxes are shown in Figure 11, plotted with respect to the T90, together with the corresponding flux upper limits (ULs, i.e., the minimum detectable fluxes for the MCAL timescales). MCAL ULs depend on many factors: energy range, involved trigger logic timescale (which have different thresholds), spectral shape (hardness) of the event under analysis, onboard configuration (described in Ursi et al. 2019), background rate, and angles θ, ϕ under which the event is observed (and associated response matrix). As the GRB fluxes reported in the figure refer to events that occurred in 13 yr, we cannot report a single UL value for each timescale, as ULs vary from period to period, depending on technical issues undergone by the satellite in the years and related onboard configuration changes. For each trigger timescale, we therefore report the maximum flux ULs obtained for the more constraining and conservative configurations (red arrows and bars), as well as the minimum flux ULs obtained for the best configurations (blue arrows and bars), achieved in the AGILE lifetime. ULs are evaluated in the 0.4–100 MeV energy range, for each logic timescale, simulating GRBs with a PL with a mean 〈β〉 = −2.3. These values are in good agreement with the detected bursts, constraining the region in the flux-T90 parameter space in which GRBs can be detected by MCAL. We point out that ULs refer to the GRB fluxes capable of triggering the MCAL detector, which do not always correspond to events that can be fully acquired onboard and for which a spectral analysis can be performed. As a consequence, especially for the longest-duration timescales, a gap is present between the UL value and the actually detected GRBs. In the fluence distribution represented in Figure 12, a bimodal shape is evident, with a local minimum at ∼(0.5–1) × 10−5 erg cm−2, between the short and long GRB populations. The low-fluence regime is mostly constituted by short GRBs, whereas a sharp decrease in the high-fluence (≳5 × 10⁻⁴ erg cm−2) events is present, due to the limited number of long GRBs detected by MCAL.
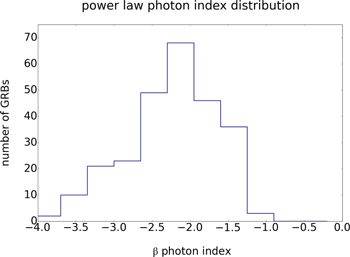
Figure 10. (Left) Distribution of the power-law β photon indices obtained from the systematic fitting of  localized bursts with a single power-law model, in the 0.4–50 MeV energy range.
Download figure:
Standard image High-resolution image
Figure 11. GRB fluxes of  localized bursts, obtained by fitting the time-integrated spectra with a power-law model in the 0.4–50 MeV energy range, plotted with respect to T90 time duration. Arrows correspond to flux upper limits, in the different logic timescales, in the best and worst sensitivity configurations (blue and red, respectively).
Download figure:
Standard image High-resolution image
Figure 12. GRB fluence distribution of  localized bursts fitted with a single power-law model. Fluences correspond to GRB fluxes integrated on the related T90 time duration, evaluated in the 0.4–50 MeV energy range. The cumulative distribution is clearly bimodal and reflects the burst duration, with a local minimum at (0.5–1.0) × 10−5 erg cm−2.
Download figure:
Standard image High-resolution imageTable 3. List of  Localized GRBs whose Time-integrated Spectrum is Fitted with a Single Power-law Model in the 0.4–50 MeV Energy Range
| NAME | local. | l, b | θ, ϕ | stat. | β |

| Flux (0.4–50 MeV) | Fluence (0.4–50 MeV) |
|---|---|---|---|---|---|---|---|---|
| by | (deg) | (deg) | (75 dof) | (erg cm−2 s−1) | (erg cm−2) | |||
| GRB071227A | XRT | 267.48, −46.75 | 110.20, 209.59 | cstat |

| 1.40 | (5.36 ± 0.54) E-06 | (6.34 ± 0.63) E-06 |
| GRB080212B | IPN | 200.76, 27.06 | 78.51, 209.05 | pgstat |

| 0.97 | (2.78 ± 0.28) E-06 | (6.68 ± 0.67) E-06 |
| GRB080303B | IPN | 3.86, −1.11 | 90.27, 270.27 | chi |

| 0.93 | (5.48 ± 0.55) E-06 | (4.21 ± 0.42) E-05 |
| GRB080319C | XRT | 83.33, 35.44 | 84.38, 342.10 | chi |

| 1.19 | (6.40 ± 0.64) E-06 | (7.16 ± 0.72) E-06 |
| GRB080328A | XRT | 161.85, 6.17 | 155.52, 20.63 | chi |

| 1.14 | (1.90 ± 0.19) E-06 | (2.29 ± 0.23) E-05 |
| GRB080407A | IPN | 249.13, 78.50 | 62.56, 267.28 | chi |

| 1.58 | (2.48 ± 0.25) E-06 | (2.61 ± 0.26) E-05 |
| GRB080507B | IPN | 90.47, 31.57 | 10.34, 0.26 | cstat |

| 0.88 | (2.92 ± 0.29) E-06 | (2.80 ± 0.28) E-07 |
| GRB080514B | SA | 54.58, −34.45 | 37.61, 86.44 | chi |

| 1.40 | (4.92 ± 0.49) E-06 | (2.36 ± 0.24) E-05 |
| GRB080528A | IPN | 176.18, −7.39 | 93.58, 4.72 | cstat |

| 0.98 | (2.92 ± 0.29) E-05 | (3.50 ± 0.35) E-06 |
| GRB080530A | IPN | 288.15, 62.08 | 126.21, 269.99 | cstat |

| 1.18 | (1.45 ± 0.14) E-05 | (5.82 ± 0.58) E-06 |
Note. For each event, name, galactic coordinates, statistics adopted for the spectral analysis, β photon index (with related 1σ errors),  , and corresponding fluxes and fluences (90% confidence interval) are reported.
Only a portion of this table is shown here to demonstrate its form and content. A machine-readable version of the full table is available.
Download table as: DataTypeset image
It is interesting to notice that 95 of these bursts exhibit PLs with β > −2, which correspond to events whose spectral energy densities ν Fν have a positive slope extending up to the highest energies. It should be noticed that the results reported in Table 3 are obtained by an automatic spectral fit performed on the whole sample of localized GRBs, integrated on the whole duration of the bursts: these results provide an overall spectral picture of each GRB, without treating in detail the individual evolution of each event, and without investigating the possible existence of more spectral episodes or extra components. As a consequence, the PLs with β > −2 obtained from the fit of the 95 bursts reported above may describe the event as a whole, as well as represent episodes arising only at the beginning of the prompt, or subsequently throughout the spectral evolution.
We analyzed the log N–log F brightness distribution of our GRB sample, where fluxes F are obtained from the spectral fits with the PL model. Such distribution provides information on the intrinsic and spatial properties of GRBs. The N ∼ F−3/2 trend usually retrieved at large fluxes, with events following a −3/2 slope in the log N–log F plane, shows a clear deviation at fainter fluxes (i.e., F < 4 × 10⁻⁶ erg cm−2 s−1), as reported in Figure 13: since fewer faint bursts than expected are observed, the spatial distribution of GRBs cannot be consistent with a homogeneous Euclidean universe.

Figure 13. Log N–log F distribution of MCAL GRBs fitted with a power-law model. For large fluxes, the brightness distribution follows a slope coefficient −3/2, typical of a Euclidean three-dimensional space, whereas for fainter fluxes the spatial distribution is not consistent with a homogeneous universe.
Download figure:
Standard image High-resolution imageIn general, the MCAL GRB population decline curve is compatible with those reported by BATSE (Hurley 1991; Kouveliotou et al. 1993) and Fermi GBM (Nava et al. 2011; Bhat et al. 2016), although the departure from the −3/2 slope occurs at different flux values, depending on number statistics and on the sensitivity of the instrument. It is important to note that the different MCAL trigger configurations adopted during the AGILE lifetime make the integral distribution of the flux not uniform. In particular, the C3 configuration discussed in Section 4.1, which is used on demand to overcome telemetry requirements, is less sensitive to low-flux bursts: as GRBs detected in the C3 configuration are about 17% of the total, this issue could introduce a bias in the overall log N–log F distribution. All the C2, C3, and C4 configurations make the full acquisition of long GRBs more difficult, biasing the analyzed sample toward short-duration events, which constitute a large fraction (40%) of the total, with respect to that reported by other detectors (Bošnjak et al. 2014; Bhat et al. 2016; Svinkin et al. 2016). Another consequence of the different configuration settings is the slight break in the log N–log F slope, present at about (0.5–1.0) × 10−5 erg cm−2, already pointed out in Figure 12. The deficit at high fluxes can be ascribed both to the fixed limited energy range adopted for the spectral analysis and to small number statistics: a similar discrepancy is reported also in the plots reported by BATSE (Kommers et al. 2000) and Fermi GBM (Bhat et al. 2016). On the other hand, as MCAL is an all-sky monitor, the plot is not affected by on-axis area variations. The only effects that could affect a continuous and homogeneous MCAL monitoring of the sky are represented by Earth occultations, which constantly hide about 35% of the sky, and by passages into the South Atlantic Anomaly, where detectors are switched off. However, as Figure 13 includes GRBs detected over a 13 yr time span, we can assume that these effects are smoothed out over such a large time interval and do not significantly affect the plot.
4.2.2. Spectral Fit with a Band Model
We also performed an automatic spectral analysis by using a Band model. We expect that most of MCAL bursts will exhibit an Ep below the energy threshold of 400 keV. Nevertheless, we ended up with  GRBs which can be described by a Band model with Ep ≥ 400 keV, α > −2, and β < −2, reported in Table 4. Distributions of peak energy Ep, low-energy photon index α, and high-energy photon index β are shown in Figure 14. We adopted the same criteria used for the spectral analysis with a PL model. The fits with a four-parameters model result in a number of dof equal to Ndof = 73, in the 0.4–50 MeV energy range. Our sample of Band-fittable GRBs exhibits a mean peak energy 〈Ep〉 = 640 keV, a mean 〈α〉 = −0.6, and a mean 〈β〉 = −2.5. Although the MCAL sample is biased toward higher-energy GRBs, the 〈α〉 and 〈β〉 mean values are compatible with those reported by Poolakkil et al. (2021) for a large sample of Fermi GBM GRBs, with an 〈α〉 ranging between −0.8 (for long GRBs) and −0.5 (for short GRBs), and 〈β〉 ranging between −2.4 (for long GRBs) and −2.6 (for short GRBs). On the other hand, the MCAL 〈Ep〉 is slightly higher than that reported for GBM bursts, ranging between 144 keV (for long GRBs) and 413 keV (for short GRBs). Among the GRBs fitted with a Band model, we recall the ultra-long GRB 080407A (Pal'shin et al. 2012), the hard-spectrum GRB 131028A whose Ep ∼ MeV is also reported by Fermi and Konus-Wind (Golenetskii et al. 2013; von Kienlin 2013), the high-energy GRB 130427A detected by Fermi LAT and extensively treated in Ackermann et al. (2013), and the GRB 190114C, first event detected at VHE by the MAGIC telescope MAGIC Collaboration et al. (2019), Ajello et al. (2020), Ursi et al. (2020). An example of a GRB spectrum fitted with a Band model (GRB 110721A) is reported in Figure 15.

Figure 14. Distributions of the (left) peak energy Ep, (center) low-energy photon index α, and (right) high-energy photon index β for the  MCAL GRBs fitted with a Band model, in the 0.4–50 MeV energy range.
Download figure:
Standard image High-resolution image
Figure 15. Example of a GRB spectrum (GRB 110721A, here rebinned) fitted with a Band model between 400 keV and 50 MeV, resulting in a fluence of 4.02E-05 erg cm−2 (90% confidence level).
Download figure:
Standard image High-resolution imageTable 4. List of  Localized GRBs Whose Time-integrated Spectrum is Fitted with a Band Model with Ep ≥ 400 keV in the 0.4–50 MeV Energy Range
| NAME | stat. | α | β | Ep |

| Flux (0.4–50 MeV) | Fluence (0.4–50 MeV) |
|---|---|---|---|---|---|---|---|
| (keV) | (73 dof) | (erg cm−2 s−1) | (erg cm−2) | ||||
| GRB080407A | chi |

|

|

| 1.59 | (2.28 ± 0.23) E-06 | (2.39 ± 0.24) E-05 |
| GRB080723D | chi |

|

|

| 0.99 | (8.88 ± 0.89) E-07 | (3.36 ± 0.34) E-05 |
| GRB080916C | chi |

|

|

| 0.81 | (4.30 ± 0.43) E-06 | (8.16 ± 0.82) E-05 |
| GRB081004A | cstat |

|

|

| 0.88 | (8.90 ± 0.89) E-06 | (5.70 ± 0.57) E-07 |
| GRB081207A | chi |

|

|

| 1.13 | (1.42 ± 0.14) E-06 | (5.47 ± 0.55) E-05 |
| GRB081209A | cstat |

|

|

| 0.95 | (5.72 ± 0.57) E-06 | (1.10 ± 0.11) E-06 |
| GRB081222A | chi |

|

|

| 1.17 | (1.75 ± 0.18) E-06 | (9.32 ± 0.93) E-06 |
| GRB081224A | chi |

|

|

| 1.09 | (1.65 ± 0.17) E-06 | (4.33 ± 0.43) E-06 |
| GRB090328B | cstat |

|

|

| 0.78 | (8.54 ± 0.85) E-06 | (5.46 ± 0.55) E-07 |
| GRB090401B | chi |

|

|

| 0.94 | (4.98 ± 0.50) E-06 | (2.23 ± 0.22) E-05 |
| GRB090427A | chi |

|

|

| 1.54 | (8.76 ± 0.88) E-06 | (1.01 ± 0.10) E-05 |
| GRB090618A | chi |

|

|

| 1.31 | (8.46 ± 0.85) E-07 | (3.77 ± 0.38) E-05 |
| GRB090720B | chi |

|

|

| 1.32 | (3.96 ± 0.40) E-06 | (1.24 ± 0.12) E-05 |
| GRB090809B | chi |

|

|

| 1.17 | (3.34 ± 0.33) E-06 | (2.09 ± 0.21) E-05 |
| GRB091109B | cstat |

|

|

| 1.11 | (1.67 ± 0.17) E-05 | (8.02 ± 0.80) E-07 |
| GRB100612A | cstat |

|

|

| 1.31 | (5.20 ± 0.52) E-06 | (1.17 ± 0.12) E-06 |
| GRB100724B | chi |

|

|

| 1.72 | (5.00 ± 0.50) E-06 | (1.81 ± 0.18) E-04 |
| GRB100811A | cstat |

|

|

| 0.79 | (8.02 ± 0.80) E-06 | (1.67 ± 0.17) E-06 |
| GRB101219A | cstat |

|

|

| 1.10 | (6.54 ± 0.65) E-06 | (1.88 ± 0.19) E-06 |
| GRB110529A | cstat |

|

|

| 0.94 | (9.20 ± 0.92) E-06 | (2.65 ± 0.27) E-06 |
| GRB110721A | chi |

|

|

| 1.35 | (8.00 ± 0.80) E-06 | (3.33 ± 0.33) E-05 |
| GRB120226B | chi |

|

|

| 1.21 | (3.46 ± 0.35) E-06 | (1.86 ± 0.19) E-05 |
| GRB120512A | chi |

|

|

| 1.15 | (4.14 ± 0.41) E-07 | (3.79 ± 0.38) E-06 |
| GRB130228B | cstat |

|

|

| 0.72 | (7.40 ± 0.74) E-06 | (4.97 ± 0.50) E-06 |
| GRB130306A | chi |

|

|

| 0.89 | (6.78 ± 0.68) E-07 | (1.81 ± 0.18) E-05 |
| GRB130427A | chi |

|

|

| 2.62 | (6.32 ± 0.63) E-05 | (2.99 ± 0.30) E-04 |
| GRB130828A | chi |

|

|

| 1.10 | (5.34 ± 0.53) E-07 | (1.01 ± 0.10) E-05 |
| GRB131028A | chi |

|

|

| 2.15 | (1.67 ± 0.17) E-05 | (8.43 ± 0.84) E-05 |
| GRB140508A | chi |

|

|

| 1.08 | (1.58 ± 0.16) E-06 | (1.99 ± 0.20) E-05 |
| GRB140930B | cstat |

|

|

| 0.95 | (1.09 ± 0.11) E-05 | (4.54 ± 0.45) E-06 |
| GRB141012A | chi |

|

|

| 1.01 | (4.06 ± 0.41) E-07 | (4.88 ± 0.49) E-06 |
| GRB150403A | chi |

|

|

| 1.19 | (6.74 ± 0.67) E-06 | (3.67 ± 0.37) E-05 |
| GRB171011B | chi |

|

|

| 0.98 | (9.84 ± 0.98) E-06 | (5.03 ± 0.50) E-06 |
| GRB171011A | chi |

|

|

| 0.81 | (1.50 ± 0.15) E-06 | (1.92 ± 0.19) E-06 |
| GRB180204A | cstat |

|

|

| 1.36 | (1.29 ± 0.13) E-05 | (1.03 ± 0.10) E-06 |
| GRB180720A | chi |

|

|

| 0.79 | (5.30 ± 0.53) E-04 | (5.09 ± 0.51) E-04 |
| GRB180728A | chi |

|

|

| 1.16 | (1.88 ± 0.19) E-06 | (4.87 ± 0.49) E-06 |
| GRB190114C | chi |

|

|

| 1.21 | (5.52 ± 0.55) E-05 | (1.24 ± 0.12) E-04 |
| GRB190305A | chi |

|

|

| 1.22 | (8.00 ± 0.80) E-03 | (5.12 ± 0.51) E-03 |
| GRB190606A | cstat |

|

|

| 1.19 | (4.12 ± 0.41) E-05 | (3.63 ± 0.36) E-06 |
| GRB190810A | cstat |

|

|

| 0.76 | (5.38 ± 0.54) E-06 | (5.80 ± 0.58) E-07 |
| GRB191221B | chi |

|

|

| 0.93 | (4.72 ± 0.47) E-06 | (2.36 ± 0.24) E-05 |
| GRB201103B | chi |

|

|

| 0.73 | (5.18 ± 0.52) E-06 | (1.01 ± 0.10) E-05 |
Note. For each event, name, statistics adopted for the spectral analysis, α and β photon indices, Ep, with related 1σ errors,  , and corresponding fluxes and fluences (90% confidence interval) are reported.
Only a portion of this table is shown here to demonstrate its form and content. A machine-readable version of the full table is available.
Download table as: DataTypeset image
Table 5. List of the Eight GRBs Fitted with a Band Model, with Related Redshifts, Flux in the 1–10,000 keV Energy Range (90% Confidence Level), Ep,i (with 1σ error), and Eiso
| NAME | z | Flux (1 keV–10 MeV) (erg cm−2 s−1) | Ep,i (keV) | Eiso (erg) |
|---|---|---|---|---|
| GRB090618A | 0.54 | (1.04 ± 0.10)E-06 |

| 5.69E+52 |
| GRB110721A | 0.382 | (5.84 ± 0.58)E-06 |

| 1.53E+52 |
| GRB130427A | 0.34 | (6.10 ± 0.61)E-05 |

| 1.41E+53 |
| GRB140508A | 1.028 | (9.82 ± 0.98)E-07 |

| 5.23E+52 |
| GRB150403A | 2.06 | (3.80 ± 0.38)E-06 |

| 3.79E+53 |
| GRB180728A | 0.117 | (2.62 ± 0.26)E-06 |

| 3.84E+50 |
| GRB190114C | 0.42 | (4.48 ± 0.45)E-05 |

| 7.63E+52 |
| GRB191221B | 1.148 | (2.98 ± 0.30)E-06 |

| 8.41E+52 |
Download table as: ASCIITypeset image
The 95 GRBs fitted with a PL with β > −2 and the 43 GRBs fitted with a Band model with Ep ≥ 400 keV constitute the subsample of MCAL GRBs with the highest energies: it is interesting to notice that 20 of these bursts have associated Fermi LAT detections. These events are particularly relevant, as they allow to better investigate the high-energy component of GRBs, and will be object of a forthcoming study.
Among the  GRBs fitted with a Band model, eight events have been reported with known redshifts, provided by X-ray or optical observations of their afterglow, as reported in Table 5. For these events, we estimated the related rest-frame parameters, by adopting a standard cosmological model with H0 = 67.3 km s−1 Mpc−1, ΩM
= 0.315, and ΩΛ = 0.685. For each burst, we evaluate the intrinsic peak energy of the time-integrated spectrum Ep,i
= (1 + z)Ep and the isotropic equivalent energy Eiso released between 1 keV and 10 MeV on the whole duration of the event. We checked our sample by using the Amati relation
GRBs fitted with a Band model, eight events have been reported with known redshifts, provided by X-ray or optical observations of their afterglow, as reported in Table 5. For these events, we estimated the related rest-frame parameters, by adopting a standard cosmological model with H0 = 67.3 km s−1 Mpc−1, ΩM
= 0.315, and ΩΛ = 0.685. For each burst, we evaluate the intrinsic peak energy of the time-integrated spectrum Ep,i
= (1 + z)Ep and the isotropic equivalent energy Eiso released between 1 keV and 10 MeV on the whole duration of the event. We checked our sample by using the Amati relation  : a best-fit of our GRB sample results in a slope of m = 0.130 ± 0.067, shown in Figure 16 with respect to redshift z, which is slightly more gentle than typical values m ∼ 0.45 reported in (Amati et al. 2002; Azzam & Alothman 2013), due to the nonuniform hardness of this sample.

Figure 16. Eight MCAL GRBs with known redshift (see color key), fitted with a Band model, in the rest-frame Eiso–Ep,i plane. The dashed line corresponds to the best-fit Amati relation, with slope m = 0.130 ± 0.067.
Download figure:
Standard image High-resolution image
5. Online Catalog
A comprehensive version of the AGILE MCAL GRB catalog can be found on the ASI Space Science Data Center (SSDC) https://www.ssdc.asi.it/mcal2grbcat/. In the online version, further information and data products are available, such as MCAL and scientific RMs light curves, plots, data, and spectral parameters.
6. Conclusions
After more than a decade of activity, the AGILE satellite continues its exploration of the high-energy sky, investigating galactic and extragalactic sources in the hard X- and gamma-ray energy range. In particular, the MCAL detector onboard the satellite, sensitive between 400 keV and 100 MeV, offers the opportunity to detect GRBs in the high-energy regime, and to study the poorly investigated tens of MeV energy range, providing insights on the high-energy component of these events. Moreover, the AGILE scientific RMs offer further observations of these events in different energy ranges, allowing broad-band detection of MCAL GRBs from 20 keV to 100 MeV.
A systematic analysis of the MCAL data in the period from 2007 to 2020 November led to detection of 503 GRBs triggered onboard. These events are retrieved by carrying out a cross-correlation with the IPN GRBs and by running an independent blind search algorithm in MCAL data. Among these events, 394 bursts are fully acquired onboard and their T50 and T90 distributions show 44% short GRBs and 56% long GRBs, strongly biased toward the acquisition of short-duration transients due to telemetry requirements and onboard optimization configurations. For 258 bursts, we could fit the time-integrated spectrum in the 0.4–50 MeV energy range with a power-law model whose average photon index is 〈β〉 = −2.3 we also obtain 95 events with β > −2, exhibiting a non-negligible spectral component up to the highest energies. We could fit 43 GRBs with a Band model with Ep ≥ 400 keV, resulting in average values of 〈α〉 = −0.6, 〈β〉 = −2.5, and 〈Ep〉 = 640 keV. The 95 + 43 GRBs fittable either with a power law with β > −2 or with a Band model with Ep ≥ 400 keV constitute the highest-energy subsample of MCAL GRBs: these events represent an interesting sample for a forthcoming study on high-energy GRBs and their spectral evolution.
The large fraction of GRBs with T90 < 2 s, the slightly flat power-law photon index 〈β〉 = −2.3, as well as the existence of 43 GRBs with a Band Ep ≥ 400 keV, provide evidence that the MCAL GRB sample is mostly constituted by short-duration, hard-spectrum bursts, as expected from a detector operating in the 0.4–100 MeV energy range, optimized for the detection of short-duration events. This catalog offers a set of bursts with high-energy features and providing interesting data in the tens of mega electron volt regime. The 109 events partially detected onboard can serve as further detections to be used to improve triangulations of still unlocalized bursts: on the other hand, fully detected GRBs can be deeper investigated in future studies, carrying out more detailed analysis and performing joint observations with other missions, in order to investigate the high-energy spectral components of GRBs.
AGILE is a mission of the Italian Space Agency (ASI), with coparticipation of INAF (Istituto Nazionale di Astrofisica) and INFN (Istituto Nazionale di Fisica Nucleare). This work was carried out in the frame of the ASI-INAF agreement I/028/12/5. We wish to thank the anonymous referee for the very useful comments, that substantially improved the quality of our work.