


Abstract
We report observations, made with the Atacama Large Millimeter/submillimeter Array, of 3 mm dust continuum emission and molecular line emission in HCO+, CS, and N2H+, toward G305.137+0.069, a massive, dense, and cold clump, in order to characterize its small-scale (∼2000 au) structure. The dust continuum observations reveal the presence of twelve compact structures (cores) with masses ranging from 3.3 to 50.6 M⊙, radii from 1800 to 5300 au, and densities from 3.1 × 10⁶ to 3.1 × 107 cm−3. The line observations show that the molecular emission arises from a bright central region, with an angular size of ∼12'', and an extended, weaker envelope best seen in the HCO+ line. The N2H+ emission is best correlated with the continuum emission and hence with the cores. For cores with single line profiles, the line widths range from 1.9 to 3.1 km s−1 with an average value of 2.6 km s−1, indicating that they are dominated by nonthermal motions, either due to random turbulence or core-scale motions. The virial parameter of the three most massive cores are smaller than one, suggesting that they are undergoing collapse. We find that in the regime of masses probed by our observations (M > 3 M⊙) the shape of the core-mass function is notably different from the initial mass function, showing an overpopulation of high-mass cores. We suggest that the formation and mass distribution of the dense cores within G305.137+0.069 can be explained as the result of hierarchical or turbulent fragmentation in a gravitationally collapsing clump.
Export citation and abstract BibTeX RIS
1. Introduction
In spite of the fact that most stars, and in particular high-mass stars, form in clusters (Lada & Lada 2003) our understanding of the star formation process is mainly limited to isolated low-mass protostars. A wealth of observations have shown that the hosts of young high-mass stars and clusters are massive and dense clumps with masses of a few 103 M⊙, sizes of ∼0.4 pc, and temperatures of ∼30 K (e.g., Plume et al. 1997; Faúndez et al. 2004). Colder clumps (T < 17 K) with similar masses, sizes, and densities have also been identified (Garay et al. 2004; Pillai et al. 2006; Sanhueza et al. 2017; Contreras et al. 2018), which would correspond to the initial conditions for the process of the formation of high-mass stars and clusters (Garay et al. 2004). However, the way in which these massive and dense cold clumps (hereafter MDCCs) evolve to form massive stars is still poorly known. Searching and studying clumps which are on the verge of forming protostars, but have not formed any yet, is crucial for understanding the physical processes that take place during the early phases of high-mass star formation.
Since massive stars are formed in clusters, their formation is undoubtedly connected to the fragmentation process of the clump. However, there is no consensus on how MDCCs collapse and fragment. Several numerical simulations of clump fragmentation and evolution, leading to the formation of a cluster of stars, have been reported in the literature such as (1) competitive accretion (e.g., Bonnell et al. 2001; Wang et al. 2010); (2) turbulent core accretion (e.g., McLaughlin & Pudritz 1996; Padoan & Nordlund 2002; McKee & Tan 2003); (3) gravo-turbulent fragmentation (e.g., Klessen et al. 1998; Banerjee & Pudritz 2007); (4) global gravitational contraction (Hartmann & Burkert 2007; Heitsch & Hartmann 2008), and (5) hierarchical gravitational fragmentation (Naranjo-Romero et al. 2015). The main difference among these simulations is related to the assumptions concerning the initial physical processes that influence fragmentation and the kinematical conditions of the clump. In the competitive accretion scenario the clump fragments into Jeans-mass structures that then accrete mass from the surroundings. The fragments located in regions where more material can be accreted will likely form a high-mass star, which results in the segregation of high-mass stars toward the center of a cluster. In the turbulent core accretion model there is a top-down fragmentation process, with the clump fragmenting into cores and the high-mass stars being formed by the gravitational collapse of individual cores. Most of these models conclude that the stellar initial mass function (IMF) is consistent with the Salpeter IMF, however very few of them make predictions about the prestellar core-mass function (CMF) at the earliest phase of evolution, possibly due to the lack of observational data to compare with. This situation has changed dramatically during the last couple of years due to the availability of high angular resolution observations of clumps, in particular with the Atacama Large Millimeter/submillimeter Array (ALMA). These observations are starting to provide constraints on the level of fragmentation of clumps, and the physical characteristics, dynamical state, and mass distribution of the cores, which are crucial to discern between the proposed models (Rathborne et al. 2015; Zhang et al. 2015; Liu et al. 2018; Motte et al. 2018; Contreras et al. 2018).
In this paper we report observations of molecular line emission and continuum emission at 3 mm toward G305.137+0.069, an MDCC identified by Garay et al. (2004) from millimeter observations. This object was selected as a candidate for a clump in the early stage of evolution due to its lack of Midcourse Space Experiment (MSX) and Infrared Astronomical Satellite (IRAS) emission, and classified as an infrared (IR) dark cloud by Peretto & Fuller (2009) for its lack of bright IR emission in the Spitzer GLIMPSE and MIPSGAL archive data. The clump is located on the edge of the star-forming complex G305, one of the most luminous H ii region complexes in the galaxy (Hindson et al. 2012), at the distance of 3.4 kpc. It has a mass of 1.1 × 10³ M⊙, a size of 0.3 pc, and a dust temperature of ∼17 K (Garay et al. 2004). The mass and size of this MDCC are consistent with a precursor of a high-mass star clump, as shown by Kauffmann & Pillai (2010) with their empirical relationship. The value of the dust temperature, together with the nondetection of emission at 70 microns, indicates that this MDCC is in the prestellar (or quiescent) phase of evolution (see Contreras et al. 2017), and therefore is an ideal candidate to study the physical conditions in the early stages of the formation of massive stars. The paper is organized as follows: in Section 2 we describe the observations performed with the ALMA; in Section 3 we present the observational results; in Section 4 we discuss the analysis of the data, including the derivation of the physical parameters of the cores detected within the clump and their mass distribution; and in Section 5 we present a summary of the main points addressed in this paper.
2. Observations
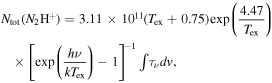
We observed, using ALMA, the 3 mm (100 GHz) dust continuum and molecular line emission toward G305.137+0.069. The observations were carried out as part of ALMA Cycle 1, between 2014 April 25 and 28, using both the 12 m array and the compact array (ACA; 7 m antennas). Because ALMA's field of view at this wavelength is ∼52 6 and the cloud covers a region ∼50'', a three-point mosaic with Nyquist sampling was needed to cover its full extent. The phase center of the pointings were (R.A., decl.) (J2000) = (13h10m39
 38, −62°43'017); (13h10m4170, −62°43'293); and (13h10m4402, −62°43'017). We observed four spectral windows in dual polarization mode centered at the frequencies of 89.2, 93.2, 98.0, and 110.2 GHz, each with a 234.4 MHz bandwidth and 122.1 kHz (∼ 0.4 km s−1) channels. This setup was chosen to map the emission in the HCO+(1–0), CS(2–1), 13CO(1–0), and N2H+(1–0) lines. The N2H+ molecule suffers little depletion and is one of the best probes of the coldest and densest gas (e.g., Caselli et al. 2002; Crapsi et al. 2007), HCO+ is a good tracer of kinematics (e.g., Rathborne et al. 2014a), and CS is a good tracer of lower-density material in outflows (e.g., Sakai et al. 2013). Parameters of the transitions, critical densities, and excitation energies are given in Table 1. Column 4 lists the standard critical density determined from a two-level approximation while column 5 lists the optically thin critical density derived using a multilevel approach (Shirley 2015). To map the 3 mm dust continuum emission we observed a set of three spectral windows in dual polarization mode, centered at the frequencies of 91.2, 103.2, and 104.9 GHz, each with a 1875 MHz bandwidth and a coarser frequency resolution channel spacing of 976.6 kHz (∼3 km s−1). J1107-4449 was used as a bandpass calibrator, J1308-6707 was used as phase calibrator, and Titan, Ceres, Mars, and Pallas as flux calibrators.
Table 1. Summary of the Observed Molecular Lines
| Line | Frequency | Eu/k |
 a
a
|
 b
b
|
|---|---|---|---|---|
| (GHz) | (K) | (cm−3) | (cm−3) | |
| (1) | (2) | (3) | (4) | (5) |
| HCO+ v = 0 J = 1–0 | 89.189 | 4.28 | 9.3 × 10⁵ | 4.5 × 10⁴ |
| N2H+ v = 0 J = 1–0 | 93.173 | 4.47 | 8.1 × 10⁵ | 4.1 × 10⁴ |
| CS v = 0 J = 2–1 | 97.981 | 7.05 | 5.7 × 10⁵ | 3.7 × 10⁵ |
| 13CO v = 0 J = 1–0 | 110.201 | 5.29 | 7.0 × 10² | ⋯ |
Notes.
aValues from nc = Aij/γij, using T = 20 K. bValues from Shirley (2015).Download table as: ASCIITypeset image
We used a combination of the 12 and 7 m arrays with projected baselines ranging from 18 to 490 m for the 12 m array, and from 8 to 37 m for the 7 m array. The largest angular scale of the recovered emission is 40'', corresponding to 0.7 pc at the distance of 3.4 kpc. All data reduction was performed using the CASA software package version 4.2.1 (McMullin et al. 2007). Each data set was independently calibrated (by our ALMA support scientist) before being merged. The proceeding for merging the data was as follows. First we concatenated the 12 and 7 m data, then applied a weight to the data based on the visibility scatter (statwt task) and finally cleaned (clean task) the product using Briggs weighting with a robustness parameter of 0.5 (detailed information about the tasks can be found in Lundgren 2012). The final merged data set has a synthesized beam of 239 × 210 (0.039 pc × 0.035 pc at 3.4 kpc) P.A. 2 5, a 1σ continuum sensitivity of ∼0.10 mJy beam−1, and a line brightness sensitivity of 18 mJy beam−1 per channel for the high-velocity resolution data (0.4 km s−1) and 1.9 mJy beam−1 per channel for the coarser velocity resolution data (∼3 km s−1).
3. Results
3.1. Continuum Emission
Figure 1, left panel, shows our image of the 3 mm dust continuum emission observed with ALMA. In the right panel, shown for comparison, is the 4.5 μm IR image from the Spitzer Space Telescope (∼2'' angular resolution) which exhibits a clear extinction feature toward the center. Both panels are overlaid with contours of the single dish dust continuum emission at 0.87 mm (ATLASGAL, ∼19'' angular resolution, Schuller et al. 2009).

Figure 1. Images of the millimeter and IR emission toward G305.137+0.069 at ∼2'' angular resolution. Left panel: 3 mm image from ALMA. Right panel: 4.5 μm image from Spitzer Space Telescope. In both images the white contour levels correspond to single dish dust continuum emission (ATLASGAL 870 μm, ∼19'' angular resolution, levels are drawn at 20%, 50%, and 90% of the peak emission of 3.46 Jy beam−1). The stars show the position of three Spitzer sources reported by Garay et al. (2015). The scale bar marks a size of 0.1 pc on the bottom right corner of the left panel.
Download figure:
Standard image High-resolution imageThe bulk of the dust continuum emission revealed by ALMA is concentrated toward the center of the clump—as determined from the single dish observations—and lies near the peak of the mid-IR extinction. The most prominent features that can be identified from a visual inspection of the ALMA image are a handful of bright compact structures as well as weaker emission distributed in filamentary-like structures. In order to be quantitative in the identification of features in the 3 mm image, we used two commonly employed algorithms, Dendrogram (Rosolowsky et al. 2008) and GaussClump (Stutzki & Guesten 1990). The number of compact structures (hereafter referred to as cores) extracted by GaussClump is twelve (shown by the orange ellipses in Figure 2) while Dendrogram extracted nine cores. Eight of the cores were extracted by both methods, with their parameters (flux densities and sizes) being similar (differences not larger than 10%). The most notable difference between the output of the two algorithms is in core mm-6 which was not extracted by Dendrogram. Due to the good agreement, hereafter we will adopt the core parameters determined from GaussClump given in Table 2.
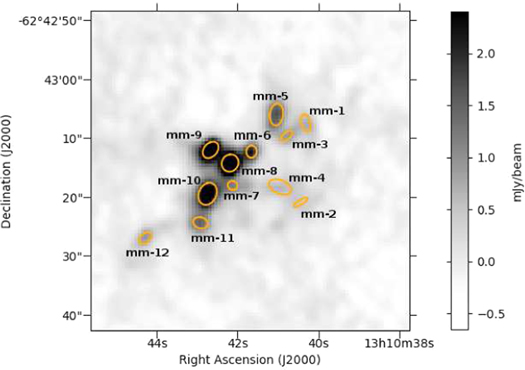
Figure 2. ALMA 3 mm dust continuum compact structures (shown as orange ellipses) extracted using the GaussClump algorithm (12 cores).The parameters used in the search are threshold = 3.5σ, step = 1σ, and size = 1 beam, where sigma = 0.099 mJy beam−1 and beam = 225.
Download figure:
Standard image High-resolution imageTable 2. Observed Parameters of the Dust Continuum Coresa
| Core | Peak Position | Peak Flux Densityb | Total Fluxb |
 c
c
|
|
|---|---|---|---|---|---|
| Name | α(J2000) | δ(J2000) | (mJy beam−1) | (mJy) | (arcsec) |
| (1) | (2) | (3) | (4) | (5) | |
| mm-1 | 13:10:40.28 | −62:43:07.34 | 0.86 ± 0.043 | 1.69 ± 0.084 | 1.99 ± 0.15 |
| mm-2 | 13:10:40.41 | −62:43:20.70 | 0.63 ± 0.032 | 0.68 ± 0.034 | 1.73 ± 0.13 |
| mm-3 | 13:10:40.71 | −62:43:09.44 | 1.02 ± 0.051 | 1.11 ± 0.055 | 1.62 ± 0.12 |
| mm-4 | 13:10:40.89 | −62:43:17.92 | 0.77 ± 0.039 | 3.07 ± 0.15 | 3.08 ± 0.22 |
| mm-5 | 13:10:40.98 | −62:43:05.85 | 1.75 ± 0.088 | 4.64 ± 0.23 | 2.66 ± 0.20 |
| mm-6 | 13:10:41.58 | −62:43:12.07 | 2.25 ± 0.11 | 2.41 ± 0.12 | 1.40 ± 0.10 |
| mm-7 | 13:10:42.04 | −62:43:17.90 | 1.40 ± 0.070 | 1.20 ± 0.060 | 1.04 ± 0.076 |
| mm-8 | 13:10:42.09 | −62:43:13.95 | 5.82 ± 0.29 | 10.47 ± 0.52 | 2.37 ± 0.17 |
| mm-9 | 13:10:42.58 | −62:43:11.76 | 4.36 ± 0.22 | 7.51 ± 0.38 | 2.29 ± 0.16 |
| mm-10 | 13:10:42.64 | −62:43:19.08 | 3.20 ± 0.16 | 9.67 ± 0.48 | 3.07 ± 0.22 |
| mm-11 | 13:10:42.83 | −62:43:23.98 | 1.57 ± 0.079 | 2.47 ± 0.12 | 1.80 ± 0.13 |
| mm-12 | 13:10:44.14 | −62:43:26.34 | 1.06 ± 0.053 | 1.46 ± 0.073 | 1.56 ± 0.11 |
Notes.
aCores identified using GaussClump with parameters threshold = 3.5σ, step = 1σ, and size = 1 beam. bWe estimate uncertainties in the flux of 5%. cFWHM angular size.Download table as: ASCIITypeset image
The flux density we measured in the ALMA continuum image within a region of ∼100'' in size is 85 mJy. A Gaussian fit to the intensity distribution observed with the ACA only gives an angular size of 191 × 128. An extrapolation of the flux densities measured with a single dish of 16.1 Jy at 0.87 mm (Garay et al. 2015) and 4.24 Jy at 1.2 mm (Garay et al. 2004), assuming a dust emissivity index, β, of 2, predicts a value at 3 mm of ∼110 mJy. The lower observed value is probably due to the more extended emission observed with a single dish being resolved out by the interferometric observations. This is supported by the fact that the size determined by the single dish observations is ∼33'' (Garay et al. 2004), smaller than that determined with the ACA.
Assuming that the dust continuum emission is optically thin, the beam averaged column density in each position of the image can be computed from the observed peak flux density (e.g., Kauffmann et al. 2008). Using a dust opacity at 3 mm of 0.21 cm2 g−1, interpolated from the tabulated values from the Ossenkopf & Henning (1994) Mathis, Rumpl, and Nordsieck (MRN; Mathis et al. 1977) distribution model with thin ice mantles that have coagulated at 106 cm−3, a mean molecular weight of 2.8, and a gas-to-dust ratio of 100, then Equation (A26) of Kauffmann et al. (2008) reads as

where  is the 100 GHz flux density observed in a beam of 239 × 210, measured in mJy. Adopting a uniform temperature of 20 K (average of the values reported by Garay et al. 2015 and Guzmán et al. 2015), we find that the column densities across G305.137+0.069 have a mean value of 4.3 × 1023 cm−2 and a maximum value of 8.1 × 1023 cm−2. In Section 4.1 we discuss the distribution of the column density across the clump.
3.2. Molecular Line Emission
Figure 3 shows images of the velocity integrated emission obtained with ALMA in the CS, HCO+, and N2H+ lines, along with the dust continuum image. The velocity range of integration is from −46.8 to −26.8 km s−1 for the CS and HCO+ lines, and from −50.0 to −43.2 km s−1 for the N2H+ line (corresponding to the lower velocity component of the hyperfine (HF) structure; see discussion below). Figure 3 shows that the molecular emission arises from a bright central region, with an angular size of ∼12'', and an extended, weaker envelope, best seen in the HCO+ line. The overall extent and morphology of the HCO+ and CS emission are similar, although they exhibit some differences, such as in the position of the peak line emission (shown as a black cross). We note that the weak emission in HCO+ is more uniformly distributed and extended than the weak continuum emission. This is most likely due to the HCO+ line being able to probe lower H2 column densities than the dust continuum emission. Of the three tracers, N2H+ is the one that best correlates with the dust continuum emission.

Figure 3. Images of the dust continuum emission and velocity integrated line emission from G305.136+0.068. Upper left: 3 mm continuum. Upper right: HCO+. Lower left: N2H+. Lower right: CS. In each panel overlaid in white contours is the 3 mm dust continuum emission at 20%, 50%, and 80% of the peak (5.82 mJy beam−1). The color scale is in units of mJy beam−1 in the continuum image and in Jy beam−1 km s−1 for the line images. The peak of each line emission is shown by the black crosses. The beam size is shown in the lower left corner of the continuum emission image (239 × 210)
Download figure:
Standard image High-resolution imageThe main characteristics of the observed profiles are illustrated in Figure 4, which shows the peak spectra observed toward the three brighter dust cores, mm-8, mm-9, and mm-10. The profiles of the HCO+ emission are highly complex, showing multiple velocity components and high-velocity wings. The multiple velocity components are seen across the whole clump, and we suggest that they mark the presence of gas flows driven by gravity (see discussion below). High-velocity wings are best seen in the profiles of the CS emission. The profiles of the N2H+ line are less complex, with the emission arising typically from a single velocity component. We note that the N2H+(1–0) transition consists of 15 main HF components, however, due to the overlap of closely spaced HF components, only three distinct lines are observed, as shown in Figure 4 (bottom left panel). Toward a few positions within the clump the spectra of the N2H+ emission shows double peaks in each of the three sets of blended HF components, indicating the presence of two velocity components in those lines of sight (e.g., toward mm-10). We suggest that these positions mark regions where flows driven by gravity are merging, giving rise to cores.
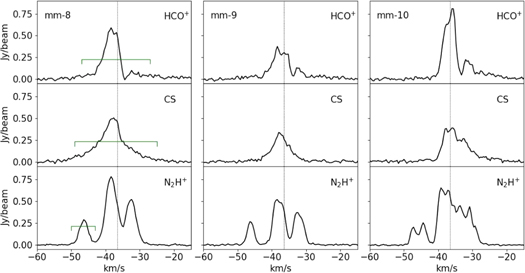
Figure 4. Spectra of the line emission observed at the peak position of the three brighter millimeter sources (see Table 2 for more details). From left to right: mm-8, mm-9, and mm-10. From top to bottom: HCO+, CS, and N2H+. The dashed vertical line shows the clump velocity of −36.5 km s−1 (Garay et al. 2015). The brackets show the velocity intervals used for the integration of the moment maps.
Download figure:
Standard image High-resolution imageFigure 5 presents a grid of the HCO+ spectra observed toward the 30'' × 30'' central region of G305.137+0.069, showing the complexity of the line shapes. Clearly seen are features such as high-velocity wings, skewness, and multiple peaks. This diversity of features has been predicted to be observed in models of compressible turbulence, which also show that the presence of non-Gaussian line-shape features decreases as time evolves (e.g., Falgarone et al. 1994). The line profiles observed toward G305.137+0.069 show similarities to the model spectra at early stages of evolution.

Figure 5. 30'' × 30'' spectral map of the HCO+ emission toward the central region of G305.137+0.069. The grid spacing is 2'' (roughly the beam size).
Download figure:
Standard image High-resolution imageTo characterize the emission at each point within the region we performed moment analysis of the data which allows an easy comparison of the characteristics of the emission in the different molecular transitions. Zeroth moment (M0, or integrated intensity), first moment (M1, or intensity weighted velocity field), and second moment (M2, or intensity weighted velocity dispersion) were computed using the expressions given in Lundgren (2012). The velocity range used in the moment calculations of HCO+ and CS is from −46.8 to −26.8 km s−1 (these ranges are marked in Figure 4). The moments of the N2H+ emission were computed using the lower velocity component of the three observed lines (velocity range from −50.0 to −43.2 km s−1), which is composed of a single HF component. Only those positions across the clump where the emission has a signal-to-noise ratio >3 were included in the moment analysis, using a threshold of 0.06 Jy beam−1 (∼3σ) for all three transitions. At clump locations where the spectra show multiple velocity components or self-absorption, this analysis may not describe the gas kinematics well, but it does provide a method to easily characterize and compare the emission from the tracers and the dust continuum across the clump.
Figure 6 shows the M0, M1, and M2 moments of the HCO+, CS, and N2H+ emission toward G305.137+0.069. Overlaid are contours of the integrated intensity to highlight the relation between the intensity of the emission of the gas and its kinematics. The intensity weighted velocity field images show that none of the molecular lines present organized motions or any clear velocity gradients across the clump. There is, however, a good agreement in the velocity field determined from the emission in the HCO+ and CS lines. In the N2H+ moment images an elongated structure is clearly seen, extending from southeast to northwest, aligned with the dust continuum cores, that is not present in the other two molecules.
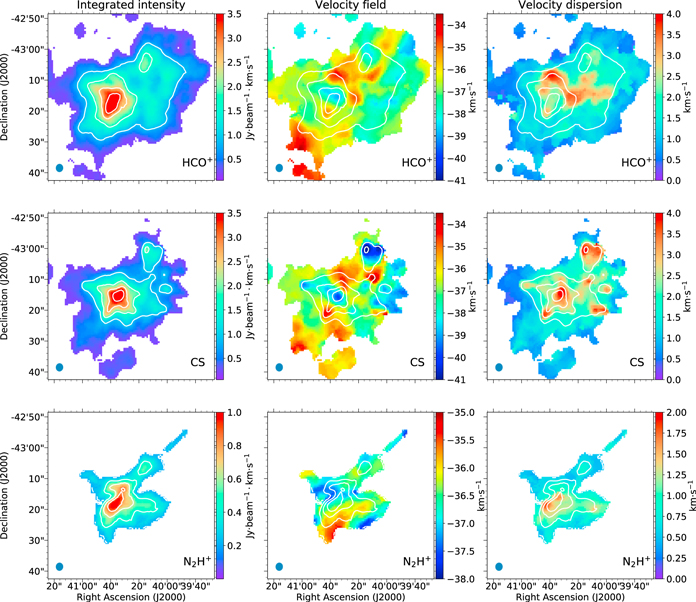
Figure 6. Moment maps of the HCO+, CS, and N2H+ emission (from top to bottom). From left to right: integrated intensity (zeroth moment, units of Jy beam−1 km s−1), intensity weighted velocity field (first moment, units of km s−1), intensity weighted velocity dispersion (second moment, units of km s−1). Overlaid in white are contour levels of the integrated intensity drawn at 20%, 40%, 60%, and 80% of the peak value (4.3, 4.6 and 1.1 Jy beam−1 km s−1 for HCO+, CS and N2H+, respectively). The beam is shown in the lower left corner (239 × 210).
Download figure:
Standard image High-resolution imageTo investigate in more detail the spatial distribution of the wing emission, we made contour maps of the velocity integrated CS emission in two ranges of blueshifted and redshifted radial flow velocities, intermediate (IV) and high (HV). The radial flow velocity, vflow, is defined as vLSR − v0, where v0 is the systemic velocity of the clump. The clump velocity is assumed to be −36.5 km s−1 (Garay et al. 2015). Figure 7 shows maps of the IV and HV CS emission overlaid on the ALMA dust continuum image. The range of flow velocity integration for the IV map (upper panel) is from −5 to −9 km s−1 for the blueshifted gas (blue contours) and from 5 to 9 km s−1 for the redshifted gas (red contours), and for the HV map (bottom panel) is from −9 to −14 km s−1 for the blueshifted gas and from 9 to 14 km s−1 for the redshifted gas. The morphology of the CS wing emission is quite complex, showing an intricate overlap between the blueshifted and redshifted emission. The question arises as to the energy source of the flowing motions. A possible explanation is that the observed morphology is due to the presence of a handful of outflows driven by low-mass protostars. We note that the highest blueshifted and redshifted flow velocities detected in the region arise from two compact structures located, respectively, to the southeast and northwest from core mm-8, which are possibly tracing a bipolar outflow and hence indicating that core mm-8 host an energy source. An alternative explanation is that the observed motions are the result of the global gravitational collapse of the clump. This scenario proposes that a cloud collapsing on a large scale gives rise, through the focusing effects of gravity, to the formation of a cluster of cores (Hartmann & Burkert 2007; Naranjo-Romero et al. 2015; Kuznetsova et al. 2018). The mass needed to explain the magnitude of the IV flow velocities, of ∼7 km s−1 over the spatial extent of the IV region, of ∼0.2 pc in radius, is ∼1 × 10³ M⊙. This value is similar to the mass of the whole clump, giving support to the suggestion that the observed motions are driven by gravity. As can be seen in the right panel of Figure 1, the molecular clump is engulfed by a photodissociated region (PDR). We suggest that the cold clump has become unstable and is collapsing due to the compression exerted by the warm gas of the PDR.
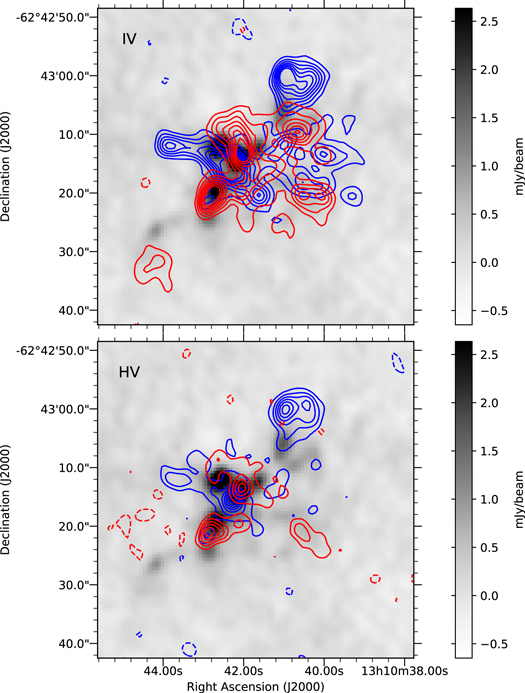
Figure 7. CS maps of intermediate-velocity (IV, upper panel) and high-velocity (HV, bottom panel) emission overlaid on the ALMA dust continuum (gray scale). The range of flow velocity integration for the IV map is from −5 to −9 km s−1 for the blueshifted gas (blue contours) and from 5 to 9 km s−1 for the redshifted gas (red contours), and for the HV map is from −14 to −9 km s−1 for the blueshifted gas and from 9 to 14 km s−1 for the redshifted gas.
Download figure:
Standard image High-resolution image3.2.1. Molecular Emission from Cores
In what follows we discuss the characteristics of the molecular gas from the cores, which allows us to investigate their kinematics and dynamical state. To determine the line center velocities and line widths we used the observations of the N2H+(1–0) line, as they mainly probe the emission from dense gas. We fitted the whole HF structure of the N2H+(1–0) line simultaneously using the N2H+ fitter from pyspeckit. The parameters of the 15 components used in the fit can be found in Daniel et al. (2005). Figure 8 shows the spectra of the N2H+(1–0) emission from the cores (i.e., of the emission integrated over the angular region subtended by the core) and the result of the HF fit. The fitted line center velocity, line width (FWHM width), and total optical depth are listed in Table 3.

Figure 8. Spectra of the integrated N2H+(1–0) emission from the cores. The red line shows the result of an HF fit using a single velocity component (labeled S) or two velocity components (labeled D). The fitted parameters are given in Table 3.
Download figure:
Standard image High-resolution imageTable 3. Observed Parameters of the N2H+(1–0) Emission from Coresa
| Core | Component | v | Δvb | τ |
|---|---|---|---|---|
| (km s−1) | (km s−1) | |||
| mm-1 | 1 | −36.24 ± 0.02 | 2.64 ± 0.04 | 0.54 ± 0.01 |
| mm-2 | 1 | −37.91 ± 0.08 | 1.94 ± 0.16 | 2.43 ± 0.57 |
| 2 | −35.40 ± 0.07 | 2.01 ± 0.13 | 0.42 ± 0.02 | |
| mm-3 | 1 | −36.38 ± 0.03 | 2.60 ± 0.06 | 0.51 ± 0.01 |
| mm-4 | 1 | −37.36 ± 0.05 | 2.01 ± 0.12 | 0.55 ± 0.01 |
| 2 | −35.03 ± 0.04 | 1.52 ± 0.10 | 1.02 ± 0.46 | |
| mm-5 | 1 | −36.76 ± 0.02 | 2.36 ± 0.05 | 1.45 ± 0.25 |
| mm-6 | 1 | −36.61 ± 0.02 | 2.98 ± 0.06 | 0.92 ± 0.25 |
| mm-7 | 1 | −37.85 ± 0.10 | 2.21 ± 0.12 | 0.39 ± 0.05 |
| 2 | −35.58 ± 0.19 | 2.55 ± 0.27 | 2.57 ± 0.60 | |
| mm-8 | 1 | −37.04 ± 0.02 | 3.09 ± 0.05 | 1.88 ± 0.23 |
| mm-9 | 1 | −36.88 ± 0.02 | 2.56 ± 0.06 | 3.33 ± 0.35 |
| mm-10 | 1 | −37.96 ± 0.06 | 2.20 ± 0.10 | 0.98 ± 0.03 |
| 2 | −35.25 ± 0.09 | 1.99 ± 0.15 | 4.05 ± 0.74 | |
| mm-11 | 1 | −37.18 ± 0.07 | 2.30 ± 0.13 | 0.57 ± 0.02 |
| 2 | −35.01 ± 0.06 | 1.54 ± 0.12 | 8.55 ± 1.73 | |
| mm-12 | 1 | −34.56 ± 0.01 | 1.92 ± 0.04 | 0.38 ± 0.01 |
Notes.
aDerived from a fit to the whole HF structure. bLine width (FWHM).Download table as: ASCIITypeset image
For the cores with single line profiles, the line widths range from 1.9 to 3.1 km s−1 with an average value of 2.6 km s−1. These widths are much larger than the thermal widths of 0.18 km s−1 at the temperature of 20 K, showing that nonthermal motions dominate the motions within the cores. This is in contrast to cores in low-mass clumps which tend to approach thermal broadening previous to the formation of a protostar (e.g., Pineda et al. 2010). Whether the nonthermal motions correspond to random turbulence or core-scale motions is difficult to discern. From simulations of hierarchical fragmentation in a globally collapsing cloud, Naranjo-Romero et al. (2015) concluded that the velocity dispersion at all scales is caused by infall motions. Given that this MDCC seems to be globally collapsing, then the observed line widths could be reflecting infalling motions within already collapsing cores.
Assuming that the level populations of a molecular species are described by a single excitation temperature, Tex, then the total column density of the molecule can be determined knowing the optical depth in a single transition (e.g., Garden et al. 1991; Mangum & Shirley 2015). In particular for observations of the  transition of N2H+, Equation (95) of Mangum & Shirley (2015) reads, using a dipole moment of 3.40 Debyes and a partition function Qrot = 0.45(Tex + 0.75), as
where τν is the total optical depth of the  HF structure. The column densities of N2H+, computed using the total optical depths reported in Table 3 and assuming Tex = 20 K, are given in column 2 of Table 4. They range from 9.3 × 10¹³ to 1.1 × 1015 cm−2, with an average value of 4.4 × 1014 cm−2. Column 4 of Table 4 gives the [N2H+/H2] abundance ratio, estimated as the ratio of the column densities in these two species. The column densities of H2, given in column 3, were determined from the dust continuum emission integrated over the angular region subtended by the cores. We find that the average [N2H+/H2] abundance ratio in the cores is 3.1 × 10⁻⁹, a value similar to the one reported by Sanhueza et al. (2012) for quiescent clumps.
Table 4. Column Densities of Cores with a Single Velocity Component in the N2H+ J = 1–0 Transition
| Core | N(N2H+) | N(H2) | [N2H+/H2] |
|---|---|---|---|
| (cm−2) | (cm−2) | ||
| mm-1 | 1.8 × 10¹⁴ | 6.1 × 10²² | 3.0 × 10⁻⁹ |
| mm-3 | 1.7 × 10¹⁴ | 6.0 × 10²² | 2.9 × 10⁻⁹ |
| mm-5 | 4.4 × 10¹⁴ | 9.4 × 10²² | 4.7 × 10⁻⁹ |
| mm-6 | 3.5 × 10¹⁴ | 1.8 × 10²³ | 2.0 × 10⁻⁹ |
| mm-8 | 7.4 × 10¹⁴ | 2.7 × 10²³ | 2.8 × 10⁻⁹ |
| mm-9 | 1.1 × 10¹⁵ | 2.1 × 10²³ | 5.3 × 10⁻⁹ |
| mm-12 | 9.3 × 10¹³ | 8.5 × 10²² | 1.1 × 10⁻⁹ |
Download table as: ASCIITypeset image
4. Discussion
4.1. Dust Column Density (N-PDF)
Figure 9 shows the dust column density probability distribution function (N-PDF) for G305.137+0.069, obtained using a Gaussian kernel density estimation (KDE) to avoid dependencies on the bin choice. The error of the KDE was obtained using the bootstrap method (Efron 1980). The top panel shows the N-PDF obtained including the Gaussian noise. Its shape can be described by a combination of three distributions, (i) a Gaussian distribution, which describes the noise of the column density image; (ii) a log-normal distribution, which is a signature of turbulent gas; and (iii) a power-law distribution, which is related to self-gravitating gas. The point where the N-PDF changes from log-normal to power law is an indicator that represents a transition between the gas dynamics being dominated by supersonic turbulence, which builds the log-normal distribution, to densities where gravity plays an increasingly important role (Burkhart et al. 2017). We performed a simultaneous Bayesian estimation of the parameters of the three distributions using a Markov chain Monte Carlo sampler (Sharma 2017) to obtain reliable parameter errors. The piecewise function used is defined as follows
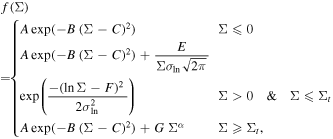
where Σ is the column density, σln is the width of the log-normal distribution, α is the slope of the power law, and Σt is the transition point between the log-normal and power-law distributions.

Figure 9. Column density PDF Gaussian kernel density estimation for G305.136+0.068 (blue line). Blue shaded regions show the uncertainties obtained through the bootstrap method (Efron 1980). The top panel shows the observed (blue line) and inferred (gray line) N-PDFs. The last is a combination of three distributions, a Gaussian for the noise, a log-normal for the turbulent gas, and a power law for the self-gravitating gas. The bottom panel shows the N-PDF with the noise subtracted, and the inferred contributions of the log-normal (orange) and power-law (green) distributions. The vertical red line shows the point at which the N-PDF deviates from log-normal, N(H2) = (8.4 ± 0.23) × 1022 cm−2. The thickness of the lines represents 1σ errors. The 1σ noise level is equivalent to N(H2) = 1.4 × 1022 cm−2.
Download figure:
Standard image High-resolution imageThe bottom panel of Figure 9 shows the N-PDF with the Gaussian noise subtracted, leaving only the contributions from the turbulent and self-gravitating gas components. This N-PDF is well described with a log-normal distribution (orange line) plus a power law (green line). The 1σ confidence interval is represented by the thickness of the lines. The deviation point from the log-normal to the power-law regime is well determined with a low associated error, which is shown as a red line. The column density where gravity starts to take the leading role corresponds to (8.4 ± 0.23) × 1022 cm−2. We note that this is only a reference value, as the deviation point can also be affected by changes in the temperature of the gas in the vicinity of young protostars. However, in either case the deviation from the log-normal distribution indicates the effect of self-gravity. The inferred value for the width of the log-normal distribution is σln = 0.27 ± 0.01 and for the slope of the power law, α = −2.20 ± 0.01.
Observations of clouds in the solar neighborhood suggest a column density threshold of ∼1.4 × 1022 cm−2 above which star formation takes place with high efficiency (Lada et al. 2010). In the case of G305.137+0.069 the column densities are higher than this threshold, as for other regions (Rathborne et al. 2014b), suggesting that this value may not be universal.
4.2. Physical Parameters of Cores
The derived physical parameters of the cores are summarized in Table 5. The radius, given in column 2, was determined from the relation  where Θ is the FWHM angular size determined from a 2D Gaussian fit to the spatial intensity distribution. The radius of the cores range from 1800 to 5300 au. The mass was computed from the observed flux density, assuming that the dust emission is optically thin (Hildebrand 1983). For a distance of 3.4 kpc, a dust temperature of 20 K, a dust absorption coefficient of 0.21 cm2 g−1 (see Section 3.1), and a gas-to-dust ratio of 100, expression (1) of Contreras et al. (2018) reads

where F3 mm(mJy) is the flux density at 3 mm in mJy. The mass of the cores, given in column 3, range from 3.3 to 50.6 M⊙. The densities of the cores, given in column 4, were computed from the mass and radius as n = 3M/4πR3. They range from 3.1 × 10⁶ to 3.1 × 107 cm−3.
Table 5. Derived Parameters of Cores
| Core | Radius | Mdust | Density | Mvir | αvir |
|---|---|---|---|---|---|
| (×103 au) | (M⊙) | (×106 cm−3) | (M⊙) | ||
| (1) | (2) | (3) | (4) | (5) | (6) |
| mm-1 | 3.4 ± 0.5 | 8.2 ± 1.9 | 6.4 ± 2.2 | 24.0 ± 3.5 | 3.0 ± 0.6 |
| mm-2 | 3.0 ± 0.4 | 3.3 ± 0.77 | 3.9 ± 1.3 | ⋯ | ⋯ |
| mm-3 | 2.8 ± 0.4 | 5.3 ± 1.3 | 7.7 ± 2.6 | 19.0 ± 2.8 | 3.6 ± 0.7 |
| mm-4 | 5.3 ± 0.7 | 14.8 ± 3.5 | 3.1 ± 1.1 | ⋯ | ⋯ |
| mm-5 | 4.5 ± 0.6 | 22.5 ± 5.3 | 7.3 ± 2.5 | 25.7 ± 3.8 | 1.1 ± 0.2 |
| mm-6 | 2.4 ± 0.3 | 11.6 ± 2.7 | 26.1 ± 8.8 | 21.5 ± 3.2 | 1.9 ± 0.4 |
| mm-7 | 1.8 ± 0.3 | 5.8 ± 1.4 | 31.4 ± 10.6 | ⋯ | ⋯ |
| mm-8 | 4.0 ± 0.6 | 50.6 ± 11.9 | 23.3 ± 7.9 | 39.2 ± 5.7 | 0.78 ± 0.2 |
| mm-9 | 3.9 ± 0.6 | 36.3 ± 8.5 | 18.4 ± 6.3 | 26.0 ± 3.9 | 0.72 ± 0.1 |
| mm-10 | 5.2 ± 0.7 | 46.7 ± 11.0 | 9.9 ± 3.3 | ⋯ | ⋯ |
| mm-11 | 3.1 ± 0.4 | 12.0 ± 2.8 | 12.5 ± 4.2 | ⋯ | ⋯ |
| mm-12 | 2.7 ± 0.4 | 7.1 ± 1.7 | 11.3 ± 3.8 | 10.0 ± 1.5 | 1.4 ± 0.3 |
Download table as: ASCIITypeset image
Most of the cores have column densities lying above the threshold for star formation derived from the N-PDF analysis of G305.137+0.069 (see Figure 9), and hence are expected to be self-gravitating objects. To assess whether the cores in this MDCC are gravitationally bound or unbound and transient (ignoring the effects of magnetic fields or external pressure), we computed the virial mass, Mvir, defined as Mvir = 5σ2R/G, where σ is the velocity dispersion (σ = Δv/2.35), R is the radius, G is the gravitational constant, and the virial parameter, αvir, is defined as αvir = Mvir/Mdust where Mdust is the core-mass derived from the dust continuum observations. The virial mass and virial parameter of the cores, computed using the sizes given in Table 5 and the line widths of the N2H+ emission given in Table 3, are given in columns 5 and 6 of Table 5, respectively. Five cores have αvir values within a factor of 1.5 of the nominal value for virial equilibrium, indicating that they are likely to be gravitationally bound structures. There are two cores (mm-1 and mm-3) with αvir greater than 3, suggesting they may correspond to transient objects. In what follows we describe the properties of the three most massive cores within the clump, individually.
mm-8. This core, located at the center of the MDCC (see Figure 2), is the most massive one within G305.137+0.069, with a mass of 50.6 M⊙. It has a radius of 4000 au, a center velocity of −37.0 km s−1, and a line width of 3.1 km s−1. Its virial parameter is 0.78, consistent with being gravitationally bound and prone to collapse. This core exhibits strong high-velocity redshifted and blueshifted emission in CS (see Figure 4). It is not clear, however, whether the HV emission arises from streams of gas falling toward the center of the gravitational potential or from a bipolar outflow driven by a protostar embedded in this core. Nevertheless, there is a lack of observations that could support the latter possibility.
mm-9. Located 37 northeast from mm-8 (see Figure 2), this core has a dust mass of 36.3 M⊙ and a radius of 3900 au. Its center velocity is −36.9 km s−1 and its line width is 2.6 km s−1. Its virial parameter is 0.7, indicating that it is gravitationally bound and possibly collapsing. The spectra of HCO+ shows a weak self-absorption feature (see Figure 4).
mm-10. Located 6'' southeast of mm-8 (see Figure 2), this core is the second most massive within the clump, having a dust mass of 46.7 M⊙ and a radius of 5200 au. The N2H+ spectra shows the presence of two velocity components (see Figure 4). A fitting made using the two sets of HF components gives center velocities of −38.0 and −35.3 km s−1 and line widths of 2.2 and 2.0 km s−1, respectively. In addition to these two velocity components, the CS spectra toward core mm-10 shows high-velocity redshifted emission (see Figure 7). These results suggest that mm-10 might be the result of converging flows.
Garay et al. (2015) identified, within a region of 20'' in radius centered at the peak position of the clump, three compact mid-IR sources, indicated by the stars in Figure 1. These objects were detected in all Spitzer IRAC bands, as part of the GLIMPSE Legacy Program, as well as at 24 μm as part of the MIPSGAL survey (Carey et al. 2006), making them good candidates for embedded objects. Garay et al. (2015) investigated the nature of the mid-IR sources by fitting their spectral energy distribution, in the range from 3.6 to 24 μm, using a large grid of precomputed models (Robitaille et al. 2007). We find that the predictions of the model fitting regarding the dust mass associated to the IR sources are in disagreement with the ALMA 3 mm observations reported here. In particular, the best-fit model of the central mid-IR source (their source B) corresponded to an object with a massive (∼9.3 M⊙) envelope that is undergoing a large accretion rate, leading to Garay et al. (2015) to suggest that it corresponds to the seed of a high-mass protostar still in the process of formation. However, the lack of 3 mm emission from from this object is in large disagreement with the prediction of the spectral energy distribution (SED) fitting model, indicating that source B does not correspond to a young embedded object.
4.3. Fragmentation and the CMF
Massive clumps are expected to fragment into cores leading to the formation of a cluster of stars. However, the properties of the cores at the early stages of evolution of MDCCs are poorly known. Our ALMA observations of the G305.137+0.069 clump offer the possibility to investigate the CMF within an MDCC in an early stage of evolution. We recall that the G305.137+0.069 clump has a mass of 1.1 × 10³ M⊙, an average density of ∼2 × 105 cm−3 (Garay et al. 2004), and an average temperature of 20 K. The thermal Jeans-mass under these conditions is 3.5 M⊙. Hence, G305.137+0.069 MDCC can potentially form a cluster of stars; moreover, its mass and radius are consistent with high-mass star cluster progenitors (Kauffmann & Pillai 2010).
A handful of observations toward low-mass, star-forming regions show that the CMF of their small-scale (<6000 au) starless cores has a shape (or slope) similar to that of the stellar IMF, suggesting that the cores are direct progenitors of the stellar masses (e.g., Motte et al. 1998; Könyves et al. 2015). To investigate whether this conclusion holds for regions likely to form high-mass stars, such as G305.137+0.069, we show in Figure 10 the empirical cumulative distribution function (CDF) of core-mass, namely the proportion of cores that have masses equal or smaller than a given value, for the cores reported in Table 2. We note that due to the small number of cores we preferred to use the CDF, rather than the differential form of the CMF, to avoid numerical biases introduced by binning. Assuming  , the value of the power-law index γ that best reproduces the observed CDF is 0.02 ± 0.37 (1σ errors) and the 90% confidence interval is −0.60 to 0.64. This power-law index is much flatter than that of the IMF for stars with masses greater than 1 M⊙, of −1.35 (Kroupa 2001), indicated by the orange line. We conclude that in G305.137+0.069 there is an excess of high-mass cores (masses above 30 M⊙) relative to the population of intermediate-mass cores (5–10 M⊙) if the distribution of core masses followed a Kroupa IMF. A similar conclusion has been recently reported for the cores in the W43-mm1 region, for which a γ index of −0.9 has been derived (Motte et al. 2018). Furthermore, our ALMA observations also indicate that there is a lack of low-mass cores in the bin 2.7–4.6 M⊙ that cannot be attributed to a sensitivity bias, as the 5σ limiting mass of our observations corresponds to 2.4 M⊙. Similar findings have been reported toward a few MDCC in an early stages of evolution (Bontemps et al. 2010; Zhang et al. 2015).

Figure 10. Core-mass function (CMF) for the cores within G305.137+0.069. The blue line shows the cumulative distribution function of the cores, the orange line shows the initial mass function distribution (IMF) from Kroupa (2001). The green line and green shaded area show the maximum likelihood estimation of the power-law index (γ = 0.02) and its 90% confidence interval (γ ∈ [−0.60, 0.64]), respectively.
Download figure:
Standard image High-resolution imageFurther, we find that the total mass in the form of cores toward G305.137+0.069 is 224 M⊙. Therefore ∼30% of the total mass of the clump is in the form of cores with masses ≳3 M⊙. The remaining, more diffuse, gas can be a reservoir for the existing cores to continue accreting, and therefore increase their mass, or give rise to new cores.
4.4. Constraints on Models of High-mass Star Formation
In what follows we discuss the above results in the frame of the proposed models and the constraints they impose on them. The shape of the CMF in G305.137+0.069 is definitively different from that of the stellar IMF, showing an overpopulation of high-mass cores compared to intermediate-mass cores. This result is difficult to reconcile with the competitive accretion model (Bonnell & Bate 2002), which assumes that initially the clump fragments into cores of thermal Jean-mass which then accrete matter from the surroundings to give rise to a CMF similar in shape to the IMF (e.g., Motte et al. 1998; Testi & Sargent 1998; Könyves et al. 2015). Since G305.137+0.069 is highly turbulent, we first consider whether the formation of the dense cores in this MDCC could be explained by the turbulent fragmentation model proposed by Padoan & Nordlund (2002). They showed that the mass distribution of cores with masses above 1 M⊙ formed by the process of turbulent fragmentation follows a power-law with a slope of 3/(4-β), where β is the power spectrum index of the turbulence. The derived value of the slope of the core-mass distribution in G305.137+0.069, of 0.02, cannot be explained by a reasonable value of β.
The number of observed fragments in G305.137+0.069 is at least an order of magnitude smaller than the number of Jeans masses in the clump, of ∼300 (=Mclump/MJ), being limited to a small number of massive cores. The limited fragmentation at the early evolutionary stages of MDCCs has been already reported by Csengeri et al. (2017) but with observations made at lower angular resolution. A similar result to ours was recently reported by Contreras et al. (2018) who detected, using ALMA observations with 12 resolution, only 22 cores toward the massive (∼1200 M⊙) IR dark cloud G331.372-0.116. The extracted cores in G305.137+0.069 have a mean mass of 18.7 M⊙, about five times larger than the Jean-mass (at the average condition of the clump). Possible mechanisms that increase the mass scale for fragmentation include turbulence and magnetic fields. In addition, it has been argued that the level of fragmentation could be limited to a few massive cores if the clump is undergoing global gravitational collapse (Bontemps et al. 2010; Schneider et al. 2010). This possibility finds support in single dish observations that indicate G305.137+0.069 is undergoing large scale infalling motions (Garay et al. 2015). This is illustrated in Figure 11 which shows the profiles of the optically thick HCN(3–2) and optically thin HNC(3–2) lines as observed with the APEX telescope (FWHM beam of 20''; Servajean 2019). A fit to these line profiles using the simple Hill5 model of De Vries & Myers (2005) indicates an infall velocity of ∼2.5 km s−1.
Figure 11. Spectra of the HNC(3–2) and HCN(3–2) emission toward G305.137+0.069 observed with the APEX telescope. The red line indicates a fit using the Hill5 collapse model of De Vries & Myers (2005). The derived parameters are shown in the upper right corner.
Download figure:
Standard image High-resolution image
Theoretical works (e.g., Koyama & Inutsuka 2000; Heitsch et al. 2008) have shown that low-velocity shocks appear in turbulent colliding flows. Interestingly low-velocity SiO emission, likely to arise from shocks, has been detected toward G305.137+0.069 (Jackson et al. 2013) giving further support to the idea that the cores are forming via the merging of flows driven by gravity in a turbulent clump. The question of whether the observed cores in G305.137+0.069 will continue to fragment leading to the formation of a group of low-mass stars or collapse into a single high-mass star is difficult to discern with the present data. The first alternative may find support by the fact that in MDC in more evolved stages of evolution, the CMF closely resembles the IMF shape (e.g., Ginsburg et al. 2017). On the other hand, using the empirical mass versus radius relationship of Kauffmann & Pillai (2010) above which cores avoid fragmentation, we might conclude that most of the cores in G305.137+0.069 will not undergo fragmentation and form a single massive protostar.
The new ALMA observations strongly suggest that the CMF in MDCCs is not universal, and is likely to depend on the dynamical state (or evolutionary stage) of the clump as well as on its mass. We find that massive clumps in their early stages of evolution are underpopulated with low-mass cores. This suggests that high-mass stars may only form in dynamical clouds during the initial cluster formation phase whereas low-mass stars form continuously and may approach the standard IMF at later stage.
5. Summary
We performed ALMA observations of 3 mm dust continuum and molecular emission, in the HCO+, CS, and N2H+ lines, toward the massive dense and cold clump G305.136+0.069 in order to reveal its small-scale structure. The results are summarized as follows.
- (1)From the continuum image we identified, using the GaussClump algorithm, 12 cores. The dust derived masses range from 3.3 to 50.6 M⊙, their sizes from 1800 to 5300 au, and their densities from 3.1 × 10⁶ to 3.1 × 107 cm−3.
- (2)The column densities across G305.136+0.069 have a mean value of 4.3 × 1023 cm−2 and a maximum value of 8.1 × 1023 cm−2. An analysis of the column density PDF shows that the deviation point from a log-normal distribution to a power-law regime is (8.4 ± 0.23) × 1022 cm−2. Most of the extracted cores have column densities larger than this value, suggesting they are self-gravitating.
- (3)The shape of the CMF above 3 M⊙ in G305.137+0.069 is definitively different from that of the IMF, showing an excess of high-mass cores compared to intermediate-mass cores. In addition there are a lack of low-mass cores (masses in the range from 3 to 5 M⊙). We interpret these results as indicating that in the early stages of collapse of massive dense clumps only massive cores are formed, and suggest that high-mass stars may only form in dynamical clouds during the initial cluster formation phase, whereas low-mass stars form continuously and may approach the standard IMF at a later stage.
- (4)Emission was detected in all three observed molecular transitions. The observed profiles in the HCO+ and CS lines are highly complex, showing high-velocity wings, self-absorption features, and multiple peaks. The diversity of non-Gaussian line-shape features indicates that G305.137+0.069 is a turbulent clump in an early stage of evolution. The overall morphology of the emission in the HCO+ and CS lines are similar, indicating that they trace the same molecular gas, with their weak emission being more uniformly distributed and extended than the weak continuum emission. The N2H+ emission is best correlated with the continuum emission and hence with the cores.
- (5)The line widths of the cores range from 1.9 to 3.1 km s−1 and are therefore dominated by nonthermal motions. Whether the large line widths are reflecting microturbulent motions or infalling motions within collapsing cores is difficult to assess. The most massive cores have virial parameters smaller than 1, suggesting they are probably collapsing.
- (6)The observed spatial morphology and kinematics of the gas within the G305.137+0.069 MDCC convey the idea that the cores are formed in a globally collapsing clump. As the contracting clump evolves, the gas is gravitationally focused toward the central potential well leading to the formation of filamentary structures and to cores through the merging of flows.
E.S. and G.G. gratefully acknowledge support from CONICYT projects PFB-06 and AFB-170002. E.S. acknowledges support from Programa Nacional de Becas de Postgrado, CONICYT (grant D-21110496). This paper makes use of the following ALMA data: ADS/JAO.ALMA#2012.1.00538.S. ALMA is a partnership of ESO (representing its member states), NSF (USA) and NINS (Japan), together with NRC (Canada), MOST and ASIAA (Taiwan), and KASI (Republic of Korea), in cooperation with the Republic of Chile. The Joint ALMA Observatory is operated by ESO, AUI/NRAO and NAOJ.
Facilities: APEX, ALMA.
Software: CASA (McMullin et al. 2007), astrodendro (http://www.dendrograms.org/), PySpecKit (Ginsburg & Mirocha 2011).