


Abstract
Recent analyses of the excess of gamma-ray radiation emanating from the Galactic center (GC) region suggest an origin in a population of thousands of undetected millisecond pulsars (MSPs). We have conducted a search for pulsar candidates using new high-sensitivity, wide-field radio observations of the GC covering 5 deg2. We conducted the search at a low frequency of ∼320 MHz in order to take advantage of the very steep spectra typical of pulsars. Additional observations at 6 GHz of the most steep-spectrum, compact sources resulted in a list of seven candidate pulsars. No pulsations were detected for any of the candidates in a search conducted with the GBT at 1.5, 2, and 6 GHz, presumably due to severe temporal scattering in the GC region or along the line of sight. We discuss the implications of the nondetections on pulse period and distance estimates using two different models of the Galactic distribution of ionized gas. For our best candidate, C1748−2827, located 43' from Sgr A*, we estimate that pulsations from a normal pulsar would have been detected up to a distance of ∼8 kpc and from an MSP up to ∼4.5 kpc.
Export citation and abstract BibTeX RIS
1. Introduction
Given the enhanced gas and stellar densities at the Galactic center (GC), it has long been predicted that a large population of neutron stars would be found in this region (Paczynski & Trimble 1979; Cordes & Lazio 1997; Pfahl & Loeb 2004). There has been some success at identifying X-ray binaries (Zhao et al. 1992; Bower et al. 2005; Hailey et al. 2018) and probable pulsar wind nebulae toward the GC (e.g., Park et al. 2005). Pulsation searches in the GC region have been focused mainly on finding radio pulsars within the star cluster around Sagittarius A* (Sgr A*) and especially in the immediate vicinity of the supermassive black hole at the center of the Galaxy. Johnston et al. (2006) and Deneva et al. (2009) tiled a small (≲1°) area around Sgr A* and discovered a total of five normal (i.e., nonrecycled) pulsars within 10'–15' of Sgr A*. Their dispersion measures (DMs) are 962–1456 pc cm−3, corresponding to line-of-sight distances that place these pulsars within the bulge according to the models of the ionized gas in the Galaxy (Cordes & Lazio 2002; Yao et al. 2017). Macquart et al. (2010), Wharton et al. (2012), and Siemion et al. (2013) performed deep pointed observations of the central parsec around Sgr A* itself but did not discover any new pulsars. Mori et al. (2013) serendipitously discovered a magnetar in X-rays only 3'' from Sgr A*. The magnetar was subsequently detected as a radio pulsar at multiple radio frequencies. It has the highest DM of all known pulsars to date, 1778 pc cm−3, corresponding to a line-of-sight distance of 8.3 kpc. So far, no millisecond pulsars (MSPs) have been found near Sgr A* (Macquart & Kanekar 2015).
The low pulsar yield in the GC region has been attributed to the hyperstrong scattering occurring within ∼100 pc of Sgr A* (Lazio & Cordes 1998). The effects of this scattering can be seen clearly in the angular broadening of stellar masers (van Langevelde et al. 1992; Frail et al. 1994) and Sgr A* itself (Bower et al. 2006) and implies such strong temporal broadening that pulsations would be difficult to detect at the typical decimeter wavelengths used in searches. By contrast, the observed temporal broadening of the magnetar PSR J1745−3009 near Sgr A* is much smaller (∼1.5 s at 1 GHz) than expected if the enhanced scattering is local to the GC, and the bulk of the scattering is likely occurring along the line of sight in the Scutum spiral arm (Bower et al. 2014). This result suggests either that the distribution of the turbulent, ionized gas is more complex than assumed or that there is a genuine dearth of pulsars at the GC (Spitler et al. 2014; Pynzar' 2015; Rajwade et al. 2017).
Recently, there has been a renewed interest in finding pulsars at the GC. Data from the Fermi spacecraft show that there is a γ-ray emission excess (GRE) coming from a radius of ∼15° around the GC (Vitale & Morselli 2009; Hooper & Goodenough 2011). While these early studies favored an origin in the annihilation signature of dark matter particles, recent analyses of the spatial and spectral properties of the GRE using data from the entire Fermi mission to date argue that the GRE is caused by a population of thousands of MSPs (Ajello et al. 2016; Bartels et al. 2016; Calore et al. 2016; Lee et al. 2016; Gonthier et al. 2018).
Confirming this hypothesis requires direct detection of pulsations. Most MSPs are in binary systems, and searching for MSP pulsations directly in Fermi γ-ray data with no prior knowledge of orbital parameters is still not computationally feasible. Furthermore, blind radio surveys are prohibitively expensive in telescope time, since they have small fields of view at the high frequencies required to mitigate the putative scattering in the GC (Calore et al. 2016). An effective means of overcoming these barriers was recently demonstrated through discovery of an MSP toward the GC (Bhakta et al. 2017). The approach relies on efficient localization of unresolved, steep-spectrum radio sources from wide-field, low-frequency images (see Frail et al. 2018). By way of historical example, the radio source 4C21.53W was intimated to be a fast, highly dispersed pulsar (Erickson 1983) prior to its discovery as the first MSP (Backer et al. 1982) based entirely on an analogy of its steep low-frequency spectrum to the then-fastest-known Crab pulsar.
In this paper, we expand on the original pilot study (Bhakta et al. 2017), increasing the number of candidates approximately fourfold using a deeper low-frequency image and following up potential candidates with higher angular resolution interferometric imaging and single-dish pulsation searches. In Section 2, we introduce this low-frequency monitoring survey (Section 2.1), the method that we use to identify initial pulsar candidates (Section 2.2), the follow-up observations to eliminate false positives (Section 2.3), and the search for pulsations (Section 2.4). Our results are presented in Section 3, and in Section 4, we summarize the challenges and prospects for future GC pulsar searches.
2. Observations and Methods
Our observations are done in multiple different steps similar to previous studies (e.g., Bhakta et al. 2017; Frail et al. 2018). We first make a deep, low-frequency, wide-field image (5 deg2) centered on Sgr A* to identify all known radio sources in the field (Section 2.1). Then, using archival data and existing all-sky surveys at other frequencies, we produce continuum spectra for each radio source. We identify the most promising pulsar candidates using compactness and spectral slope criteria (Section 2.2). Next, we follow up this subsample of potential pulsar candidates with high angular resolution interferometric observations in order to eliminate resolved radio sources from further consideration (Section 2.3). Finally, we carry out single-dish observations of the final candidate list to look for pulsations (Section 2.4).
2.1. Wide-field, Low-frequency Imaging
Observations of the GC were made from 2013 to 2016 with the new low-band P-band system (∼250–500 MHz) of the Karl G. Jansky Very Large Array (VLA) with the scientific goal to search for radio transients (e.g., Hyman et al. 2002, 2005, 2009). The VLA proposal codes include 13B-321, 15A-195, 16A-263, and 16B-264. The combined legacy VLA (330 MHz center frequency and 6 MHz bandwidth) and low-band VLA transient rates are reported in Polisensky et al. (2016). The much wider upgraded VLA bandwidth yields images of significantly greater sensitivity compared to the legacy VLA observations of Nord et al. (2004), which allows for the detection of much fainter field sources. Since much of the band suffers from radio frequency interference (RFI), we have selected a 64 MHz wide portion with a central frequency of 320 MHz, relatively free of RFI, and still 10× wider than the bandwidth of the legacy P-band system.
We made images from separate combinations of three ∼1 hr B-configuration observations and two ∼1 hr A-configuration observations made in 2013 and 2014 (Table 1). Wide-field and multifrequency synthesis imaging techniques were employed using the AIPS and CASA data reduction software packages (Greisen 2003; McMullin et al. 2007). The 64 MHz bandwidth was calibrated on 3C 295, which was also used for absolute flux calibration. Initial phase calibration was performed using J1714−2514. Several rounds of self-calibration were employed using the clean-component model of the GC taken from Nord et al. (2004). For imaging, an inner u–v plane cutoff of 1 kλ was employed to mitigate against confusion from large-scale structures. Synthesized beams and rms noise sensitivities of 14'' × 5'' and 0.7 mJy beam–1 and 37'' × 14'' and 1.1 mJy beam–1 were obtained for the A- and B-configuration images, respectively. The images were exported to the FITS format and analyzed in AIPS. Sources were selected visually, due to difficulties encountered with automatic source finders in the crowded GC region, and measured using two-dimensional Gaussian fits with the AIPS task JMFIT. This task corrects flux densities for primary beam attenuation using the updated VLA beam pattern parameters. An absolute calibration correction of ∼15% was applied to the A-configuration image after comparing the flux densities of strong sources with their Nord et al. (2004) values.
Table 1. VLA Observations Log
| Date | Target | Duration | rms Noise | Array | ν, Δν, δνa | Beam |
|---|---|---|---|---|---|---|
| (hr) | (mJy beam–1) | Config. | (MHz) | (arcsec) | ||
| 2013 Oct 26 | Sgr A* | 1.3 | B | 320, 64, 1 | 40 × 14 | |
| 2013 Nov 9 | Sgr A* | 1.3 | B | 320, 64, 1 | 36 × 16 | |
| 2013 Nov 23 | Sgr A* | 1.3 | B | 320, 64, 1 | 38 × 12 | |
| 2013 combined | 3.9 | 1.1 | B | 320, 64, 1 | 37 × 14 | |
| 2014 Mar 11 | Sgr A* | 1.1 | A | 320, 64, 0.25 | 14 × 4 | |
| 2014 Apr 27 | Sgr A* | 1.1 | A | 320, 64, 0.25 | 13 × 5 | |
| 2014 combined | 2.2 | 0.7 | A | 320, 64, 0.25 | 14 × 5 | |
| 2016 Dec 31 | C1748–2827 | 0.25 | 0.02 | A | 5500, 2000, 2 | 1.3 × 0.3 |
| 2017 Jan 3 | C1750–2928 | 0.03 | 0.05 | A | 5500, 2000, 2 | 1.1 × 0.4 |
| 2017 Jan 9–19b | C1748–2827 | 0.60 | 0.05 | A | 1500, 2000, 1 | 2.0 × 1.0 |
| 2017 Jan 23 | C1753–2853 | 0.02 | 0.04 | A—>D | 5500, 2000, 4 | 0.7 × 0.3 |
| 2017 Jan 23 | C1742–2722 | 0.03 | 0.05 | A—>D | 5500, 2000, 2 | 0.7 × 0.3 |
| 2017 Jan 23 | C1744–3121 | 0.03 | 0.13 | A—>D | 5500, 2000, 4 | 0.8 × 0.3 |
| 2017 Jan 29 | C1753–2755 | 0.02 | 0.03 | A—>D | 5500, 2000, 4 | 0.9 × 0.3 |
| 2017 Feb 1 | C1745–2732 | 0.67 | 0.01 | A—>D | 5500, 2000, 4 | 0.8 × 0.3 |
Notes.
aCentral frequency, bandwidth, and average channel width of the relatively RFI-free subband. bObservations consisted of 12 3 minute scans that were combined and imaged.Download table as: ASCIITypeset image
Within the field of view (2 5 FWHM) at 320 MHz, we detect ∼375 small-diameter radio sources with geometric mean sizes of ∼10''–20'' on our higher-resolution image. The number of radio sources is increased compared to a previous legacy VLA imaging project, which found 241 small-diameter sources within the same area of sky (Nord et al. 2004). Likewise, Nord et al. (2004) detected four known pulsars, all with flux densities larger than 20 mJy. Among our ∼150 newly detected radio sources, we find radio emission coincident with eight other known pulsars with flux densities ranging from 5 to 25 mJy (Table 2). These 12 pulsars constitute 36% of the 33 listed in the ATNF Pulsar Catalog (PSRCAT7
) within our field of view (Manchester et al. 2005). The remaining 21 known pulsars are undetected due to several possible reasons. Seven have extrapolated flux densities that are below our detection threshold. Several others are presumably also below the threshold; they are only detected at one frequency and therefore cannot be extrapolated. Also, a few are located at the edges of the field of view, where primary beam attenuation is severe. Other possibilities include intrinsic low-frequency spectral turnovers or those due to extrinsic absorption and/or scattering. The latter may explain why we only detect one pulsar out of the six located within 025 of Sgr A*, where a high degree of scattering is expected. Notwithstanding, the detection of 36% of the ATNF listed pulsars bodes well for using our sample to identify new pulsar candidates.
5 FWHM) at 320 MHz, we detect ∼375 small-diameter radio sources with geometric mean sizes of ∼10''–20'' on our higher-resolution image. The number of radio sources is increased compared to a previous legacy VLA imaging project, which found 241 small-diameter sources within the same area of sky (Nord et al. 2004). Likewise, Nord et al. (2004) detected four known pulsars, all with flux densities larger than 20 mJy. Among our ∼150 newly detected radio sources, we find radio emission coincident with eight other known pulsars with flux densities ranging from 5 to 25 mJy (Table 2). These 12 pulsars constitute 36% of the 33 listed in the ATNF Pulsar Catalog (PSRCAT7
) within our field of view (Manchester et al. 2005). The remaining 21 known pulsars are undetected due to several possible reasons. Seven have extrapolated flux densities that are below our detection threshold. Several others are presumably also below the threshold; they are only detected at one frequency and therefore cannot be extrapolated. Also, a few are located at the edges of the field of view, where primary beam attenuation is severe. Other possibilities include intrinsic low-frequency spectral turnovers or those due to extrinsic absorption and/or scattering. The latter may explain why we only detect one pulsar out of the six located within 025 of Sgr A*, where a high degree of scattering is expected. Notwithstanding, the detection of 36% of the ATNF listed pulsars bodes well for using our sample to identify new pulsar candidates.
Table 2. Known Pulsars Previously Undetected at 320 MHz
| Name | 320 MHz Flux Density | Previous Detections | Spectral Indexa |
|---|---|---|---|
| (mJy) | (GHz) | ||
| B1736–29 | 11 | 0.6, 1.4 | −1.2 |
| B1737–27.5 | 13 | 1.4 | −1.7 |
| B1737–30.2 | 17 | 0.4, 0.6, 1.4 | −0.8 |
| B1737–30.8b | 24 | 1.4 | −2.5 |
| B1738–29.7 | 5 | 1.4 | −1.6 |
| J1746–2856 | 12 | 3.0, 6.0 | −1.7 |
| J1748–3009 | 12 | 1.4 | −1.5 |
| J1752–2821 | 5 | 1.4 | −1.8 |
Notes.
aSpectral index determined from fits including detections at frequencies listed in the third column, as cited in the ATNF pulsar catalog (0.4 and 0.6 GHz: Lorimer et al. 1995; 1.4 GHz: Morris et al. 2002, Hobbs et al. 2004, Knispel et al. 2013; 3.0 GHz: Johnston et al. 2006; 6.0 GHz: Dexter et al. 2017). bA 320 MHz detection could be confused with a knot of emission from a nearby supernova remnant (the Tornado).Download table as: ASCIITypeset image
2.2. Initial Pulsar Candidate Selection
For each 320 MHz radio source in Section 2.1 with a signal-to-noise ratio (S/N) of 10 or more, we searched existing all-sky surveys at 1.4 GHz and 843 and 150 MHz (Condon et al. 1998; Bock et al. 1999; Intema et al. 2017) and archival VLA data at other frequencies to produce continuum spectra. From these data, we fit the flux density measurements with a power-law spectral index α of the form Fν ∝ να, typically over a range from 150 MHz to 1.4 GHz, although in some cases, archival flux densities were available up to 6 GHz.
We selected promising pulsar candidates based on compactness and spectral slope criteria. For our compactness cutoff, we follow Frail et al. (2018) and require only that the ratio of the flux density of the low-frequency radio source to its peak intensity not exceed a value of 1.5. While this definition is not as stringent as the point-source definitions typically used by sky surveys (e.g., Intema et al. 2017), it does allow for anomalous values of this ratio that could occur if the pulsars scintillate strongly during the integration time.
Our second selection criterion is based on the spectral index α. The true distribution of pulsar spectral indices has a mean α = −1.4 ± 1 (Bates et al. 2013), but allowing for the biases that affect low-frequency surveys, the measured distributions are closer to α = −1.8 ± 0.2 (Maron et al. 2000; Frail et al. 2016; Kondratiev et al. 2016). In contrast, the weighted mean spectral index of extragalactic radio sources is α = −0.787 (de Gasperin et al. 2018). Thus, pulsar candidates stand out in low-frequency images. This is dramatically illustrated in the meter and centimeter images from Frail et al. (2016), but the effect is better quantified in Figure 1. Here we plot the cumulative spectral index histograms of a sample of 623 known pulsars from PSRCAT and 447,848 radio sources with spectral index values measured from 150 MHz to 1.4 GHz (de Gasperin et al. 2018) and that satisfy the compactness criterion defined above. From Figure 1, we see that while only 1.5% of the sky survey sources have a spectral index α ≤ −1.4, almost 80% of the known pulsars have measured values of α this steep. In a sample of ∼400 sources such as we have here, we would not expect to find any background radio sources in the field with α ≲ −1.8. For our spectral index cutoff criterion, we chose α ≤ −1.4. This value is equal to the true mean spectral index of pulsars (see above), but it is shallower than the cutoff values adopted in earlier image-based studies (e.g., Kaplan et al. 2000; Frail et al. 2016; Maan et al. 2018). While this value will likely increase the number of false positives, this can be mitigated somewhat because the GC is a region with lots of ancillary multiwavelength data that can be used in evaluating sources.

Figure 1. Cumulative spectral index histogram of known pulsars (red) and compact radio sources from the 150 MHz TGSS ADR1 sky survey (blue). While steep-spectrum radio sources α < −1.5 are rare among sky-survey samples, they are typical among the known pulsars. The 623 pulsar spectral index values are taken from the latest version of PSRCAT (Manchester et al. 2005). There are 447,848 radio sources whose spectral index values measured from 150 MHz to 1.4 GHz (de Gasperin et al. 2018) that satisfy our compactness criterion.
Download figure:
Standard image High-resolution imageBased on the above selection criteria, we chose 12 possible pulsar candidates. From a sample of nearly 400 sources, we would expect that the number of steep-spectrum background radio sources would be approximately six (i.e., 1.5%). The number could be as large as 12, given the long tail of the Poisson distribution for small sample sizes. This fraction of 1.5% is highly uncertain for a number of reasons. To begin with, it refers to compact steep-spectrum (presumably extragalactic) radio sources with a lower flux density cutoff at meter wavelengths of approximately 10 mJy (de Gasperin et al. 2018). Only half of all pulsars with measured spectral indices in PSRCAT have 400 MHz flux densities in excess of 10 mJy, so the comparison in Figure 1 is of two source populations with different flux density distributions. It may be that the fraction of steep-spectrum radio sources increases with decreasing flux density, although we note that the trend for the median spectral index is in the opposite direction (de Gasperin et al. 2018). We have also assumed that the GC is a typical direction for radio source counts. More complete deep radio continuum imaging is needed of the GC to better characterize the source population (Nord et al. 2004; Lazio & Cordes 2008). Given these uncertainties, it is possible that most of the 12 candidates are background radio sources and not pulsars. To increase our confidence, we undertake high-resolution imaging next.
2.3. High-resolution Interferometric Imaging
The list of preliminary pulsar candidates in Section 2.2 was generated from VLA images at 320 MHz having synthesized beams of 14'' × 5'' (A configuration) and 37'' × 14'' (B configuration). With this angular resolution, it is still possible that some resolved radio sources passed through our compactness criterion as false positives. The most significant contaminants are a population of steep-spectrum, luminous high-redshift galaxies (HzRGs; Miley & De Breuck 2008). The size distribution of HzRGs has been studied (Pentericci et al. 2000; Saxena et al. 2018) and suggests that an angular resolution of at least 5'' is needed to separate them from pulsars. The best study for our purposes comes from Pentericci et al. (2000), where, in a sample of 29 HzRGs, only 15% were unresolved at arcsecond resolution.
Accordingly, we targeted all of our candidates with the VLA (Program 16B-322) at the C band (4.5–6.5 GHz) in 2017 January in order to verify their compactness and steep spectra. See Table 1. With the array in its A configuration, we obtained high-resolution (∼0 5), high-sensitivity images. In addition, we observed another two dozen high-S/N sources that came close to passing our initial criteria but might have steeper spectra or be more compact at higher frequencies. We utilized the VLA automatic CASA pipeline to edit and calibrate the data with 3C48 and J1751–2524 as the flux and phase calibrators, respectively. Imaging and measuring source flux densities was accomplished in AIPS. The ratio of the integrated to peak flux densities was again used as a measure of the compactness of the candidates.
Many candidates were resolved on the high-frequency images into multiple components with a double- or single-lobed radio galaxy morphology. Others with resolved arcsecond structure, such as HzRGs, and those with extensive extended emission were also culled, since pulsars should be unresolved. Moreover, the high-frequency observations had sufficient bandwidth to allow for spectral index measurements within the band. This increased our confidence in our initial spectral index measurements (obtained from archival data at widely spaced epochs), and it allowed us to consider candidates with low-frequency turnovers due to free–free absorption, for example.
Together with our 320 MHz and other published lower-frequency measurements, we refined the spectra, resulting in a final list of seven pulsar candidates with a compactness ratio less than 1.5 and spectral index steeper than α = −1.4. If all of our original sample of 12 were HzRGs, then we would have expected 1.8 compact HzRGs (Pentericci et al. 2000), while the probability of finding seven is 0.2%. Thus, these seven remain compelling pulsar candidates. The high-frequency observations for these sources are summarized in Table 1. The rms noise sensitivity was typically 0.05 mJy beam−1 but ranged from 0.01 to 0.1 mJy beam−1, due mostly to the range of durations required to detect the different candidates.
Figure 2 shows the locations of the seven candidates superimposed on a continuum GC radio image, and Table 3 lists their properties. One of our candidates, C1748–2827, has such a steep spectrum that its extrapolated flux is well below the detection threshold of our C-band observation. We therefore searched for and detected the source in L-band (1–2 GHz), ∼10 resolution VLA observations of the GC region (Program S9145), also made in 2017 January (M. Kerr 2019, private communication). These observations are described in Table 1.

Figure 2. Candidate pulsar locations on a 320 MHz image of the GC region made from our 2013 JVLA B-configuration observations. The location of our best candidate, C1748–2827, is indicated by the red circle, and its spectrum is shown in Figure 3. A seventh candidate, C1744–3121, is located just south of this image.
Download figure:
Standard image High-resolution imageTable 3. Pulsar Candidates
| Name | R.A. | Decl. | l, b | S320 | Spectral Ind.a |

|
|---|---|---|---|---|---|---|
| (h m s) | (deg arcmin arcsec) | (deg) | (mJy) | (@ 5.5 GHz) | ||
| C1742–2722 | 17:42:09.56 | −27:22:06.4 | 0.94, +1.47 | 68 ± 6 | −1.4 ± 0.1 | 1.0 |
| C1744–3121 | 17:44:06.60 | −31:21:12.5 | 357.77, −0.98 | 56 ± 6 | −1.4 ± 0.2 | 0.9 |
| C1745–2732b | 17:45:37.20 | −27:32:18.1 | 1.19, +0.73 | 38 ± 4 | −1.6 ± 0.0 | 1.1 |
| C1748–2827c | 17:48:07.08 | −28:27:41.8 | 0.69, −0.22 | 27 ± 3 | −2.8 ± 0.1 | 1.2 |
| C1750–2928b | 17:50:38.54 | −29:28:25.1 | 0.11, −1.22 | 56 ± 3 | −1.5 ± 0.1 | 1.4 |
| C1753–2853 | 17:53:13.53 | −28:53:09.8 | 0.90, −1.40 | 99 ± 5 | −1.4 ± 0.1d | 1.0 |
| C1753–2755 | 17:53:48.57 | −27:55:13.8 | 1.80, −1.02 | 133 ± 12 | −1.5 ± 0.2d | 1.5 |
Notes.
aSpectral index determined from fits (e.g., see Figure 3) to 320 MHz and 5 GHz (this work) and published multifrequency flux densities (Condon et al. 1998; Lazio & Cordes 1998, 2008; Mauch et al. 2003; White et al. 2005; Intema et al. 2017). bPossible extended structure or multiple components. cNot detected at 5 GHz (0.09 mJy 5σ upper limit). Spectral index fit and compactness ratio based on detection in 1.5 GHz observations made available by M. Kerr (2019, private communication). dThe spectral index based on two points within the 5 GHz band is much steeper than α = −1.5. Possible turnover in spectrum.Download table as: ASCIITypeset image
For the candidate C1748−2827, a set of Stokes Q, U, and V images were generated to measure its polarization properties. The VLA observations of C1748−2827 on 2017 January 9–19 were designed to provide high-resolution Stokes I images; consequently, a leakage calibration source was not observed. In order to solve for the antenna leakage (i.e., D-terms), we reduced a separate set of archival L-band observations (VLA Project Code 16B-023) made on 2017 January 10 with the same observational parameters. These observations targeted the calibrator J0713+4349, which is unpolarized at these frequencies. We then transfered the leakage calibration solutions from these data to the January 9–19 data and used the flux calibrator of the latter, 3C 286, to solve for the absolute polarization position angle.
2.4. Single-dish Pulsation Searches
The ideal pulsation search is at the lowest observing frequency possible for every line-of-sight distance of interest, since pulsars are brighter at lower frequencies. However, at longer distances (corresponding to higher DMs) into the Galactic plane, and especially toward the GC, a pulsation search's sensitivity transitions from dispersion-limited to scattering-limited and scattering times are smaller at high frequencies (τs ∝ ν−4). In our case, the optimal search sensitivity is provided by a combination of two observing frequencies: 2 GHz for foreground disk MSPs and 6 GHz for MSPs deep toward the GC.
We observed our seven best pulsar candidates and an additional eight marginal ones with the Robert C. Byrd Green Bank Telescope (GBT) using the S-band (2 GHz) and C-band (6 GHz) receivers under project code 18A-306 (Table 4). Our S-band observations used the GUPPI back end with a bandwidth of 800 MHz, 2048 channels, and a sampling time of 81.92 μs. However, the S-band receiver has permanent filters that reduce its effective bandwidth to 610 MHz. The C-band observations used four banks of the VEGAS back end with a bandwidth of 1500 MHz each, overlapped so that the combined bandwidth is 4500 MHz, covered by 12,288 channels. Our first VEGAS observation used a sampling time of 43.69 μs. This resulted in occasional dropped samples that were padded during data processing. In order to minimize the possibility of dropped samples, subsequent VEGAS observations used a sampling time of 87.38 μs.
Table 4. Pulsar Candidates Observed with the GBT
| Source | Date | fc (GHz) | Tobs (minutes) | Δν (MHz) | dt (μs) | Back End | ΔS (μJy) |
|---|---|---|---|---|---|---|---|
| C1742−2722 | 2018 Feb 14 | 2 | 20 | 610 | 81.92 | GUPPI | 18 |
| 2018 Mar 28 | 2 | 20 | 610 | 81.92 | GUPPI | 18 | |
| 2018 Jul 15 | 6 | 30 | 4500 | 87.38 | VEGAS | 3.6 | |
| C1744−3121 | 2018 Feb 14 | 2 | 20 | 610 | 81.92 | GUPPI | 18 |
| 2018 Feb 14 | 2 | 17 | 610 | 81.92 | GUPPI | 20 | |
| 2018 Mar 28 | 2 | 20 | 610 | 81.92 | GUPPI | 18 | |
| 2018 Jul 15 | 6 | 22 | 4500 | 87.38 | VEGAS | 4.2 | |
| C1745−2732 | 2018 Mar 29 | 2 | 20 | 610 | 81.92 | GUPPI | 18 |
| C1748−2827 | 2017 Jul 17 | 2 | 30 | 610 | 81.92 | GUPPI | 15 |
| 2018 Jan 11 | 1.5 | 26a | 800 | 81.92 | GUPPI | 21 | |
| 2018 Feb 14 | 2 | 60a | 610 | 81.92 | GUPPI | 11 | |
| 2018 Aug 28 | 1.5 | 23 | 800 | 81.92 | GUPPI | 22 | |
| C1750−2928 | 2018 Feb 22 | 2 | 20a | 610 | 81.92 | GUPPI | 18 |
| 2018 Mar 29 | 2 | 20 | 610 | 81.92 | GUPPI | 18 | |
| C1753−2755 | 2018 Feb 22 | 2 | 20a | 610 | 81.92 | GUPPI | 18 |
| 2018 Mar 29 | 2 | 20 | 610 | 81.92 | GUPPI | 18 | |
| C1753−2853 | 2018 Feb 22 | 2 | 20a | 610 | 81.92 | GUPPI | 18 |
| 2018 Mar 29 | 2 | 20 | 610 | 81.92 | GUPPI | 18 |
Note.
aObservation was severely contaminated with wideband RFI.Download table as: ASCIITypeset image
The steep spectrum of the source C1748−2827 makes it an especially promising pulsar candidate but also means that any pulsed emission would be too weak to be detected at 6 GHz, even within the maximum ∼7 hr that the GBT can track the GC. Therefore, we observed this source at 1.5 GHz in addition to 2 GHz. For the 1.5 GHz observations, we used the GUPPI back end with a bandwidth of 800 MHz, 4096 channels, and a sampling time of 81.92 μs.
We processed the GBT observations with PRESTO8 (Ransom 2011), using rfifind to remove RFI. One of two 1.5 GHz observations of C1748–2827 and 10 of our 2 GHz observations were severely contaminated with wideband RFI (Table 4 footnote), but we have at least one clean 2 GHz data set for every source. We performed an acceleration search for pulsed signals using accelsearch. A line-of-sight acceleration due to orbital motion in a binary system causes a Doppler shift in the observed pulsar rotation period. An acceleration search covers this additional dimension in the search parameter space for binary pulsars. The 2 GHz data were searched at 7950 trial DMs in the range 0–2687 pc cm−3. The 6 GHz data were searched at 2862 trial DMs in the range 0–2862 pc cm−3. A DM of 2500 pc cm−3 corresponds to a line-of-sight distance of 8.5 kpc in the direction of Sgr A*, according to the Yao et al. (2017) model of Galactic ionized gas. This is the estimated distance to the supermassive black hole at the GC. The excess above that in the trial DM ranges is due to technical dependencies between the number of trial DMs per iteration and the number of computing nodes and threads used by our multithreaded searches.
The number of trial DMs and the spacing between them is optimized with DDplan from PRESTO so that the effective time resolution at the midpoint between trial DMs is 0.1 ms (10% duty cycle of a 1 ms rotation period) when pulse broadening is dispersion-dominated and matches the scattering time when it is >0.1 ms and pulse broadening is scattering-dominated. This optimization takes into account the observing frequency, bandwidth, number of channels, dispersion smearing within a channel width, sampling time, and scattering broadening, which is not correctable and increases as the DM increases. At 6 GHz, the scattering time is negligible across the full range of trial DMs, and the DM spacing is constant at 1 pc cm−3. At 2 GHz, the DM spacing range is 0.2–1.0 pc cm−3, and at 1.5 GHz, it is 0.05–0.3 pc cm−3.
3. Results
From archival data taken for a GC monitoring campaign, we have identified potential pulsar candidates within an approximately 5 deg2 region centered on Sgr A*. A total of 12 candidates were identified initially from a sample of 375 sources at 320 MHz, based on compactness and spectral index criteria. Follow-up observations were conducted at 5 GHz with subarcsecond resolution in order to eliminate false positives (e.g., HzRGs, evolved lobes of radio galaxies, and transients), resulting in seven compelling pulsar candidates (Table 3). Most of the candidates have a spectral index α close to −1.4. Approximately 1%–2% of all compact radio sources have similar spectral index values (de Gasperin et al. 2018). Thus, in a random sample on the sky, we would expect four to eight such sources in the field. These still remain interesting pulsar candidates since the bias-corrected mean spectral index for pulsars also has a mean α = −1.4 ± 1 (Bates et al. 2013).
Our most intriguing candidate is C1748−2827 (Table 3). At Galactic coordinates (ℓ, b) = (069, 022), C1748−2827 lies 43' from Sgr A* and ∼11' from the massive molecular cloud Sgr B2. There is no known X-ray or gamma-ray source at this position, but the SIMBAD database lists two X-ray sources 15'' and 37'' away, as well as the X-ray binary XTE J1748–288 located 53'' to the southwest that was previously detected as a transient at 330 MHz (Hyman et al. 2002). The candidate C1748−2827 is notable for its steep spectrum (Figure 3), detectable from 150 MHz to 2 GHz, but with only an upper limit in the 4–8 GHz band despite our sensitive observations. A power-law fit to these spectral data finds a spectral index α = −2.8 ± 0.1. Thus, C1748−2827 is an excellent pulsar candidate; the fraction of background radio sources with such a steep spectral index is vanishingly small (∼10−6), while 15% of pulsars in PSRCAT have spectral indices α as steep as that of C1748−2827.

Figure 3. Radio spectrum of pulsar candidate C1748−2827. A power-law fit to these data obtains a spectral index α = −2.8 ± 0.1. The data at 150 and 254 MHz and the upper limit at 74 MHz are from observations by Intema et al. (2017), Roy (2013), and Brogan et al. (2003), respectively.
Download figure:
Standard image High-resolution imageNo linear polarization was detected for C1748−2827, with a 5σ upper limit of 0.4 mJy beam−1. The rms noise for the linear polarization image  was about 2× larger than the total intensity Stokes I of 0.05 mJy beam−1 reported in Table 1 as a result of "bootstrapping" the antenna leakage solutions from another data set to perform polarization calibration (Section 2.3). Only eight of the 12 VLA observations (∼23 minutes of the 36 minutes total on-source) could be calibrated successfully. Lenc et al. (2018) discussed several advantages to performing pulsar searches using circular polarization at low frequencies; however, no circular polarization was detected with a 5σ upper limit of 0.3 mJy beam−1.
There is no obvious detection of C1748−2827 on a 74 MHz VLA image of the GC with 2' × 1' resolution (Brogan et al. 2003) and an rms noise level of approximately 100 mJy beam−1, which is not inconsistent with the source being located at the GC. There are a number of reasons that the source may be undetected, including insufficient sensitivity, free–free absorption, scatter broadening, or an intrinsic turnover common to pulsars. We place an upper limit of 1 Jy on its flux density (Figure 3), and we emphasize that our result is marginal and calls out for improved low-frequency observations.
No pulsations were detected in a search with the GBT (Section 2.4). Based on the sensitivity achieved with the GBT and compared to the flux densities measured from the VLA images (viz. Tables 3 and 4), we conclude that the GBT search was sensitive enough to have detected pulsations from C1748−2827 and the other candidates in Table 3 with high significance. Also, a single pulse search yielded no evidence of isolated dispersed pulses above 6σ from any of the candidates. How, then, could a pulsar be missed in our search? There have been several previous unsuccessful pulsation searches toward steep-spectrum radio sources identified in imaging surveys (e.g., Damico et al. 1985; Crawford et al. 2000; Davoust et al. 2011; Maan et al. 2018). A variety of scenarios have been discussed to explain the nondetections (e.g., de Gasperin et al. 2018; Maan et al. 2018). In this special line of sight, however, it seems likely that scattering broadening is the limiting factor in search sensitivity due to the large and turbulent gas densities toward the GC.
With this hypothesis in mind, we explored the effects of scattering and DM as a function of distance and observing frequency toward C1748−2827, which is closest to the GC, and C1742−2722, which is 17 away from the GC and serves as a proxy for the other candidates in Table 3. The temporal smearing τobs for a pulsar is the quadrature sum of several terms—the intrinsic pulse width τint, the sampling time dt, the dispersive smearing within a single-channel bandwidth τDM, and the temporal scattering τscat. The τint is measured from the width of the integrated pulsar pulse profile and is usually expressed as a fraction of the pulse period. The single-channel bandwidth and dt come from the observing setup in Section 2.4 and Table 4, while the values for τDM and τscat must be estimated from a model for the Galactic distribution of ionized gas. We use the Yao et al. (2017, hereafter YMW16) and Cordes & Lazio (2002, hereafter NE2001) models. Multiple components are needed to fully model the electron density, but toward the GC, the thin disk and GC components are the most significant for both NE2001 and YMW16. While both models provide estimates for the gas density along the line of sight, one important difference between NE2001 and YMW16 is that the former provides estimates on τscat along the line of sight based on interstellar scattering measurements used as a constraint in their model. In the case of the GC, NE2001 derived the degree of scattering from measurements of the angular broadening of OH/IR masers and Sgr A*. In their model fitting, YMW16 did not incorporate such measurements, preferring to estimate τscat using an empirical relationship between DM and τscat derived from pulsar observations (Krishnakumar et al. 2015). Another important difference between YMW16 and NE2001 for our purposes concerns the parameters of the GC component. While they derived a similar central density and radial and vertical scale heights for the GC component, the offsets of the center of the distribution differ (Cordes & Lazio 2003). The difference is large enough that the line of sight toward C1748−2827 lies well within the YMW16 GC component, while it passes along the outer edge of the NE2001 GC component. All of the other PSR candidates in Table 3 are sufficiently far away in angular extent that the thin disk dominates over the GC component.
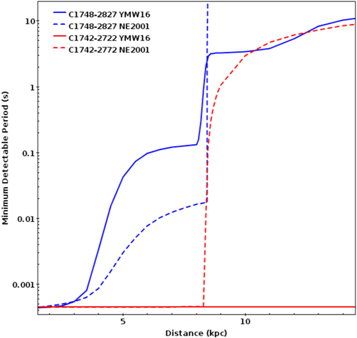
Given an electron density model and the GBT observing parameters from Section 2.4, τobs can be derived as a function of distance in any direction and at any frequency. Since most of the sensitivity to pulsations is lost when the pulsar period is below ∼5 × τobs (e.g., Macquart et al. 2010), we can straightforwardly derive a minimum detectable period Pmin. This is shown in Figure 4 for C1748−2827 and C1742−2722 using both the YMW16 and NE2001 models at an observing frequency of 2 GHz for C1748−2827 and 6 GHz for C1742−2722 and assuming a typical pulsar duty cycle of 5%. For example, for C1748−2827 at d = 8.5 kpc, YMW16 predicted DM = 2230 pc cm−3 and τscat = 0.57 s, while NE2001 predicted DM = 1268 pc cm−3 and τscat = 55 s. The different methodology used in how YMW16 and NE2001 estimated τscat and the small offsets in the sky position for their GC component lead to a large uncertainty with Pmin = 3 and 280 s at d = 8.5 kpc for C1748−2827 using YMW16 and NE2001, respectively. If C1748−2827 were at or near the GC, then our GBT search would have only been sensitive to magnetar periods for the YMW16 model. The minimum period for the NE2001 model rises sharply at this distance to a value that exceeds any known pulsar. Figure 4 shows that if C1748−2827 was along the line of sight, we would have been sensitive to normal pulsars over d < 8 kpc in either model, while for MSPs, the range is approximately d ≤ 4.5 kpc. For C1742−2722 and the other pulsar candidates in Table 3 observed at 6 GHz, we would have been sensitive to any pulsar using the YMW16 model, while only magnetars would be detected further than d = 8.5 kpc using the NE2001 model.
Figure 4. Minimum detectable pulsar period along the line of sight toward the pulsar candidates C1748−2827 at (l, b) = (0.69, −0.22) and C1742−2722 at (l, b) = (0.84,1.47). Two electron density models are shown for each pulsar candidate—the YMW16 model as a solid line (Yao et al. 2017) and the NE2001 model as a dashed line (Cordes & Lazio 2002). An observing frequency of 2 GHz is assumed for C1748−2827 and 6 GHz for C1742−2722. A typical pulsar duty cycle of 5% has been adopted.
Download figure:
Standard image High-resolution image
The detection of pulsations at or near the GC may not be as dire as these models suggest. Bower et al. (2014, 2015) argued, based on the angular and temporal scattering properties of the magnetar PSR J1745−2900, that the bulk of the scattering is occurring along the line of sight (in the Scutum spiral arm) and not at the GC, as posited by NE2001. A more distant scattering screen lowers τscat. The reported τscat values for those pulsars that are thought to lie in the GC (Johnston et al. 2006; Deneva et al. 2009; Bower et al. 2015) lie in the range of 1.3–2.3 s when scaled to 1 GHz. Thus, for pulsation searches at 2 GHz, we might expect Pmin ≃ 0.6 s, or about five times lower that the YMW16 estimate. The strong frequency dependence of scattering, i.e., τscat ∝ ν−4, argues for sensitive high-frequency pulsation searches (Macquart & Kanekar 2015).
The continuum spectrum of C1748−2827 provides some weak constraints on the distance and period. The luminosity of C1748−2827 at 1.4 GHz, if located at d = 8.5 kpc, would be 25 mJy kpc2. This value lies at the high end of the normal pulsar luminosity distribution but not extraordinarily so. The lack of a low-frequency spectral turnover in Figure 2 can also be used to put some estimate on the amount of ionized gas toward C1748−2827. Assuming an electron temperature Te = 5000 K, we find that deviations from the power-law fit occur at 150 MHz at emission measures (EMs) ≳5000 pc cm−3. This is identical to the EM value estimated by Pynzar & Shishov (2014) toward this position; thus, there is no useful distance constraint. Finally, we note that recent discoveries of MSPs have reignited an old debate about a possible inverse correlation between the pulsar period and spectral index (e.g., Bassa et al. 2017), suggesting that C1748−2827 with α = −2.8 could be an MSP. However, from an analysis of the spectral properties of 441 pulsars, this period–α correlation is not strong (Jankowski et al. 2018). Instead, there is good evidence that the value of α is correlated with the period derivative, spin-down luminosity, and magnetic field at the light cylinder radius.
4. Summary and Discussion
We have imaged a 25 radius around Sgr A* at 320 MHz, searching for radio point sources with approximately two times greater sensitivity than previous studies (Nord et al. 2004; Bhakta et al. 2017). After careful vetting, we identify seven compact (θ < 1''), steep-spectrum (α < −1.4) sources as promising pulsar candidates. While some of our candidates could be background extragalactic sources, we argue based on their properties that they are likely pulsars either at the GC or along the line of sight. One of our candidates (C1748−2827) stands out in particular. It lies southeast of the Sgr B2 star-forming region and is 43' from Sgr A*. It has an unusually steep spectral index, α = −2.8.
A single-dish search for pulsations was conducted for all seven candidates (Table 4). For C1748−2827, the search for pulsations was conducted at center frequencies of 1.4 and 2 GHz, while for the other candidates, the search was conducted at 2 and 6 GHz. No pulsations were found from any of the candidates.
We hypothesize that the lack of pulsations for our best candidates is the result of scattering broadening due to the large degree of turbulence for lines of sight toward the GC. We make estimates of the minimum detectable pulsar period Pmin as a function of distance using global models for the Galactic electron density distribution. In the GC region, the NE2001 and YMW16 models differ substantially in their estimates of the electron density and temporal scattering, producing a wide range of model-dependent Pmin values. Other efforts to use the spectral index and lack of a low-frequency turnover to constrain the distance and period of C1748−2827 are not decisive. Our best constraints come from direct measurements of the τscat values for known pulsars at the GC, including the magnetar PSR J1745−2900. They suggest that, if our candidates lie at the GC, we should have been capable of detecting pulsations from magnetars and normal pulsars, but not MSPs.
Demonstrating that C1748−2827 and other steep-spectrum sources are pulsars will be challenging. The detection of a large rotation measure toward C1748−2827, similar in strength to those seen toward Sgr A* and PSR J1745−2900, would convincingly argue for a GC origin. Measuring smaller rotation measure values, such as seen toward other GC pulsars, would provide no useful distance constraints. Using all available data from our VLA observations at 1–2 GHz, we achieve a S/N ∼ 10 in Stokes I, suggesting that it will be difficult to measure large rotation measure values. In order to detect rotation measures comparable to those of Sgr A* and PSR J1745–2900 for such a weak source, methods such as Faraday rotation measure synthesis (Brentjens & de Bruyn 2005) are most practical; however, to be confident in the results, we must first detect linear polarization.
For this reason, we only examined the linear polarization image formed from the Stokes Q and U images using the full 1 GHz bandwidth to determine whether the source is polarized at frequencies of 1–2 GHz. Our inability to detect linearly polarized emission is not inconsistent with our other results. Given the Stokes I detection of S/N ∼ 10 for C1748−2827, if the source is strongly linearly polarized (50%–100%), then the signal would, at best, be a marginal detection at S/N ∼ 2. If we assume that 5σ is an upper limit on the polarization of this source, then we expect that this source is <90% linearly polarized. Since determining the rotation measure of this source would make a strong case for a GC origin, follow-up observations are recommended.
Continuum variance imaging is another promising technique that can identify pulsars by their diffraction interstellar scintillation (Dai et al. 2017). However, in order for the intensity scintillations not to be quenched, the imaging integration time and observing bandwidth must be well matched to the diffractive properties of the medium. Using the nominal parameters of PSR J1745−2900, we estimate that observing bandwidths of sub-Hz to tens of Hz would be required over the frequency range of 0.3–5 GHz. These small values are not feasible for a sensitive detection experiment in existing interferometric back ends.
The foregoing discussion shows the limitation of current image-based searches. Future low-frequency, wide-field imaging surveys of the GC that can achieve sensitivities a factor of 5–10 times better than the images that we used here may be possible. With wide instantaneous bandwidths, it would also be possible to measure "in-band" spectral indices and identify compact steep-spectrum sources from these deep images alone. However, this method must impose a cutoff on the spectral index in order to eliminate contamination from background extragalactic radio sources. The result is that the most promising candidates would have the steepest spectra. For a region like the GC, the push to higher frequencies to overcome the effects of interstellar scattering must be balanced against the rapid drop in S/N for candidates identified using this method. Some of the limitations of this method can be overcome if ancillary data are used at other wavelengths to search for pulsations. For example, we have used the subarcsecond localizations of steep-spectrum radio sources in Fermi error circles to identify MSPs based on their gamma-ray pulsations (Frail et al. 2018). This method, applied to Fermi sources toward the GC, would naturally bypass the temporal broadening that plagues radio-only searches.
The National Radio Astronomy Observatory is a facility of the National Science Foundation operated under cooperative agreement by Associated Universities, Inc. The Green Bank Observatory is a facility of the National Science Foundation operated under cooperative agreement by Associated Universities, Inc. Portions of this work at NRL were funded by NASA. Basic research in radio astronomy at NRL is supported by the Chief of Naval Research (CNR). The authors thank Dr. Joseph Lazio for his very helpful comments and useful discussions. S.D.H. thanks Dr. Huib Intema for assistance with low-band data reduction and Drs. Matthew Kerr and Subhashis Roy for making available 1.5 GHz JVLA observations and a 254 MHz GMRT image of the GC, respectively, for measurements of pulsar candidate C1748–2827. S.D.H. thanks Ms. Isabel Joyner for her assistance measuring pulsar candidate flux densities. This research has made use of the SIMBAD database, operated at CDS, Strasbourg, France. This research has made use of the NASA/IPAC Extragalactic Database (NED), which is operated by the Jet Propulsion Laboratory, California Institute of Technology, under contract with the National Aeronautics and Space Administration.
Facilities: Karl G. Jansky Very Large Array (VLA) - , Robert C. Byrd Green Bank Telescope (GBT) - .
Software: AIPS, CASA, PRESTO.